ACHIEVEMENTS AND CHALLENGES IN THE PROGRESS OF … · per capita reached USD1.596 in 2012, which...
148
MILLENNIUM DEVELOPMENT GOALS FULL REPORT 2013 ACHIEVEMENTS AND CHALLENGES IN THE PROGRESS OF REACHING MILLENNIUM DEVELOPMENT GOALS OF VIETNAM Hanoi, December 17, 2013
Transcript of ACHIEVEMENTS AND CHALLENGES IN THE PROGRESS OF … · per capita reached USD1.596 in 2012, which...

1
MILLENNIUM DEVELOPMENT GOALS FULL REPORT 2013
ACHIEVEMENTS AND CHALLENGES IN THE PROGRESS OF REACHING MILLENNIUM
DEVELOPMENT GOALS OF VIETNAM
Hanoi, December 17, 2013

2

3
LIST OF ABBREVIATIONS
ABR Adolescent birth rate MICS Multiple Indicator Cluster Surveys
ADB Asian Development Bank MIIC Ministry of Information and Communications
APEC Asia-Pacific Economic Cooperation MMR Maternal mortality rate
ASEAN Association of South East Asia Nations MOC Ministry of Construction
ASEM The Asia–Europe Meeting MOH Ministry of Health CPR Contraceptive prevalence rate MOIT Ministry of Industry and Trade Website
EPI Expanded Program on Immunization MONRE Ministry of Natural Resources and
EnvironmentEU European Union MSM Men who have sex with men FDI Foreign direct investment MST Ministry of Science and TechnologyFSW Female sex workers MWID Men who inject drugs FTA Free Trade Agreement NMR Neonatal Mortality Rate GDP Gross Domestic Product NTP National Tuberculosis Program GOV Government of Vietnam ODA Official development assistance
GRID Global Resource Information Database OPEC Organization of the Petroleum
Exporting Countries
HCMC Ho Chi Minh City PMTCT Preventing Mother-to-Child Transmission
HFMD Hand, foot and mouth disease R&D Research and Development
IBBS Integrated Biological and Behavioral Surveillance SAVY Survey on Adolescents and Youth
IDA International Development Association U5MR Under-five Mortality Rate
IEC Information, education and communications UNEP United Nations
IMF International Monetary Fund UNEP United Nations Environment Programme
IDU Injecting drug use VHLSS Vietnam Household Living Standards Survey
IMR Infant Mortality Rate VNFOREST Vietnam Administration of ForestryIRF International Rhino Foundation WB The World Bank
ITU International Telecommunication Union WHO World Health Organization
MARD Ministry of Agriculture and Rural Development WTO The World Trade Organization
MARPs Most At Risk Populations WWF World Wildlife FundMDG Millennium Development Goals GSO General Statistics OfficeVDG Vietnam Development Goals CPV Communist Party of VietnamMPI Ministry of Planning and Investment ARV Antiretroviral CHS Commune Health Station VHW Village health workers
MoCST Ministry of Culture, Sport and Tourism

4
TABLE OF CONTENTS
LIST OF ABBREVIATIONS ............................................................... 3Table of Contents ................................................................................... 4LIST OF TABLES ................................................................................. 5LIST OF FIGURES .............................................................................. 6EXECUTIVE SUMMARY ................................................................... 7PART 1: COUNTRY DEVELOPMENT CONTEXT ........................ 16
Economic development ................................................................... 16Macroeconomic environment ............................................................ 16Poverty reduction .............................................................................. 17Influence of the economic slowdown on development agenda and MDGs ................................................................................................ 18Inequality in socio-economic development between geographic regions and ethnic groups ............................................................... 23Inequality between rural-urban areas and between different regions .....23Slow progress for ethnic minorities ................................................... 26Climate Change ............................................................................... 27Challenges ......................................................................................... 27Vietnam in response to climate change challenges ........................... 30
PART 2: PROGRESS of MDGs ........................................................... 31MDG 1: Eradicate extreme poverty and hunger ............................... 31MDG 2: Achieve universal primary education ................................. 42MDG 3: Promote gender equality and empower women .................. 49MDG 4: Reduce child mortality rate ................................................. 57MDG 5: Improve maternal health ..................................................... 64MDG 6: Combat HIV/AIDS, malaria and other diseases ................. 71MDG 7: Ensure environmental sustainability ................................... 80MDG 8: Develop a global partnership for development ................... 95
PART 3: DEVELOPMENT PRIORITIES IN THE POST-MDG PERIOD ................................................................................................. 109CONCLUSION ...................................................................................... 113ANNEX 1 ............................................................................................... 117ANNEX 2 ............................................................................................... 121

5
LIST OF TABLES
Table 1: Macroeconomic indicators ........................................................ 16Table 2: Household income and poverty rate by regions ........................ 19Table 3: Average working hours per week by economic sector (hours/week) ....20Table 4: Average revenue in 2008 and 2011 by economic sector ........... 22Table 5: Socio-economic indicators between rural and urban areas ....... 24Table 6: Poverty rate by geographic region ............................................ 25Table 7: Socio-economic indicators by geographic region ..................... 26Table 8: Socio-economic indicators by ethnicity (%) ............................. 27Table 9: The impact of climate change in Vietnam in 2010 by
percentage of GDP ..................................................................... 28Table 10: The impact of climate change in Vietnam ............................... 29Table 11: Projections of the impact of climate change in Vietnam in 2030...29Table 1. 1: Poverty rate using the Government poverty line for 2006–2010 (%) ...32Table 1. 2: Poverty gap (%)..................................................................... 33Table 1. 3: Expenditure per person per annum (‘000 VND) ................... 34Table 1. 4: Possession of durable goods per 100 households ................. 35Table 1. 5: Rate of working labour aged 15 and older out of the total
population aged 15 and older (%), 2008-2012 ....................... 38Table 1. 6: Unemployment rate (%), 2009-2012 ..................................... 38Table 1. 7: GINI Index (by expenditure) ................................................. 40Table 2. 1: Net enrolment rate by educational level (%) ......................... 43Table 2. 2: Literacy rates for population aged 10 and older (%) ............. 43Table 2. 3: Primary completion rates (%) ............................................... 43Table 2. 4: Completion rates for lower secondary education (%) ........... 44Table 2. 5: Number of schools at each educational level ........................ 44Table 2. 6: Teacher and classroom availability by educational level ...... 45Table 2. 7: Percentage of teachers with standard qualifications and above (%) ..46Table 2. 8: National expenditure for education and training (billion VND) ..46Table 3. 1: Net enrolment rates by education level and gender .............. 50Table 3. 2: Percentage of female students by education level ................. 51Table 3. 3: School attendance rates for ethnic minorities aged 6–14 (%) .. 51Table 3. 4: Percentage of female teaching staff by education level ........ 52Table 3. 5: Average expenditure on education and training per student per
household (‘000 VND) ........................................................... 52Table 3. 6: Percentage of labour aged 15 and older by type of employment (%) ....53Table 3. 7: Average working hours by type of employment ................... 53Table 3. 8: Employment situation in the fourth quarter of 2013
(‘000 people) .......................................................................... 54Table 4. 1: Infant mortality rate (%), 2001-2011 .................................... 58Table 6. 1: Notified TB cases and rates in Vietnam, 2000-2010 ............. 77Table 7. 1: The number of species threatened with extinction ................ 93Table 7. 2: Changes in forest area by cause (ha), 2007-2012 ................. 93Table 8. 1: Average drug spending per person in Vietnam (USD),
2001-2012 ............................................................................... 108

6
LIST OF FIGURES
Figure 1. 1: Number of households and individuals who suffer from hunger .......... 36Figure 1. 2: Malnutrition prevalence among children under five years
of age, 1999-2011 (%) .......................................................... 37Figure 1. 3: Employment structure in rural and urban areas (%), 2002-2010 .......... 39Figure 3. 1: Percentage of women in the National Assembly (%) ............................ 55Figure 4. 1: Infant mortality rate (%)......................................................................... 58Figure 4. 2: Under-five mortality rate (%) ................................................................. 58Figure 4. 3: U5MR by regions in 2011 (%) ............................................................... 61Figure 4. 4: IMR and U5MR by ethnicity, 2006-2011 .............................................. 62Figure 5. 1: Maternal Mortality Rate (per 100,000 live births) ................................ 64Figure 5. 2: Proportion of births attended by trained health personnel,
2000-2011 ............................................................................ 66Figure 5. 3: Contraceptive methods among women aged 15-49 .............................. 67Figure 5. 4: Adolescent birth rate by region (per 1,000), 2010-2011 ....................... 69Figure 6. 1: HIV prevalence by gender, 2000-2012 .................................................. 72Figure 6. 2: Vietnam HIV epidemic map, 2011 ........................................................ 73Figure 6. 3: Condom use during last high-risk sex among the
most-at-risk populations (%) ............................................... 74Figure 6. 4: Number of people living with HIV with access to ARV
treatment, 2004-2012 .................................................................... 75Figure 6. 5: Malaria infection distribution, 2000 and 2011 ...................................... 76Figure 7. 1: Proportion of land area covered by forest in Vietnam (%), 2002-2012 ... 84Figure 7. 2: The area of natural forest and planted forest in Vietnam, 2002-2012 ... 85Figure 7. 3: CO2 emissions, total, per capita and per USD1 GDP
(PPP), 2000-2010 ........................................................... 85Figure 7. 4: Consumption of ozone-depleting substances in Vietnam, 1994-2011 .. 86Figure 7. 5: Proportion of terrestrial and marine area protected (%), 1990-2012 .... 87Figure 7. 6: Proportion of population using an improved drinking
water source, 2000-2011 ...................................................... 88Figure 7. 7: Proportion of population using an improved sanitation
facility, 2000-2011 ............................................................... 89Figure 7. 8: Proportion of urban population living in slums, 1990-2009 ................. 91Figure 7. 9: Changes in forest area by cause, 2005-2012 ......................................... 94Figure 8. 1: The ratio of imports and exports to GDP, 1995-2011 ........................... 99Figure 8. 2: Imports-exports of Vietnam, 2005-2011 ................................................ 100Figure 8. 3: Proportion of total bilateral, sector-allocable ODA to basic social
services, 2010-2012 .............................................................................. 101Figure 8. 4: Debt service of exports of goods and services and net
income (%), 1996-2011 ........................................................................ 102Figure 8. 5: The number of exported workers, by quantity and gender, 2009-2012 ... 103Figure 8.6: The number of internet users, mobile cellular subscriptions and fixed-
telephone line subscriptions per 100 inhabitants, 2009-2012 ............... 105

7
EXECUTIVE SUMMARY
Vietnam has embarked on the final stage of implementing the Millennium Development Goals. The period 2010-2013 has significant meaning in the socio-economic development of Vietnam, marking the completion of the Socio-economic Development Strategy 2001-2010 and transition to the period 2011-2020. Vietnam is currently facing a number of challenges. The economic slowdown in Vietnam and macroeconomic instability has reduced decent work opportunities and lowered average income. Moreover, Vietnam is also encountering increasing problems including climate change, inequality in living standards, poverty among ethnic minorities, urban poverty and migration, the quality of education and training unable to catch up with demand from the growing economy, and a weak and uncompetitive private sector in the context of rigorous economic integration. These challenges can slow down the progress of MDGs.
In the context of socio-economic challenges, the Government of Vietnam (GOV) has provided timely measures to stabilize the economy, maintain a reasonable growth rate, and prioritize poverty reduction, as well as support activities in social, economic and environmental fields. These efforts have brought about positive results. Firstly, Vietnam has gradually stabilized its macro-economy, and controlled inflation. Exports display strong growth and agriculture continues to play an important role in economic growth. GDP per capita reached USD1.596 in 2012, which was four times higher than GDP per capita in 2000. Secondly, poverty reduction efforts have obtained positive outcomes. The national poverty rate fell from 14.2 percent in 2010 to 9.6 percent in 2012.1 The poverty rate in the economically disadvantaged regions such as 62 poor communes in Program 30a (a program for supporting the 62 poorest districts nationwide) fell from 58.3 percent in 2010 to 43.9 percent in 2012. Thirdly, Vietnam has built up the National Strategy for Gender Equality 2011-2020. This establishment marks groundbreaking change in the national approach towards gender equality in Vietnam. Vietnam has a relatively high Gender Equality Index as compared to nations with similar growth. Fourthly, Vietnam has succeeded in implementation of environmental protection policies, while building a comprehensive policy and legislative framework to tackle climate change.
Vietnam has mostly completed three MDGs: MDG 1 to eradicate extreme poverty and hunger, MDG 2 to achieve universal primary education, MDG 3 to promote gender equality and empower women. In the period 2010-2013, Vietnam has continued to maintain and improve these achievements. Vietnam has made significant progress in the remaining MDGs. MDG 4 and MDG 5 are close to completion. Three other MDGs, including MDG 6 to combat HIV/AIDS, malaria and other diseases2, MDG 7 to ensure environmental sustainability, and MDG 8 to develop a global partnership for development, have obtained positive progress.
1 Poverty rate is calculated based on the Government’s poverty line for the period 2011-20152 Vietnam has succeeded in controlling malaria and tuberculosis

8
MDG 1: Eradicate extreme poverty and hunger
Vietnam is one of the success stories in the campaign to reduce poverty, and its success in poverty reduction has been highly praised by the international community. During the period 2010-2013, Vietnam has continued its poverty reduction efforts, experiencing a big drop in the poverty rate from 14.2 percent in 2010 to 9.6 percent in 2012. Living standards have been constantly improved; ownership of durable goods has increased. For the period 2004-2010, the percentage of households in permanent housing doubled. The hunger rate has dropped dramatically in the past few years. One million people escaped from hunger during the period 2009-2012. Vietnam had completed the target “to reduce malnutrition rate of children aged below 5” by 2010. The unemployment rate was kept below 2 percent in 2012.
The rate of poverty reduction varies across different ethnic groups and geographical regions. Ethnic minority households account for 50 percent of the total poor households throughout the country. In addition, rapid urbanization and migration has exaggerated the urban poverty situation. Multi-dimensional poverty for children has become a rising concern. Multi-dimensional poverty provides a more comprehensive measurement of living conditions and deprivation levels of children than income poverty measurement.
MDG 2: Achieve universal primary education
Vietnam has achieved universal primary education (by the national standard) and is moving towards universal lower secondary education. Net enrolment rates in primary education increase annually, and stood at 97.7 percent in 2012. The quality of education has been consistently improved. The number of schools and number of teachers per class increased at every educational level. In the period 2007-2012, the percentage of qualified teachers improved significantly, reaching 99.6 percent in primary and lower secondary education, and 99.2 percent in upper secondary education. Education has received increasing attention from the government, family and society.
Vietnam still needs to further improve its education quality to meet the demands of a growing economy. The speed of improvement in the educational sector has lagged behind national economic growth and a fast-changing society. Inequality in education access and education quality persists among different ethnic groups and disparate geographical regions. Education reform in teaching and learning qualities, and improvement in school facilities are strongly needed.
MDG 3: Promote gender equality and empower women
In the past few years, Vietnam has continued to strengthen its achievement in gender equality. Gender inequality in access to primary education has been fundamentally eliminated; gender equality in employment has made major progress. In 2012, female labour accounted for 48.7 percent of the national labour force; women also took up 48 percent of the newly created jobs. With respect to leadership and management roles, the percentage of women in

9
government agencies is maintained at a relatively high level despite a recent slight decline in the rate of women representatives. Vietnam has one of the highest rates of women in national parliament in Asia.
Vietnam has demonstrated strong commitment in promoting gender equality and women’s empowerment. The GOV has approved the National Strategy and National Program on Gender Equality for the period 2011-2020, following on from the introduction of the Gender Equality Law in 2006, in order to raise national awareness on the importance of gender equality and to promote the role of women in social, economic and political arenas.
There still exists inequality in advanced educational levels, and inequality in access to decent work. Domestic violence has become a critical problem. In 2012, 85.1 percent of domestic violence victims were women. The boy-girl birth ratio increased from 111.2/100 in 2010 to 112.3/100 in 2012. This phenomenon reflects the fact that gender-bias perception still exists in both families and the community.
MDG 4: Reduce child mortality rate
Vietnam has been close to MDG targets on child healthcare. In 2012, the under-one mortality rate was estimated at 15 percent, which is just 0.2 percent above the 2015 target of 14.8 percent. If the current rate of progress continues, Vietnam can accomplish this target. The mortality rate among children under 5 reduced to 23.2 percent in 2012, making Vietnam one of the countries with the lowest rates in child mortality in the ASEAN region.
There, however, remains disparity in access to healthcare services among different ethnicities and regions. In 2011, the under-five mortality rate of the ethnic minorities was three times higher than that of the children in the ethnic majority group. This rate in the Central Highlands was also three times higher than the South East. The under-one mortality rate in rural areas was 1.6 times higher than that in urban areas. The implementation of health insurance policies for under-six children have encountered difficulties. Problems with the quality of child healthcare services, such as vaccinations resulting in child deaths, has triggered increasing concerns for parents and gradually undermined public faith in the medical system.
MDG 5: Improve maternal health
Most indicators on maternal healthcare have been close to meeting the MDG set for 2015, which is to reduce by three quarters, between 1990 and 2015, the maternal mortality ratio. Maternal mortality has decreased by more than 70 percent points between 1990-2012 to 64/100,000 live births in 2012. By 2011, the proportion of pregnant women receiving three antenatal care appointments during their pregnancy reached 86.5 percent, just below the target of 87 percent in 2015. The rate of births attended by skilled health workers has also risen by 10.7 percent during the past decade to 96.7 percent in 2011, which is only 1.3 percent below the target in 2015. The prevalence of contraception use among women has also been on the rise with an average annual rate of 0.9 percent during 2001-2011.

10
However, progress has slowed after reaching impressive levels. Indicators such as the contraception use rate and adolescent birth rate are still significantly below the targets. To achieve the targets on maternal healthcare in 2015, it is essential that Vietnam accelerate the implementation of more rigorous programmes on improving maternal and reproductive health, especially those targeting remote and economically disadvantaged areas.
MDG 6: Combat HIV/AIDS, malaria and other diseases
In 2011, Vietnam has achieved the MDG target of controlling malaria and tuberculosis. Good progress has also been witnessed in preventing and combating HIV/AIDS. In 2012, the number of newly identified HIV-infected cases reduced by 22 percent compared to 2011, and by 31.5 percent compared to 2001. The HIV prevalence rate is stable at 0.3 percent of the whole population. The proportion of HIV patients receiving ARV drugs in 2011 is 22 times higher than 2005 and 1.5 times higher than 2009. The rate of pregnant women who test positive with HIV receiving treatment to prevent mother-to-child transmission has also gone up by 20 times during 2003-2011.
There are still many challenges confronting the country’s progress in controlling HIV/AIDS, especially in remote and economically disadvantaged areas. The rate of sexually transmitted HIV has been rising and reached 45.3 percent in the first six months of 2013.3 Access to interventions for HIV patients remains limited. The number of HIV treatment centres qualified under the Ministry of Health’s standards is below 50 percent. In recent years, Vietnam has encountered huge challenges in controlling dangerous diseases such as malaria, H5N1 and H1N1. The mortality rate of influenza has been relatively high at 60 percent. Financial resources still pose big challenges for the Government in maintaining its achievements and controlling HIV/AIDS, as well as other diseases, in upcoming years.
MDG 7: Ensure environmental sustainability
During the period 2010-2013, Vietnam has made considerable progress in the area of environment, comprehensively integrating principles of sustainable development into national policies and programmes. The strong commitment of the GOV towards sustainable environment has been demonstrated in such policies as the National Green Growth Strategy for 2011-2020 and the National Strategy on Climate Change. Monitoring indicators of natural resources, environment, and biodiversity have remained stable. By 2011, the proportion of land area covered by forest has reached 39.7 percent. In 2012, the protected terrestrial and marine area increased by 4.7 percent compared to 2010, reaching 24,605.82 km2. During the period 2011-2013, Vietnam had two Biosphere Reserves, two Ramsar sites and one ASEAN Heritage Park recognized by international environmental organizations. Basic living requirements such as clean water, sanitary latrines and permanent houses have been significantly improved. By 2010, 80 percent of the rural population had access to clean water and 77 percent had sanitary latrines. The proportion of temporary houses decreased by 5.6 percent in 2010.4
3 Preliminary Report on Controlling and Prevention of HIV/AIDS in the first 6 months of 2013 - MOH4 MARD (2011) National Target Program on Rural Water Supply and Sanitation for 2011-2015 Draft

11
Due to the complexity environmental issues, Vietnam has to go a long way to reach 2015 targets. A number of environmental problems have become more serious under the pressure of economic development and climate change, such as the increase in the number of environmental violations, the rise of exploited forest areas and the depletion of natural resources. On the other hand, the environmental legal system has not fully met the requirements of the fast changing socio-economic issues. Government investment in the environment is still small in comparison with the required capital.
MDG 8: Develop a global partnership for development
The reputation of Vietnam as a development partner has improved in the international community. In recent years, Vietnam has had an increasingly strong influence in the region by strengthening its relationship with neighbouring countries. By 2013, Vietnam had established strategic partnership relationships with 12 countries, of which there are three ASEAN countries. Vietnam has entered a number of Free Trade Agreements to promote economic integration. Consequently, international trade with Vietnam has increased substantially. By 2011, total import-export turnover was equivalent to 185.8 percent of the GDP. Public debt has been maintained within sustainable limits. Since Vietnam became a low-middle-income country in 2010, the amount of ODA it has received has been declining. The amount of Official Development Assistance (ODA) received in 2013 decreased by 11.2 percent compared to that of 2012. Disbursed foreign direct investment (FDI) capital stays stable while registered FDI capital continues to fall. Registered FDI capital in 2013 dropped by 11 percent compared to that of 2012, which is equivalent to USD1.6 billion. International labour cooperation, the measurement of the number of labourers working abroad has showed signs of recovery after a dip in 2012 and contributed on average USD2 billion per annum, creating an important and stable source of foreign exchange. The domestic drug market has been more tightly regulated, however, the prices of drugs are still high, making it difficult for everyone to access drugs at affordable prices. Communications and information technology continue to show strong growth. In 2012, Vietnam was on the list of the 10 most dynamic countries in the world in developing information technology by the International Telecommunication Union5.
To take advantage of global partnerships for development, Vietnam needs to manage foreign investment more effectively and manage public debt more strictly. As Vietnam has become a lower-middle-income country, the government needs to carry out more rigorous reforms in institutions and infrastructure in order to attract more aid and foreign investment. The areas of medicine and technology require stronger cooperation with and investment from foreign companies to make significant advances in terms of price and new technology.
Progress made in the MDGs has been due to a combination of many factors. The GOV has demonstrated strong commitment towards the realization of MDGs, shown by its proactiveness in integrating MDG content into national development programmes and policies. Huge efforts made by local and central organizations and agencies, as well as support from the community, have contributed significantly towards achieved results. Tremendous financial and technical support from international development partners and many other agencies play an essential role towards the success of Vietnam. 5 International Telecommunication Union (2012) Measuring the Information Society 2012, p.23

12

13
INTRODUCTION
After a decade implementing the Socio-Economic Development Plan (SEDP) for the period 2001-2010, Comprehensive Poverty Reduction and Growth Strategy (CPRGS) and Millennium Development Goals (MDGs), Vietnam has successfully achieved its goals, and has been praised for this by the international community. Vietnam’s economy has obtained high growth rates with rising living standards, and strong economic integration. The GDP growth rate reached 7.9 percent annually during the period 2000-2008. Within the period 2008-2012, under the impact of the global financial crisis, GDP growth rate slowed down but remained stable at 5.89 percent in 2011 and 5.03 percent in 2012. Total GDP increased steadily within the period 2008-2012 and reached USD141.7 billion in 2012. GDP per capita in 2012 was USD1.5966, increasing nearly fourfold as compared with 2000. Vietnam has successfully transformed itself from one of the poorest countries in the world into a lower-middle-income country.
Vietnam’s commitment and efforts in promoting economic development, social development and poverty reduction have brought about impressive results. The poverty rate dropped from 18.1 percent in 2004 to 10.7 percent in 2010 in accordance to the Government’s poverty line for the period 2006-2010. Using the new poverty line for the period 2011-2015, the poverty rate also decreased considerably from 14.2 percent in 2010 to 9.6 percent in 2012. Social security has been paid special attention to protect the citizens’ welfare. Living standards of the poor have been improved significantly. Positive changes have been brought to rural and mountainous areas. The quality of healthcare at health facilities and preventive medical care, epidemic diseases control has been markedly improved. Education also experienced considerable progress. Many newly built and renovated schools, together with policies regarding education fee exemption and infrastructure investment, have helped enhance the quality of teaching and learning. Vietnam’s Human Development Index (HDI) has increased from 0.46 in 1990 to 0.53 in 2000 and reached 0.59 in 2011.
Vietnam has completed a number of targets in MDGs such as MDG 1 eradicate extreme poverty and hunger, MDG 2 achieve universal primary education, MDG 3 promote gender equality in education and health-related indicators such as reducing child mortality and maternal mortality ratio. In 2011, Vietnam achieved its target on malaria and tuberculosis control. Vietnam is determined to achieve targets in universal access to reproductive health services, improving maternal health and combating HIV/AIDS combat by 2015. Much effort is required to complete MDG 7 in ensuring environmental sustainability and MDG 8 in achieving global partnerships for development.
From 2011 till 2013, Vietnam has been experiencing an economic slowdown and macroeconomic problems such as high inflation, bad debt from commercial banks and the inefficient operation of state-owned companies. Even though the economy has stabilized recently, Vietnam still encounters 6 World Bank

14
many difficulties due to a lower growth rate and bad debt problem. The poverty reduction rate has slowed down and poverty incidence in remote and mountainous areas remains high. Inequality in income and socio-economic development between different geographic and ethnic groups is still significant. The impact of climate change on the community illustrated through escalating frequency of extreme weather events, as well as rising sea levels, has had an increasing effect on the livelihoods of the poor. These problems pose huge challenges for Vietnam in its efforts to boost economic growth, ensure sustainable social development and achieve the MDGs.
Vietnam’s commitment and policy priorities in monitoring and implementing MDGs
Vietnam has demonstrated strong commitment in monitoring, reporting and implementing MDGs. Vietnam has flexibly incorporated MDGs into Socio-Economic Development Plan for the period 2011-2020 and 2011-2015. In particular, Vietnam has inherited the content and results of MDGs to build the five-year development plan for 2011-2015. The Government has concentrated on challenging goals, constructed national indicators based on three development pillars of economy, socio-culture and environment. Those development goals have been stated and institutionalized into the Government’s action plan for the period 2011-2016, development strategies and 16 national targeted programmes for 2011-2015 in multiple areas such as sustainable poverty reduction, clean water and rural sanitation, economical and effective energy use, response to climate change and combatting HIV/AIDS.
Vietnam has received important financial support and technical assistance from international development agencies in the process of developing national framework for MDGs. Over recent decades, many resources have been invested in poverty reduction programmes and many projects supporting socio-economic development in healthcare, education, labour and employment, together with other aspects for the poor, the vulnerable groups and disadvantaged areas. These programmes and policies have contributed significantly to the national socio-economic development process and accelerated Vietnam’s progress towards achieving MDGs.
The monitoring of MDG progress requires a comprehensive and consistent reporting mechanism. More than one-third of MDGs and VDG indicators are not stored in a database because data for many indicators measuring the progress of MDGs/VDG is not collected periodically and not officially integrated into the national data collection system. To overcome those obstacles, in 2011, the Government of Vietnam had approved the Strategy for Statistics Development in Vietnam for the period 2011-2020 and vision till 2030. The Strategy has set out a specific action plan to build up a complete national database system including a database for MDG/VDG to assist the planning, monitoring and evaluation activities for implementation of the national Socio-Economic Development Plan.

15
Report structureThis report measures the progress of Vietnam moving towards achieving
the MDGs. As the consequence of the Vietnam Full Country Report 2010, the report describes the achievements as well as identifies challenges faced by the country in the coming years. National development priorities upon completion of MDG 2015 are discussed in this report.
This report includes three main parts. Part I presents the socio-economic development context of Vietnam including its achievements and the challenges that the country has been facing in recent years. Part II analyzes Vietnam’s progress in moving toward eight MDGs until 2013. This part reviews success achieved so far and identifies the challenges to the completion of the MDGs. Part III introduces the development plan of Vietnam at “Post MDG” period in important areas such as poverty reduction, gender equality, healthcare, education and environment. The report uses statistics and information collected from relevant government agencies and UN agencies in order to provide valuable and reliable insights about the progress of Vietnam in realizing the MDGs.

16
PART 1: COUNTRY DEVELOPMENT CONTEXT
During the period 2010-2013, Vietnam continued to mobilize domestic resources and foster international cooperation to speed up the progress of achieving the MDGs. However, complex changes in the domestic socio-economic environment, combined with complicated movements of the world economy and the global environmental changes, have posed serious challenges for the implementation of development programs. Therefore, a comprehensive overview of the development background of the country is crucial to the improvement of current program implementation, as well as to the orientation and formulation of future programs. This section presents the current development context via the analysis of key themes: economic development, inequality in socio-economic development and climate change.
Economic development
Macroeconomic environmentOver the past two decades, Vietnam’s economy has experienced rapid
and relatively stable growth. The scale of the economy has expanded and productivity in almost every sector has improved. GDP increased consistently during the period 2000-2008, at an average growth of 7.9 percent per annum. Despite having been affected by the global economic crisis since 2008, Vietnam’s economy maintained GDP growth at 6.31 percent in 2008, 5.89 percent in 2011 and 5.03 percent in 2012. Average GDP per capita increased by 150% during 2008-2012, from USD1.070 in 2008 to USD1.596 in 2012, which is four times higher than the 2000 figure.
Table 1: Macroeconomic indicators
2008 2009 2010 2011 2012Real GDP (percent change) 6.31 5.32 6.78 5.89 5.03GDP (in billions of USD) 91.1 97.2 106.4 123.7 141.7Per capita GDP (in USD) 1.070 1.130 1.224 1.408 1.596CPI 19.9 6.5 11.8 18.1 6.8
Source: The World Bank and GSOVietnam has faced huge economic challenges in recent years. The impact
of the global economic crisis, compounded by internal economic problems has driven down consumption, increased inventories, undermined purchasing power, and caused significant increase in bad debts from enterprises. The problems in the real estate industry have not been solved. Bad debts from commercial banks and ineffective operation of a number of state-owned enterprises have posed major obstacles to the economic development process. Many enterprises were forced to cut back on production, cease operation or go out of business.
The Government has proposed appropriate and timely measures, such as tightening monetary policies to control inflation, stabilize the macro-economy, and maintain growth at a reasonable level, while trying to

17
restructure the economy over the past two years. The GOV has issued a number of resolutions to manage the economy, such as Resolution 11/2011/NQ-CP, Resolution 13/2012/NQ-CP on solving problems in the production business and supporting the market. At the beginning of 2013, Resolution 02/NQ-CP was issued to fix the problems of inventories, assist enterprises, promote production business and repair bad debts.
Vietnam has currently regained macroeconomic stability, successfully controlled inflation and contained volatility in the financial sector. Inflation has declined substantially: CPI in 2012 had fallen to the lowest level in three years, standing at 6.8 percent, meeting the target (below 10 percent) set out by the National Assembly. The CPI in 2012 met the national target of “standing below 10 percent.” The exchange rate has been stabilized and the financial market has been reinforced after the State Bank of Vietnam provided liquidity and facilitated the merger of small banks. Interest rates have decreased and credit balance has resumed its growth. Operation of credit institutions and liquidity have improved.
The country’s export sector shows strong performance. Export value increased by 18.2 percent in 2012, surpassing the national target of 13 percent. Exports in the first eight months of 2013 increased by 14.7 percent from the previous year. The import of primary resources and materials, and machines for investment and production have increased. Foreign direct investment inflow remains strong, with total investment reaching USD12.63 billion, a 19.5 percent increase from 2012. The continual growth of agriculture, especially in rice and fisheries, reinforces its significant role in national economic growth. Nevertheless, in 2013, agricultural growth has been slowing down, partly due to the declining price of exported goods.
The growth rate for 2013 is projected to be 5.4 percent. This figure indicates a positive signal as the economy is starting to recover after the economic slowdown. Nevertheless, the economy will continue to face multiple challenges in the coming years, particularly in the financial sector and state-owned enterprise sector. It is important to strengthen and build a more effective monetary policy system, as well as to restructure state enterprises to maintain the competitive advantage and stability of Vietnam’s economy.
Poverty reductionIn the context of many abundant social and economic challenges,
including the global economic crisis and national economic slowdown, poverty reduction efforts still garnered notable progress. Job and employment policies as well as strong support from the Government and development partners have contributed significantly to poverty reduction progress. Poverty reduction policies have been constantly improved, applying a more systematic approach to ensure their accessibility and effectiveness towards targeted poor households, including ethnic minorities. In the context of multiple socio-economic challenges, allocation of resources for poverty reduction and social protection policies is always put among key priorities of the Government. 70,868 billion VND was allocated for poverty reduction for 2011 and 2012.7 A comprehensive policy coverage has been provided 7 Report on Implementation result of National Target Program on Sustainable Poverty Reduction 2011-2012, MOLISA

18
for the poor and disadvantaged in every important aspect of living: health, education, nutrition, housing, legal services, culture and information, as well as vocational training support, and job creation for the disadvantaged as well as investment in public infrastructure.
According to the new Government poverty line for 2011-2015, the poverty rate dropped from 14.2 percent in 2010 to 11.8 percent in 2011 and 9.6 percent in 2012. This trend indicates a 2.3 percent reduction in poverty rate per annum, surpassing the Government’s target of 2 percent per annum. In the period 2010-2012, some hardship areas, such as the 62 districts of Program 30a, have had good success in poverty reduction. The poverty rate in especially economically disadvantaged areas has plummeted from 58.3 percent in 2010 to 51.0 percent in 2011 and 43.9 percent in 2012, marking an average of 7 percent reduction in the poverty rate per annum8 during the period 2010-2012. These remote areas still experience high poverty rates, but high rates of poverty reduction prove high levels of effectiveness in poverty alleviation.
The most recent period bears witness to the completion of Program 135 Phase II (P135-II)--the largest and the most important poverty reduction program. The Program has been successful in its poverty reduction efforts and in its endeavours to raise the living standards of the poor. Upon completion of P135-II, the poverty rates in targeted areas declined; household income also increased by approximately 20 percent over the period 2007–2012. The living standards of targeted households have been improved by increased ownership of durable assets. Productivity for major staples and industrial crops also increased over the same period.
Influence of the economic slowdown on development agenda and MDGsDuring 2008-2012, the world faced four major challenges, including the
global financial crisis, fluctuating food and fuel prices on a global scale and the Eurozone sovereign debt crisis. The world economy fell into the deepest recession since the Great Depression in 1929. The global economic crisis has had negative impacts on Vietnam’s growth rate, decreased available resources for poverty reduction and social development policies, and posed a threat to the sustainability of MDGs implementation results. The GDP growth rate during 2009-2012 was about 5.76 percent, which is considerably lower than the growth rate of the 2006-2008 period at more than 7.67 percent. As macroeconomic instability continued, the economy witnessed ongoing high inflation rates in 2009 and 2011, resulting in the weakening of enterprises’ operations, the job creation ability of the whole economy, and slowing down Vietnam’s ability to achieve the MDGs.
The analytical results using data extracted from the Vietnam Household Living Standard Survey, the Labor and Employment Survey and Enterprise Census during 2008-2012 show that the economic slowdown had negative impact on the growth rate of enterprise operations, employment and household income. The number of enterprises increased but the rate of increase is much lower than that of the pre-slowdown period. The newly established firms however are mainly small enterprises (with less than 10 workers). Firms’ revenue, profit and size have dramatically declined. The number of 8 Report on Implementation result of National Target Program on Sustainable Poverty Reduction 2011-2012, MOLISA

19
firms shifting their main business into other sectors has risen. The economic slowdown and macroeconomic instability have depressed decent work opportunities and income for labourers, consequently lowering household income growth. There is a large proportion of labour shifting from industrial sectors to agriculture. Underemployment seems to be on the rise.
Impact on household income Household real average income increased insignificantly at the rate of 3.5
percent during 2010-20129, which is much lower than the rate of increases during the period 2006-2008 (at 17 percent). The economic slowdown has more negative impacts on urban and developed areas where the service and industry sectors are located, as compared to the rural areas where agriculture is the main economic activity. Household income in rural areas increased by 7.6 percent, while it slightly decreased by 0.5 percent in urban areas. Over the last two years, the average income of households in the Southeast dropped by 9.2 percent. Meanwhile, the average income of households in the Red River Delta increased by 4.2 percent, which is much lower than the economic potential of this area.
Table 2: Household income and poverty rate by regions
Regions
Average income (thousand VND/year per
capita)Change in
income (%)Poverty rate (%) Change in
poverty rate (%)2010 2012 2010 2012
Total 1574.6 1629.7 3.5 14.0 11.8 -2.2Rural/UrbanRural 1219.3 1311.5 7.6 17.9 15.1 -2.8Urban 2383.9 2372.2 -0.5 5.1 4.0 -1.1RegionsRed River Delta 1735.1 1807.6 4.2 7.2 6.0 -1.2Northern Midland and Mountainous Areas 991.0 1128.7 13.9 33.1 29.0 -4.1
Central Coastal Area 1119.4 1274.4 13.8 20.6 15.5 -5.1Central Highlands 1267.6 1555.3 22.7 18.3 15.9 -2.4South East 2715.9 2465.7 -9.2 1.9 1.8 -0.1Mekong River Delta 1348.3 1435.4 6.5 12.1 10.6 -1.5
Note: Average income is measured based on the prices in January 2010.Source: Calculation from VHLSS 2010 and 2012
Although average income has increased insignificantly, there has been progress in poverty reduction in both rural and urban areas, as well as across six geographic regions including poor areas. The poor’s10 living standards improved within the period 2010-2012. However, the economic slowdown has had adverse effects on sustainability of the poverty reduction efforts. The regions with high out-of-poverty rates also experience high fall-into-poverty rates. The economic slowdown has had stronger effects on households working in the non-agriculture sectors. 9 Author’s calculations based on VHLSS 2010 and 201210 ‘Poor’ are defined as people living below the poverty line

20
Impact on labour and employment Contrary to forecasts about higher unemployment rates as the result of
to the economy’s inability to fully absorb an increasing newly-joined labour force in Vietnam11, the unemployment rate slightly decreased during 2008-2012. However, the average working hours per week in all sectors dropped. In particular, the average number of working hours per week dropped from 46.2 hours in 2008 to 42.1 hours in 201212, an 8.5 percent decrease. This signals a rising trend for underemployment.
According to the Rapid Impact Monitoring Report in 2011, firms might change their employment strategy if the economy continues its slowdown. Inventories have considerably increased in recent years with firms currently adopting a temporary strategy--accepting orders just to keep their workers employed. The concern is that if the economic slowdown worsens, firms will lay off their employees. In that scenario, the unemployment rate in the formal sector will greatly increase.
Table 3: Average working hours per week by economic sector (hours/week)
2008 2010 2012Agriculture 42.6 42.1 37.6Manufacturing 50.4 48.9 47.5Electricity, water and mining 46.3 45.2 44.1Construction 51.6 49.0 47.5
Wholesale and retail trade 50.9 49.0 48.3
Transportation 50.8 48.6 48.1Hotels and restaurants 48.8 48.0 47.2Financial intermediation, banking, insurance and real estate 45.0 44.3 43.7Scientific activities and technology, education and healthcare 44.3 43.6 41.3Other service activity 48.5 47.2 46.2Others 45.0 43.9 41.3Total 46.3 45.2 42.1
Source: Labor and Employment Survey 2008, 2010 and 2012
The quality of employment has fallen. The percentage of labourers with labour contracts declined from 43.4 percent in 2011 to 41.1 percent13 in 2012. The proportion of workers with remuneration benefits such as social insurance and health insurance fell slightly, especially workers in agriculture and sectors with a high concentration of informal labour such as wholesale and retail, restaurants and other service activities. According to the Labor and Employment Survey 2012, only 2-7 percent of the workforce in these sectors has health insurance and 13-25 percent has social insurance.
Workers in agriculture are more vulnerable during the economic slowdown. In the period 2008-2012, the average number of working hours per worker in agriculture, the lowest among all sectors, experienced the strongest drop from 42.6 hours/week in 2008 to 37.6 hours/week in 2012. 11 Warren-Rodíguez (2009), Nguyen et al. (2009)12 Author’s calculation based on Labor Force and Employment Survey 2008-201213 Author’s calculation based on Labor Force and Employment Survey 2008-2012

21
The labour shift from industrial and service sectors to agriculture resulted in an increase in the proportion of labourers working in agriculture (from 44.4 percent to 46.9 percent). The average hourly wage in agriculture decreased from VND10,100 to VND9,000 per hour (a 10 percent decrease). Total labour income in agriculture dramatically declined as the result of both cutting working hours and reducing the average hourly wage. These phenomena not only show negative impacts of the economic slowdown (to nearly 50 percent of the national labour force), but also signal that underemployment in agriculture is substantially increasing.
Workers were more likely to change to jobs in other sectors within the period 2011-2012. Workers in state-owned enterprises were strongly affected by the economic slowdown and the existing internal weaknesses of this sector; 26.5 percent of workers from state-owned enterprises transferred to other sectors in 2012. The proportion of workers remaining in agriculture was the highest at 88.8 percent. Agriculture attracted labour from other industries. This fact indicates that when employment in other sectors becomes difficult, workers are more likely to turn to less sustainable, lower-productivity activities in agriculture.
Impact on enterprise and business environment By the end of 2011, there was in total 340,000 firms, an 18 percent
increase from the 2010 figure.14 However, this growth rate was much lower than the 32 percent growth rate of the pre-slowdown period in 2008; the increase in 2011 is mainly attributed to the substantial increase in small-size enterprises (with less than 10 labourers). Small-size enterprises15 made up 66 percent of the total number of enterprises; these enterprises had an annual average growth rate of 20.8 percent.16 However, small-size enterprises were the most vulnerable to economic shocks. The number of small-size enterprises that have closed down or gone bankrupt17 constitutes more than 80 percent of the total bankrupt/inactive enterprises. Average size of an enterprise also dropped substantially from 47.4 workers in 2007 to 32.6 workers in 2011 (decreased by over 30 percent). Even though the number of enterprises increased, the economy’s ability to create jobs was limited and unsustainable.
The average revenue of enterprises during the period 2008-2011 experienced a downward trend. In 2011, the average revenue per enterprise was VND12.5 billion, a 15.8 percent decrease from 2008 revenue.18 The fuel price crisis and high inflation in recent years increased operational costs and reduced the average profits of enterprises. The average profit in 2011 was merely equal to 50.8 percent of the pre-slowdown value. Profit declined in every sector, including those with high revenues such as electricity, water supply, finance and banking.
14 Enterprise Census 2011, GSO15 According to Decree No. 56/2009/ND-CP, micro-enterprise is an enterprise that has the average number of labourers of less than 10 people.16 Author’s calculation, based on Enterprise Census 2007-201117 Author’s calculation, based on duplicate data of Enterprise Census during 2007-201118 Author’s calculation using Enterprise Census 2007-2011

22
Table 4: Average revenue in 2008 and 2011 by economic sector
Revenue 2008 (million VND)
Revenue 2008 (million VND)
Change in revenue (%)
Agriculture 3,974 4,696 18.2
Manufacturing 25,783 26,118 1.3
Electricity, water and mining 4,707 18,679 296.8
Construction 7,850 7,380 -6.0
Wholesale and retail trade 17,564 13,826 -21.3
Transportation 13,683 8,350 -39.0
Hotels and restaurants 3,847 3,111 -19.1Financial intermediation, banking insurance and real estate 28,672 32,544 13.5
Scientific activities and technology, education and healthcare 3,121 2,241 -28.2
Other service activity 999 976 -2.3
Others 8,561 6,548 -23.5
Total 14,852 12,507 -15.8
Note: Revenue is calculated based on 2007 priceSource: Enterprise Census 2007, 2008, 2009, 2010 and 2011
In comparison to the pre-slowdown period in 2007-2008, firms had higher tendencies to change their main business in 2010-2011. While only the service sector had more than 10 percent of firms shifting their businesses to other sectors in 2008, this figure in 2011 was seven out of ten sectors. The rate of change is highest in the science, technology and services sectors. There are tendencies for firms to move into the wholesale and retail sectors, partly because wholesale and retail are easy to enter and require low fixed investment. Enterprises that changed their main business to trade and processing achieved strong growth in revenue. This indicates that appropriate business strategies in response to the economic slowdown have had positive impacts on enterprises’ activities.
The global economic crisis has depressed the revenue, profit and size of enterprises, even though the extent of the impact has yet to be serious. Employment and household incomes increase, albeit at a low rate. However, the impact of the economic slowdown might be long term and have some lag. If the economic slowdown continues, negative impacts on enterprises, employment and households’ welfare will increase over time. Poverty reduction is unsustainable without economic growth. If the economy shows no signs of recovery, enterprises could change their employment strategies and cut down the number of jobs; this would worsen the employment situation in the country. An increase in unemployment with a reduction in household average income might put more pressure on household expenditures. Households would have to lower their expenditures on basic needs such as food, nutrition, health and education. In the long term, these difficulties will result in problems such as reduction in nutritional intakes, child and maternal mortality, and decreases in school enrolment rates; therefore lowering the sustainability of Vietnam’s MDG outcomes.

23
Inequality in socio-economic development between geographic regions and ethnic groups
Inequality between rural-urban areas and between different regions
Increasing inequality in income
Empirical evidence has shown that inequality in income and expenditure has been rising at the national level, albeit at a modest level. The ratio of means per capita incomes of the top 20 percent income group and the bottom 20 percent income group has increased from 7 times in 2004 to 8.5 times in 2010. The Gini Index calculated using expenditure was relatively stable at around 0.35–0.36 during the period 2006-2008, but increased to 0.393 in 2010.19
One of the key factors contributing to the recent rise in income inequality comes from the increasing inequality in rural areas. For rural areas, the rate of growth in the 10 percent poorest households was less than half of the income growth rate among the 10 percent richest households. The difference in income between these two groups in rural areas has increased by 25 percent from 2004 to 2010. The Gini coefficient of income inequality in rural areas also rose from 0.365 to 0.413 in 2010.20 This phenomenon shows that there is an increase in income inequality between the rich and the poor in rural areas.
There are a number of reasons for the rise in income inequality in Vietnam. Firstly, the rate of poverty reduction and socio-economic development of the ethnic minority groups cannot catch up with that of the Kinh majority. Secondly, there is significant variation in growth patterns and speed of growth among different geographic regions. Specifically, agricultural and nonagricultural growth across regions contributes to a difference in growth rates. The movement from agriculture into nonagricultural sectors, as well as the transfer from low-skill to higher-skill work in nonagricultural sectors, has changed the income distribution of Vietnam over time.
Inequality in living standards between urban and rural areas
Besides increasing inequality in income, there exists relatively significant disparity in poverty rates and living standards between rural and urban areas. According to the Government poverty line for the period 2011-2015, poverty rates in 2010 in urban areas stood at 6.9 percent, while the corresponding rates in rural areas reached 17.4 percent.21 More than 90 percent of poor households and 94 percent of extremely poor households live in rural areas. In 2010, poverty gap by expenditure in rural areas was 7.8 percent, which is five times higher than the corresponding figure for urban areas (1.4 percent) (see Table 5). Multi-dimensional child poverty rates between urban and rural areas show clear disparity: the rate in urban areas was 15.9 percent while the corresponding rate in rural areas was 34.5 percent in 2010.22
19 VHLSS 2004, 2006, 2010 by GSO20 Well Begun, Not Yet Done: Vietnam’s Remarkable Progress on Poverty Reduction and the Emerging Challenges, the World Bank, 201221 GSO 201022 UNICEF

24
There exist huge gaps in living conditions between rural and urban areas. In terms of housing conditions, in 2010, 7.2 percent of rural households lived in temporary housing, while this figure for urban areas was 1.9 percent. Access to water and sanitation is also different between the two areas. The percentage of urban households with access to clean water was 10.4 percent higher than that of rural households. The respective difference in access to sanitary toilets was 26.7 percent.
Inequality in education indicators between rural and urban areas is no longer significant as Vietnam has obtained universal primary education and is moving towards universal lower secondary education. Literacy rates of population aged 10 and older in urban areas was 3.9 percent higher than that of rural areas, but both regions have literacy rates greater than 90 percent. In fact, the quality of education in rural areas is substantially lower than education quality in urban areas. School dropouts occur more frequently in rural and remote areas. The quality of learning and teaching, as well as school facilities in rural areas, is highly inadequate as compared to the conditions in urban areas.
With respect to healthcare, there is huge inequality in maternal health indicators and child mortality rates between rural and urban areas. For instance, under-one and under-five mortality rates/1000 live births in rural areas are twice as high as those of urban areas. Other health indicators in MDG 4 and MDG 5 all display significant disparity between rural and urban areas.
Table 5: Socio-economic indicators between rural and urban areas
Urban area Rural area
Poverty rate in 2010 according to new poverty line (%) 6.9 17.4
Poverty gap in 2010 (by expenditure) (%) 1.4 7.8
Living conditions (in 2010) (%)
Households living in temporary houses 1.9 7.2
Households using clean water 97.7 87.4
Households using sanitary toilet 93.8 67.1
Households having garbage disposed by cart/truck 79.6 21.4
Education (%)
Literacy rate of population aged 10 and older in 2010 97.0 92.6
Literacy rate of population aged 10 and older in 2012 97.5 93.6
Health (in 2012)
Under-1 mortality rate/1000 live births 8.9 18.3
Under-5 mortality rate/1000 live births 13.4 27.6
Source: VHLSS 2010, 2012 by GSO

25
Inequality in living standards among geographic regions
The poverty rate has decreased across every geographic region but poverty reduced faster in more developed regions such as the Red River Delta and the South East. Unequal progress among different regions resulted in huge changes in poverty distribution across regions; poor households are concentrated primarily in the Northern Mountains, the Central Highlands and Mekong River Delta, the Northern Central and Central Coastal Area. Inequality in poverty level tends to intensify in the Central Highlands, the Northern Mountains, the Northern Central and Central Coastal Area (Table 6).
Table 6: Poverty rate by geographic region
2011 2012
Poverty rate (%)
Poverty rate in each region as compared to national average
(times)
Poverty rate (%)
Poverty rate in each region as compared to national
average (times)
Total 11.8 9.6North East 21.0 1.79 17.4 1.81North West 33.0 2.81 28.6 2.97Red River Delta 6.5 0.55 4.9 0.51North Central 18.3 1.55 15.0 1.56Central Coastal Area 14.5 1.23 12.2 1.27Central Highlands 18.5 1.57 15.0 1.56South East 1.7 0.14 1.3 0.13Mekong River Delta 11.4 0.97 9.2 0.96
Source: MOLISA
The huge discrepancy in living conditions, access to education and healthcare reflects unequal progress in realizing MDGs among geographic regions. The Northern Midland and Mountainous Areas, the Central Highlands and the Mekong River Delta have lower living standards as compared to the average national living standards, while the Red River Delta and the South East have living standards above the national average. The Northern Midland and Mountainous Areas, the Central Highlands, and the Mekong River Delta have the lowest access to clean water and sanitation. The percentages of households living in temporary housing in these three regions are the highest in the country; in 2010 the Mekong River Delta had the highest percentage at 16.8 percent. Disparity in access to education among geographic regions has been narrowed down but access to healthcare facilities and quality of healthcare service shows notable inequality. Under-one and under-five mortality rates per 1000 live births in the Northern Midland and Mountainous Areas, the Central Highlands, the Northern Central and Central Coastal Area are higher than the national average and the rates in other geographic regions (see Table 7).

26
Table 7: Socio-economic indicators by geographic region
Red River Delta
Northern Midland and Mountainous
Areas
North Central and Central Coastal Area
Central Highlands
South East
Mekong
River Delta
Living conditions (2010) (%) Households living in permanent and semi-permanent housing 92.8 76.4 93.3 91.7 94.1 62.4Households living in temporary housing 0.1 8.9 3.1 2.0 3.0 16.8Households using cleaned water 98.6 80.3 91.0 82.8 98.1 81.5Households using sanitary toilet 89.6 60.8 81.9 62.1 92.0 47.6
Education (%)Literacy rate for population aged 10 and older in 2010 97.3 88.9 93.6 90.9 96.4 92.6Literacy rate for population aged 10 and older in 2012 97.6 89.6 94.7 92.9 97.1 93.6Net enrolment rate at lower secondary education in 2012 94.9 86.8 89.3 83.9 87.1 78.6
Health Pregnant women receiving at least 3 antenatal care sessions in 2011 94.2 75.4 86.4 81.3 89.1 86.3Under-1 mortality rate/1000 live births in 2012 12.3 23.5 17.1 24.6 9.2 12.0Under-5 mortality rate/1000 live births in 2012 18.4 35.7 25.8 40.2 13.7 18.0
Source: GSO
It is notable that the North West, the Northern Central and Central Coastal Area are more heavily affected by extreme weather events and natural disasters as compared to other regions. Therefore, the goal of lifting living standards and reducing poverty in these regions are big challenges in the upcoming years.
Slow progress for ethnic minoritiesEthnic minorities are better off nowadays than they were a decade
ago due to support from the Government and development partners. Nevertheless, the gap in living conditions and poverty rates between the Kinh and the ethnic minorities have widened. Ethnic minorities account for approximately 15 percent of the national population23, but statistics show that they account for an increasingly large proportion of the poor population. The ethnic minorities comprised 20 percent of the poor in 1993; this figure rose to 29 percent in 1998 and reached 50.3 percent in 2010. According to a report from the Committee on Ethnic Minority Affairs, the average income of ethnic minority households in poor and remote areas is only one-sixth of the national average. The fact that the concentration of minorities among the poor and extremely poor has increased substantially in recent years, while the national poverty rate has been declining indicates that the speed of poverty reduction for ethnic minorities is far below the national standard and the Kinh’s.
Disparity in the level of poverty between different demographic and geographic groups has risen in recent years. The Government’s report on poverty reduction progress shows the highest level of poverty rates in the
23 2009 Population and Housing Census

27
regions where the ethnic minorities reside: the North West, the North East and the Central Highlands regions. In the Central Highlands, the poverty rate in 2010 was 1.5 times higher than the national average, while the rate in 2012 was 1.6 times higher. For the Northern Uplands, the poverty rate in 2010 was 2.3 times higher than the national average, and the corresponding figure in 2012 was 2.5. In 2010, the multi-dimensional poverty rate in the North West was the highest at 60 percent.24
Table 8 demonstrates a huge disparity between the Kinh and the ethnic minorities in a number of socio-economic indicators. The 2010 poverty rate by expenditure for the ethnic minorities stood at 66.3 percent, five times higher than that of their Kinh counterparts at 12.9 percent. Disparity in living standards between poor Kinh households and poor ethnic minority households is also huge. The poverty gap is much higher for the ethnic minorities as compared to the Kinh (24.3 percent and 2.7 percent in 2010 respectively). Huge inequality also exists with regard to education. There was a 16.4 percent difference in literacy rates for population aged 10 and older in 2010 between the Kinh and the ethnic minorities. School attendance rates for children aged 6-14 in 2010 was 5.1 percent higher for the Kinh than the ethnic minorities. Access of the ethnic minorities to public utilities such as the national electric power grid, improved water and sanitation were significantly lower than that of their Kinh counterparts (Table 8).
Table 8: Socio-economic indicators by ethnicity (%)
Kinh/Hoa Ethnic minority
Poverty rate in 2010 (by expenditure) 13.0 66.3
Poverty gap in 2010 (by expenditure) 2.7 24.3
Literacy rate for population aged 10 and older in 2010 96.2 79.8
School attendance rate for children aged 6-14 in 2010 95.0 89.8
Households with access to electricity grid in 2010 90.9 69.6
Households with access to improved water in 2010 69.2 18.4
Households with access to improved sanitation in 2010 98.9 83.2
Source: GSO, VHLSS 2010
Climate Change
ChallengesClimate change is emerging as one of the biggest challenges Vietnam has
to deal with in development progress. As its profound and far-reaching impact can significantly undermine socio-economic achievements in Vietnam, it is essential to fully understand the characteristics of climate change and to develop suitable adaptation strategies for sustainable development.
24 UNICEF

28
International and domestic research has ranked Vietnam as one of the countries most affected by climate change, and is being used to urge the government to take more comprehensive actions against this threat, as well as call for international cooperation and support on this global issue. At the regional level, Vietnam is situated in the Mekong Basin, which has been ranked as one of the few ‘global hotspots’ of climate-related vulnerability.25 According to the 2011 impacts of climate change mapped by Center for Global Development26 covering 233 countries and other political jurisdictions in the world, Vietnam ranks fifth in terms of extreme weather direct risks (physical climate impact), and eighth in terms of sea level rise direct risks. Climate change in Vietnam is taking place at an alarming rate. The frequency of days and nights classified as ‘hot’, a major indicator to evaluate climate change, has witnessed a dramatic increase of 29 days in 1960 to 49 days in 2003. The Flood Risk Map in Asia-Pacific in 2011 by UNEP/GRID-Europe showed the Mekong River Delta placed in the extreme flood risk area. In Maplecroft’s Climate Change Vulnerability Index 2013, Ho Chi Minh City ranks sixth in the list of the most vulnerable cities facing extreme risk.
In Vietnam, the impact of climate change is more serious due to the natural characteristics of its topography and the dependence of the economy on agriculture. Vietnam has a diversified topography. However, mountains constitute three quarters of the total national area27 and terrain under 1,000 m in height dominated 85 percent of the total area. This mountainous geography and coastal frontage, together with its location in the regional centre of tropical typhoons and storms, make Vietnam extremely exposed to sea level rise and extreme weather events such as floods, landslides and heavy rainfall. Moreover, agriculture accounts for 20 percent of its GDP and agricultural labour amounts to 48.4 percent of its workforce28, so the impact of climate change in Vietnam is more damaging than that in other developed economies.
Table 9: The impact of climate change in Vietnam in 2010 by percentage of GDP
Impact of climate change % of GDPDamages and losses on labour productivity 4.4Damages and losses caused by sea level rise 1.5Damages and losses on fisheries 0.5Damages and losses on agriculture 0.2Damages and losses on heating and cooling caused by climate change 0.1Damages and losses caused by floods and landslides 0.1Damages and losses on biodiversity 0.1Damages and losses by drought 0.1
Source: DARA International
25 USAID (US Agency for International Development) (2010) Asia Pacific Regional Climate Change Adaptation Assessment Final Report Findings and Recommendations. Washington, DC: USAID26 http://international.cgdev.org/page/mapping-impacts-climate-change27 http://chinhphu.vn/portal/page/portal/chinhphu/NuocCHXHCNVietNam/ThongTinTongHop/dialy28 http://www.gso.gov.vn/default.aspx?tabid=387&idmid=3&ItemID=12847

29
The impact of climate change adversely affects the progress of reaching MDGs and threatens to undermine the achievements of Vietnam, as well as the sustainability of MDG programmes. In 2010, the total economic loss caused by climate change in Vietnam was estimated to be 5 percent of its GDP.29 With regards to health, climate change has also led to the increase of illnesses relating to temperature and hunger in both severity and amounts. The average number of people affected by the worsening effect of climate change on hunger is estimated to be over 800,000 people each year. In terms of infrastructure, the transportation sector of Vietnam suffered damage worth VND 2,571 billion due to extreme weather events during the period of 2001-2005.
Table 10: The impact of climate change in Vietnam
Impact of climate change 2010Contraction of biological zones (km2)--yearly average -150Additional land degraded due to climate change (km2)--yearly average -3,500Additional/reduced energy load due to climate change (GWh)--yearly average 1,500Additional CO2 generated/reduced for heating and cooling due to climate change (kt CO2)--year-ly average
550
Share of workforce particularly affected by climate change (%)--yearly average 48%Additional land lost due to climate change (km3)--yearly average 150
Additional water losses/gains due to climate change (km3)--yearly average -1
Source: DARA International
The most recent analyses and forecasts have given Vietnam strong warnings about the challenges the country has to be prepared to deal with. Without prompt action and suitable strategies, Vietnam will have to bear an increasing cost due to losses as a result of climate change, which is estimated to be 11 percent of GDP in 2030. Another study by the Asian Development Bank estimates that the cost of additional stresses and potential losses from climate change will be 1-3 percent of real GDP in 2050. With regards to infrastructure, an increase of 1 m in mean sea level can result in the submergence of 11,000 km of roads. Inundation is a serious threat to 695 km of national highways, 495 km of which are in the Mekong River Delta.
Table 11: Projections of the impact of climate change in Vietnam in 2030
Impact of climate change % of GDPDamages and losses on labour productivity 8.6Damages and losses caused by sea level rise 2.7Damages and losses on fisheries 1.6Damages and losses on agriculture 0.4Damages and losses on heating and cooling caused by climate change 0.3Damages and losses caused by floods and landslides 0.1Damages and losses on biodiversity 0.1Damages and losses by drought 0.1
Source: DARA International
29 DARA International and the Climate Change Forum (2012) Climate Change Vulnerability Report 2012 A Guide to the cold calculus of a hot planet. Spain: DARA International.

30
Vietnam in response to climate change challengesOver the last five years, the (Government of Vietnam) GOV has
proactively developed and implemented many policies and programs to respond to climate change. The climate change response has been actively integrated into national policies and programs such as Vietnam’s Socio-economic Development Strategy for 2011-2020. In 2008, the GOV ratified the National Target Program on Response to Climate Change (NTP-RCC) and committed a budget of VND985.5 billion to the program.
In 2011, the National Climate Change Strategy and a comprehensive plan to deal with the impact of climate change were established; the plan covers a wide range of issues such as vulnerability and low carbon. The GOV also defines the responsibilities and requires the participation of all related government departments, formulating a comprehensive coordination mechanism among government departments and local authorities. Additionally, the GOV has promoted international co-operation, launching the Support Program to Respond to Climate Change with the participation of development partners such as Japan, France and international development organizations such as the World Bank. As a result, Vietnam has mobilized a considerable amount of funds from different sources to support and execute policies and models to respond to climate change, reaching more than USD500 million in 2010.
Although Vietnam has taken these initial steps towards climate change response and adaptation, the enormous challenge of climate change surpasses the experience and capability of the country itself. On the one hand, Vietnam has to continue its successful initiatives such as increasing the awareness of local communities, building climate-adaptation capacities for local people, concentrating on improving resource management and restructuring the economy on a sustainable basis. On the other hand, Vietnam needs to foster international cooperation, promote the exchange of knowledge and experience in dealing with climate change as well as increase the effectiveness of international aid. Domestic commitments and international coordination are key to the challenge of climate change adaptation in a global context.
PART 2: PROGRESS of MDGsMDG 1: Eradicate extreme poverty and hunger
Millennium Development Goal
• Reduce by half the proportion of people living on less than a dollar a day• Achieve full and productive employment and decent work for all, including women and young people• Reduce by half the proportion of people who suffer from hunger
SUMMARY OF PROGRESS
Vietnam is one of the success stories with regards to poverty reduction for the period 2000-2012. According to the government poverty line for the period 2005-2010, poverty rates dropped from 15.5 percent in 2006 to 10.7 percent in 2010. During the period 2011-2015, poverty rates declined from 14.2 percent in 2010 to 9.6 percent in 2012. Vietnam’s impressive rate of poverty reduction is the result of strong economic growth and trade liberalization, as well as poverty reduction policies directly targeting disadvantaged groups.
Despite its impressive achievements in poverty reduction, the country still faces multiple challenges in its poverty reduction efforts. The rate of poverty reduction varies across different ethnic groups and geographical regions. Poverty reduction is difficult to sustain in many cases. Some ethnic minorities and rural residents in remote areas still suffer from chronic poverty and have benefited little from economic growth and support policies. Urban poverty appears to be an emerging problem due to the high influx of rural migrants and rapid urbanization. Of increasing concern is the multidimensional poverty rate for children, which reached 29.6 percent in 2010, equivalent to 7 million children.
PROGRESS
Poverty reductionVietnam has achieved extreme poverty reduction and hunger eradication.
The rate of poverty reduction in Vietnam is impressive, with more than 43 million people having been lifted out of poverty during the period 1993-2008. The poverty rate has fallen dramatically from more than 50 percent in the 1990s to less than 20 percent in the past decade. Over the period 2006-2010, the poverty rate dropped substantially by 4.8 percent, according to the 2005-2010 government poverty line. During the period 2010-2012, the poverty rate fell by 4.6 percent, during the period 2011-2015. Poverty reduction has been achieved across all of the geographic areas of Vietnam, with the highest rate occurring in the Red River Delta and the South East regions (Table 1. 1).

31
PART 2: PROGRESS of MDGsMDG 1: Eradicate extreme poverty and hunger
Millennium Development Goal
• Reduce by half the proportion of people living on less than a dollar a day• Achieve full and productive employment and decent work for all, including women and young people• Reduce by half the proportion of people who suffer from hunger
SUMMARY OF PROGRESS
Vietnam is one of the success stories with regards to poverty reduction for the period 2000-2012. According to the government poverty line for the period 2005-2010, poverty rates dropped from 15.5 percent in 2006 to 10.7 percent in 2010. During the period 2011-2015, poverty rates declined from 14.2 percent in 2010 to 9.6 percent in 2012. Vietnam’s impressive rate of poverty reduction is the result of strong economic growth and trade liberalization, as well as poverty reduction policies directly targeting disadvantaged groups.
Despite its impressive achievements in poverty reduction, the country still faces multiple challenges in its poverty reduction efforts. The rate of poverty reduction varies across different ethnic groups and geographical regions. Poverty reduction is difficult to sustain in many cases. Some ethnic minorities and rural residents in remote areas still suffer from chronic poverty and have benefited little from economic growth and support policies. Urban poverty appears to be an emerging problem due to the high influx of rural migrants and rapid urbanization. Of increasing concern is the multidimensional poverty rate for children, which reached 29.6 percent in 2010, equivalent to 7 million children.
PROGRESS
Poverty reductionVietnam has achieved extreme poverty reduction and hunger eradication.
The rate of poverty reduction in Vietnam is impressive, with more than 43 million people having been lifted out of poverty during the period 1993-2008. The poverty rate has fallen dramatically from more than 50 percent in the 1990s to less than 20 percent in the past decade. Over the period 2006-2010, the poverty rate dropped substantially by 4.8 percent, according to the 2005-2010 government poverty line. During the period 2010-2012, the poverty rate fell by 4.6 percent, during the period 2011-2015. Poverty reduction has been achieved across all of the geographic areas of Vietnam, with the highest rate occurring in the Red River Delta and the South East regions (Table 1. 1).

32
Table 1. 1: Poverty rate using government poverty line for 2006–2010 (%)
2006 2008 2010 2010* 2011* 2012*
National average 15.5 13.4 10.7 14.2 11.8 9.6
By area
Urban 7.7 6.7 5.1 6.9 ─ ─
Rural 18.0 16.1 13.2 17.4 ─ ─
By region (6 regions)
Red River Delta 10.0 8.6 6.4 8.3 ─ ─
Northern Midland and Mountainous Areas 27.5 25.1 22.5 29.4 ─ ─
North Central and Central Coastal Area 22.2 19.2 16.0 20.4 ─ ─
Central Highlands 24.0 21.0 17.1 22.2 ─ ─
South East 3.1 2.5 1.3 2.3 ─ ─
Mekong River Delta 13.0 11.4 8.9 12.6 ─ ─
By region (8 regions)
Red River Delta ─ ─ ─ ─ 6.5 4.9
North East ─ ─ ─ ─ 21.0 17.4
North West ─ ─ ─ ─ 33.0 28.6
Central Coast ─ ─ ─ ─ 18.3 15.0
South Central Coast ─ ─ ─ ─ 14.5 12.2
Central Highlands ─ ─ ─ ─ 18.5 15.0
South East ─ ─ ─ ─ 1.7 1.3
Mekong River Delta ─ ─ ─ ─ 11.4 9.2
Note: The 2010* poverty rate is estimated as the Government poverty line for the period 2011-2015
Source: VHLSS 2004, 2006, 2008, 2010 by GSO and MOLISA
A significant decreasing trend is evident for two of the most important poverty measurements: poverty incidence and the poverty gap.30 This indicates that not only has the quantity of poor households decreased, but the intensity of poverty has also lessened. The poverty gap has dropped from 7 percent in 2002 to 3.5 percent in 2008, however this figure rose to 5.9 percent in 2010. In 2010, the poverty gap is higher than in 2008 for every demographic and geographic classification (Table 1. 2). Poor households in rural areas and in the Northern Midland and Mountainous Areas, the Northern Central and Central Coastal Area, and the Central Highlands (mostly ethnic minorities) have lower living standards as compared to poor households in urban areas and in other geographic regions and in poor Kinh households.
30 The poverty gap index is a measure of the intensity of poverty. It is defined as the average poverty gap in the pop-ulation as a proportion of the poverty line. The poverty gap index estimates the depth of poverty by considering how far, on the average, the poor are from that poverty line.

33
Table 1. 2: Poverty gap (%)
2002 2004 2006 2008 2010
National average 7.0 4.7 3.8 3.5 5.9
By area
Urban 1.3 0.7 0.8 0.5 1.4
Rural 8.7 6.1 4.9 4.6 7.8
By ethnicity
Kinh 4.7 2.6 2.0 1.7 2.7
Non-Kinh 22.8 19.2 15.4 15.1 24.3
By region
Red River Delta ─ ─ ─ 1.4 2.6
Northern Midland and Mountainous Areas ─ ─ ─ 8.8 15.6
North Central and Central Coastal Area ─ ─ ─ 4.4 6.3
Central Highlands ─ ─ ─ 7.5 11.5
South East ─ ─ ─ 0.3 1.7
Mekong River Delta ─ ─ ─ 2.3 4.4
Source: VHLSS 2002, 2004, 2006, 2008, 2010 by GSO
The standard of living for households at the national level has improved drastically over the past decade. Between 2002 and 2010, household expenditure (per person per annum) has more than doubled. Expenditure levels across every geographical area and ethnic group have risen consistently over the years, indicating significant improvements in living standards at the national level. The more economically disadvantaged regions, such as the Northern Midlands, the Northern Central and Central Coastal Area, and the Central Highlands also experienced significant improvements in living standards as measured by expenditure (Table 1. 3).

34
Table 1. 3: Expenditure per person per annum (‘000 VND)
2002 2004 2006 2008 2010National average 3,524 4,445 4,800 6,123 7,399By area Urban 5,970 7,304 7,619 9,622 11,171 Rural 2,785 3,521 3,770 4,787 5,807By region (8 regions) Red River Delta 3,602 4,679 4,991 6,289 8,809 North East 2,890 3,640 3,891 4,874 5,853 North West 2,309 2,810 3,048 3,838 4,648 Central Coast 2,522 3,088 3,285 4,328 5,708 South Central Coast 3,204 4,104 4,255 5,459 6,660 Central Highlands 2,596 3,599 4,045 5,184 5,934 South East 5,785 6,995 7,678 9,988 10,139 Mekong River Delta 3,418 4,213 4,557 5,481 6,466By region (6 regions)
Red River Delta 6,373 8,790
Northern Midland and Mountainous Areas 4,312 5,291
North Central and Central Coastal Area 4,825 6,206
Central Highlands 5,184 5,934
South East 10,674 10,539
Mekong River Delta 5,481 6,466
Note: Values are adjusted to January 2002 pricesSource: VHLSS 2002, 2004, 2006, 2008, 2010 by GSO
Housing conditions, transport and access to information have improved significantly. Over the period 2004–2010, the percentage of households owning permanent housing more than doubling, from 20.8 percent to 49.2 percent. Motorbikes have become a basic transport vehicle for households with ownership increasing from 55.3 percent in 2004 to 96.1 percent in 2010, and 80.3 in 2012. Improved access to media and information, is evident through ownership of televisions, computers and videos. Ownership of other types of durable goods has also increased over the same period (Table 1. 4).

35
Table 1. 4: Possession of durable goods per 100 households
2004 2006 2008 2010 2012Permanent housing 20.8 23.7 27.8 49.2 ─Car 0.1 0.2 0.4 1.3 1.7Motorbike 55.3 68.6 89.4 96.1 80.3Telephone 28.5 51.4 107.2 128.4 81.3Refrigerator 16.6 23.0 32.1 39.7 49.2Video 32.8 44.5 53.4 54.2 52.9Colour television 69.8 82.0 92.1 85.9 90.4Stereo equipment 1.0 12.8 14.9 12.6 13.5Computer 5.1 7.7 11.5 17.0 17.3Air conditioner 2.2 3.7 5.5 9.4 9.2Washing, drying machines 6.2 9.3 13.3 17.6 22.5Water heater 5.4 7.6 10.1 13.3 17.1
Source: VHLSS 2004, 2006, 2008, 2010, 2012 by GSO
Success in poverty reduction in Vietnam is the result of rigorous economic growth as well as the government’s strong policy focus over the past two decades. Firstly, liberalization has opened Vietnam to international markets and promoted international trade and foreign investment. Vietnam’s joining the World Trade Organization in 2007 has eliminated trade barriers and facilitated the export of goods with comparative advantages, which in turn has created decent jobs. Rapid economic growth and trade liberalization, supported by macroeconomic policies, such as land and trade reforms, have created millions of jobs, provided income and lifted millions of people out of poverty.
Poverty reduction programmes and policies have enabled the most vulnerable to participate more actively in the nation’s economic development. The government has established a large number of policies specifically targeting disadvantaged groups, including the ethnic minorities. With comprehensive policy coverage for the critical aspects of people’s living conditions and steady targets for the most vulnerable and deprived populations in remote communes, national poverty reduction policies have achieved their poverty reduction objectives, increasing income levels and improving the living standards of the target population. By 2010, 77.2 percent of poor households had benefited from the government’s support programmes and policies, indicating wide policy coverage throughout the country.31
Sustainability has been strongly incorporated into poverty reduction policy in most national programmes for the period 2011-2020. Sustainable poverty reduction programmes for the period 2011-2020 deliver support across a variety of key indicators including health, education, nutrition, housing, legal services, culture and information, as well as vocational training support, job creation for the disadvantaged, as well as investment in public infrastructure in especially poverty-stricken areas.
31 WB, 2012

36
Hunger eradicationThe reduction in poverty rates and improvements in living standards have
been complemented by a reduction in the hunger rate. During the period 2009-2012, the number of individuals suffering from hunger dropped by more than 1 million. In the same period, the number of households suffering from hunger also declined by more than one third (Figure 1. 1). While the rate of hunger is low in regions such as the Red River Delta, South East and Mekong River Delta, it is high throughout the Northern Midland and Mountainous Areas, certain provinces in the Central Highlands and the Northern Central and Central Coastal Area.32
Figure 1. 1: Number of households and individuals who suffer from hunger
Source: GSO, 2012
Vietnam has made rapid progress in eliminating malnourishment among children under five years of age, evidenced by the noticeable decline in numbers of underweight children within this age group from about 41 percent in 1990 to about 33.8 percent in 2000 (a drop of 7.2 percent). It declined by a further 17 percent during the period 2000-2011 to about 16.8 percent. By 2010, Vietnam had realized its 2015 target of 20.5 percent (Figure 1. 2).
The most significant improvements in reducing the rate of underweight children under five years of age were experienced the South Central Coast, Red River Delta and South East regions, which all recorded a reduction of more than 45 percent during the period 2000-2010. The slowest progress was reported in the North West, Central Highlands and North East regions.33
Significant effort has been made to reduce the rate of stunting among children under five years of age. The annual average reduction rate over the last 10 years is estimated at 1.4 percent. Between 2000 and 2010, the prevalence of stunting decreased by approximately 32 percent. Progress has been made in reducing the stunting rate across all regions within this period. The Central Highlands region experienced the highest reduction in the rate of stunting.34
32 GSO33 National Institute of Nutrition (NIN) and UNICEF. (2011). General Nutrition Survey 2009-2010. Medical Pub-lishing House34 National Institute of Nutrition (NIN) and UNICEF. (2011). General Nutrition Survey 2009-2010. Medical Pub-lishing House

37
Figure 1. 2: Malnutrition prevalence among children under five years of age, 1999-2011 (%)
Source: National Institute of Nutrition35
The declining trend of underweight and stunting prevalence is continuing, which is a reflection of Vietnam’s growing commitment and attention to promoting child nutrition. However, a number of challenges remain, especially with regard to the disparity in nutrition status across regions and different social groups. For instance, the stunting rate is significantly lower in the wealthier group (12.9 percent) as compared to the poorer group (38.7 percent). The prevalence of stunting in small cities is estimated at 24.2 percent, which is nearly three times higher than for large cities (8.9 percent). By region, the highest rates are in the Northern Midland and Mountainous Areas and the Central Highlands, which are the two regions where children’s access to basic healthcare and nutrition is limited, and community awareness, especially among the ethnic minorities, about the role of nutrition is generally low.36
EmploymentActive job creation and employability for the disadvantaged are among
the government’s key poverty reduction and economic growth strategies. National employment and vocational training programmes have helped increase workers’ employability, as well as their access to employment. The Labour and Employment Survey 2012 shows that multiple government support programmes helped create 1,540,000 jobs in 2012.
The participation of labourers 15 years of age and older in the labour force has been increasing at a slow rate over the past five years, easing the burden of achieving job creation through the economy. In 2012, the unemployment rate decreased steadily from 2.9 percent in 2009 to 2 percent, and in urban areas it stood at 3.3 percent, while in rural areas it was 1.4 percent (Table 1. 5).
Even though 2012’s unemployment rates showed a slight decrease in comparison with the 2011 figure, the percentage of labour in the informal sector in 2012 increased from 34.6 percent in 2010 to 35.8 percent in 2011, and 36.6 percent in 2012 (Table 1. 6). This indicates that social protection systems in Vietnam have not developed and a large proportion of labourers are engaged in predominantly unstable and low-income jobs instead of either receiving unemployment welfare benefits or finding decent work.
35 National Institute of Nutrition (NIN). (2011). Nutrition Program Report 2011.36 National Institute of Nutrition (NIN) and UNICEF. (2011). General Nutrition Survey 2009-2010. Medical Pub-lishing House.

38
Table 1. 5: Rate of working labour aged 15 and older out of the total population aged 15 and older (%), 2008-2012
2008 2009 2010 2011 2012National average 72.6 74.2 74.6 75.5 75.4
By area Urban 64.3 63.9 66.0 67.3 67.9 Rural 76.0 78.8 78.5 79.4 79.2
By ethnicity Kinh ─ ─ 73.2 73.7 73.8 Non-Kinh ─ ─ 83.8 85.2 84.4
By region ─ ─ Red River Delta ─ ─ 82.6 83.9 83.7 Northern Midland and Mountainous Areas ─ ─ 73.2 72.9 72.7 North Central and Central Coastal Area ─ ─ 75.6 76.5 76.2 Central Highlands ─ ─ 80.8 82.7 81.8 South East ─ ─ 68.1 69.0 69.6 Mekong River Delta ─ ─ 74.4 75.7 75.9
Source: GSO, 2012
Table 1. 6: Unemployment rate (%), 2009-2012
2009 2010 2011 2012Total 2.90 2.88 2.27 1.99Urban area 4.60 4.43 3.60 3.25Rural area 2.25 2.27 1.71 1.42
Source: GSO, 2012There has been a gradual shift from self-employment into wage
employment. During the period 2002-2010, the rate of wage employment increased by 10.2 percent.37 By area, there is a distinct difference in employment structure between rural and urban areas; farm self-employment accounts for the largest employment share in rural areas (53.3 percent in 2010), while wage-employment is the main form of employment in urban areas (56.8 percent in 2010). The shift from self-employment in the farm sector to wage employment for both areas was slow (Figure 1. 3). Moreover, the economic slowdown during the period 2011-2012 resulted in a large proportion of the labour force returning to agriculture, which has slowed the process of shifting labour from the informal to the formal sector.
37 VHLSS 2010, GSO

39
Figure 1. 3: Employment structure in rural and urban areas (%), 2002-2010
Source: VHLSS 2002, 2004, 2006, 2008, 2010 Despite the ongoing improvements to employment structure, the majority
of workers in the economy are concentrated in agriculture and informal employment. In 2011, 20.4 million low-skilled labourers accounted for 40.4 percent of the total employed population.38
CHALLENGES
Inequality and chronic poverty within the most vulnerable groups. National policies and sustained high economic growth have resulted in a substantial reduction in the poverty rate, but the level and speed of poverty reduction varies across geographic and demographic groups due to different levels of participation in the social and economic development process. The rate of poverty reduction has slowed down over time and most of the remaining poor households are concentrated in rural and mountainous areas, which are mainly populated by the ethnic minorities. Ethnic minorities account for 50 percent of the total number of poor households. Ethnic minority household incomes are one-sixth of the national average.39 The Central Highlands and the Northern Midland and Mountainous Areas have the highest national poverty rates. The poverty rate in the Central Highlands was 1.5 times higher than the national rate in 2010, and 1.6 times higher in 2012. In the Northern Midland and Mountainous Areas, the poverty rate was 2.3 times higher than the national average in 2010, and 2.5 times higher in 2012.
Inequality in living standards tends to increase across geographic regions and ethnic groups. Disparity in living standards among ethnic minority households also increases. The Gini Index (by expenditure) for ethnic minorities increased from 0.28 in 2002 to 0.33 in 2010 (Table 1. 7). In urban areas, more developed regions such as the Red River Delta and the South East experience high levels of inequality, but a slower rate of increasing inequality as compared to the rural areas and less developed regions.
38 Labor and Employment Survey 2011, GSO39 CEMA Report

40
Table 1. 7: GINI Index (by expenditure)
2002 2004 2006 2008 2010
National average 0.37 0.37 0.36 0.36 0.39
By area Urban 0.35 0.33 0.33 0.35 0.39 Rural 0.28 0.30 0.30 0.31 0.33
By ethnicity Kinh 0.36 0.35 0.34 0.34 0.37 Non-Kinh 0.28 0.31 0.30 0.31 0.33
By region (8 regions) Red River Delta 0.36 0.35 0.35 0.35 0.40 North East 0.33 0.34 0.34 0.34 0.36 North West 0.35 0.36 0.37 0.38 0.42 Central Coast 0.30 0.31 0.32 0.31 0.34 South Central Coast 0.33 0.34 0.32 0.32 0.34 Central Highlands 0.36 0.36 0.36 0.35 0.37 South East 0.38 0.35 0.35 0.36 0.40 Mekong River Delta 0.30 0.32 0.30 0.31 0.32
By region (6 regions) Red River Delta ─ ─ ─ ─ 0.40 Northern Midland and Mountainous Areas ─ ─ ─ ─ 0.37 North Central and Central Coastal Area ─ ─ ─ ─ 0.34 Central Highlands ─ ─ ─ ─ 0.37 South East ─ ─ ─ ─ 0.40 Mekong River Delta ─ ─ ─ ─ 0.32
Source: VHLSS 2002, 2004, 2006, 2008; GSO, 2010
Sustainability in poverty reduction. Poverty reduction is difficult to sustain because a large proportion of households that are lifted out of poverty are at high risk of falling back into poverty. The proportion of non-poor households in 2010 that fell into poverty in 2012 was 4.2 percent, accounting for 36.5 percent of the total number of poor households in 2012.40 Poor and low-income households are highly vulnerable to external and internal risks at the community, household and individual levels. Natural disaster, extreme weather events and illness are among the highest threats to household living standards. Moreover, growing exposure to economic crises, unemployment, as well as illness, natural disaster and climate risk increases the level of household risk of falling back into poverty. This is particularly true for households in disadvantaged areas such as the Northern Midland and Mountainous Areas and the North Central and the Central Coastal Area where extreme weather events are occurring at increasing frequencies and households have limited access to social protection and financial support. It is important to develop adequate measurements to prevent these households from falling back into poverty.
40 Author’s calculation using VHLSS 2010, 2012

41
Urban poverty. While urban poverty has substantially decreased, rapid urbanization and the influx of immigrants from rural areas in recent years has challenged the raising of living standards and socio-economic development in urban areas. Poor urban residents suffer from a shortage of social capital, the capacity to find alternative livelihoods, limited access to public services and a lack of social integration. The local and migrant poor particularly have limited access to social protection systems, as they are predominantly employed in the informal sector. The high cost of living and rising prices in urban areas tend to exaggerate the economic situation of vulnerable groups. Urban poverty, especially for migrants, adversely affects sustainable poverty reduction at the national level.
Child poverty. The well-being of children not only depends on their guardians’ income but also the environment they live in. Their comprehensive development is determined by their physical, spiritual and intellectual well-being. Therefore, the measurement of child poverty involves not only economic dimensions but also eight other areas of developmental need, including education, health, nutrition, housing, clean water and sanitation, child labour prevention, entertainment and social integration, and social protection. Children are classified into the category of multidimensional poverty when their access to at least two of these eight needs is not guaranteed.
The methodology for measuring multidimensional poverty provides a more specific and comprehensive picture of children’s deprivation and poverty status compared to the child poverty rate, which is calculated on income alone. The proportion of children under 16 years of age within the multidimensional poverty category based on six domains was 20.6 percent in 2010. Although this represents a relatively rapid decrease of 28.9 percent compared to 2008, it is still a significantly high level. Multidimensional poverty based on seven domains in 2010 for children under 16 years of age was estimated at 29.6 percent. This figure amounts to more than 7 million children living with certain forms of deprivation. The two regions with the highest rates of multidimensional poverty among children are the Northern Midland and Mountainous Areas and the Mekong River Delta. Multidimensional poverty rates for ethnic minority children is particularly high.

42
MDG 2: Achieve universal primary education
Millennium Development Goal• Ensure that, by 2015, children everywhere, boys and girls alike, will
be able to complete a full course of primary schooling
SUMMARY OF PROGRESS
Vietnam has achieved universal primary education (by the national standard). By 2012, the net enrolment rate in primary education reached 97.7 percent and the net enrolment rate in lower secondary education was 87.2 percent. Inequality in access to education and quality of education still exists between ethnic majorities and ethnic minorities, between rural and urban areas. Education reform with a focus on the improving the quality of teaching and learning, as well as school facilities is essential to ensuring that Vietnam’s education system can meet the rising demand of a rapidly changing economy.
PROGRESS
Quality education is an essential factor in establishing productivity, growth and social development. Rigorous implementation of education policies and programmes over the past few years has resulted in significant improvements in access to and quality of education at every education level. In order to embrace a fast-growing economy, the government demonstrated strong commitment and determination towards systematically building a well-rounded education system with a focus on knowledge, innovation, equity and applicability during the period 2011-2020.
The net enrolment rate in primary education has slowly risen over the period 2006-2012. By 2012, the net enrolment rate in primary education reached 97.7 percent (Table 2. 1), with a total of 60 out of 63 provinces having obtained the national standard for universal primary education.41
Recognising these achievements, the country is moving towards universal lower secondary education. Universal education programmes in both primary and lower secondary education have been actively reinforced at the local level. The net enrolment rate for lower secondary education has increased consistently over the period 2006–2012, from 81 percent in 2007 to 87.2 percent in 2012. All 63 provinces have obtained the national standard for universal lower secondary education.42
41 Annual Report on Socio-economic Development 2012 by the Government of Vietnam42 Definition of universal lower secondary education at provincial level is found at 129/KH-BGDĐT

43
Table 2. 1: Net enrolment rate by education level (%)
2006-2007 2007-2008 2008-2009 2011-2012Primary education 96.0 96.1 97.0 97.7Lower secondary education 81.0 82.7 83.1 87.2
Source: Ministry of Education and Training
Literacy rates for those aged 10 and over improved slightly during 2009-2012. Literacy rates reached 94.8 percent in 2012, with 97.5 percent in urban areas and 93.6 percent in rural areas. Huge disparities exist between the Kinh and ethnic minorities despite the gap having narrowed over time. In 2012, the literacy rate among ethnic minorities was 13 percent below their Kinh counterparts (Table 2.2).
Table 2. 2: Literacy rates for population aged 10 and older (%)
2009 2010 2011 2012Total 94.0 94.0 94.4 94.8
By areas Urban 97.1 97.0 97.2 97.5 Rural 92.6 92.6 93.1 93.6
By ethnicity Kinh 96.2 96.2 96.5 96.8 Ethnic minority 79.8 81.4 82.6 83.8
Source: GSO, 2013
Primary school completion rates were relatively high at 92.1 percent in 2012, which represents an increase of 4.2 percent from 2008 (Table 2. 3). Primary completion rates remained the lowest in the Central Highlands (83.6 percent in 2012) and in the Mekong River Delta (86.4 percent in 2012).
Table 2. 3: Primary completion rates (%)
2007-2008
2008-2009
2009-2010
2010-2011
2011-2012
Total 87.9 88.5 91.5 92.2 92.1
By region Red River Delta ─ ─ 98.7 99.1 98.8 Northern Midland and Mountainous Areas ─ ─ 87.4 89.5 89.4 North Central and Central Coastal Area ─ ─ 93.8 94.5 94.6 Central Highlands ─ ─ 81.8 83.3 83.6 South East ─ ─ 96.2 96.6 96.1 Mekong River Delta ─ ─ 85.5 86.1 86.4
Source: GSO, 2013
Completion rates for lower secondary education have improved at a faster pace than for primary education, albeit at a lower level. During the period 2007-2012, completion rates for lower secondary education increased by 5.7 percent (Table 2. 4).

44
Table 2. 4: Completion rates for lower secondary education (%)
2007-2008
2008-2009
2009-2010
2010-2011
2011-2012
Total 76.4 77.6 78.0 79.1 81.3
By region
Red River Delta ─ ─ 92.9 91.8 93.2
Northern Midland and Mountainous Areas ─ ─ 79.7 81.3 84.0
North Central and Central Coastal Area ─ ─ 80.0 81.0 83.8
Central Highlands ─ ─ 69.3 71.9 74.4
South East ─ ─ 77.3 80.1 82.1
Mekong River Delta ─ ─ 62.3 64.5 66.9
Source: GSO, 2013
Significant progress has been made in building schools and improving school facilities at every education level. Substantial increases in the number of newly built schools for both basic and advanced education has helped to lift school enrolments and improve the quality of education. The government has also provided targeted support to ethnic minorities, such as education fee discounts and exemptions, and building schools in remote mountainous areas where most ethnic minorities reside. Notably, the government introduced a separate policy to support education fees for students in poor areas and for ethnic minority students throughout their schooling duration over the period 2010-2015. There have been successful in integrating multiple education support components into various socio-economic development and poverty reduction policies. More schools are able to meet the increasing demand for access to all levels of education (Table 2. 5). Every commune has one or more primary schools and lower secondary schooling is available in every district.
Table 2. 5: Number of schools at each education level
2007-2008
2008-2009
2009-2010
2010-2011
2011-2012
Kindergarten 11,629 12,190 12,357 12,908 13,172
Primary education 14,939 15,051 15,172 15,242 15,337
Lower secondary education 9,768 9,902 10,060 10,143 10,243
Upper secondary education 2,167 2,192 2,242 2,288 2,350
Professional secondary education 209 227 230 226 215
Undergraduate 160 169 173 188 204
Source: Ministry of Education and Training

45
The quality of education has improved in various ways. In addition to the increase in school numbers, the availability of teachers and school facilities has improved. At the nursery and kindergarten levels, the child to teacher ratio has decreased consistently over the period 2007-2012. This reduction implies that children at lower education levels received better care and attention from their teachers. The teacher-to-class ratio climbed significantly over the period 2007-2012 for upper secondary education, having increased by 12.9 percent. Teacher-to-class ratios also increased substantially for lower secondary education and remained relatively stable for primary education (Table 2. 6).
Table 2. 6: Teacher and classroom availability by education level
2007-2008
2008-2009
2009-2010
2010-2011
2011-2012
Children/teacher ratio
Nursery 11.52 10.90 10.32 10.12 10.45
Kindergarten 20.86 20.36 19.79 19.32 18.79
Teacher/class ratio
Primary education 1.29 1.30 1.30 1.30 1.30
Lower secondary education 1.95 2.06 2.09 2.07 2.12
Upper secondary education 2.01 2.08 2.13 2.20 2.27
Class/classroom ratio
Primary education 1.08 1.08 1.08 1.12 1.12
Lower secondary education 1.10 1.05 1.17 1.19 1.14
Upper secondary education 1.17 1.12 1.20 1.16 1.11
Source: Ministry of Education and Training
Government policies have paid adequate attention to capacity building in schools in distant locations, by improving pedagogical skills, developing suitable teaching syllabuses for teachers and education officials, and building accommodation for teachers working in these locations. The rate of qualified teachers at every education level increased considerably over the period 2007-2012 (Table 2. 7). This is evidence of positive changes in the quality of teaching and learning at both the basic and advanced education levels.

46
Table 2. 7: Percentage of teachers with standard qualifications and above (%)
2007-2008
2008-2009
2009-2010
2010-2011
2011-2012
Nursery 79.6 79.6 89.5 89.7 91.1
Kindergarten 94.3 94.7 95.4 96.0 97.1
Primary education 97.4 98.6 99.1 99.5 99.6
Lower secondary education 97.4 97.4 98.3 98.8 99.2
Upper secondary education 97.5 98.0 98.9 99.1 99.6
Source: Ministry of Education and TrainingEducation is an increasing priority for the government as well as
individual households. Between 2008 and 2011, the national education budget increased by 150 percent (Table 2. 8). Similarly, household expenses on education increased steadily and substantially between 2002 and 2010, and between 2008 and 2010 average household spending on education increased 64 percent.43
Table 2. 8: National expenditure for education and training (billion VND)
2008 2009 2010 2011
Total 74,017 80,554 95,534 106,586
Central 18,912 20,288 24,266 26,268
Local 55,105 60,266 71,268 80,318
Note: Values are adjusted to January 2008 pricesSource: Ministry of Education and Training
Ongoing national policies and programmes (2010-2015) are providing tremendous support to delivering facilities for schools located in remote mountainous areas and improving teacher qualifications. The government has set out a comprehensive list of national policies that provide support to both kindergarten and secondary education. The government’s determination to build a quality education system is highlighted in the Socio-Economic Development Strategy 2011-2010 and the Education Strategic Development Plan 2011-2020.
43 Ministry of Education and Training
CHALLENGES
Education quality. Vietnam has achieved universal primary education and access to primary education improves annually. Nevertheless, ensuring that every child completes a full course of primary schooling by 2015 is proving to be a highly challenging task. The success in primary education enrolment does not guarantee the quality of education or continuous study to higher levels. Even though the net enrolment rate for primary education has reached an impressive 97.7 percent, completion rates only stood at 92.1 percent in 2012, indicating 7.9 percent of students did not complete primary education. In lower secondary education, about 20 percent of enrolled students did not complete lower secondary education. This suggests that the payoffs to universal primary and secondary education are limited if students are not acquiring the necessary knowledge and skills for higher education and are unable to meet the changing demands of a growing economy.
Reducing school dropout rates, especially in remote areas, has been critically challenging. The main reasons for students dropping out of school are financial problems within the family and the learning capacity of students. In highly remote and disadvantaged areas, many students leave school because their parents do not encourage their children to attend school, and instead persuade them to stay home and support the family. Language barriers are among critical factors that affect learning outcomes of ethnic minorities groups. Ethnic minorities who cannot speak fluent Vietnamese encounter great difficulties in comprehending learning materials; this language barrier makes them lag behind other students in terms of learning and they drop out eventually when they find they cannot catch up with their classmates. In general, Vietnam’s education system still faces low-quality teaching and learning, particularly in disadvantaged areas. Low-quality schooling contributes significantly to insufficient learning outcomes and high dropout rates.
Low education quality can be partly attributed to inadequate school facilities, learning and teaching equipment, as well as the limited capacity of teachers and management staff within schools. In Vietnam, many school facilities are not able to cater for large student intakes. Class-to-classroom ratios at both the primary and secondary education levels are higher than one, indicating that not every class has its own classroom. The infrastructure of many public universities and colleges across the country fails to meet standard regulations.44 Much of the time, school facilities and equipment, such as laboratories and libraries, are insufficient and outdated.
44 Results from a survey conducted by Moet for 200 public universities and colleges throughout Vietnam in 2010

47
CHALLENGES
Education quality. Vietnam has achieved universal primary education and access to primary education improves annually. Nevertheless, ensuring that every child completes a full course of primary schooling by 2015 is proving to be a highly challenging task. The success in primary education enrolment does not guarantee the quality of education or continuous study to higher levels. Even though the net enrolment rate for primary education has reached an impressive 97.7 percent, completion rates only stood at 92.1 percent in 2012, indicating 7.9 percent of students did not complete primary education. In lower secondary education, about 20 percent of enrolled students did not complete lower secondary education. This suggests that the payoffs to universal primary and secondary education are limited if students are not acquiring the necessary knowledge and skills for higher education and are unable to meet the changing demands of a growing economy.
Reducing school dropout rates, especially in remote areas, has been critically challenging. The main reasons for students dropping out of school are financial problems within the family and the learning capacity of students. In highly remote and disadvantaged areas, many students leave school because their parents do not encourage their children to attend school, and instead persuade them to stay home and support the family. Language barriers are among critical factors that affect learning outcomes of ethnic minorities groups. Ethnic minorities who cannot speak fluent Vietnamese encounter great difficulties in comprehending learning materials; this language barrier makes them lag behind other students in terms of learning and they drop out eventually when they find they cannot catch up with their classmates. In general, Vietnam’s education system still faces low-quality teaching and learning, particularly in disadvantaged areas. Low-quality schooling contributes significantly to insufficient learning outcomes and high dropout rates.
Low education quality can be partly attributed to inadequate school facilities, learning and teaching equipment, as well as the limited capacity of teachers and management staff within schools. In Vietnam, many school facilities are not able to cater for large student intakes. Class-to-classroom ratios at both the primary and secondary education levels are higher than one, indicating that not every class has its own classroom. The infrastructure of many public universities and colleges across the country fails to meet standard regulations.44 Much of the time, school facilities and equipment, such as laboratories and libraries, are insufficient and outdated.
44 Results from a survey conducted by Moet for 200 public universities and colleges throughout Vietnam in 2010

48
Education inequality. Clear disparities exist in access to education between rural and urban areas, between ethnic majorities and ethnic minorities, and among geographical regions of Vietnam. Certain regions are consistently worse off than other regions across all of the education indicators. By region, the 2012 completion rates at primary education level were especially low in the Northern Midland and Mountainous Areas, Central Highlands and Mekong River Delta regions (at 89.4 percent, 83.6 percent and 86.4 percent respectively). For the same period, the Central Highlands and the Mekong River Delta continued to experience the lowest completion rates at lower secondary education level (at 74.4 percent and 66.9 percent respectively). By ethnicity, literacy amongst non-Kinh groups experienced a negligible level of improvement in 2012, and it remains relatively low at 83.8 percent. In 2012, the literacy rate for ethnic minority women and girls was even lower at 78.5 percent. Some provinces faced significantly low literacy rates in 2012 including Lai Chau (69.3 percent), Dien Bien (73.5 percent), Ha Giang (76 percent) and Son La (77.2 percent).45 Despite considerable improvement in access to education and education quality, educational performance for the most economically and socially disadvantaged groups remains consistently lower than the national average.
45 GSO, VHLSS 2012

49
MDG 3: Promote gender equality and empower women
Millennium Development Goal
Eliminate gender disparity in primary and secondary education preferably by 2005, and at all levels by 2015:• Ratio of girls to boys in primary, secondary and tertiary education• Share of women in wage employment in the non-agricultural sector• Proportion of seats held by women in national parliament
SUMMARY OF PROGRESS
Vietnam has gained remarkable results in promoting gender equality and women’s empowerment. A level of gender equality has been achieved in terms of access to primary education and mostly achieved for lower secondary education. But for higher-level education, gender equality becomes more apparent. Gender equality in employment has made significant progress; in 2012, women accounted for 48.7 percent of the national labour force, taking up 48 percent of newly created jobs. Even though women’s representation in the National Assembly has experienced a slight decline in recent years, Vietnam is in the top five developing countries in Asia with the highest number of women in the National Assembly (24.2 percent in 2011).
The government has demonstrated a strong commitment to gender equality and women’s empowerment-related activities. Following the introduction of gender equality legislation in 2006, the government established a national strategy to raise awareness about the importance of gender equality and promote the role of women in the social, economic and political arenas.
PROGRESS
Vietnam has made remarkable progress in multiple aspects of gender equality, particularly in education, employment and politics. The country has eliminated gender inequality in terms of access to primary education and women’s participation in the labour force has improved. Women’s representation in the National Assembly was 24.2 percent in 2011, a slight decrease compared to previous terms. When compared to other countries in the region or countries at similar stages of development, Vietnam has a relatively high gender equality index. The country was placed in 48th position by the Gender Inequality Index46 ranking in 201247, and ranked 58th by UNDP’s gender development index in 2008.48
46 The Gender Inequality Index relies on indicators in the areas of maternal mortality and health, adolescent fertili-ty, parliamentary representation, education attainment and labor force participation, the ranking is representative of women and girl’s opportunities.47 Human Development Report 2013: the Rise of the South, UNDP48 Vietnam Country Gender Assessment 2011, the World Bank

50
Rigorous legislative changes and social programmes aimed at institutionalizing gender equality have helped Vietnam to make a positive impact on gender equality. The importance of gender equality in socio-economic development has been acknowledged by the government through the foundation of numerous national-scale programmes and strategies on gender equality for the period 2011-2020. It has established the National Program on Gender Equality 2011-2015 and National Strategy on Gender Equality 2011-2020, to support the roll-out of the law on gender equality enacted in 2006. These initiatives exemplify the ground-breaking change that has occurred in the national approach towards gender equality in Vietnam. The year 2012 marked the first time that a national budget was allocated for implementation of the national general equality programme for the period 2011-2015.
Gender equality in education
Vietnam has eliminated gender disparity in access to primary and mostly obtained gender equality in access to lower secondary education. Between 2006 and 2010, there was no significant difference in the net enrolment rate between boys and girls in primary and lower secondary education (Table 3. 1). The difference in the net enrolment rate fluctuated between 1–2 percent, indicating equality in access to education. Net enrolment rates for boys and girls in primary education in 2010 were 92.3 percent and 91.5 percent respectively. Likewise, the difference in net enrolment rates for lower secondary education between boys and girls stood at 2.5 percent in 2010.
Table 3. 1: Net enrolment rates by education level and gender
2006 2008 2010
Primary education
Boys 89.3 88.7 92.3
Girls 89.2 87.9 91.5
Lower secondary education
Boys 78.3 77.3 80.1
Girls 79.2 79.5 82.6
Upper secondary education
Boys 51.5 50.3 53.7
Girls 56.4 58.5 63.1
Source: VHLSS 2010
Disparity in access to education becomes more apparent in upper secondary education, with the gap in net enrolment rates between boys and girls widening over time (Table 3. 1). Girls experienced a significantly higher level of access to upper secondary education than boys over the period 2006-2010.

51
Inequality in access to advanced levels of education is relatively low. The percentage of women and girls at every education level is comparable to that of men (Table 3. 2). Even at higher education levels, such as the undergraduate level, the percentage of enrolled women and girls was consistently high at 48 percent over the period 2007-2012. In professional secondary education, the rate of enrolments for girls was higher than the rate for boys.
Table 3. 2: Percentage of female students by education level
2007-2008 2008-2009 2009-2010 2010-2011 2011-2012
Kindergarten 48.7 47.7 47.4 46.2 46.7
Primary education 46.2 47.9 47.3 47.3 48.6
Lower secondary education 48.8 47.8 49.8 48.2 48.5
Upper secondary education 51.7 52.6 52.7 52.6 53.2
Professional secondary education 50.8 51.2 53.0 53.2 52.1
Undergraduate 48.4 48.5 48.6 48.3 48.2
Source: Ministry of Education and Training
Inequality in access to education for ethnic minorities has gradually narrowed. Among ethnic minority groups, school attendance rates in primary education and lower secondary education for boys and girls aged 6–14 are almost the same. The difference in school attendance rates between boys and girls dropped dramatically from 6 percent in 2002 to 0.2 percent in 2010 (Table 3. 3).
Table 3. 3: School attendance rates for ethnic minorities aged 6–14 (%)
2002 2004 2006 2008 2010Average 86.0 88.0 88.0 88.0 89.8Boys 89.0 89.0 89.0 87.0 89.7Girls 83.0 87.0 88.0 89.0 89.9
Source: GSO, 2013
Not only has equality been achieved in terms of access to education but women are also well-represented in teaching positions at higher education levels, including professional secondary and undergraduate level education. The proportion of female teaching staff rose steadily over the period 2007-2012, surpassing the participation of men. A similar trend was observed for undergraduate level education, reaching a high of 47 percent in the school year 2011–2012 (Table 3. 4). By 2012, women in teaching roles accounted for 25 percent of doctoral degree holders and 47.1 percent of master’s degree holders.49 The improvement in the representation of women among teaching staff indicates that the women’s qualifications have improved in terms of both quantity and quality.
49 Report on implementation of National Target on Gender Equality 2012, GOV

52
Table 3. 4: Percentage of female teaching staff by education level
2007-2008 2008-2009 2009-2010 2010-2011 2011-2012
Professional secondary education 49.1 49.9 48.7 51.0 53.7
Undergraduate 43.1 44.3 45.4 45.7 47.0
Source: Ministry of Education and Training
Children’s education is an increasing priority for parents and Vietnamese society in general. There has been a positive change in the perception of education and training with respect to gender. Equal opportunities to access education are given to both boys and girls by parents and the education system. Educational expenses per household on average are comparatively similar for both boys and girls; and educational expenses for girls were higher than for boys in 2010 for the first time since 2002 (Table 3. 5). This indicates that the importance of education for both boys and girls is being acknowledged, and both households and the government have spent substantial amounts on education for both boys and girls.
Table 3. 5: Average expenditure on education and training per student per household (‘000 VND)
2002 2004 2006 2008 2010Average 627 826 1211 1844 3028Boys 641 847 1240 1879 3025Girls 611 803 1180 1806 3032
Source: VHLSS 2010, GSO
Gender equality in employment
One of the key national targets on gender equality is to reduce gender gaps in the economy, labour, and employment. Over the past decade, a series of programmes creating job opportunities and promoting the employability of women have been implemented; and they have achieved remarkable results. Decision 295/QD-TTg, which was approved by the government as part of the project entitled “Providing vocational training, creating jobs for women during the period 2010-2015”, has helped improve women’s competitiveness in the employment market, and enabled them to find more stable and better-paid jobs, securing their source of income. Women took up more than 48 percent of the newly created jobs in 2012, according to The Labour and Employment Study 2012.
Employment improved consistently for both men and women during the period 2010-2012. The labour participation rate for the population aged 15 years and older experienced a slight increase between 2010 and 2012; although the gender gap narrowed, it remained wide at 8.9 percent with a higher level for men. During the period 2010–2012, a minor decrease was experienced for both men and women in the percentage of own account and family workers for the population aged 15 years and older (Table 3. 6). Nevertheless, own

53
account workers and family workers remain the most common forms of employment. The significant progress made in gender equality in employment is illustrated by substantial increases in the participation rate of the population aged 15 years and older in wage employment in the non-farm sector for both men and women during the period 2002-2010 (at 12.4 percent and 28 percent respectively). By 2012, 46 percent of workers had undergone training.
Table 3. 6: Percentage of labour aged 15 years and older by type of employment (%)
2010 2011 2012 (Preliminary)
Total Men Women Total Men Female Total Male Female
Percentage of labour aged 15 and older who has a job over population aged 15 and older
74.6 79.4 70.2 75.5 80.3 70.9 75.4 80.0 71.1
Percentage of own account worker or family worker over the population aged 15 and older who has a job
63.2 56.6 70.3 62.4 55.9 69.4 62.5 56.3 69.1
Source: GSO, 2013
The difference in average working hours per person aged 15 years and older per week for his or her main job increased consistently over the period 2002-2010. On average, men spent more than two hours per week in their main job, compared to women in 2010. This might indicate that men experience lower rates of underemployment than women. For wage employment in non-farm employment, men and women worked the same average hours per week in 2010 (Table 3.7).
Table 3. 7: Average working hours by type of employment
2002 2004 2006 2008 2010
Percentage of population aged 15 and above working as wage employment in non-farm employment
Male 27.8 32.6 34.2 35.5 40.2
Female 16.8 20.0 22.4 24.2 28.0
Average working hours per week per person aged 15 and above in wage employment in non-farm employment (hour)
Male 39.3 39.6 40.5 41.1 41.1
Female 40.3 40.9 41.3 41.8 41.1
Average working hours per week per person aged 15 and above in main job (hour)
Male 32.8 32.2 33.2 33.5 33.7
Female 32.6 31.6 32.7 32.7 31.7
Source: VHLSS 2010, GSO

54
By the final quarter of 2013, the number of men in skilled labourer jobs was higher than the corresponding figure for women (5,133,900 men compared to 3,749,700 women). Some 19.1 percent of men aged 15 years and older employed as labourers were skilled workers and the corresponding rate for women was 14.9 percent. The number of men working in wage employment was substantially higher than for women (10,959,700 men compared to 7,373,200 women). Among the population aged 15 years and older who had a job, 40.9 percent of men were working in wage employment; women accounted for 29.3 percent of the total number of women aged 15 years and older who had a job. The difference between percentage of wage employment workers for men and women was as high as 11.6 percent. Moreover, with regard to wage employment workers, the average monthly salary for men employed as labourers in wage employment aged 15 years and older was substantially higher than women (Table 3. 8). This indicates a clear disparity in the quality of employment between men and women employed as labourers; with women at a higher disadvantage in terms of employment.
Table 3. 8: Employment situation in the fourth quarter of 2013 (‘000 people)
Number of skilled labourers
Number of wage employment
workers
Population aged 15 and
above
Population aged 15 and older that
have job
Average monthly salary of wage employment workers (‘000 VND)
Men 5133.9 10959.7 33449.6 26773.6 3952.0
Women 3749.7 7373.2 35372.3 25157.3 3586.0
Total 8883.6 18332.9 68821.9 51930.9 3805.0 (average)
Source: GSO, 2013
Gender equality in management and leadershipWomen’s roles in management and leadership positions in both
corporations and government agencies have strengthened over recent years, which is the result of government and community efforts to empower and engage women in social and economic activities. Women now have greater opportunities to develop their careers, and fortify their place in society. According to the latest government report, 46.6 percent of central and governmental agencies have women in leadership positions, indicating a 6.6 percent increase from 2011. The percentage of women holding the highest position in enterprises increased from 20.8 percent in 2009 to 24.7 percent in 2011.50
Women’s representation in the National Assembly has improved significantly over the last two decades. The proportion of seats held by women has remained relatively high over the last four terms. Even though the proportion of seats held by women in the National Assembly has decreased by 1.6 percent during the 2007-2011 term to 24.2 percent during the 2011-2016 term, Vietnam is one of five developing countries in Asia that has the highest proportion of seats for women in the National Assembly (Figure 3. 1).50 GSO, 2013

55
Figure 3. 1: Percentage of women in the National Assembly (%)
Source: National Assembly
CHALLENGES
Gender inequality in higher education and among disadvantaged groups. Even though Vietnam has achieved universal primary education and almost eliminated gender inequality in access to lower secondary education, enrolment rates for girls in higher level education in rural and remote areas, and among ethnic minority communities, is much lower than for boys. A substantial gap existed in literacy rates between ethnic minority boys and girls aged 10 years and older during the period 2009-2012. In 2012, the literacy rate for ethnic minority girls aged 10 years and older was 10.8 percent lower than that of men. In highly disadvantaged areas such as the Northern Midland and Mountainous Areas, boys demonstrated higher levels of literacy than girls; although this gap has narrowed, it remained at a relatively high 7.8 percent in 2012.
Gender inequality in employment. Gender inequality persists in the labour market. The rate of participation in the labour force is higher for men, who have better access to decent employment opportunities. In 2011, labour participation rates for women stood at 72.6 percent, which is 9.1 percent lower than men.51 Women account for the majority of labourers in vulnerable types of jobs, particularly in the informal sector. Women in the informal sector have fewer skills and limited access to skill development and training programmes compared to men. Over the period 2009-2011, women accounted for 64 percent of family workers52─this type of employment does not provide any form of social security nor job guarantee in the long term. Over the same period, women accounted for only 40 percent of the total wage employment labour force, 20 percent lower than men’s participation in wage employment.
Representation of women in the National Assembly. Women’s representation in the National Assembly remained relatively high at 24.2 percent for the term 2011–2016, which is the lowest rate recorded in the last four terms. In general, fewer women have reportedly run for official positions and they have also experienced lower election rates compared to men. The 2011 figures show female candidates accounted for only 34.1
51 Labor and Employment Survey 2011, GSO; UNDP Human Development Report 2013 displayed labour force par-ticipation rates for those aged 15 years and older at 73.2 percent for women, 81.2 percent for men52 Labor and Employment Survey 2011, GSO

56
percent of the whole candidate pool and rates of election for women are 20 percent lower than for men.53
Gender-based domestic violence. Domestic violence has been a growing problem in Vietnamese society, creating obstacles to the development of both families and the society as a whole. Domestic violence has serious consequences for the physical and mental health of its victims. Some 33,914 people were reported to be victims of domestic violence in 201254, of which 85.1 percent were women. The National Study on Domestic Violence against Women in Vietnam 2010 reported that one in every three women who have ever been married have suffered from physical or sexual violence caused by their husbands, and 58 percent of Vietnamese women reported experiencing at least one among three types of domestic violence in their lifetime (physical, sexual or emotional violence). The study also highlights a concerning increase in the rate of victims (87.1 percent) failing to seek help from any agency or person in authority for three main reasons: the perception that violence is not a serious problem; the fear that seeking helping might harm their family’s reputation; and feeling ashamed. It is therefore essential to encourage victims of domestic violence to speak out and seek help from society.
Gender-biased perception. Gender-biased perception with a preference for men contributes to the ample evidence of continuing gender inequality. Despite the government’s adoption of the Law on Gender Equality and the Law on Domestic Violence Prevention and Control, limited knowledge and access to legal information persists which contributes to the perpetuation of gender inequality. Gender bias causes men and boys to be more highly respected and given more privileges than women and girls in family and society. Many families still have preference for sons, especially in rural and ethnic minority households, and this situation seems to have worsened over recent years. Three main reasons for increasing the sex ratio at birth have been identified, including a preference for sons in society; the development of medical facilities that allow for gender prediction during pregnancy and abortion; and family planning and economic and social protection factors. Disparity in the boy-to-girl ratio at birth amplified significantly between 2010 and 2012. In 2010, the ratio stood at 111.2 to 100, while in 2011 and 2012 it reached 111.9 to 110 and 112.3 to 100 respectively.55 The gender prediction before birth reflects the gravity of gender inequality. This situation poses a potential threat to improving the gender balance in the future population structure, and disrupts demographic characteristics in family structures and the marriage system.
53 Inter-parliamentary Union54 Report on the Implementation of National Target on Gender Equality in 2012, the Government of Vietnam55 Annual Report on Socio-economic Development 2012 by the Government of Vietnam

57
MDG 4: Reduce child mortality rate
Millennium Development Goal
• Between 1990 and 2015, reduce the under-five mortality rate by two thirds
SUMMARY OF PROGRESS
The under-five mortality rate and infant mortality rate declined from 58 percent and 44.4 percent in 1990 to 23.3 percent and 15.5 percent respectively by 2011. By 2012, the infant mortality rate was estimated at 15 percent, which is only 0.2 percent above the 2015 target. The under-one immunization rate for measles substantially increased from 55 percent in 1990 to 97.1 percent in 2005, and has remained above 90 percent ever since.
Despite recent achievements, Vietnam still faces great challenges with regard to inequitable levels of access among children to healthcare across regions, ethnicities and income quintiles. The implementation of free healthcare insurance for children under six years of age remains ineffective, while the quality of child healthcare in terms of services, medicines and vaccines is declining, causing rising public concern.
PROGRESS
Infant mortality rate
The infant mortality rate declined substantially from 44.4 percent in 1990 to 15.8 percent in 2010. By 2011 it had reached 15.5 percent, and by 2012 it was at 15 percent. Given the 2015 goal is 14.8 percent, Vietnam is only 0.2 percent from its target. If current progress is sustained, there is the high possibility that Vietnam will obtain its goal for reducing infant mortality (Figure 4. 1).

58
Figure 4. 1: Infant mortality rate (%)
Source: GSO
A downward trend in child mortality is apparent in all regions across the country. The national annual infant mortality reduction rate during 2001-2011 was estimated at 1.3 percent. Nevertheless, the rate of reduction varies from area to area. The Central Highlands has the highest rate of reduction, at around 3.1 percent per year, whereas the Red River Delta reports the lowest annual rate of reduction (at approximately 0.7 percent).56
Under-five mortality rate
There has been a significant reduction of more than 50 percent in the under-five mortality rate over the past two decades. Having fallen from 58 percent in 1990 to 23 percent in 2010, Vietnam’s under-five mortality rate is one of among four ASEAN nations with the lowest rate.57 The under-five mortality rate continued to decrease to 23.3 percent and 23.2 percent in 2011 and 2012 respectively (Figure 4. 2); however the rate of reduction has slowed since 2005. Therefore, to achieve its 2015 goal, greater efforts are needed to address factors causing deaths among children under five years of age.
Figure 4. 2: Under-five mortality rate (%)
Source: GSO
56 Ministry of Health, (2012). Health related Millennium Development Goals Vietnam, 2012: Equity Analysis. Hanoi. 57 Annex

59
Neonatal mortality rate or newborn mortality58
Newborn58mortality or the neonatal mortality rate significantly contributes to both the infant mortality rate as well as the under-five mortality rate. The neonatal mortality rate has not been tracked as a national indicator. There are some available data sources for Vietnam but there are inconsistencies between existing data, which is partly explained by the fact that not all newborns are registered immediately after their birth, and more than half of the infants who die within one month of birth are unregistered.59 A 2011 report prepared by WHO, UNICEF, The World Bank and the UN’s Population Division reveals that the Vietnam’s neonatal mortality rate has dropped from 23 percent in 1990 to 12 percent in 2010. Overall, the reduction is not as significant as those for the under-five mortality rate and the infant mortality rate. Health statics yearbook data suggests a noticeably lower rate, with the 2007-2008 neonatal mortality rated as low as 7 percent nationwide.
Figures on neonatal deaths differ greatly between existing sources. While data from the Health Management Information System reports 6,263 cases in 2010, this figure is far below the figure estimated by WHO, which reports it to be almost three times higher at 18,000 cases per annum. This indicates an under-reporting issue for health-related indicators, which creates difficulties in official analysis, monitoring and evaluation.
Child immunization
Initiated in 1981, Vietnam’s Expanded Programme on Immunization has been extended to cover every commune the country to introduce six vaccines against dangerous infectious diseases (BCG, diphtheria, pertussis, tetanus, measles and polio) from 1985. At present, eight types of vaccine have been provided free to children under the age of one year to protect them from tuberculosis (TB), diphtheria, pertussis, tetanus, hepatitis B, measles, polio and pneumonia/meningitis caused by Hib.60 Wide coverage and continuous provision of advanced vaccines have actively contributed to recent dramatic reductions in the mortality rate among children under five years of age.
58 Neonatal mortality rate (NMR) is the number of deaths during the first 28 completed days of life per 1,000 live births in a given year or period.59 Knowles, J. C., S. Bales, et al. (2008). Health equity in Vietnam: A situational analysis focused on maternal and child mortality “Equity in Access to Quality Healthcare for Women and Children” Halong, Vietnam, UNICEF Vietnam.60 National Institute of Hygiene and Epidemiology (NIHE). (2010). 20-year achievements of EPI (1985-2010). Accessed on 05/08/2013 on http://www.nihe.org.vn/new-en/chuong-trinh-tiem-chung-mo-rong-quoc-gia-703261429/1096/20-year-achievements-of-EPI-1985─2010.vhtm

60
By 2011, full immunization for children under one year of age had reached the target of more than 90 percent coverage of children in 59 out of 63 provinces (93.6 percent). In the four remaining provinces, more than 83.3 percent of children had received full immunisation.61 The proportion of children under one year of age immunized against measles significantly rose from 55 percent in 1990 to 97.1 percent in 2005, and remains higher than 90 percent. The Expanded Programme on Immunization has achieved polio eradication within 10 years and neonatal tetanus elimination within five years, and has enabled Vietnam to realize its target for reducing the number of cases of vaccine-preventable diseases. Vietnam is moving closer to realising its goal to eliminate measles.6263
Breastfeeding
Breastfeeding is believed to be the best source of nourishment for infants and young children and is one of the most effective ways to ensure child health and survival. If every child was breastfed within an hour of birth, given only breastmilk for the first six months of its life, and continued to be breastfed up to the age of two, about 220,000 child lives would be saved every year.64
Despite the obvious positive effects of breastfeeding on child health, the number of babies breastfed within one hour of birth in Vietnam remains relatively low, at 57.8 percent in 2005, with an increase to approximately 68 percent in 2010. The figure is still far from the 85-percent target set by the Safe Motherhood Action Plan.6566
WHO recommends exclusive breastfeeding for the first six months after birth. Since the breastfeeding programme was implemented in Vietnam more than two decades ago, the rate of exclusive breastfeeding has been low and has not significantly increased over time. The National Institute of Nutrition’s Annual Report 2010 suggests that only 12 percent of infants were exclusively breastfed at six months old in 2005, and this figure rose to approximately 19.6 percent in 2010.67 The rate of exclusive breastfeeding among infants under six months is only half of the global
61 National Institute of Hygiene and Epidemiology (NIHE). (2012).EPI: Annual review report 2008-2011.62 National Institute of Hygiene and Epidemiology (NIHE). (2010). 20-year achievements of EPI (1985-2010). Accessed on 08/05/2013 on http://www.nihe.org.vn/new-en/chuong-trinh-tiem-chung-mo-rong-quoc-gia-703261429/1096/20-year-achievements-of-EPI-1985─2010.vhtm63 Taking in to account the indicator of proportion of under-1-year-old children immunized against measles, the data from MICS4 showed lower coverage than other vaccines at 84.2 percent. The highest coverage rate was for BCG at 95 percent; the first dose of DPT was 93.5 percent and decreased for the second and the third doses at 86.2 percent and 73 percent, respectively. With regard to full immunization for children under-one-year, the data from MICS4 showed just two out of five children between 12 and 23 months are fully immunized.64 WHO. (2013). 10 facts on breastfeeding. Accessed on 05/08/2013 http://www.who.int/features/factfiles/breastfeed-ing/en/index.html65 National Institute of Nutrition annual report 201066 According to MICS3 and MICS4, the proportion of mothers that initiate breastfeeding in the first hour decreased from 57.8 percent in 2006 to 39.7 percent in 2010.67 National Institute of Nutrition (NIN). (2010). Annual report 2010.

61
rate and among the lowest rates in South-East Asia.68 This situation calls for more adequate breastfeeding counselling and support in order to ensure optimal breastfeeding practices. According to Vietnam’s labour legislation, maternity leave has been extended from four months to six months so that mothers can practice exclusive breastfeeding in the first six months, reflecting the government’s strong commitment to improving maternal and child healthcare.
CHALLENGES
Inequality in healthcare opportunities
Substantial decreases in child mortality and enhancement in child nutrition demonstrate notable healthcare improvements, yet disparities still exist among ethnicities, regions and income groups, and this gap tends to widen over time. The under-five mortality rate varies across regions throughout Vietnam. It is roughly three times higher in the region with the highest rate (Central Highlands at 37%) compared with the region with the lowest rate (South East region at 13.9%) (Figure 4. 3).
Urban and rural areas also show disparities in child mortality indictors with an infant mortality rate in rural areas 1.6 times higher than in urban areas. The urban-rural disparity has tended to increase over recent years. Progress in reducing the child mortality rate has been made in almost every region, but the reduction rate differs across geographical areas (Table 4. 1). The underlying cause of this is explained by socio-economic disparities among different geographical regions, resulting in a striking discrepancy in living conditions in terms of sanitation and hygiene, and access to healthcare services.
Figure 4. 3: U5MR by region in 2011 (%)
Source: GSO
68 WHO estimates that globally, nearly 40 percent of infants under six months are exclusively breastfed (WHO, (2013). 10 facts on breastfeeding. Accessed 05/08/2013 http://www.who.int/features/factfiles/breastfeeding/en/index.html)

62
Table 4. 1: Infant mortality rate, 2001–2011 (%)
2001 2003 2005 2007 2009 2011
By areas
Urban 20.0 13.0 ─ ─ 10.0 8.5 Rural 33.0 21.0 ─ ─ 18.7 18.1By geographical regions
Red River Delta 20.0 15.0 11.5 10.0 12.4 12.5 Northern Midland and Mountainous Areas 37.3 30.6 26.1 23.5 24.5 23.0 North Central and Central Coastal Area 34.6 20.0 22.2 18.8 17.2 17.1 Central Highlands 58.0 29.0 28.8 27.0 27.3 24.3 South East 21.0 10.0 10.6 10.0 10.0 9.3 Mekong River Delta 28.1 13.0 14.4 11.0 13.3 12.2Total 30.0 21.0 18.0 16.0 16.0 15.5
Source: GSO
While there are persistent decreases in the infant mortality rate and the under-five mortality rate at the national level and for the Kinh and Hoa, these rates have risen among ethnic minority groups.69 The gap between majority and minority groups has tended to widen from 2006 to 2011. In 2006, the infant mortality rate and the under-five mortality rate among ethnic minorities were approximately 1.4 times higher than those for their Kinh and Hoa counterparts. This gap increased threefold in 2011 and the rates for minority groups have become increasingly higher than the national averages (Figure 4. 4).
Figure 4. 4: IMR and U5MR by ethnicity, 2006-2011
Source: MICS3 and MICS4
69 MICS3 and MICS4

63
Ineffective implementation of children’s health insurance
Children under the age of six have free access to healthcare as stipulated by Decree No 36/2005/ND-CP (issued in March 2005). Free health insurance cards have been distributed to children under six since 2009. However, 2012 statistics from the Ministry of Health suggest that around 2 million children under six years of age around the country who remain without the protection of health insurance because of ineffective coordination between the relevant government departments and insurance agencies in the localities. Most of these children reside in remote areas or in households with migrant parents. When admitted to hospital for medical check-ups or treatment, children without insurance cards are required to present their birth certificates. In such circumstances, healthcare costs have to be borne by parents or caregivers.70
Other concerns regarding quality of childcare services
Emerging issues in child healthcare involves a number of accidents in newborn care services, medicines and vaccines and especially the declining ethics of a small group of health workers. Some accidents have been recently reported in childcare services, in which negative reactions to vaccines have caused a number of child deaths, and a provincial vaccine centre used expired vaccines for children. These recently exposed incidents triggered deep public concern71; they erode public trust, challenge national health schemes and threaten the success of immunization programmes.
70 Vietnam News Agency. (2012). Problematic Health Insurance for Children under 6 years old in Vietnam. Accessed on August 6th 2013 on http://www.vietnamplus.vn/Home/Bao-hiem-y-te-cho-tre-duoi-6-tuoi-con-nhieu-bat-cap/20127/151479.vnplus71 Vietnam News. (2013). Vaccine frauds threaten national health schemes. Accessed on August 6th 2013 on http://vietnamnews.vn/talk-around-town/239986/vaccine-frauds-threaten-national-health-schemes.html

64
MDG 5: Improve maternal health
Millennium Development Goal
•Reduce by three quarters, between 1990 and 2015, the maternal mortality ratio
•Achieve, by 2015, universal access to reproductive health
SUMMARY OF PROGRESS
The maternal mortality rate in Vietnam had substantially dropped by more than two thirds, from 233 per 100,000 in 1990 to 64 per 100,000 in 2012. Vietnam has made noticeable progress in improving maternal healthcare services and ensuring better access to adequate healthcare, especially antenatal care at all levels across the country. In 2011, it was reported that 86.5 percent of pregnant women receive an antenatal check-up in each trimester, which is only 0.5 percent below Vietnam’s 2015 goal. The proportion of deliveries attended by trained health personnel rose from 86 percent in 2001 to 96.7 percent in 2011.
The reduction in maternal mortality has slowed since 2006. Disparities remain in the health status of women across geographical regions, ethnicities and income quintiles persist. The adolescent birth rate keeps rising while the unmet need for family planning is at a high level. The situation highlights the necessity for more rigorous policies and programmes in order to improve maternal and reproductive healthcare services, especially in remote and most economically disadvantaged areas.
PROGRESS
Maternal mortality rate 72
Figure 5. 1: Maternal mortality rate (per 100,000 live births)72
Source: GSO, 2012
72 The maternal mortality ratio is the ratio of women who die from causes related to pregnancy and childbirth in the period from pregnancy until 42 days after delivery, on average 100,000 children born during the study period, usually a calendar year.

65
Rapid progress in reducing the rate of maternal mortality has been recorded during the past two decades. The maternal mortality rate73 has substantially dropped by more than two thirds from 233 per 100,000 in 1990 to 64 per 100,000 in 2012. However, progress has slowed since 2006 when the annual decline reached about 1.5 per 100,000, compared to the high annual rate of nearly 10 per 100,000 during the previous years (Figure 5. 1). To achieve the 2015 goal of 58.3 per 100,000, it is estimated that the maternal mortality rate should decrease at an annual rate of 1.7 per 100,000. There is a need for more rigorous policies and programmes, especially for targeted remote areas to ensure access to maternal healthcare, as well as to improve service quality to women of reproductive age.74
Antenatal care coverage and proportion of births attended by skilled health personnel
Antenatal care and attendance of skilled health workers at births significantly contributes to improving maternal health, reducing the risk of death at birth and promoting the health and well-being of infants. Growing attention has been paid to antenatal care as an intervention to improve both maternal and newborn health in Vietnam. As a result, the proportion of pregnant women receiving at least three antenatal check-ups and the proportion of deliveries attended by trained health personnel have notably improved over recent decades.
WHO recommends four antenatal clinic visits during pregnancy to ensure all benefits are available to women and their unborn babies.75 The 2011 Multiple Indicator Cluster Survey estimated that in Vietnam the proportion of pregnant women receiving at least one antenatal check-up is around 93.7 percent, while about 59.6 percent made four antenatal visits during their last pregnancy. The rate of women that made three antenatal visits per pregnancy was reported at 86.5 percent in 2011, which is a substantial recovery from 2010, and only 0.5 percent below the 2015 goal.
The proportion of deliveries attended by trained health personnel rose from 86 percent in 2001 to 96.7 percent in 20117677(Figure 5. 2). The coverage is much higher than other countries in the Western Pacific region (about 75 percent).78 Vietnam nearly reached the MDG 5 (97 percent) in 2006 when the national figure reached 97 percent, but after that the proportion fell by 3 to 4 percent in the following years and has only showed improvements since 2009.
73 The maternal mortality ratio is the ratio of women who die from causes related to pregnancy and childbirth in the period from pregnancy until 42 days after delivery, on average 100,000 children born during the study period, usually a calendar year.74 Ministry of Health (2012). Health related Millennium Development Goals Vietnam, 2012: Equity Analysis. Hanoi.75 WHO (2007). Standards for Maternal and Neonatal Care. Department of Making Pregnancy Safer: Geneva. 2007.76 UNFPA (2007). Skilled attendance at birth: Making motherhood safer.77 MOH (2009). Safe Motherhood Program: Maternal Mortality in 14 provinces of Safe Motherhood Program. Programme with support from the Dutch Government.78 United Nations (UN) (2012). The Millennium Development Goals Report 2012.

66
Figure 5. 2: Proportion of births attended by trained health personnel, 2000-2011
Source: HMIS and MOHRegionally, the 2000, 2006 and 2010 Multiple Indicator Cluster surveys79
revealed increases in the number of births involving skilled health staff across all regions. Accordingly, by 2011 some regions such as the Red River Delta, North Central and Central Coastal Area, South East and Mekong River Delta reported that more than 90 percent of women were assisted by skilled attendants at their deliveries. These rates have climbed to almost 100 percent in the Red River Delta and Mekong River Delta regions. These rates have risen at a dramatic pace in other areas including the Central Highlands and the Northern Midland and Mountainous Areas, though they remain relatively lower than those of other regions and the national average.
Contraceptive prevalence rate
Contraceptive prevalence rate is calculated as the proportion of women who are using any contraception methods among women aged 15-49, married or with partners. The prevalence of contraception use moderately increased from 73.9 percent in 2001 to 78.2 percent in 2011 (Figure 5. 3). Intra-uterine devices remain the most popular contraception method; in 2011 they accounted for more than 60 percent of women who reported using modern contraceptive methods. The rate of traditional contraceptive use is 12.1 percent. The percentage of women who use more effective methods, such as the pill and condoms, has increased over recent years but remains relatively low.
79 GSO. (2011). The Multiple Indicator Cluster Surveys 4 (MICS4), GSO. (2006). The Multiple Indicator Cluster Surveys 3 (MICS3), GSO. (2000). The Multiple Indicator Cluster Surveys 2 (MICS2)
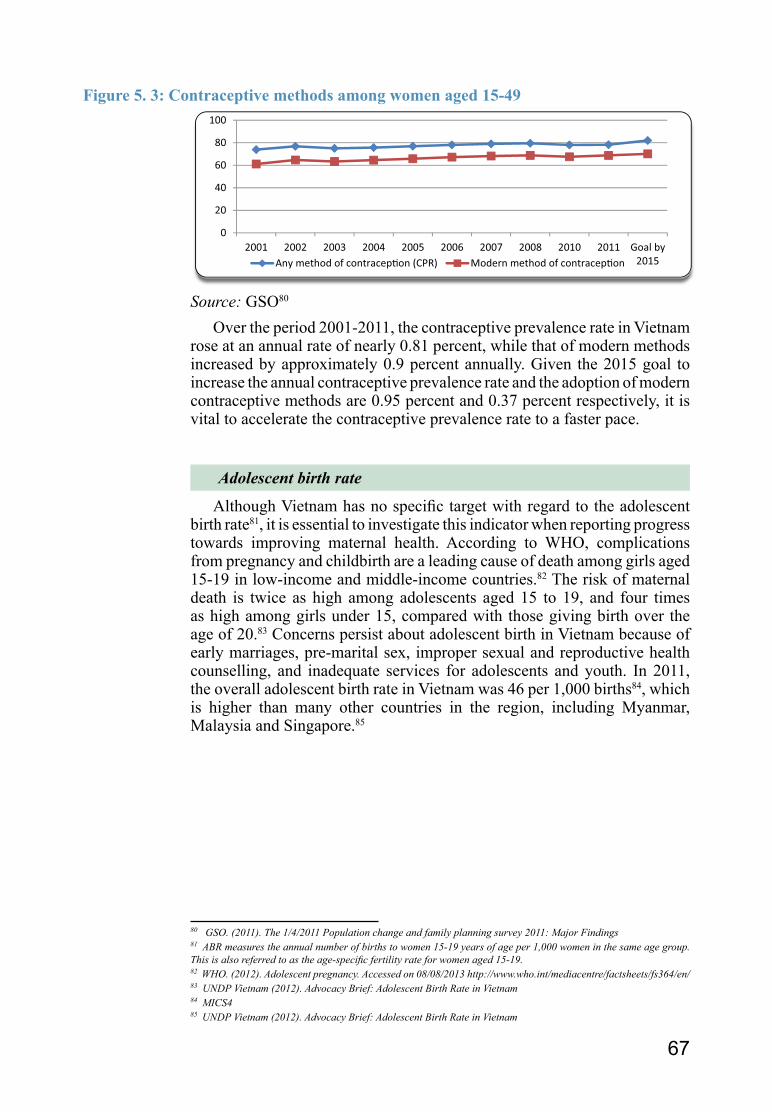
67
Figure 5. 3: Contraceptive methods among women aged 15-49
Source: GSO80
Over the period 2001-2011, the contraceptive prevalence rate in Vietnam rose at an annual rate of nearly 0.81 percent, while that of modern methods increased by approximately 0.9 percent annually. Given the 2015 goal to increase the annual contraceptive prevalence rate and the adoption of modern contraceptive methods are 0.95 percent and 0.37 percent respectively, it is vital to accelerate the contraceptive prevalence rate to a faster pace.
Adolescent birth rate
Although Vietnam has no specific target with regard to the adolescent birth rate81, it is essential to investigate this indicator when reporting progress towards improving maternal health. According to WHO, complications from pregnancy and childbirth are a leading cause of death among girls aged 15-19 in low-income and middle-income countries.82 The risk of maternal death is twice as high among adolescents aged 15 to 19, and four times as high among girls under 15, compared with those giving birth over the age of 20.83 Concerns persist about adolescent birth in Vietnam because of early marriages, pre-marital sex, improper sexual and reproductive health counselling, and inadequate services for adolescents and youth. In 2011, the overall adolescent birth rate in Vietnam was 46 per 1,000 births84, which is higher than many other countries in the region, including Myanmar, Malaysia and Singapore.85
80 GSO. (2011). The 1/4/2011 Population change and family planning survey 2011: Major Findings81 ABR measures the annual number of births to women 15-19 years of age per 1,000 women in the same age group. This is also referred to as the age-specific fertility rate for women aged 15-19.82 WHO. (2012). Adolescent pregnancy. Accessed on 08/08/2013 http://www.who.int/mediacentre/factsheets/fs364/en/83 UNDP Vietnam (2012). Advocacy Brief: Adolescent Birth Rate in Vietnam84 MICS485 UNDP Vietnam (2012). Advocacy Brief: Adolescent Birth Rate in Vietnam

68
CHALLENGES
Disparities in women’s health status. Every maternal health indicator suggests a far more disadvantaged situation for women residing in rural, remote and mountainous areas, women with lower levels of education, poor households and ethnic minorities than other women. With regard to maternal mortality rates, the Northern Midland and Mountainous Areas and the Central Highlands have the highest rates, while the Red River Delta and the South East have the lowest rates. The gap between these regions has narrowed, but it remains large, the former exceeding the latter by approximately 2.5 times in 2007. The 2010 Multiple Indicator Cluster Survey data also indicates that maternal mortality rates vary vastly between the most economically disadvantaged/poorest districts and the national average. Accordingly, maternal mortality rates are twice as high as the national average in 225 economically disadvantaged districts (104 per 100,000 live births) and five times higher in the 62 poorest districts (157 per 100,000 live births). Likewise, the maternal mortality rate in rural areas is 2.5 to 3 times that of urban areas over the period 2002-2006.86 By education level, ethnicity and occupational status, the maternal mortality rate of illiterate mothers is four to six times higher than the literate group, while those among ethnic minorities (Mong, Thai, Ba Na, Tay, Dao and Nung) are approximately four times higher than the Kinh group, and those among women in the agricultural sector are four to six times higher than those engaged in civil work.87
When it comes to the amount of antenatal care and the number of births attended by skilled health personnel there is a clear disparity among ethnicities, socio-economic levels and geographical regions. Accordingly, the rates of antenatal care visits among pregnant women residing in urban areas, women with higher education, women in rich income quintiles and the Kinh group are remarkably higher than those in rural areas, where they have lower education, are in poorer income quintiles or belong to ethnic minority groups.88 Similarly, women of the poorest quintile and minority groups are less likely to give birth with the assistance of trained health workers than those of higher income and majority groups. Only 63 percent of ethnic minority women have their deliveries attended by skilled staff, in comparison with 98 percent of their majority counterparts.89
With regard to the rate of adolescent birth, there were also notable variations among geographical regions of Vietnam. At 65 per 1,000 births, the adolescent birth rate was by far the highest in the Northern Midland and Mountainous Areas, which is nearly 2.5 times higher than that in the Red River Delta where it was lowest (at around 25 per 1,000) in 2011 (Figure 5. 4).
86 Source: MOH 2001Health Strategy and Policy Institute (HSPI) MOH 200687 MOH (2010). National Maternal and Neonatal Mortality Survey in Vietnam 2006-2007. Health Strategy and Policy Institute.MOH. (2002). Maternal Mortality Survey 2002. Maternal and Child Health Department.88 MICS3 and MICS 4, MOH. (2010). Health Statistical Yearbook89 MICS3 and MICS4

69
Figure 5. 4: Adolescent birth rate by region (per 1,000 births), 2010-2011
Source: GSO90
Besides the different economic status of the various regions of Vietnam, one of the most important factors contributing to disparities in maternal health indictors is the prevalent adoption of poor traditional healthcare practices, especially among ethnic minorities, remote and most economically disadvantaged communities. To address this problem, it is vital to expand awareness-raising campaigns targeting women of disadvantaged groups to abandon old-fashioned customs and encourage modern healthcare uptake during pregnancy and childbearing periods.
Although close attention has been paid to maternal health services, healthcare infrastructure, medical facilities and competent medical staff are still limited. Poor healthcare infrastructure and a severe shortage of staff at the local level results in overcrowding at national and provincial hospitals. Obstetric human resources are a concern. A recent Ministry of Health review suggests that only 53 percent of healthcare workers can provide active management of the third stage of delivery─the number of providers able to perform manual removal of a placenta is limited. Three-year training programmes covering 30 core competencies of skilled birth attendants only target obstetric specialists and college midwives.91 There is a need to deliver training for other health providers at the national level. With regard to antenatal care, the quality of antenatal care remains relatively poor despite the recent improvements in target coverage. Only 42.5 percent of women receive blood pressure, urine and blood tests.92
Unmet need for family planning.93 Family planning is an essential human right. Family planning programmes can significantly contribute to reducing poverty and hunger, and have the potential to prevent 25 percent of all maternal deaths and nearly 10 percent of childhood deaths.94 Despite rising awareness amongst women of the importance of family planning and the growing prevalence of contraceptive use in recent years, the high level of demand for contraception that is not being met, especially among unmarried women, and particularly for modern contraceptives, indicates that the
90 General Statistics Office Vietnam, The 2011 population change and family planning survey. Major findings. 2012.91 Ministry of Health and United Nations in Vietnam. (2011). Review of Skilled Birth Attendants in Vietnam. Hanoi.92 MICS4 201193 Unmet need for family planning is the proportion of women who have unmet need for family planning among women aged 15-49, married or in union (percent).94 UNDP Vietnam. (2012). Advocacy Brief: Unmet need for family planning in Vietnam.

70
options for Vietnamese women are often limited. In general, the unmet need for family planning among married women is 4.3 percent. Women from the poorest quintile and from ethnic minority groups also have the highest unmet need compared to those from other income quintiles and majority groups.95
The proportion of unmet family planning needs among unmarried women remains at a very high level. It is estimated that more than one third (34.3 percent) of unmarried women have an unmet need for contraception and the unmet need for modern methods is remarkably higher at 50.4 percent.96 Constraints in accessing contraception methods result in a significant number of unwanted pregnancies and unsafe abortions every year.
Substantial cultural and social barriers exist to accessing family planning in Vietnam. Misconceptions on reproductive health, as well as on the use of condoms, are still prevalent in society. In many regions and communities, family planning is seen as the sole responsibility of women. Women have to make their own decisions regarding family planning matters. Provision of information on reproductive health remains inadequate, especially among young women.
95 MICS496 UNDP Vietnam. (2012). Advocacy Brief: Unmet need for family planning in Vietnam.

71
MDG 6: Combat HIV/AIDS, malaria and other diseases
Millennium Development Goal• By 2015, halt and begin to reverse the spread of HIV/AIDS
• Achieve, by 2010, universal access to treatment for HIV/AIDS for those who need it• By 2015, halt and begin to reverse the incidence of malaria and other major diseases
SUMMARY OF PROGRESS
The reported number of HIV cases in 2012 dropped by 22 percent, and the number of deaths decreased almost threefold, compared to 2011. The number of newly identified HIV cases declined by 31.5 percent during the period 2001-2012. Overall, Vietnam has reduced HIV prevalence to under 0.3 percent. By the end of 2011, approximately 57,663 adults and 3,261 children had received antiretroviral therapy, almost 22 times higher compared to 2005, and 1.5 times higher than in 2009.
In 2011, Vietnam achieved its goal for controlling malaria. Vietnam also surpassed the global target regarding TB control when it successfully reduced the number of new cases and deaths by 62 percent from 1990 levels.
Vietnam faces significant challenges if it is to sustain its rate of progress, the biggest of which is the decline of financial support from international donors once Vietnam reaches the status of a low-middle-income country. A severe shortage of human resources and the unpredictable movement of many epidemics also pose great difficulties for the country on its way to obtaining its 2015 goals.
PROGRESS
Combating HIV/AIDS
HIV prevalenceStatistics from November 2012 show that there were 208,866 HIV-
positive cases, 59,839 AIDS patients and 62,184 AIDS-related deaths in Vietnam. Over an 11-month period in 2012, the number of reported HIV cases dropped by 22 percent and the number of deaths decreased nearly threefold. However, statistics on HIV-related deaths at the commune level have not been fully reported.97
97 Ministry of Health (MOH). (2013). Report on the progress of achieving health-related Millennium Development Goals.

72
Overall, Vietnam has contained HIV prevalence to under 0.3 percent, which is lower than the target set by the now superseded national 2004-2010 strategy. The medium estimates and projections scenario shows that HIV prevalence in both adults and children will remain below 0.3 percent until 2015. The number of new HIV cases declined by 31.5 percent between 2001 and 2012,98 however Vietnam will need to overcome great challenges before it obtains its target of reducing the number of new cases of HIV infection by 50 percent in 2015.
By gender, there is a large disparity in HIV prevalence between men and women whereby men are three times more likely to be living with HIV than women (0.45 percent compared to 0.15 percent). However, the proportion of women among people living with HIV has risen since 2005 (Figure 6. 1). In 2012, women accounted for 31.5 percent of people living with HIV, an increase of 0.5 percent as compared to 2011.99 Transmission from high-risk men to their spouses or regular sexual partners contributes to half of newly reported HIV cases among women.
Figure 6. 1: HIV prevalence by gender, 2000-2012
Source: MOH (2013)
Three population groups have been identified as having the highest HIV-transmission risk, including men who inject drugs, men who have sex with men and female sex workers. According to sentinel surveillance in 2011, HIV prevalence among men who inject drugs and female sex workers reached 13.4 percent and 3 percent respectively100, while the 2009 Integrated Biological and Behavioural Surveillance data indicates that the rate among men that have sex with men is 16.7 percent. The sexual transmission of HIV has recently been on the rise. In 2012, the proportion of sexually transmitted cases of HIV was 45.5 percent, which for the first time exceeds those related to drug injections. On the contrary, the prevalence of HIV cases among men who inject drugs continued to decrease to 11 percent in 2012 compared to 13.4 percent in 2011. A similar pattern was witnessed among the female sex worker group, which has seen a decline from 2.9 percent who are HIV-
98 Vietnam Administration of HIV/AIDS Control and Ministry of Health. (2012). Vietnam HIV/AIDS Estimation and Projection Project, 2011-2015: Hanoi.99 Ministry of Health (MOH). (2013). Report on the progress of achieving health-related Millennium Development Goals.100 Vietnam Administration of HIV/AIDS Control and Ministry of Health. (2011). Sentinel Surveillance Survey 2011: Hanoi.

73
positive in 2011 to 2.7 percent in 2012.101 With regard to the men who have sex with men group, a mean 2011 HIV-prevalence was estimated at 4 percent, recording the highest levels in urban areas such as Ho Chi Minh City (HCMC), Hai Phong and Ha Noi.102
By geographical region, the North West, Thai Nguyen, Ha Noi, Quang Ninh, Hai Phong, HCMC, Can Tho and An Giang are among the areas with the highest prevalence of HIV cases (Figure 6. 2). The highest prevalence of more than 1 percent of the population is in the North West region.
Figure 6. 2: Vietnam HIV epidemic map, 2011
Source: EPP103
101 Ministry of Health (MOH). (2013). Report on the progress of achieving health-related Millennium Development Goals.102 Vietnam Administration of HIV/AIDS Control and Ministry of Health. (2011). Sentinel Surveillance Survey 2011: Hanoi.103 Vietnam Administration of HIV/AIDS Control and Ministry of Health. (2012). Vietnam HIV/AIDS Projection and Estimation, 2011-2015: Hanoi.

74
Use of condoms during the last high-risk sex among the most-at-risk populations
Comprehensive national harm-reduction interventions, including the provision of condoms and clean needles and syringes, and detoxification using alternative drugs have been introduced and continuously expanded in cities and provinces across the Vietnam. These measures have yielded positive behaviour changes in the use of condoms among the most-at-risk populations (Figure 6. 3). Accordingly, condom use during high-risk sex such as commercial sex or sex between men showed an increase between 2009 and 2010, and appears stable from 2010 to 2011 in all three most-at-risk groups (men who inject drugs, med who have sex with men and female sex workers).
Figure 6. 3: Condom use during last high-risk sex among the most-at-risk populations (%)
Source: Integrated Biological and Behavioural Surveillance and Integrating behavioural survey into HIV sentinel surveillance (HSS+)104
Improving HIV/AIDS knowledgeInformation, education and behaviour change programmes have been
widely implemented across Vietnam. When introduced alongside harm-reduction programmes, they significantly contribute to changing behaviour among young populations towards the adoption of safe practices to protect against HIV. Results from many large-scale surveys reveal a rising proportion of youth aged 15-24 that are able to identify HIV transmission modes, as well as three common misconceptions regarding HIV transmission.105
104 National Institute of Hygiene and Epidemiology (NIHE) and Ministry of Health. (2012). Integrated Biological and Behavioral Surveillance (IBBS) in Vietnam Round II 2009: Hanoi.105 GSO. (2011). The Multiple Indicator Cluster Surveys 4 (MICS4)GSO. (2005). National Survey on Adolescents and Youth in Vietnam (SAVY1)GSO. (2005). National Survey on Adolescents and Youth in Vietnam (SAVY2)GSO. (2006). Vietnam Population and AIDS Indicator Survey (VPAIS)

75
Access to antiretroviral drugsNational antiretroviral therapy services have been rapidly scaled up in
Vietnam since 2005. By the end of 2011, there were an estimated 57,663 adults and 3,261 children receiving antiretroviral therapy, which is almost 22 times higher than 2005 levels, and 1.5 times higher than those in 2009 (Figure 6. 4).
Figure 6. 4: Number of people living with HIV with access to ARV treatment, 2004-2012
Source: MOH, 2013
Between 2002 and 2012, the proportion of HIV-positive pregnant women who receive antiretroviral prophylaxis for preventing mother-to-child transmission increased significantly from 2 percent in 2003, to more than 40 percent in 2011.106 The coverage of both pregnant women tested for HIV and who know their results, and positive pregnant women who received antiretroviral therapy prophylaxis for preventing mother-to-child transmission increased from 480,814 and 1,372 in 2009 to 846,521 and 1,707 in 2011 respectively. Out of the 1,909 pregnant women identified as HIV-positive during pregnancy in 2011, 1,707 mothers and 1,733 babies received antiretroviral prophylaxis.107 Overall, the coverage as of the end of 2011 is still low compared with the existing need.108
106 Vietnam Administration of HIV/AIDS Control and Ministry of Health. (2012). HIV/AIDS program reporting data by Decision 28: Hanoi.107 Vietnam Administration of HIV/AIDS Control and Ministry of Health. (2012). HIV/AIDS program reporting data by Decision 28: Hanoi.108 Vietnam Administration of HIV/AIDS Control and Ministry of Health. (2012). Vietnam HIV/AIDS Projection and Estimation, 2011-2015: Hanoi.

76
Malaria, tuberculosis and other diseases
MalariaThe National Program on Malaria Prevention and Control has yielded
good results in reducing the number of malaria-infected cases and deaths caused by malaria. The number of people infected with malaria has decreased by 85 percent, while there has been a 90 percent drop in the number of malaria-related deaths between 2000 and 2011. The number of newly found cases of malaria is continuously on the decline. By 2011, the proportions of malaria-infected cases and malaria-related deaths were estimated respectively at 5.2 per 100,000 people and 0.016 per 100,000 people. Decreases in the number of new cases and deaths were witnessed across all regions of Vietnam (Figure 6. 5). Given Vietnam’s progress in reducing the number of malaria-infected cases and deaths every year during the period 2001-2011, in 2011 it realized its goal to control malaria.
Figure 6. 5: Malaria infection distribution, 2000 and 2011
Source: MOH (2013)Note: ‘Former Region IV’ includes six provinces: Thanh Hoa, Nghe An, Ha Tinh, Quang Binh, Quang Tri and Thua Thien Hue
TuberculosisIn 2006, Vietnam was ranked 12th among the 22 tuberculosis highest
burden countries by WHO. According to the latest global estimate, by 2011 the estimated prevalence of all forms of TB (including people living with HIV) was 323 per 100,000 people, and the estimated TB mortality rate was 33 per 100,000 people.109 Between 2000 and 2010, the notification rates for cases of TB (Table 6. 1) showed a declining trend for both new smear-positive and all forms of TB. The smear-positive notification rate fell faster than the rate for all forms of TB by 1.7 percent per year, as compared to 0.8 percent per year.110
109 WHO. (2012). Global Tuberculosis Control.110 Paula I. Fujiwara et al. (2011). End Term Evaluation National Tuberculosis Control Program Of Vietnam 2007-2011.

77
Table 6. 1: Notified TB cases and rates in Vietnam, 2000-2010
2003 2004 2005 2006 2007 2008 2009 2010New smear positive 55,937 58,394 55,570 56,437 54,457 53,484 51,291 52,145
Notification rate (/100,000 people) 68 71 66 67 64 62 59 59
New and relapse 92,741 98,173 94,994 97,363 97,400 97,772 95,036 94,867
Notification rate (/100,000 people) 107 111 106 107 106 105 101 99
Source: WHO (2011). Annual report from National Tuberculosis Program NTP Vietnam, 2011
Vietnam surpassed the global goal regarding TB control when the country successfully reduced the number of new cases and deaths from TB by 62 percent since 1990. However, in order to meet the West Pacific target, Vietnam still needs to make more effort to obtain a reduction of more than 10 percent in new TB cases and 12 percent in TB-related deaths between 2013-2015, which highlights the importance of increasing investment and more effective use of national resources.111
Other diseasesHand, foot and mouth disease. By the end of 2012, 157,654 new cases
of hand, foot and mouth disease were recorded across 63 provinces, among which 15 provinces and cities reported 45 deaths. The number of new cases increased by 39.4 percent, while the number of deaths declined by 73.5 percent from 2011. There was fivefold decrease from 0.15 percent to 0.03 percent in the ratio of deaths among new cases, which is notable.
Dengue. Some 87,202 new cases of dengue infection and 79 deaths were reported in 2012. Compared to 2011 there was an increase by 24.8 percent in the number of newly identified dengue cases, while the number of deaths increased by 18 cases. The ratios of new cases of dengue per 100,000 people, and dengue-related deaths per 100,000 people significantly decreased by 24.1 percent and 23.3 percent respectively between 2006 and 2010. However, the ratio of deaths per newly infected cases rose by 1.1 percent during that period.
H1N1 and H5N1 influenza. There were 11,214 cases of H1N1 across 63 provinces and cities, and of those 58 people died within 14 months between 2009 and 2012. Consequently the authorities implemented strong controls and quarantine measures throughout the country. As a result, no epidemic hub was found in 2011 and 2012. Though the infection is rarely transmitted between humans, when people do become infected, the mortality rate is worryingly high at about 60 percent.
111 MOH (2013)

78
CHALLENGES
Combating HIV/AIDS
Control the outbreak. While Vietnam has successfully reduced the number of new cases of HIV infection as well as HIV-related deaths over recent years, without more effective prevention and control measures there is still high risk of an outbreak within some communities. Larger-scale interventions need to be implemented in big cities such as HCMC, Hanoi, Son La and Thai Nguyen where HIV prevalence remains at a high level. The coverage of HIV screening programmes is quite poor in remote and economically disadvantaged areas, leaving many people who are HIV-positive unidentified and unable to access adequate treatment, which increases the risk of transmission within the communities.
Limited access to interventions. Despite efforts in scaling up interventions targeting most-at-risk populations throughout the country, patient access to support programmes is still limited. It is estimated that the Needle and Syringe Programme can only reach an average of 50-60 percent of the people living with HIV, while the coverage of the Condom Use Programme is around 40-50 percent. Among the most-at-risk populations, the fact that men who have sex with men is seen as the group with relatively lower access to preventive interventions (7.3 percent of HIV prevalence was recorded in HCMC in 2012) underscores the importance of mobilizing stronger support for this high-risk group. Another reason leading to poor access to interventions among people living with HIV/AIDs is the inadequate number of specialized centres, especially at the district and lower levels. Methadone treatment programmes have 43 centres providing treatment for 9,572 patients, which is far below the target of 61 units and 15,600 patients being treated. There are a total of 308 HIV/AIDS treatment centres, of which 162 are at the district level. Meanwhile, there are 162 medical centres focussed on preventing mother-to-child transmission, with 133 district centres making up a proportion of 20 percent of total districts.
Provision of HIV/AIDS treatment and medication. Less than half of the existing treatment centres are qualified under Circular 09/2011/TT-BYT which regulates the antiretroviral treatment provided by medical centres. This limits the provision of necessary treatment for people living with HIV/AIDS based on medical insurance schemes. A large proportion of medical centres have not fully recognized their duty to admit HIV-positive people, causing significant difficulties in tracking and monitoring patients. With regard to the distribution of medication, problems emerge concerning the replacement of d4T.112 Many medical centres show their inefficiency in following guidelines on replacing d4T, leading to the excessive stock of d4T and a shortage of d4T substitutes.
112 WHO is now recommending that national treatment programmes phase out the use of d4T in first-line treatment due to the high frequency of serious toxicity. The drug has been the mainstay of antiretroviral treatment scale-up in resource-limited settings due to its low cost and its availability in cheap, generic fixed-dose combinations.

79
Financial sustainability. A significant challenge facing national efforts on controlling the HIV/AIDS epidemic is the heavy reliance on international funding. The majority of funding for government programmes and strategies comes from international donors. As Vietnam reaches low-middle-income status, donors will likely discontinue or reduce their financial support.113 It is important to mobilize and allocate more internal resources to sustain progress. Building up and strengthening local partnerships to better engage different sectors is crucial to ensuring the effectiveness and efficiency of implementing HIV/AIDS prevention and control programmes.
Controlling malaria, TB and other diseases
Vietnam’s progress towards controlling malaria, TB and other diseases is threatened by a severe shortage of medical staff, especially in remote and mountainous areas. Low incentives, unfavourable working conditions and high exposure to contagious diseases without adequate protective measures are among the most common reasons for this human resources shortage. Malaria and TB prevention and control programmes have also encountered shrinking financial and technical support amidst the recent global economic crisis and the changing status of Vietnam to a low-middle-income country. More complications are emerging with regard to the rising prevalence of drug-resistant TB. The ratio of new drug-resistant TB cases is relatively low, creating significant difficulties in developing appropriate control measures. Hand, foot and mouth disease and dengue movement, as well as the emergence of new morbidity patterns and new diseases such as the hantavirus and meningitis caused by Naegleria fowleri, have recently posed great challenges for the country’s progress in managing highly contagious epidemics.
113 USAID (2010). Vietnam: HIV/AIDS Health Profile

80
MDG 7: Ensure environmental sustainability
Millennium Development Goal• Integrate the principles of sustainable development into country
policies and programmes•Reverse the loss of environmental resources, achieving a significant
reduction in the rate of loss•Reduce by half the proportion of people without sustainable access to
safe drinking water and basic sanitation•Achieve significant improvements in the lives of at least 100 million
slum dwellers
SUMMARY OF PROGRESS
During the 2010-2013 period, Vietnam made a huge effort to sustain and build on previous environmental achievements. The government’s socio-economic policies and programmes have taken consideration of the principles of sustainable development, and dedicated considerable resources to preserving and enriching natural resources, especially biodiversity. By 2013, international environmental organizations recognized eight World Biosphere Reserves, five Ramsar sites, three International Biodiversity Zones and six Plant Biodiversity Centres in Vietnam. The proportion of land area covered by forest increased steadily to 40.7 percent in 2012. The proportion of terrestrial and aquatic areas protected has also witnessed a gradual increase over the years, reaching 24,605.82 million km2 in 2012. The consumption of ozone depleting substances has been controlled and reduced by 6 percent in 2011.
Vietnam also strives to improve sanitary and housing conditions, and provide clean water for its people. In 2012, 80 percent of the rural population had access to clean water, and 58 percent of households had sanitary latrines. By 2010, the proportion of the population living in temporary housing across the country had decreased to 5.6 percent.
However, these monitoring indicators have not come close to the targets for 2015. Moreover, Vietnam has to endure the pressure of a low-middle-income country with a large population. Economic targets remain at the top of the priority list, over environmental concerns. Therefore, the goal of ensuring environmental sustainability by 2015 requires more effort from the government, as well as cooperation and collaboration with international partners.

81
PROGRESS
Integrating the principles of sustainable development into policies and programmes
Despite having the economic pressures of a developing country, the government has long considered sustainable development as a core objective in the country’s strategic socio-economic development. In committing to its goals, particularly achieving environmental sustainability, the government was encouraged to integrate sustainable development into its policies and programmes using a comprehensive and expeditious process. Confronting a rudimentary environmental legal system as well as the absence of a specialized government agency, Vietnam has established a relatively complete institutional, legal, strategic and policy framework for the protection of the environment and sustainable development, which ultimately deliver practical outcomes.
Vietnam has aligned its environmental protection objectives alongside economic growth for more than 20 years. The Ruling Party officially introduced this viewpoint in the Strategy for Socio-economic Stabilization and Development until 2000 at its 7th National Congress in 1991. Since then, this approach has been further supported, adopted and developed through government policies and programmes at all levels. Resolutions from succeeding sessions of the National Congress continue to assert the goal of economic growth, whilst achieving the objective of environmental protection. In June 1998, the first independent and detailed directive on protection of the environment was issued (Politburo Instructive No.36-CT/TW). This directive put environmental protection at the top of priority list, placing sustainable development next to socio-economic development, at both the national and local levels.
Politburo Resolution No.41-NQ/TW, issued in November 2004, reiterates the importance of environmental protection, in the context of accelerated national industrialization and modernization. The resolution from the 9th National Congress and the Strategy for Socio-economic Development (2011-2020) reaffirm this orientation and make sustainability one of three key development criteria, along with effectiveness and rapidity. Together with the growth of the economy, sustainable development has evolved from a development objective to a guiding principle for government policy in Vietnam.
This more comprehensive orientation has resulted in a multi-level and consistent environmental legal and regulatory system, which is continuously reviewed, amended, updated and improved to meet the requirements of the rapidly changing development environment. At the highest level, the 1992 Constitution of Vietnam asserts that conforming to environmental protection regulations is the responsibility of every citizen and organization. This constitutional regulation lays the foundation for the Vietnam’s system of environmental law and regulation. In 1993, the Law on Environment Protection paved the way for other environmental protection legislation including the Law on Water Resources (1998), the Law on Land (2003), the

82
Law on Forest Protection and Development (2004), the Law on Biodiversity (2008), the Law on Royalties (2009), the Law on Environmental Protection Tax (2010) and the Law on Economical and Efficient Use of Energy (2010).
Environmental protection regulations are not only set out in environmental laws but are also triggered by other laws where necessary, such as the Law on Customs (2001) which was amended in 2005, the Law on Construction (2003), the Enterprise Law (2005), the Law on Investment (2005) and the Youth Law (2005). Moreover, existing laws and regulations are regularly revised, adjusted and updated to respond to the fast and diversified development of the country during its economic integration period, such as the amendments to the Law on Environment Protection (2005), the amendment of and supplement to the Law on Petroleum (1998 and 2000) and the promulgation of the new Law on Water Resources in 2012. Prime Ministers and the Ministry for Natural Resources and Environment (MONRE), together with other ministries and government agencies, have issued a number of environmental protection regulations, concentrating on environmental standards, criteria and procedures; environmental impact assessment; environmental licensing and inspections; administrative sanctions on environmental violations and environmental protection institutions. Generally, Vietnam’s environmental law framework covers the necessary and vital environmental matters and demonstrates sufficient effectiveness, which largely satisfies the demands of environmental sustainability in the process of the country’s development.
Besides maintaining and developing its national legal and regulatory system for environmental protection, Vietnam has also actively participated in international conventions and treaties on the protection of the environment. The ratification of these conventions is a strong expression of Vietnam’s efforts in international law integration, taking part in the global commitment to sustainable environment. Over the last 20 years, important international environmental conventions and treaties have been signed with Vietnam’s full participation and implementation, such as the Ramsar Convention on Wetlands of International Importance (1989), the Vienna Convention on the Protection of the Ozone Layer (1994) and the Stockholm Convention on Persistent Organic Pollutants (2002).
In terms of development policies, the government has not only integrated sustainable development, particularly environmental protection, into macro socio-economic development strategies, but also specialised policies and programmes related to environmental issues. Documents such as the Strategic Orientation for Sustainable Development in Vietnam (2004), the Vietnam Sustainable Development Strategy for 2011-2020 (2012), the National Environmental Protection Strategy until 2020, with a vision to 2030 (2012) and the National Strategy for Green Growth (2012) have set forth the goals and specific objectives for a number of sustainable development issues with detailed guidelines for government authorities at all levels. These policies also establish the foundation for many other implementation programmes at lower levels and policies in other areas so that indicators of sustainable development are used throughout the entire planning, implementation and evaluation process; for example, the Strategic Orientation for the Mining Industry Through 2020 (2011) sets out the objectives for replacing pollution-causing mineral processing plants.

83
Regarding institutionalization, the government has established, maintained, strengthened and developed a comprehensive system of government organizations to administer environmental protection. At the early stage of the economic renovation process initiated in 1986, environmental matters were overseen by the Ministry of Science, Technology and Environment, which was founded in 1992. Through years of structural change, environmental bodies have become more effective and inclusive, having been divided into two areas at two levels including specialized government agencies under the management of MONRE, and other environmental government agencies under other ministries at both national and local levels. The establishment of environmentally specialized agencies and departments within other ministries and state departments creates a useful link and effective coordination mechanisms for agencies to implement the state management of natural resources and the environment. An example of this was the establishment of the Environment Police Department (C49) under the Ministry of Public Security in 2006 to prevent, detect and stop environmental violations.
In addition to having state agencies in charge of environmental protection, environmental protection and sustainable development principles have been integrated into the operation of a number of socio-political organizations and enterprises, such as the Vietnam Women’s Union and the Vietnam Farmer’s Union. The Vietnam Women’s Union has made the environment one of its priorities for its 2012-2017 term, specifically through its mission of mobilizing and supporting women in economic development, sustainable poverty reduction and environmental protection.
The budget for environmental protection has increased at a reasonable rate. Since 2006, the government has allocated a separate environmental budget of not less than 1 percent of the total budget, which reached VND2,900 billion in 2006 and VND9,050 billion in 2012.114 To meet its development vision, the government is considering a proposal to raise its environmental budget to at least 2 percent of the total budget for the 2015-2020 period. Moreover, the government has created a cooperation mechanism (whereby government agencies manage funds, implement policies, monitor activities and connect stakeholders through a number of different activities) to attract international and domestic support for environmental development. From 2010 to 2012, funds from international sponsors and loans for the response to climate change in Vietnam reached more than USD500 million.115 The government has also established the Environmental Protection Fund to manage the investment of about VND500 billion from the state budget and mobilize funds from other resources to finance environmental protection activities and projects nationwide.
114 MONRE115 Dara and the Climate Vulnerable Forum (2012) Climate Vulnerable Monitor 2nd Edition. A Guide to the Cold Calculus of a Hot Planet.

84
Reversing the loss of environmental resourcesDuring the economic slowdown, Vietnam still devoted considerable
and sustained efforts towards conserving natural resources. Although some environmental indicators were slightly under the adapted targets, they are strong evidence of Vietnam’s commitment to environmental protection and the need for further international support and cooperation in this essential area.
Increasing forest coverageIn recent years, the area of Vietnam’s forest coverage has steadily
increased (Figure 7. 1). The latest figures indicate that in 2012, the total forest area was 13,862,043 ha, of which 10,423,844 ha was natural forest, or 75.2 percent of the total area. The area of planted forest was 3,438,200 ha or 24.8 percent of the total. The proportion of Vietnam’s land area covered by forest was 40.7 percent, representing a consistent increase of 5.2 percent over the last five years, which was just short of the target of 42-43 percent by 2015.116
Figure 7. 1: Proportion of land area covered by forest in Vietnam (%), 2002-2012
Source: VNFOREST
Vietnam has shown strong commitment to protecting, restoring and replanting forests by introducing and implementing a wide range of forest development programmes. Forests play an important role in Vietnam’s development policies, schemes and action plans such as the Plan on Land Use till 2020, Plans on Land Use for 2011-2015, the Action Plan for 2011-2016, Vietnam Sustainable Development Strategy for 2011-2020, Vietnam Socio-Economic Development Strategies for 2011-2020. One of the largest national programmes for forests was the Five Million Hectare Forest Reforestation Programme (1998 to 2010) (Figure 7. 2). During the 2006-2010 period, the programme was responsible for the planting of 1,140,630 ha of forest, accomplishing 114 percent of the target; of which 253,265 ha was special-use and protective forest, reaching 101 percent of the target; and 887,365 ha was productive forest, achieving 115 percent of the target. The area of forest rehabilitation and restoration was 922,768 ha, reaching 115 percent of the target.117 These encouraging outcomes demonstrate the effectiveness of the programme.116 Resolution No. 10/2011/QH13 of National Assembly on November 08th 2011 on the Five-year Socio-economic Development Plan, 2011-2015117 Report No.128/BC-CP of the government on the summary of the 5 million hectare reforestation programme and forest development and protection plan for the period 2011-2020

85
Figure 7. 2: The area of natural forest and planted forest in Vietnam, 2002-2012
Source: VNFOREST
Slow reduction in the emissions of CO2
Although Vietnam has increased its forest coverage, which significantly helps absorb a large amount of CO2, emissions have continued to steadily increase between 2000 and 2010 (Figure 7. 3). Thermal power is the main source of CO2 emissions in Vietnam. In 2009, coal thermal power contributed 54 percent of CO2 emissions and gas thermal power contributed 40 percent of CO2 emissions. However, as thermal power plays a key role in the national electrical system, it is difficult to solve this problem in the short term. In 2010, thermal power accounted for more than half of the electrical power with coal thermal power occupying 18.5 percent, and a further 36.6 percent being generated by other thermal power sources.118
Figure 7. 3: CO2 emissions, total, per capita and per USD1 GDP (PPP), 2000-2010
Source: UNDATA
Effectively eliminating the consumption of ozone-depleting substancesVietnam has actively participated in international conventions and
protocols on eradicating ozone-depleting substances. The government ratified the Vienna Convention for the Protection of the Ozone Layer, the Montreal Protocol on Substances that Deplete the Ozone Layer and the London and Copenhagen Amendments in 1994, and it has put the National Hydro-Meteorological Service of Vietnam in charge of fulfilling the objectives of these international agreements. Consequently, Vietnam has restrained the import of ozone-depleting substances, as well as the application of these substances in business establishments nationwide. According to UNDATA, 118 Workshop on carbon capture and storage technologies in Vietnam by Asian Development Bank, Energy Task Force and Clean Energy Expert Group of Asia Pacific Economic Cooperation (APEC) and MPI in 2011

86
by 2011 Vietnam consumed only 292.9 metric tonnes of ozone-depleting substances, a decrease of 6 percent compared to that of 2010, signalling the first drop after increasing two consecutive years (an increase of 7.7 percent in 2010, and 4.3 percent in 2009) (Figure 7. 4). In 2009, Vietnam imported only 10 tonnes of the ozone-depleting gas, R-12. Vietnam banned the import of CFCs at the beginning of 2012. By 2010, Vietnam had achieved a reduction of 500 tonnes of CFCs, 3.8 tonnes of halon and 40 tonnes of CTC.
Figure 7. 4: Consumption of ozone-depleting substances in Vietnam, 1994-2011
Source: UNDATA
Moreover, Vietnam has mobilized financial assistance from different sources, such as multilateral funds for ozone and international development organizations, to promote technologies and equipment that are friendly to the ozone layer. The multilateral fund for the implementation of the Montreal Protocol for the period 2012-2016 has approved USD9.7 million for the national HCFC phase-out management plan.119
Preserving natural resources, especially biodiversityIn recent years, Vietnam has focused on developing and investing in
natural resource conservation programmes. The proportion of terrestrial and aquatic areas that have been protected has increased moderately (Figure 7. 5). In 2012, this area reached 24,605.82 million km2, an increase of 4.7 percent since 2011.
Vietnam has issued legislative documents on water resources protection, investing, upgrading and improving wastewater treatment, aligning water resource protection with forest protection and development. The government has also implemented many integrated natural resources and environmental management projects in a number of river basins, establishing national resources and environmental monitoring networks to increase the efficiency of resource management. Government agencies also regularly carry out the supervision and examination of the use of water resources, as well as implement education programmes and promotional campaigns on water resource protection to raise community awareness.
119 General Department of Meteorology and Climate Change, MONRE

87
Figure 7. 5: Proportion of terrestrial and marine area protected (%), 1990-2012
Source: UNDATA
In terms of biodiversity, Vietnam has rich a biodiversity with a number of terrestrial, groundwater, freshwater and marine ecological systems, many of which are typical of regional and global systems. Vietnam’s ecological systems are home to about 10 percent of the wild animal and bird species in the world. Currently, Vietnam has 3 out of 200 eco-zones identified worldwide by the World Wildlife Fund, one area of habitat for an endemic bird recognized by Birdlife International, and six Centres of Plant Diversity approved by the International Union for Conservation of Nature (IUCN), six Centres of Plant Diversity recognized by the IUCN, eight Biosphere Reserves declared by UNESCO, five Ramsar sites declared by the Ramsar Secretariat and five ASEAN Heritage Parks. During the period 2011-2013 alone, international environmental organizations recognized two Biosphere Reserves, five Ramsar sites and one ASEAN Heritage Park in Vietnam. These achievements are the results of a number of government strategies and plans related to biodiversity, particularly the Action Plan for Biodiversity Protection of Vietnam 1995, the 2010 National Action Plan for Biodiversity and Vision to 2020 (to carry out the Biodiversity Convention and Cartagena Protocol on Biosafety), National Action Plan for Biodiversity 2020 and Vision to 2030 (to conserve and sustainably manage biodiversity resources).
Access to safe drinking water and basic sanitation
Acknowledging the importance of clean water and sanitation, Vietnam has allocated a large amount of resources to improving the rural population’s access to these two essential factors. However, due to the size and distribution of the target population, as well as the complex nature of this problem, the goal of helping the rural population access clean water and hygienic latrines has not been fully achieved. To this day, the achievements of the programme have positively impacted the lives of millions of people in rural areas of Vietnam.

88
Improved rural conditions of health and environmental sanitationTo achieve this goal, the government has a dedicated national programme
for clean water and environmental sanitation in rural areas, the first two phases of which were implemented during the periods 1999-2005 and 2006-2010 (Figure 7. 6). Although some targets were not fully accomplished, the programme produced spectacular results, significantly improving the living conditions as well as the health and environment of people in rural areas. At present, Vietnam is proactively implementing the National Target Program for Rural Water Supply and Sanitation for the period 2012-2015.
Figure 7. 6: Proportion of population using an improved drinking water source, 2000-2011
Source: UNDATA
In 2010, the number of people in the rural population using clean water was 48,752,457, an increase of 8,630,000 people, compared to 2005. The proportion of the rural population using clean water increased from 62 percent to 80 percent, which is 5 percent less than the target. The average annual growth rate is 3.6 percent per year. The proportion of the rural population using domestic water that meets the requirements of the national regulation issued by the Ministry of Health which classifies various types of water (QCVN 02/BYT), was 40 percent, which is 10 percent below the target. Of the six ecological–economic zones, the South East region had the highest proportion of the rural population using clean water, at 90 percent, which was 10 percent above the national average. The Central Highlands and North Central and Central Coast Area had the lowest proportion of rural population using clean water, at 72 percent and 73 percent respectively.
In 2010 the number of people in the rural population using latrines was approximately 11,436,500 or 77 percent or the population, of which the proportion of rural households using hygienic latrines was 8,905,988. The average annual growth rate of those using an improved sanitation facility was 2 percent per year between 2000 and 2011 (Figure 7. 7). The proportion of rural households using hygienic latrines was 55 percent, which was 15 percent higher than that at the end of 2005, but 15 percent lower than the target.

89
By 2010, the number of schools delivering pre-school education and general education using clean water and latrines was 32,006, or 80 percent of the total, which was 20 percent below the target. The number of schools using clean water and latrines achieved an average annual growth rate of 2 percent. The number of health centres using clean water and latrines was 8,675, an increase of 24 percent compared to that at the end of 2005, with an average annual growth rate of 4.6 percent. The proportion of health centres using clean water and latrines was 80 percent, which was 20 percent lower than the target. The number of clean water supply and sanitation facilities in rural markets was 1,537, increasing from 17 percent at the end of 2005 to 48 percent, which is still 52 percent lower than the target.120
Figure 7. 7: Proportion of population using an improved sanitation facility, 2000-2011
Source: UNDATA
In 2011 and 2012, the two transitional years of the National Target Program on Rural Water Supply and Sanitation, these monitoring indicators either increased slowly or remained unchanged. In 2012, the proportion of the rural population using clean water was the same as it was in 2010 (80 percent). The proportion of the rural population with sanitary latrines increased slightly to 58 percent, a marginal increase from the 2010 rate.121 These figures are still far from the rural population targets of 85 percent using clean water and 65 percent with hygienic latrines by 2015.
120 Final draft of the National Target Program on Rural Water Supply and Sanitation for the period 2011-2015121 MARD

90
Housing conditionsIn 2010, the proportion of households living in temporary and other non-
permanent housing was 5.6 percent, which represents a dramatic decline of 57.3 percent, compared to 2008. The proportion of households living in temporary and other non-permanent housing in urban areas was 1.9 percent, which represents a substantial drop of 65.5 percent. The proportion in rural areas was 7.2 percent, which is a notable decline of 55.3 percent compared to 2008. Of the six economic–ecological regions, the Red River Delta had the lowest proportion of households living in temporary and other non-permanent housing at 0.1 percent, while the Mekong River Delta had the highest proportion at 16.8 percent.122
The task of improving housing conditions for ethnic minorities is more challenging and costly due to the practice of shifting cultivation by wandering hill tribes, requiring coordination with the task of fixing cultivation and settlement. Vietnam has mobilized considerable resources to develop a comprehensive policy and programme to support ethnic minorities in cultivated and settlement land. From 2002 to 2011, there were more than 40 prime ministerial decisions, and over 50 ministerial decisions and circulars to assign cultivated and settlement land to poor ethnic minority households. These policies were transformed into 405 proposals and projects across 53 provinces.
Although the number of ethnic minorities in need of support is still large, the results of these programmes are encouraging and have had profound social effects. During the period 2002-2011, the government allocated VND23,023.37 billion from the state budget to assign cultivated and settlement land to 333,995 poor ethnic minority households, accounting for 59.8 percent of the target group. The proportion of funds provided from the central state budget was 99.9 percent, while the local state budget provision was 0.1 percent. If government bonds and preferential loans were taken into account, the total funding for these programmes climbed to approximately VND30,000 billion, an average of about VND3,000 billion each year. From 2007 to 2012, the government helped 9,827 ethnic minority households, totalling 46,187 people, to establish fixed cultivation and settlement, accomplishing 33.1 percent of the target.123 These programmes have received strong support from local authorities and ethnic minorities, meeting their essential living and cultivation requirements, as well as strengthening the solidarity within the communities and laying the foundation for socio-economic development.
122 GSO (2013) Statistical Yearbook of Vietnam 2012123 Report No.252/BC-UBTVQH13 of the National Assembly Standing Committee on the results of supervising the implementation of policies and laws on cultivated and settlement land for ethnic minorities

91
During the period 2009-2012, Vietnam successfully implemented a programme to support poor households to build houses in 63 provinces and cities across the country following a 2008 prime ministerial direction (Decision 167/2008/QD-TTg) (Figure 7. 8). By 2012, the programme supported 519,000 poor households, accounting for 105 percent of the target and reaching 96 percent of the target group.124 The floor size of most houses surpassed the minimum area set by the programme. Most of the houses had an area of 28-32 square metres, many exceeding this with an area of 50-60 square metres in comparison with the minimum house area of 24 square metres.
Figure 7. 8: Proportion of urban population living in slums, 1990-2009
Source: UNDATA
However, while Vietnam monitors progress using indicators based on the classification of housing materials, the UN has developed a different indicator based on more integrated criteria, categorized on the basis of access to five basic services: improved water, improved sanitation, durable housing, sufficient living area and security of tenure. According to this more comprehensive indicator, the number of people living in slums in urban areas in 2009 was 9,396,278, which accounted for 35.2 percent, which is a decrease of 8.1 percent. These figures reflect slow and challenging progress, which Vietnam has to deal with in order to improve the living conditions of its urban population.
124 Tran Dinh Ha (2013) De an ho tro ho ngheo ve nha o: Khoi dong giai doan moi. Bao Xay Dung No.30 (1479), page 7

92
CHALLENGES
Increasing environmental violations and the depletion of natural resources. Environmental violations are becoming more and more serious in terms of both number and magnitude. From 2006 to 2011, the Environment Police Department detected and brought to court 18,400 violation cases involving 6,973 organizations and 12,427 individuals.125 The first six months of 2013 saw a 55.95 percent increase in the number of reported environmental violation cases in comparison to the same period in 2012. The most concerning violations are related to food trafficking and safety, waste treatment, the exploitation of natural resources and the environmental management of infrastructure projects.
Between 1992 and 2007, the total number of species threatened with extinction increased from 709 to 882 (Table 7. 1). The illegal wildlife trade is prevalent in Vietnam. The ‘extinct’ declaration of the Javan rhinoceros in Vietnam by the WWF and the International Rhino Foundation in 2011 was a strong signal indicating the alarming rate of rhino poaching in particular and the illegal trade of wild animals in general. In 2010, the Forest Protection Department captured 34,000 tonnes of approximately 13,000 illegally traded wild animals.126 The perception that wildlife products such as rhino horns, tiger bones and bear bile are precious and highly effective medicines is widely held and deeply rooted in the minds of many Vietnamese consumers. This has led to soaring prices and the expansion of the illegal wildlife trade.
Illegal wildlife exploitation for the purposes of maintaining livelihoods, entertainment and commerce has brought many animal species in Vietnam to the brink of extinction in the wild. According to the official estimate, there are only 50 tigers left in the wild. They are highly endangered as they live in small tracts of isolated and degraded forest, which has resulted in inbreeding. In many northern mountainous provinces, the excessive gathering of rare medicinal wild plants for cross-border trafficking is commonplace. High-value trees such as Dalbergia tonkinensis, Dalbergia cochinchinensis, Pterocarpus macrocarpus and Fokienia hodginsii and other forest products such as Aquilaria crassna and Panax vietnamensis are facing a high risk of extinction.
125 Meeting on Summarizing five years of prevention and fighting environmental crimes and violations by Ministry of Public Security in 2011126 MONRE (2012) Draft of National Strategy on Biodiversity to 2020 with a vision until 2030

93
Table 7. 1: The number of species threatened with extinction
1992-1996 2004 2007
Total 709 857 882
Threatened animal species 359 407 418
Threatened plant species 350 450 464
Source: GSO
Increasingly high rates of forest loss. In recent years, the growth of the area of forest coverage has slowed. Over the last 10 years, the proportion of land area covered by forest saw the highest jump from 37 percent in 2005 to 38 percent in 2006, before plateauing from 39.5 percent in 2010 to 39.7 percent in 2011. The reasons behind this stagnant growth of forest area is not the lack of investment in newly planted forests, but the notable increase of exploited forest areas (Table 7. 2 and Figure 7. 9). Moreover, non-compliant land use change, deforestation, and pests and diseases are the main reasons for the increasingly high rates of forest loss.
Table 7. 2: Changes in forest area by cause (ha), 2007-2012
Change 2007 2008 2009 2010 2011 2012
Newly planted forest area 157,511 158,180 194,574 197,571 132,331 173,813
Exploited forest area 27,231 33,710 41,238 49,635 78,532 67,572
Forest area damaged by fires 2,328 783 968 4,549 1,186 1,385
Forest area damaged by pests and diseases 337 18 38 39 286 95
Deforestation area 1,784 3,852 3,459 3,942 6,703 2,170
Forest area used for other purposes 16,263 29,236 38,636 46,519 24,069 59,172
Source: VNFOREST
Moreover, although the total forest area recently increased slightly, the quality or condition of natural forests is decreasing substantially. The area of primeval forests, which are seen only in protected forest areas and nature reserves, is declining at an alarming rate. Most of the natural forests have low tree-volumes. The area of mangrove forest has dropped by more than half in the last decade and this decline has not slowed at all in recent years.

94
Figure 7. 9: Changes in forest area by cause, 2005-2012
Source: VNFORESTInadequacies in the environmental legal system. Vietnam has not had
much experience in environmental management, particularly environmental protection. Environmental conditions are changing rapidly, and there are many inadequacies loopholes in the legal system. This is illustrated by the amount of discrepancies, repetitions and oversights that exist in many legal documents. These shortcomings have in reality led to ineffective interpretations of the law. For example, the lack of detailed guidelines and procedures on the filing of environmental pollution lawsuits has led to lengthy litigation processes. Current lawsuit procedures do not reflect the complex and lasting effects of environmental pollution.
Insufficient investment in the environment. Government investment in environmental protection is still relatively low in comparison with other countries in the region and worldwide. While Vietnam has tried to spend at least 1 percent of its state budget on the environment, this ratio is far from the average 1 percent of GDP in ASEAN countries and 3-4 percent of GDP in developed countries. Estimates indicate that the current budget for the environment has only satisfied half of the environmental investment requirements. In addition to the lack of financial support, Vietnam’s environmental budget has also faced inefficient spending and inequality among provinces and local regions.

95
MDG 8: Develop a global partnership for development
Millennium Development Goal• Develop further an open, rule-based, predictable, non-discriminatory trading and financial system, including a commitment to good governance, development and poverty reduction─both nationally and internationally• Deal comprehensively with the debt problems of developing countries through national and international measures in order to make debt sustainable in the long term• In cooperation with pharmaceutical companies, provide access to affordable essential drugs in developing countries• In cooperation with the private sector, make available the benefits of new technologies, especially information and communications
SUMMARY OF PROGRESS
Vietnam has made significant contributions to a global partnership for development. In recent years, Vietnam has played an increasingly important role in the region and a more visible role at the global level. Vietnam has proactively fostered bilateral and multilateral cooperative relationships with regional and global countries on the basis of mutual benefits and compliance with international laws. With the motto of active integration, Vietnam has successfully entered a number of free trade agreements (FTAs) and established partnerships with many countries. Vietnam is continuing to develop a comprehensive trade and financial system, and to facilitate greater economic integration.
The government has announced many policies to attract foreign capital and international labour cooperation and keep public debt under control. Vietnam has also tightened the control of drug prices to ensure that people have access to essential drugs at affordable prices. Information technology and communications are now widespread, as are improved living conditions and economic development. However, Vietnam needs to establish more active and effective cooperation with international development partners and international companies, particularly in the areas of medicine and technology to achieve significant growth in medical supplies and technology transfer.

96
PROGRESS
Bilateral trade relations of VietnamVietnam has consistently followed the foreign policy of “independence,
autonomy, multilateralism and diversification”, which has resulted in trade relations with nearly 230 countries and territories, investment relations with more than 84 countries and territories, and about 90 bilateral trade agreements. In addition to having bilateral FTAs with Japan and Chile, Vietnam is preparing and seeks to negotiate on FTAs with other countries such as Korea and Canada. Since 2012, Vietnam has been negotiating FTAs with Korea, the European Union, the Customs Union of Russia, Belarus and Kazakhstan and the European Free Trade Association (EFTA), which includes Iceland, Liechtenstein, Norway and Switzerland. These negotiations are expected to be completed in 2014 and 2015.
Recent developments in Vietnam’s bilateral relations have involved promoting and fostering existing relationships with major and strategic partners, emphasizing the sustainability and depth of these partnerships in order to take its foreign relationships to higher levels and strengthen regional and global economic partnerships. At present, Vietnam has formed strategic partnerships with 12 countries: Russia (2001), Japan (2006), India (2007), China (2008), Korea (2009), Spain (2009), the United Kingdom (2010), German (2011), Italy, Singapore, Indonesia and Thailand (2013). Moreover, its relationships with both Russia and China have elevated to the level of comprehensive strategic partnership.
Vietnam is occupying a more active position in South-East Asia. Over recent years, Vietnam has successfully reached agreement with a number of regional countries to take these relationships to a higher level. This year, has seen major improvements in the relationships between Vietnam and ASEAN countries, opening up tremendous opportunities for development. Vietnam and Thailand upgraded their bilateral relations as strategic partners, seeking to increase the trade turnover from the current figure of USD8.6 billion to more than USD15 billion by 2020. Vietnam and Indonesia, its fourth largest trade partner in South-East Asia, also elevated their long-standing relationship to a strategic partnership, a big step up from the Framework of Friendly and Comprehensive Partnership Entering the 21st Century (2003) and the Indonesia-Vietnam Plan of Action for 2012-2015 (2011). Consequently, the two countries committed to the trade turnover target of USD5 billion by 2015 and USD10 billion by 2018. This partnership also created a number of opportunities for cooperation in research and development, food security and sustainable food production, which was initiated by the extension of the Memorandum of Understanding on Rice Trade to 2017. Vietnam and Singapore also agreed to establish a strategic partnership in 2013.
Globally, Vietnam is projecting a more visible image. It has made a sustained effort to improve and enhance its relations with its major partners, particularly Western countries including the United States. In the Shangri-La Dialogue 2013, Prime Minister Nguyen Tan Dung expressed Vietnam’s foreign policy platform, emphasizing its continuing efforts to develop strategic partnerships and mutually beneficial relationships with other countries, especially those in the UN Security Council. In 2009, Vietnam

97
entered into a comprehensive partnership with Australia. In 2012, Vietnam officials established a comprehensive strategic partnership with Russia, promoting greater cooperation in trade, energy, petroleum, mining, science and technology, as well as education and training. As one of the three of Russia’s most important strategic partners in the Asia-Pacific region, Vietnam has more opportunities to contribute to international cooperation on development. In 2013, Vietnam formed a strategic partnership with Italy, holding initial strategic talks, and preparing for more effective and greater cooperation for the period 2013-2015. This year also marked a milestone in the relationship between Vietnam and the United States, which formed a comprehensive partnership, fostering stronger cooperation across a wide range of areas, including trade, science, education and training, environment and health, culture, sport and tourism.
Vietnam’s multilateral and regional trade relationsWith the motto “Vietnam is willing to become a friend and reliable partner
of all countries in the world community, striving for peace, independence and development”, Vietnam has expanded multilateral cooperation with other countries and territories, with great importance attached to neighbouring and regional countries, major powers, economic and political centres, and international and regional organizations on the basis of respect for principles of International Law and the United Nations Charter. Vietnam is currently an active member of more than 70 regional and international organizations such as ASEAN, APEC, ASEM and the WTO and has established diplomatic ties with 180 of the UN’s 193 members.
Vietnam demonstrates its experience and capacity, as well as its ‘soft power’ to strengthen its regional role, contributing to the development of ASEAN, promoting internal solidarity and cooperation. After its solid performance as the president of ASEAN in 2010, Vietnam has supported the successive presidents, from Indonesia in 2011 and Cambodia in 2012, to lead ASEAN with a focus on its community. In 2011 in particular, Vietnam supported Indonesia in solving regional issues, some of which related to national matters of a few members. In 2012, Vietnam cooperated with Cambodia to implement the Master Plan on ASEAN Connectivity to narrow the development gap among countries in the region and foster internal cooperation. Vietnam has also been nominated as the General Secretary of ASEAN for 2013-2018.
Globally, Vietnam has increased its efforts to promote the comprehensive integration of economic, political and sociocultural matter. In 2012, Vietnam hosted the Vietnam-Latin America Trade and Investment Forum, leading to the visits of 11 leaders from Latin American countries to promote cooperation and development. Vietnam’s substantial contributions towards international cooperation and development in recent years─as a non-permanent member of the UN Security Council in the 2008-2009 term and the president of ASEAN in 2010─have helped increase its position and reputation in the international arena.

98
The aim of Vietnam’s foreign policy for the period 2011-2020 is to proactively promote international integration, particularly in the economic area. Vietnam’s priorities are to expand economic relations, widen and diversify markets and take advantage of capital, managerial experience and advanced technology for national industrialization and modernization. Up until now, Vietnam has entered six regional FTAs known as the ASEAN Free Trade Area, and FTAs between ASEAN and its partners: India (AIFTA), Australia and New Zealand (AANZFA), Korea (AKTFA), Japan (AJCEP) and China (ACFTA). Following the economic integration guidelines, Vietnam has actively negotiated towards other important FTAs such as the Regional Comprehensive Economic Partnership (RCEP) and the Trans-Pacific Partnership. Within the framework of the WTO, Vietnam is actively fulfilling its trade commitments. Vietnam has also conducted a comprehensive trade policy review and joined the WTO’s Agreement on Government Procurement as an observer in its committee.
Vietnam’s international tradeSince the 1980s, Vietnam has introduced a wide range of radical
economic reforms, particularly ownership and trade liberalization policies, in order to move from a centralized economy to a market-oriented economy, and facilitate its integration into the global economy. These drastic changes have resulted in tremendous economic growth and a substantial increase in the openness of the economy. This openness has led to exponential increases in exports and imports (Figure 8. 1). In 1995, when Vietnam applied for WTO membership, export turnover was equivalent to 36.5 percent of GDP, import turnover was equal to 48.7 percent of GDP, and the percentage of import-export turnover to GDP was 85.2 percent. In 2011, 16 years later and four years after admission to the WTO, export turnover was equivalent to 87.6 percent of GDP, imports were equal to 98.2 percent of GDP and the percentage of import-export turnover to GDP rose drastically to 185.8 percent. In 2012, Vietnam had 18 export products with turnovers exceeding USD1 billion and is currently among the world’s largest exporters of a number of agricultural products such as coffee, natural rubber and cashew nuts. Vietnam has not only expanded its export product range but has also diversified the market, establishing direct transactions in 72 major countries and in four key ASEAN, APEC, EU and OPEC areas.

99
Figure 8. 1: The ratio of imports and exports to GDP, 1995-2011
Source: GSO
In the process of international economic integration, Vietnam has actively implemented international economic commitments to establish an open, transparent and fair trade and financial system. By 2012, Vietnam met all of its commitments on in agricultural tariff reductions. The number of goods receiving tariff reductions on time accounted for 68 percent, of which there were 27 percent receiving more favourable tariffs than committed levels, and only four products receiving goods later than the committed time. By the beginning of 2012, the number of forestry products receiving tariff reductions on time or earlier than the committed time amounted to 81.8 percent, of which 22.7 percent received tariff reductions earlier than the committed time, 59.1 percent received tariff reductions on time and only four products had their tariffs reduced later than the committed time. By 2012, Vietnam successfully implemented the committed tariff-reduction roadmap for 100 percent of seafood products, many of which had tariffs cut earlier than the committed time. In the service sector, Vietnam has implemented its commitment to opening up the market quickly and without a transitional period. In investment, Vietnam’s commitment to international economic integration is reflected in legal documents such as the Enterprise Law (2005) and the Capital Construction Investment Law (2009), including its amendment and supplement. Vietnam is regarded highly by international organizations in terms of its international integration achievements, which has contributed to increased confidence amongst international investors127 and a significant increase in Vietnam’s import-export turnover (Figure 8. 2).
127 MPI (2013) Comprehensive assessment of the socio-economic situations of Vietnam after five years of WTO ad-mission (Summary Report)

100
Figure 8. 2: Imports-exports of Vietnam, 2005-2011
Source: GSO
Foreign capital
Official development assistanceVietnam has successfully attracted a substantial amount of official
development assistance, which helped to transform the country from one of the poorest countries in the world to a lower-middle-income country in 2010 (Figure 8. 3). This impressive milestone is proving to be a real challenge for Vietnam as part of its official development assistance will be shifted to other less developed countries, resulting in the reduction of aid and preferential loans and leading to the increase of commercial capital. This increased level of cooperation is clearly demonstrated in the renaming of the Consultative Group of Donors Meeting for Vietnam to Vietnamese Partnership Development Forum from 2013.
In the 2013/14 financial year, the official development assistance committed to Vietnam continues to decrease, reaching USD6.485 billion, and is targeted at helping Vietnam stabilize its macroeconomy and focusing on important socio-economic aspects, laying the groundwork for sustainable development. In terms of quantity, the amount of committed official development assistance in 2013 decreased by USD1 billion compared to 2012, marking three consecutive years of decline (USD7.9 billion in 2011, USD7.3 billion in 2012). However, in the context of the global economic recession and European debt crisis, this figure still demonstrates the level of trust and strong support that international donors have for Vietnam.
In response to this new situation, Vietnam has formulated a number of strategies and plans to sustain and scale up its socio-economic activities, as well as take advantage of the existing official development assistance, such as restructuring the economy to encourage public investment, state-owned enterprises and the banking system, focusing on sustainable economic development, social security and poverty reduction. Vietnam has also endeavoured to improve its legal and regulatory framework for official development assistance, emphasizing simplification, harmonization and minimization. One of these activities is the development and implementation of the Vietnam Partnership Agreement for Effective Development, on the basis of the Busan Partnership agreement at the Fourth High Level Forum on Aid Effectiveness in 2011.

101
Figure 8. 3: Proportion of total bilateral, sector-allocable ODA to basic social services, 2010-2012
Source: GSO
Foreign direct investmentIn developing countries like Vietnam, foreign direct investment (FDI)
plays an important part in the economy, becoming a key driver of growth. Therefore, attracting FDI has always been one of Vietnam’s top priorities. Vietnam has established a comprehensive policy framework to attract FDI, resulting in the substantial amount of committed FDI each year. In 2012, Vietnam’s total in-bound FDI, including newly licensed and additional FDI, was USD16.3 billion, which is an increase of 4.7 percent compared to 2011. The first nine months of 2013 also saw a surge in the flow of FDI, totalling USD9.3 billion, which is an increase of 34.9 percent, compared to the previous year.128 This recovery from the decline in FDI resulting from the global financial crisis of 2007-2008 shows the tremendous effort of the government, as well as the attractiveness of the country to investors.
In terms of both quantity and quality, FDI has helped boost the economy. Currently, it accounts for a quarter of the total social investment capital, generates 60 percent of export turnover and has created 2 million direct jobs with the potential to expand this figure to 3 million in the near future. Companies undertaking FDI have also contributed to the transfer of new technology, modern and efficient management methodologies, as well as the restructuring of the economy towards a modern and sustainable economy. An increasing number of high-tech FDI projects commenced in 2012, notably phase two of the Samsung Vietnam investment project worth USD870 million, and the construction of Nokia’s mobile phone manufacturing factory worth €200 million. In 2013, Samsung Vietnam invested USD2 billion in constructing a high-tech complex in Thai Nguyen province and LG Electronics invested USD1.5 billion in a high-tech, digital electronic-product manufacturing factory in Hai Phong.
128 Foreign Investment Agency, MPI

102
Vietnam’s public debt
Vietnam’s total public debt in 2010 and 2011 accounted for 56.3 percent and 54.9 percent of GDP, respectively, while its total foreign debt in 2010 and 2011 amounted to 42.2 percent and 41.5 percent of GDP, respectively. The ratio of debt service to the state budget was 17.6 percent in 2010 and 15.6 percent in 2011.
Figure 8. 4: Debt service of exports of goods and services and net income (%), 1996-2011
Source: UNDATA
According to the strategy on public debt and national foreign debt in the period 2011-2020, the target ratio of public debt and foreign debt to GDP is no more than 65 percent of GDP, of which government debt is no more than 55 percent of GDP and foreign debt is no more than 50 percent of GDP. The ratio of direct debt service to the state budget is no more than 25 percent and foreign debt service is under 25 percent of exports of goods and services.
Based on these targets, Vietnam’s public debt remains within the international safe limit of debt. According to calculations by the IMF and World Bank in the first half of 2012, public debt in Vietnam was estimated to be 48.3 percent of GDP at the end of 2012, and 48.2 percent at the end of 2013. On the other hand, according to international practices, the ratio of debt service to state budget revenue is considered to be safe if it stays under 35 percent. Currently, the annual ratio of Vietnam’s debt service to state budget revenue ranges from 14 percent to 16 percent.129 In 2011, this figure was 15.6 percent, which is a drop of 11.36 percent.
International labour cooperationLabour export is an important long-term strategy for Vietnam’s
development progress. It quickly transforms cheap domestic labour into high-quality labour exports and significantly increases the income of its people. Consequently, it helps improve living standards and bring about a substantial increase in foreign exchange. In the context of globalization, labour exports have become an important component of international cooperation, fostering the relationships between Vietnam and its international counterparts.
129 MOF (2012) Public debt bulletin No. 1

103
Labour exports have made huge contributions to the growth of Vietnam over the last decade, and 2009-2012 figures demonstrate a steady increase in the number of exported workers, including both men and women (Figure 8. 5). In 2012, the total number of Vietnamese overseas workers was approximately 500,000. Due to the delays in some key markets, the number of exported workers dropped to 80,320 in 2012 from 88,298 in 2011, decreasing by 9 percent after three years of continuous growth. However, this figure is expected to return to an upward trend, with promising signs in the four key markets of Taiwan, Japan, Korea and Malaysia. On average, the salaries that exported labourers sent back to Vietnam reached over USD2 billion, and accounted for 25 percent of remittances. In 2012, Vietnam was ranked seventh among the world’s most remittance-receiving countries, attracting more than USD10 billion of remittances. This is a vital source of money, amounting to 60-70 percent of foreign investment in Vietnam since 1991, and plays an essential role in stabilizing the exchange rate and increasing the national foreign exchange reserves.
The government has established and developed a number of policies to promote labour exports. Since 1992, Vietnam has signed agreements and Memorandums of Understanding on labour cooperation with 22 countries and territories around the world. In 2009, the government implemented a project that supported poor districts to promote labour exports for sustainable poverty reduction for the period 2009-2020. Moreover, the signing of international partnership agreements and FTAs has also helped encourage the development of labour cooperation. It must be said that the 2008 Vietnam-Japan economic partnership agreement laid the foundation for successive labour cooperation programmes, such as the programme which sent Vietnamese nurses and nurse’s aides to Japan.
Figure 8. 5: The number of exported workers, by quantity and gender, 2009-2012
Source: GSO

104
Providing access to affordable essential medical care
The price of drugs has become one of the top priorities in the National Assembly over the last 15 years, and stabilizing drug prices is one of the Ministry of Health’s most critical tasks. Although the prices of drugs remain high, in 2012 Vietnam continued to tighten its regulations and management measures, which is showing some initial positive results. In 2012, the price of drugs increased by 5.27 percent, which is 1.54 percent less than CPI. By June 2013, the proportion of the population with insurance was about 70 percent.130 Vietnam’s social health insurance policy has contributed largely to patients being able to access drugs at affordable prices.
With regards to drug price management, the relevant government agencies have issued the necessary legal documents and carried out regular price checks in order to regulate and stabilize the price of medicine. In December 2011, the Ministry of Industry and Trade, the Ministry of Finance and the Ministry of Health issued guidelines131 on the state management of prices of medicine for human use. By September 2012, health departments in all provinces and cities investigated and reduced the price of 3.8 percent of the total number of drugs on the market.
In drug tendering systems, Vietnam’s Social Insurance Agency has trialled the centralized bidding system, which appears to be more advantageous than other available systems. At present, there are 40 provinces and cities using centralized bidding systems, 10 provinces and cities applying representative bidding systems and 13 other provinces using separate bidding systems. Information on drug tendering is transparent and can be widely accessed via the Drug Administration of Vietnam’s website. The government has recently made amendments to the Bidding Law in order to construct a more transparent and effective drug bidding system, such as the establishment of bidding service centres, a bidding marketplace, tender organizing and management companies, as well as the implementation of online bidding.
In terms of the pharmaceutical industry, domestic pharmaceutical manufacturers and drugs have developed in both quantity and quality, improving the capacity of Vietnam’s pharmaceutical industry and satisfying the demands of patients at low prices. By the end of 2012, there were about 178 pharmaceutical companies in Vietnam, including 98 manufacturers of modern drugs, 80 companies and more than 300 production establishments manufacturing Eastern drugs. In 2009, Vietnam produced 234 out of 314 active ingredients on the National Essential Drugs List and all 29 pharmacological groups as recommended by WHO. In 2010, domestically manufactured drugs were worth USD919 million, accounting for more than 48 percent of domestic drug demand. WHO has certified a number of domestic drugs that meet international standards.
130 MOH (2013) 2012 Health Summary Report and the missions and implementation solutions in 2013131 These were contained in Joint Circular No. 50/2011/TTLT-BYT-BTC-BCT

105
Harnessing the benefits of new technology
Vietnam has always considered technology to be one of the key drivers of growth. Therefore, the government has encouraged the development of new technologies in order to foster socio-economic growth. At the central level, Vietnam has integrated IT into its government operations to optimize the efficiency and productivity of public services, developed IT infrastructure and IT human resources. Consequently, government ministry websites with comprehensive and clear information on government policies and public services are easy to find. The level of IT and communication infrastructure has increased dramatically in recent years, with the steady growth of the Internet and mobile phones, and the gradual decrease of fixed telephone lines due to the popularity and affordability of cheap mobile phones (See Figure 8. 6).
In 2012, Vietnam ranked 83rd among 190 countries in the world and fourth in South-East Asia on the UN’s government development index, which is an improvement from 2010 when it was ranked 90th. In terms of the development of communications and information technology, Vietnam ranked 81st among 155 countries in the world in a 2012 International Telecommunication Union study (up from its 86th ranking in 2011). Vietnam was also categorized as one of the top-10 countries with the most dynamic IT development by the International Telecommunication Union.132
Figure 8. 6: The number of internet users, mobile cellular subscriptions and fixed telephone line subscriptions per 100 inhabitants, 2009-2012
Source: MIC
132 MIC (2013) Information Technology Application Report 2012

106
CHALLENGES
The increase of international trade barriers. In the context of the global economic recession, Vietnam has had to respond to increasingly strong trade barriers, particularly non-tariff barriers. According to the Vietnam Chamber of Commerce and Industry, since 1994 there have been 47 anti-dumping investigations and five anti-subsidy investigations against Vietnam. In the last four years (with the exception of two investigations in 2010), the number of investigations has showed an upward trend. In 2011, there were nine anti-dumping and anti-subsidy investigations. In 2012, there were nine investigations related to anti-dumping against Vietnam. During the first half of 2013, a number of products, especially shrimp and tra fish from Vietnam, continued to face anti-dumping and anti-subsidy investigations. By September 2013, 38 countries recognized Vietnam as a legitimate market economy. However, there are still a number of countries and territories, especially large economic partners like the United States and the EU, that do not recognize Vietnam’s market economy. This has resulted in many disadvantages for Vietnam in the area of trade.
Such trade barriers have caused serious damage to Vietnam’s import turnover. Every year, Vietnam bears the cost of over USD14 million for the return of exported products. The Institute of Development Studies stated that Japan, Australia and Vietnam are the top three countries with the highest refusal rate of seafood imports. During the period 2002-2010, Vietnam ranked first among the countries exporting to the United States and the EU, in terms of the number of seafood import refusals worth over USD1 million, at about 160 and 380 cases respectively. In Japan, Vietnam also ranked first on the same terms, recording 120 cases. In Australia, Vietnam ranked fourth with about 350 cases.
Steady decline in the flow of FDI and difficulties in attracting FDI to prioritized industries. Since 2012, the flow of FDI into Vietnam has slowed together with an increase in the number of withdrawn and delayed FDI projects. Many large enterprises in Japan have announced plans to expand in Thailand and Myanmar, while there have not been any signs of development in their factories in Vietnam. The number of Japanese enterprises in Thailand has risen to 7,000, whereas the number in Vietnam just reached 1,500. The amount of FDI disbursement has remained stable at about USD11 billion during the period 2005-2012. However, the amount of committed FDI has fallen significantly since its peak in 2009.
The rapid development of Vietnam’s economy has contributed the consequential growth of average income and minimum wage; however it has also contributed the depletion of natural resources. The strength of Vietnam’s historic economic advantage (cheap labour, rich natural resources and a wide range of preferential investment policies) has weakened. Further, infrastructure is ageing, and bureaucratic procedures are complicated and time-consuming. Moreover, Vietnam has tightened its policies for attracting investment, focusing on high-tech and environmentally friendly industries. These changes have made it difficult for Vietnam to attract FDI in recent years. Attracting FDI in these prioritized industries, as well as

107
supporting industries and infrastructure, is facing a number of challenges.133 In the technology industry, investment policies still face some problems. Technology transfer activities remain weak, and are mainly taking place horizontally among enterprises. The level of foreign investment in technology projects is low, with 80 percent of foreign investment enterprises using technologies at an average level. In supporting industries, related ministries and government agencies have not updated and obtained specialized information, and the investment environment in supporting industries is still insufficient. Enterprises have not realized profits after meeting investment costs. With regard to infrastructure, policies and institutions have not been coherent, especially in the area of public private partnerships (PPP), causing concerns among investors about transparency. Additionally, Vietnam’s macroeconomic conditions have not reached long-term stability, the effectiveness of site clearance for construction is still low and capital-mobilizing mechanisms have not been assured. Therefore, investors are not ready to invest in infrastructure in Vietnam. The implementation of foreign investment policies with an emphasis on prioritized industries will be a difficult challenge for policy makers.
Effective public and foreign debt management. In the past decade, public debt in Vietnam has increased rapidly, causing a number of concerns and exposing the economy to high levels of risk. Foreign debt is at its highest, resulting from the preferential and long-term loans for development from international financial organizations. As foreign debt accounts for a large portion of government debt, Vietnam is extremely vulnerable to international economic shocks. Moreover, foreign debt is also at the mercy of foreign exchange fluctuations. The advantage of preferential loans will be strongly influenced by the negative effect of the devaluation of the Vietnamese dong. Three of Vietnam’s biggest creditors, including Japan (whose loans account for 34.3 percent of the total foreign debt), the International Development Association (24.9 percent) and the Asian Development Bank (15 percent) used strong currencies to provide loans to Vietnam including the euro, the US dollar and the Japanese yen. The increased value of these currencies by 12 percent, 13 percent and 26 percent respectively during the period January 2010 to June 2011 sent a serious warning to the government about foreign exchange risk and put pressure on the budget deficit and monetary policy.
On the other hand, the size of commercial loans with high interest rates in Vietnam’s foreign debt has increased rapidly in recent years. By the end of 2010, the proportion of foreign debt with interest rates of 6-10 percent reached 6.8 percent, and the proportion of foreign debt with floating interest rates amounted to over 7 percent. Additionally, the length of the term of domestic public debt also involves high levels of risk. While foreign debt has long terms of several decades, the proportion of government bonds and government guaranteed bonds from two to five years is more than 88.7 percent. As a result, while servicing foreign debt is equally divided each year, reaching about USD1.5-2 billion per year, domestic debt service is accumulated in the near future, climbing at approximately USD4.5-5 billion each year over the next four years. Therefore, the challenge of debt management and effective utilization of government loans will be vital to the sustainable development of Vietnam in the coming years.
133 MPI (2013) the Proceedings of Conference on 25 years of Foreign Direct Investment in Vietnam

108
Ensuring people have access to essential drugs at affordable prices. The price of drugs in Vietnam has not been managed effectively, creating financial burdens for patients, particularly the poor and ethnic minorities. According to a 2010 WHO survey of seven popular drug groups, including antibiotic drugs, the price of drugs in Vietnam was 5 to 40 times higher than the average global price. Statistics from the Drug Administration of Vietnam shows that the average amount spent on pharmaceutical drugs per person in Vietnam has increased substantially over the years (Table 8. 1). From 2007 to 2011, the average amount per person increased by 106.12 percent from USD13.39 to USD27.60. In 2012, the average amount per person climbed to USD29.50, which is an increase of 6.88 percent. The total amount spent in Vietnam in 2012 reached USD2,600 million, an increase of 9 percent compared to 2011.
Table 8. 1: Average drug spending per person per year in Vietnam (USD), 2001-2012
2001 2002 2007 2011 2012
Drug spending 6.0 6.7 13.4 27.6 29.5
Source: Drug Administration of Vietnam
The drug bidding management system still has many weaknesses. At present, there are too many drug bidding commissions across the country, ranging from 700 to 1,000 across 63 provinces and cities. The bidding system is different across provinces and among hospitals. Some provinces use the centralized bidding system while some provinces let each hospital call for the bid on their own, which results in differences in the winning bid-price of the same type of drug among hospitals and provinces. Even the same type of drug under different names has different bid-prices. This situation happens to both imported and domestically manufactured drugs and is shown clearly in the 2010 and 2011 bidding results. For example, in 2011, the winning bid price for Arginin (200mg) at Hue Central Hospital was 69.2 percent higher than at the Vietnam-Cuba Friendship Hospital in Dong Hoi, Quang Binh. The winning bid-price for Levofloxacine (500mg/100ml) manufactured by Glenmark of India at Da Nang C Hospital was 26.31 percent higher than at the Vietnam-Cuba Friendship Hospital in Dong Hoi, Quang Binh. These unreasonable differences in the winning bid-prices cost the Health Insurance Fund a large amount of money, adversely affecting the sustainability of the fund, the benefits to patients and the investment capital for health.

109
PART
3: D
EVEL
OPM
ENT
PRIO
RITI
ES IN
TH
E PO
ST-M
DG
PER
IOD
POV
ER
TY
Prio
ritie
s•
Red
uce
pove
rty in
mou
ntai
nous
are
as a
nd a
mon
g et
hnic
min
oriti
es
Stat
ed o
bjec
tives
•Im
prov
e th
e liv
ing
stan
dard
s of t
he p
oor,
espe
cial
ly th
ose
resi
ding
in m
ount
aino
us a
reas
, or b
elon
ging
to
ethn
ic m
inor
ities
; brin
g ab
out r
adic
al re
form
s in
poor
are
as; n
arro
w th
e ga
p be
twee
n ru
ral a
nd u
rban
are
as,
amon
g re
gion
s and
pop
ulat
ion
grou
ps
Sour
ces
•N
atio
nal S
ocio
-Eco
nom
ic D
evel
opm
ent S
trat
egy
2011
-202
0•
Dec
isio
n 80
/NQ
-CP
(201
1) o
n su
stai
nabl
e po
verty
redu
ctio
n du
ring
2011
-202
0
EM
PLO
YM
EN
T
Prio
ritie
s•
Cre
ate
dece
nt w
ork
Stat
ed o
bjec
tives
•N
atio
nal s
trate
gy o
n em
ploy
men
t is s
till b
eing
dev
elop
ed a
nd th
us, s
peci
fic in
dica
tors
hav
e no
t yet
bee
n ra
tified
Sour
ces
•D
ecis
ion
432/
QD
-TTg
(201
2) o
n su
stai
nabl
e em
ploy
men
t dur
ing
2011
-202
0G
EN
DE
R E
QU
AL
ITY
AN
D W
OM
EN
EM
POW
ER
ME
NT
Prio
ritie
s•
Gen
der e
qual
ity
Stat
ed o
bjec
tives
•A
chie
ve g
ende
r equ
ality
with
rega
rd to
opp
ortu
nitie
s, pa
rtici
patio
n an
d co
mpr
ehen
sive
pol
itica
l, ec
onom
ic,
cultu
ral a
nd so
cial
ben
efits
, whi
ch c
ontri
bute
s to
fast
gro
wth
and
sust
aina
bilit
y of
the
coun
trySo
urce
s•
Dec
isio
n 23
51-Q
D-T
Tg (2
010)
on
gend
er e
qual
ity fo
r 201
1-20
20
ED
UC
ATIO
N
Prio
ritie
s•
Equi
ty in
edu
catio
n•
Educ
atio
n qu
ality

110
Stat
ed o
bjec
tives
•R
adic
ally
and
com
preh
ensi
vely
refo
rm th
e ed
ucat
ion
syst
em•
Prom
ote
the
qual
ity o
f edu
catio
n in
wid
e-ra
ngin
g as
pect
s: m
oral
edu
catio
n, c
reat
ivity
, pra
ctic
ing
skill
s, fo
reig
n la
ngua
ges,
com
pute
r sk
ills
to m
eet
the
dem
ands
of
the
labo
ur m
arke
t, an
d es
peci
ally
to
build
a h
igh-
qual
ity
wor
kfor
ce to
serv
e th
e ris
ing
dem
ands
of t
he p
roce
ss o
f ind
ustri
aliz
atio
n an
d m
oder
niza
tion
•R
efor
m e
duca
tion
syst
em m
anag
emen
t•
Impr
ove
the
qual
ity o
f tea
cher
s at a
ll le
vels
as w
ell a
s edu
catio
n m
anag
ers
•Re
vise
and
refo
rm te
achi
ng cu
rricu
lum
, met
hods
of e
xam
inat
ion,
and
impr
ove t
he m
onito
ring
and
eval
uatio
n sy
stem
•In
crea
se in
vest
men
t for
edu
catio
n an
d re
form
the
finan
cial
mec
hani
sms i
n th
e sy
stem
•Ex
pand
supp
ort t
o rem
ote,
mou
ntai
nous
and e
cono
mic
ally
disa
dvan
tage
d are
as, a
s wel
l as t
he m
ost d
isad
vant
aged
gr
oups
such
as e
thni
c m
inor
ities
Sour
ces
•N
atio
nal S
ocio
-Eco
nom
ic D
evel
opm
ent S
trat
egy
2011
-202
0•
Nat
iona
l Str
ateg
y on
Edu
catio
n D
evel
opm
ent 2
011-
2020
HE
ALT
H
Prio
ritie
s
•H
ealth
dis
parit
ies a
nd in
equi
ty•
Rep
rodu
ctiv
e he
alth
•W
omen
’s h
ealth
•N
on-c
omm
unic
able
dis
ease
s and
oth
er d
isea
ses
Stat
ed o
bjec
tives
•N
arro
w th
e ga
p in
the
heal
th st
atus
bet
wee
n di
ffere
nt g
roup
s•
Impr
ove
the
qual
ity o
f mat
erna
l hea
lthca
re se
rvic
es•
Expa
nd a
cces
s to
and
prom
ote
the
qual
ity o
f rep
rodu
ctiv
e he
alth
•To
con
trol H
IV/A
IDS,
sust
ain
mal
aria
-pre
vent
ion
prog
ress
and
con
trol t
he o
utbr
eak
of o
ther
dis
ease
s
Sour
ces
•V
ietn
am’s
Soc
io-e
cono
mic
Dev
elop
men
t Stra
tegy
for t
he P
erio
d 20
11-2
020
•N
atio
nal
Stra
tegy
for
the
Pro
tect
ion,
Car
e an
d Im
prov
emen
t of
Peo
ple’
s H
ealth
for
the
201
1-20
20 P
erio
d,
Vis
ion
to 2
030
•N
atio
nal S
trate
gy o
n H
IV/A
IDS
Prev
entio
n an
d C
ontro
l 201
0-20
20•
Vie
tnam
Pop
ulat
ion
and
Rep
rodu
ctiv
e H
ealth
Stra
tegy
201
1-20
20•
Plan
ning
on
the
Dev
elop
men
t of T
B a
nd L
ung
Dis
ease
Pre
vent
ion
and
Con
trol N
etw
ork
2011
-202
0•
Nat
iona
l Stra
tegy
on
Mal
aria
Pre
vent
ion,
Elim
inat
ion
and
Con
trol i
n V
ietn
am 2
011-
2010
, Vis
ion
to 2
030

111
EN
VIR
ON
ME
NT
Prio
ritie
s
•En
viro
nmen
tal p
rote
ctio
n•
Clim
ate
chan
ge•
Tigh
ten
natu
ral r
esou
rce
man
agem
ent
•G
reen
gro
wth
•B
iodi
vers
ity c
onse
rvat
ion
and
deve
lopm
ent
•Im
prov
e ho
usin
g co
nditi
ons
Stat
ed o
bjec
tives
Envi
ronm
enta
l pro
tect
ion,
resp
ond
to c
limat
e ch
ange
and
impr
ove
natu
ral r
esou
rce
man
agem
ent:
•Su
stai
nabl
e de
velo
pmen
t alo
ng w
ith n
atur
al re
sour
ce a
nd e
nviro
nmen
tal p
rese
rvat
ion
•A
ctiv
ely
resp
ond
to c
limat
e ch
ange
, nat
ural
dis
aste
r pre
vent
ion
and
the
gree
nhou
se e
ffect
•Im
prov
e na
tura
l res
ourc
e ex
ploi
tatio
n an
d ut
iliza
tion
in a
n ef
fect
ive
and
sust
aina
ble
man
ner
•C
ontro
l env
ironm
enta
l pol
lutio
n, n
atur
al re
sour
ce d
egra
datio
n an
d bi
odiv
ersi
ty lo
ss•
Impr
ove
livin
g st
anda
rds,
sust
ain
ecol
ogic
al b
alan
ce to
war
ds a
n en
viro
nmen
tally
sust
aina
ble
econ
omy
•A
ttain
indi
cato
rs th
at a
re o
f sim
ilar l
evel
s with
indu
stria
lly d
evel
oped
cou
ntrie
s in
the
regi
onG
reen
gro
wth
:•
Purs
ue g
reen
gro
wth
, ach
ieve
a lo
w c
arbo
n ec
onom
y; re
duce
em
issi
ons a
nd p
rom
ote
gree
nhou
se a
bsor
ptio
nBi
odiv
ersi
ty:
•En
sure
that
impo
rtant
eco
logi
cal s
yste
ms,
spec
imen
s, ra
re a
nd h
igh-
valu
e ge
netic
sour
ces a
re p
rese
rved
and
ex
ploi
ted
in a
sust
aina
ble
man
ner i
n or
der t
o co
ntrib
ute
to g
reen
gro
wth
and
resp
ond
to c
limat
e ch
ange
Sour
ces
•D
ecis
ion
24-N
Q/T
W (2
013)
on
resp
ondi
ng to
clim
ate
chan
ge, i
mpr
ovin
g th
e m
anag
emen
t of n
atur
al re
sour
ces
and
envi
ronm
enta
l pro
tect
ion
•D
ecis
ion
02-N
Q/T
W (2
011)
on
orie
ntat
ion
for m
iner
als a
nd m
inin
g in
dust
ry to
202
0, v
isio
n to
203
0•
Dec
isio
n 43
2/Q
D-T
Tg (2
012)
on
sust
aina
ble
deve
lopm
ent f
or V
ietn
am d
urin
g 20
11–2
020
•D
ecis
ion
17/2
011/
QH
13 (2
011)
on
land
use
pla
nnin
g to
202
0 an
d na
tiona
l five
-yea
r pla
n du
ring
2011
-201
5•
Dec
isio
n 12
16/Q
D-T
Tg (2
012)
on
natio
nal e
nviro
nmen
tal p
rote
ctio
n to
202
0, v
isio
n to
203
0•
Dec
isio
n 13
93/Q
D-T
Tg (2
012)
by
the
Prim
e M
inis
ter o
n gr
een
grow
th•
Dec
isio
n 21
27/Q
D-T
Tg (2
011)
on
hous
ing
deve
lopm
ent s
trate
gy to
202
0, v
isio
n to
203
0•
Dec
isio
n 14
74/Q
D-T
Tg d
ated
(201
2) o
n na
tiona
l act
ion
plan
on
clim
ate
chan
ge 2
012-
2020

112
OT
HE
R P
RIO
RIT
IES
Prio
ritie
s•
Ethn
ic m
inor
ities
•Sc
ienc
e an
d te
chno
logy
•Pu
blic
deb
t and
fore
ign
debt
Stat
ed o
bjec
tives
Ethn
ic m
inor
ities
:•
Rap
id a
nd s
usta
inab
le s
ocio
-eco
nom
ic d
evel
opm
ent:
acce
lera
te p
over
ty r
educ
tion
amon
g et
hnic
min
oriti
es,
narr
ow th
e ga
p be
twee
n et
hnic
ities
; red
uce
econ
omic
ally
dis
adva
ntag
ed a
reas
; est
ablis
h ec
onom
ic, c
ultu
ral a
nd
scie
ntifi
c ce
ntre
s am
ong
min
ority
com
mun
ities
; de
velo
p m
inor
ity h
uman
res
ourc
es;
incr
ease
the
qua
ntity
and
qu
ality
of m
inor
ity p
erso
nnel
; stre
ngth
en lo
cal p
oliti
cal s
yste
ms;
and
forti
fy p
eopl
e’s s
olid
arity
and
ens
ure
natio
nal
secu
rity
Scie
nce
and
Tech
nolo
gy:
•D
evel
op so
cial
scie
nces
, nat
ural
scie
nces
and
tech
nolo
gy; p
rom
ote
scie
nce
and
tech
nolo
gy a
s the
driv
ing
forc
e of
nat
iona
l gro
wth
•D
evel
op so
me
area
s of t
he c
ount
ry’s
scie
nce
and
tech
nolo
gy to
reac
h ad
vanc
ed le
vels
in th
e ASE
AN
regi
on a
nd
glob
ally
Publ
ic d
ebt a
nd fo
reig
n de
bt:
•M
obili
ze c
apita
l at r
easo
nabl
e co
sts a
nd ri
sks;
mee
t the
dem
ands
of b
alan
cing
stat
e bu
dget
s and
inve
stm
ent f
or
soci
o-ec
onom
ic d
evel
opm
ent i
n ea
ch p
erio
d; e
nsur
e th
e al
loca
tion
and
utili
zatio
n of
deb
t is
effe
ctiv
e an
d en
sure
re
paym
ent
abili
ty;
mai
ntai
n pu
blic
deb
t, go
vern
men
t de
bt a
nd f
orei
gn d
ebt
with
in s
afe
limits
; en
sure
nat
iona
l fin
anci
al se
curit
y co
mpl
ies w
ith n
atio
nal s
tand
ards
and
inte
rnat
iona
l nor
ms
Sour
ces
•D
ecis
ion
449/
QĐ
-TTg
(201
3) o
n et
hnic
min
ority
affa
irs to
202
0•
Dec
isio
n 45
0/Q
Đ-T
Tg (2
012)
on
finan
cial
stra
tegy
to 2
020
•D
ecis
ion
958/
QĐ
-TTg
(201
2) o
n st
rate
gy o
n pu
blic
and
fore
ign
debt
dur
ing
2011
-202
0, v
isio
n to
203
0•
Dec
isio
n 41
8/Q
Đ-T
Tg (2
012)
on
stra
tegy
on
scie
nce
and
tech
nolo
gy d
evel
opm
ent d
urin
g 20
11-2
020

113
OT
HE
R P
RIO
RIT
IES
Prio
ritie
s•
Ethn
ic m
inor
ities
•Sc
ienc
e an
d te
chno
logy
•Pu
blic
deb
t and
fore
ign
debt
Stat
ed o
bjec
tives
Ethn
ic m
inor
ities
:•
Rap
id a
nd s
usta
inab
le s
ocio
-eco
nom
ic d
evel
opm
ent:
acce
lera
te p
over
ty r
educ
tion
amon
g et
hnic
min
oriti
es,
narr
ow th
e ga
p be
twee
n et
hnic
ities
; red
uce
econ
omic
ally
dis
adva
ntag
ed a
reas
; est
ablis
h ec
onom
ic, c
ultu
ral a
nd
scie
ntifi
c ce
ntre
s am
ong
min
ority
com
mun
ities
; de
velo
p m
inor
ity h
uman
res
ourc
es;
incr
ease
the
qua
ntity
and
qu
ality
of m
inor
ity p
erso
nnel
; stre
ngth
en lo
cal p
oliti
cal s
yste
ms;
and
forti
fy p
eopl
e’s s
olid
arity
and
ens
ure
natio
nal
secu
rity
Scie
nce
and
Tech
nolo
gy:
•D
evel
op so
cial
scie
nces
, nat
ural
scie
nces
and
tech
nolo
gy; p
rom
ote
scie
nce
and
tech
nolo
gy a
s the
driv
ing
forc
e of
nat
iona
l gro
wth
•D
evel
op so
me
area
s of t
he c
ount
ry’s
scie
nce
and
tech
nolo
gy to
reac
h ad
vanc
ed le
vels
in th
e ASE
AN
regi
on a
nd
glob
ally
Publ
ic d
ebt a
nd fo
reig
n de
bt:
•M
obili
ze c
apita
l at r
easo
nabl
e co
sts a
nd ri
sks;
mee
t the
dem
ands
of b
alan
cing
stat
e bu
dget
s and
inve
stm
ent f
or
soci
o-ec
onom
ic d
evel
opm
ent i
n ea
ch p
erio
d; e
nsur
e th
e al
loca
tion
and
utili
zatio
n of
deb
t is
effe
ctiv
e an
d en
sure
re
paym
ent
abili
ty;
mai
ntai
n pu
blic
deb
t, go
vern
men
t de
bt a
nd f
orei
gn d
ebt
with
in s
afe
limits
; en
sure
nat
iona
l fin
anci
al se
curit
y co
mpl
ies w
ith n
atio
nal s
tand
ards
and
inte
rnat
iona
l nor
ms
Sour
ces
•D
ecis
ion
449/
QĐ
-TTg
(201
3) o
n et
hnic
min
ority
affa
irs to
202
0•
Dec
isio
n 45
0/Q
Đ-T
Tg (2
012)
on
finan
cial
stra
tegy
to 2
020
•D
ecis
ion
958/
QĐ
-TTg
(201
2) o
n st
rate
gy o
n pu
blic
and
fore
ign
debt
dur
ing
2011
-202
0, v
isio
n to
203
0•
Dec
isio
n 41
8/Q
Đ-T
Tg (2
012)
on
stra
tegy
on
scie
nce
and
tech
nolo
gy d
evel
opm
ent d
urin
g 20
11-2
020
CONCLUSION
After more than a decade carrying out a series of programmes and policies to achieve its millennium development goals, Vietnam has made good progress, which has been regarded highly by the international community. The government continues to maintain progress in order to accomplish its goals and further develop socio-economic development priorities in the ‘post-millennium-development-goal’ period.
Vietnam has made strong progress and completed a number of its goals before the target of 2015. The living standards for millions of poor households have been improved significantly, particularly in rural and mountainous areas. Access to basic public services, such as health and education, has increased. During the period 2009-2012, more than 1 million people escaped hunger, and the poverty rate dropped to 9.6 percent. The living standards of households in general have been lifted, with an increase in households owning permanent housing, and durable goods such as motorbikes, phones and colour televisions. The unemployment rate has been kept at a low level. The achievement of gender equality has become a national priority. Child and maternal health standards have improved; and the prevention and control of epidemics have been carried out more effectively. Sustainable development, especially environmental protection, has been integrated into strategic development planning processes and policies across the board.
Vietnam has been facing multiple challenges in the latter period of millennium development goal implementation. The impact of the global financial crisis in 2008 has had strong impacts on Vietnam’s economy, slowed economic growth and threatened economic sustainability in Vietnam, as well as undermined newly obtained socio-economic results. The government has made tremendous efforts to stabilize the macroeconomy, while at the same time ensuring good living standards at the national level, especially for households in rural and remote areas where there is high shortage of public infrastructure and basic public services.

114
Other difficulties encountered by Vietnam are unequal levels of benefits received by different ethnic groups, inequality in income and living standards between geographic regions. The disadvantaged groups require more attention and support. In such a multi-ethnic country, the ethnic minority groups play an important role. However, the ethnic minorities are scattered around the country; they usually reside in remote regions with rugged and difficult terrain, so their access and integration into the national socio-economic process is limited. By 2012, more than 200 communes and 8,000 villages had no access to the national power grid; nearly 16 villages had no nursery or kindergarten. The 2012 National Assembly Report shows that the national average for regions facing extreme hardship in terms of income is one out of every six. In 69 poor communes across the country, almost 83 percent of households are ethnic minorities. During the period 2002-2011, 558,485 poor ethnic minority households faced land shortages for the purposes of living and agricultural production.
Climate change poses a critical challenge for the country. Vietnam is a natural disaster-prone country and this is compounded by the socio-economic pressure that comes with having a large population. Tackling climate change is going to be a huge undertaking for Vietnam. Initial research, as well as government programmes and policies, only help to build a national framework at macro level. A large proportion of poor and extremely poor households reside in highly segmented and steep terrain, with frequent occurrences of natural disasters and extreme weather events. The major livelihood of these poor households is agricultural activities, which is heavily dependent on weather and climatic conditions. This situation leaves the most vulnerable groups most susceptible to the risks of climate change, which in turn pose huge threats to the stability and sustainability of the millennium development goal results.

115
In order to face these challenges, Vietnam needs to improve many of its development programmes, integrating multidimensional elements and call for support from international partners in order to build solutions and programmes that ensure “sustainable development, focusing on people and all for people”.134 Research based on consultation with the community and international experts identify eight fundamental issues Vietnam needs to focus on in the ‘post-millennium-development-goal’ period: equality, vulnerability and social integration, management and community participation, change in population structure, high-quality health services at reasonable cost, new development models with decent work opportunities, education and training, and environmental sustainability. Vietnam needs to sustain positive outcomes brought about by the achievement of the millennium development goals, coordinate more effectively with national and international organizations and agencies, and build on the successes and lessons from other countries while maintaining human rights, equity and sustainability.
134 UNDP – Synthesis Report about the Consultation Process of Vietnam about development programme after 2015

116

117
ANNE
X 1
STAT
IST
ICA
L A
NN
EX
Indi
cato
rs19
9020
0520
08- 2
009
2010
- 201
3
MD
G1:
Era
dica
te E
xtre
me
Pove
rty
and
Hun
ger
Ach
ieve
d
1Po
verty
rate
58%
(199
2)
19.5
%
(200
4)
14.5
%
(200
8)
9.6%
( 201
2*)
2Po
verty
gap
18.4
%
(199
3)
4.7%
(200
4)
3.5%
(200
8)
5.9%
(201
0)
3U
nder
-five
mal
nutri
tion
41%
25.3
%18
.9
(200
9)
16.8
%
( 201
1)M
DG
2: A
chie
ve U
nive
rsal
Pri
mar
y E
duca
tion
Ach
ieve
d
1N
et p
rimar
y en
rolm
ent r
ate
87%
95%
97%
(200
9)
97.6
7%
(201
2)
2Pr
imar
y co
mpl
etio
n ra
te
85.6
%88
.5%
(200
9)
92.0
8%
(201
2)
3N
et se
cond
ary
enro
lmen
t rat
e 81
%83
.1%
( 200
9)
87.2
4%
(201
2)

118
Indi
cato
rs19
9020
0520
08- 2
009
2010
- 201
3
MD
G3:
Pro
mot
e G
ende
r E
qual
ity a
nd E
mpo
wer
Wom
enA
chie
ved
in m
any
targ
ets
1R
atio
of F
emal
e to
Mal
e pr
imar
y en
rolm
ent
47.7
%
(199
8)47
.7%
47.9
%
(200
9)
48,5
%
(201
1)
2R
atio
of F
emal
e to
Mal
e se
cond
ary
enro
lmen
t 47
%
(199
8)47
.9%
48.5
%
(200
9)
48,5
%
(201
1)
3R
atio
of F
emal
e to
Mal
e up
per-s
econ
dary
enr
olm
ent
46.4
%
(199
8)48
.9%
52.6
%
(200
9)
53,2
%
(201
1)
4R
atio
of W
omen
’s re
pres
enta
tives
in N
atio
nal A
ssem
bly
(NA
) of V
ietn
am
18.4
8%
(9th N
A. te
rm 1
992-
1997
)
25.7
6%
(12th
NA.
term
20
07-2
011)
24.4
0%
13th N
A. te
rm 2
011-
2016
)
5R
atio
of W
omen
’s re
pres
enta
tives
at P
rovi
ncia
l Peo
ple’
s Cou
ncils
21
.1%
(term
199
9-20
04)
23.9
%
(term
200
4-20
09)
---
6R
atio
of W
omen
’s re
pres
enta
tives
at D
istri
ct P
eopl
e’s C
ounc
ils
21 %
(term
199
9-20
04)
23%
(term
200
4-20
09)
---
7R
atio
of W
omen
’s re
pres
enta
tives
at C
omm
une
Peop
le’s
Cou
ncils
16.1
%
(term
199
9-20
04)
19.5
%
(term
200
4-20
09)
---
MD
G4:
Red
uce
Chi
ld M
orta
lity
Att
aina
ble
1U
nder
-five
mor
talit
y ra
te58
‰27
.3‰
25‰
(200
9)
22.8
‰
(201
2)
2U
nder
-one
mor
talit
y ra
te
44.4
‰26
.0‰
16‰
(200
9)
15.2
‰
(201
2)

119
Indi
cato
rs19
9020
0520
08- 2
009
2010
- 201
3
MD
G5:
Impr
ove
Mat
erna
l Hea
lthA
ttai
nabl
e
1M
ater
nal m
orta
lity
ratio
per
100
,000
live
birt
hs
233
8069
(200
9)
64
(201
2)13
5
2R
atio
of b
irths
atte
nded
by
skill
ed m
edic
al st
aff
92.7
1%
(200
6)
94.8
%
(200
9)
96.7
%
(201
1)
3R
atio
of w
omen
age
d 15
-49
usin
g co
ntra
cept
ion
73.9
%
(200
1)
80%
(200
8)
78.2
%
(201
1)
4R
atio
of p
regn
ant w
omen
hav
ing
at le
ast 3
che
ck-u
ps d
urin
g th
eir p
regn
ancy
84
.3%
86.4
%
(200
8)
86.7
%
(201
1)M
DG
6: C
omba
t HIV
/AID
S, M
alar
ia a
nd O
ther
Dis
ease
sD
ifficu
lt to
obt
ain
1H
IV p
reva
lenc
e ra
te0.
28%
(est
imat
ed)
0.28
%
(est
imat
ed 2
011)
2N
umbe
r of H
IV-in
fect
ed a
dults
hav
ing
ARV
7,
812
(200
6)
36,0
08
(200
9)
66,1
67
(09/
2012
)
3N
umbe
r of H
IV-in
fect
ed c
hild
ren
havi
ng A
RV
428
(200
6)
1,98
7
(200
9)
3,71
5
(09/
2012
)
4N
umbe
r of m
alar
ia-in
fect
ed c
ases
29
3,00
0
(200
0)
60,8
67
(200
9)
45,5
88
(201
1)
5N
umbe
r of m
alar
ia-in
fect
ed d
eath
s 71
(200
0)
27
(200
9)
14
(201
1)
6R
atio
of n
ewly
reco
vere
d tu
berc
ulos
is-in
fect
ed p
atie
nts
89.9
%
(200
7)
89.8
%
(200
9)
90,0
%
(201
1)
135
Joi
nt A
nnua
l Hea
lth R
evie
w 2
012

120
Indi
cato
rs19
9020
0520
08- 2
009
2010
- 201
3
MD
G7:
Ens
ure
envi
ronm
enta
l sus
tain
abili
tyD
ifficu
lt to
obt
ain
1Fo
rest
cov
erag
e pr
eval
ence
27
.8%
37%
40%
(est
imat
ed
2010
)
40.7
%
(201
2)
2Sh
are
of ru
ral p
opul
atio
n ha
ving
acc
ess t
o cl
ean
wat
er
30%
79%
(200
9)
80%
(201
2)
3Sh
are
of ru
ral h
ouse
hold
s hav
ing
sani
tary
toile
ts
20%
43%
(200
9)
58%
(201
2)
4Sh
are
of h
ouse
hold
s liv
ing
in te
mpo
rary
hou
sing
22
.7%
(199
9)
7.8%
(200
9)
5.6%
(201
0)
MD
G8:
Glo
bal P
artn
ersh
ip fo
r D
evel
opm
ent
Ach
ieve
d fo
r so
me
targ
ets
1To
tal i
mpo
rts a
nd e
xpor
ts (m
illio
n U
SDs)
69,2
0612
7,04
522
8,36
4
(201
2)
2O
DA
com
mitm
ent (
mill
ion
USD
s)2,
400
(200
0)3,
748
8,06
4
(200
9)
6,48
5
(201
3)No
te. *
pov
erty
rate
in 2
012
is ca
lcul
ated
acc
ordi
ng to
the G
over
nmen
t pov
erty
line
201
1-20
15
Pove
rty ra
tes f
or o
ther
year
s are
calc
ulat
ed u
sing
pove
rty li
ne o
f the
Wor
ld B
ank

121
ANNE
X 2
The
cont
ent o
f thi
s pa
rt is
syn
thes
ized
from
gov
ernm
enta
l doc
umen
ts a
bout
nat
iona
l pro
gram
s an
d So
cio-
econ
omic
Dev
elop
men
t St
rate
gy fo
r the
per
iod
2011
-202
0:
1.
Pove
rty
indi
cato
rs
•Av
erag
e an
nual
inco
me
per c
apita
of p
oor h
ouse
hold
s inc
reas
es b
y 3.
5 tim
es; p
over
ty ra
te a
t nat
iona
l lev
el d
ecre
ases
by
2% p
er
annu
m; p
over
ty ra
te a
t poo
r dis
trict
, com
mun
es d
ecre
ase
by 4
% p
er a
nnum
by
each
stag
e;
•Li
ving
stan
dard
of p
oor h
ouse
hold
s im
prov
es si
gnifi
cant
ly, fi
rstly
in h
ealth
, edu
catio
n, cu
lture
, wat
er fo
r dai
ly ac
tiviti
es, h
ousi
ng;
incr
ease
in a
cces
s to
basi
c so
cial
infr
astru
ctur
e of
poo
r hou
seho
lds.
•Fo
cuse
d in
vest
men
t on
soci
o-ec
onom
ic in
fras
truct
ure
at p
oor d
istri
cts,
espe
cial
ly e
cono
mic
ally
dis
adva
ntag
ed c
omm
unes
and
vi
llage
s acc
ordi
ng to
new
rura
l crit
eria
, firs
tly in
bas
ic in
fras
truct
ure
such
as t
rans
port,
ele
ctric
ity, w
ater
for d
aily
livi
ng a
ctiv
ities
.
2.
Em
ploy
men
t ind
icat
ors
Thes
e in
dica
tors
are
ext
ract
ed fr
om th
e in
dica
tor s
yste
m o
f sus
tain
able
dev
elop
men
t for
the
perio
d 20
11-2
020.
No.
Indi
cato
rsPr
ogre
ss20
1020
20**
1U
nem
ploy
men
t rat
e (%
)20
112.
88<3
.0
2R
ate
of la
bor w
ho is
cur
rent
ly w
orki
ng a
nd h
avin
g un
derg
one
train
ing
(%)
2011
40>7
0

122
3.
Gen
der
equa
lity
and
Wom
en e
mpo
wer
men
t ind
icat
ors
Incr
ease
the
part
icip
atio
n of
wom
en in
man
agem
ent a
nd le
ader
ship
pos
ition
s in
ord
er to
gra
dual
ly r
educ
e th
e ge
nder
gap
in
polit
ical
are
a.•
Indi
cato
r 1: T
he p
ropo
rtion
of w
omen
par
ticip
atin
g in
to e
xecu
tive
com
mitt
ees
of th
e ru
ling
party
at a
ll le
vels
for t
he p
erio
d of
20
16-2
020
exce
eds 2
5 pe
rcen
t. Th
e pr
opor
tion
of fe
mal
e N
atio
nal A
ssem
bly
and
Peop
le C
omm
ittee
repr
esen
tativ
es a
t all
leve
ls fo
r the
pe
riod
of 2
016-
2020
is o
ver 3
5 pe
rcen
t.
•In
dica
tor 2
: By 2
020,
the p
ropo
rtion
of m
inis
tries
, min
istry
-equ
ival
ent o
rgan
izat
ions
, gov
ernm
ent a
genc
ies a
nd P
eopl
e Com
mitt
ee’s
de
partm
ents
hav
ing
wom
en o
ccup
ying
key
pos
ition
s is 9
5 pe
rcen
t.
•In
dica
tor 3
: By
2020
, if t
he p
erce
ntag
e of
wom
en in
the
tota
l num
ber o
f em
ploy
ees
in g
over
nmen
t org
aniz
atio
ns a
nd b
odie
s is
m
ore
than
30
perc
ent,
the
prop
ortio
n of
CPV
, sta
te a
nd so
cio-
econ
omic
org
aniz
atio
ns a
nd b
odie
s hav
ing
wom
en o
ccup
ying
key
lead
ing
posi
tions
is 1
00 p
erce
nt.
Red
uce
the
gend
er g
ap in
the
econ
omic
, lab
or a
nd jo
b ar
eas.
Incr
ease
the
acce
ss o
f po
or w
omen
in r
ural
are
as a
nd e
thni
c m
inor
ity w
omen
to e
cono
mic
and
labo
r res
ourc
es.
•In
dica
tor 1
: Eac
h ye
ar, t
he p
ropo
rtion
of e
ach
gend
er in
the
tota
l num
ber o
f new
ly c
reat
ed jo
bs is
at l
east
40
perc
ent.
•In
dica
tor 2
: By
2020
, the
pro
porti
on o
f wom
en in
the
tota
l num
ber o
f bus
ines
s ow
ners
is o
ver 3
5 pe
rcen
t.
•In
dica
tor 3
: By
2020
, the
pro
porti
on o
f rur
al w
omen
wor
kers
bel
ow 4
5 ye
ars
old
rece
ivin
g pr
ofes
sion
al a
nd te
chni
cal t
rain
ing
reac
hes 5
0 pe
rcen
t.
•In
dica
tor
4: T
he p
ropo
rtion
of
wom
en in
poo
r ru
ral a
nd e
thni
c m
inor
ity a
reas
hav
ing
the
dem
and
to r
ecei
ve lo
ans
from
job
crea
tion
and
pove
rty re
duct
ion
prog
ram
s and
offi
cial
cre
dit s
ourc
es re
ache
s 100
per
cent
in 2
020.
Incr
ease
the
qual
ity o
f fem
ale
hum
an r
esou
rces
. Gra
dual
ly e
nsur
e th
e eq
ual p
artic
ipat
ion
of m
en a
nd w
omen
in th
e ar
eas
of
educ
atio
n an
d tr
aini
ng•
Indi
cato
r 1: B
y 20
20, t
he li
tera
cy ra
te o
f mal
es an
d fe
mal
es fr
om 1
5 to
40
year
s old
in re
mot
e are
as, e
thni
c min
ority
and
extre
mel
y di
fficu
lt ar
eas r
each
es 9
5 pe
rcen
t.
•In
dica
tor 2
: The
pro
porti
on o
f fem
ales
in th
e to
tal n
umbe
r of m
aste
r deg
ree
hold
ers r
each
es 5
0 pe
rcen
t in
2020
. The
pro
porti
on
of fe
mal
es in
the
tota
l num
ber o
f doc
tor d
egre
e ho
lder
s is 2
5 pe
rcen
t by
2020
.

123
Ens
ure
gend
er e
qual
ity in
the
acce
ss a
nd re
ceip
t of h
ealth
car
e se
rvic
es•
Indi
cato
r 1: S
ex ra
tio a
t birt
h do
es n
ot e
xcee
d 11
5 bo
ys /
100
girls
by
2020
.
•In
dica
tor 2
: Red
uce
the
mat
erna
l mor
talit
y ra
te d
own
to 5
2/10
0.00
0 liv
e bi
rths b
y 20
20.
•In
dica
tor 3
: Inc
reas
e th
e pr
opor
tion
of p
regn
ant w
omen
rece
ivin
g m
othe
r to
child
HIV
tran
smis
sion
pre
vent
ion
and
treat
men
t to
50 p
erce
nt b
y 20
20 c
ompa
red
to th
at o
f 201
0.
•In
dica
tor 4
: Red
uce
the
abor
tion
rate
to 2
5/10
0 liv
e bi
rths b
y 20
20.
Ens
ure
gend
er e
qual
ity in
the
area
s of c
ultu
re a
nd in
form
atio
n•
Indi
cato
r 1: B
y 20
20, r
educ
e 80
per
cent
of g
ende
r bia
sed
cultu
ral a
nd in
form
atio
n pr
oduc
ts. I
ncre
ase
the
broa
dcas
ting
time
of
prog
ram
s, se
ries a
nd th
e nu
mbe
r of p
rodu
cts p
rom
otin
g an
d ed
ucat
ing
in g
ende
r equ
ality
.
•In
dica
tor 2
: By
2020
, the
pro
porti
on o
f rad
io a
nd te
levi
sion
sta
tions
at c
entra
l and
loca
l lev
els
havi
ng p
rogr
ams
and
serie
s in
im
prov
ing
awar
enes
s of g
ende
r equ
ality
is 1
00 p
erce
nt.
Ens
ure
gend
er e
qual
ity in
fam
ily li
fe. G
radu
ally
elim
inat
e do
mes
tic v
iole
nce
on th
e ba
sis o
f gen
der e
qual
ity.
•In
dica
tor 1
: Red
uce
the
ratio
of t
he h
ouse
wor
k tim
e of
fem
ale
to m
ale
to 1
.5 b
y 20
20.
•In
dica
tor 2
: By
2020
, the
pro
porti
on o
f dom
estic
vio
lenc
e vi
ctim
s ide
ntifi
ed a
nd re
ceiv
ing
lega
l and
hea
lth c
onsu
ltatio
n, su
ppor
t an
d ca
re at
supp
ortin
g ce
nter
s is 5
0 pe
rcen
t. B
y 20
20, t
he p
ropo
rtion
of d
omes
tic v
iole
nce p
erpe
trato
rs d
etec
ted
and
rece
ivin
g co
nsul
tatio
n in
dom
estic
vio
lenc
e pr
even
ting
and
fight
ing
cent
ers r
each
es 8
5 pe
rcen
t.
•In
dica
tor 3
: The
pro
porti
on o
f tra
ffick
ing
vict
ims r
etur
ned
and
resc
ued
is 1
00 p
erce
nt b
y 20
15 a
nd is
mai
ntai
ned
until
202
0.

124
Incr
ease
the
stat
e m
anag
emen
t cap
acity
in g
ende
r equ
ality
•In
dica
tor
1: B
y 20
20, t
he p
ropo
rtion
of
lega
l doc
umen
t dra
fts h
avin
g ge
nder
equ
ality
rel
ated
con
tent
inte
grat
ed w
ith g
ende
r eq
ualit
y is
sues
is 1
00 p
erce
nt.
•In
dica
tor 2
: The
pro
porti
on o
f mem
bers
of w
ritin
g an
d ed
iting
com
mitt
ees o
f leg
al d
ocum
ents
dra
fts, w
hich
hav
e ge
nder
equ
ality
re
late
d co
nten
t int
egra
ted
with
gen
der e
qual
ity is
sues
, rec
eivi
ng tr
aini
ng in
gen
der,
gend
er a
naly
sis
and
gend
er in
tegr
atio
n re
ache
s 10
0 pe
rcen
t by
2015
and
is m
aint
aine
d un
til 2
020.
•In
dica
tor 3
: Pro
vinc
es a
nd c
entra
lly g
over
ned
citie
s al
loca
te e
noug
h of
ficia
ls fo
r gen
der e
qual
ity p
rogr
ams
and
esta
blis
h te
ams
of v
olun
teer
s and
col
labo
rato
rs to
par
ticip
ate
in g
ende
r equ
ality
and
wom
en a
dvan
cem
ent p
rogr
ams b
y 20
15 a
nd m
aint
ain
until
202
0.
•In
dica
tor 4
: The
re p
ropo
rtion
of o
ffici
als w
orki
ng in
the
area
of g
ende
r equ
ality
and
wom
en a
dvan
cem
ent r
ecei
ving
pro
fess
iona
l tra
inin
g at
leas
t onc
e is
100
per
cent
by
2015
and
mai
ntai
ned
until
202
0.

125
4.
Edu
catio
n in
dica
tors
Indi
cato
rs
Targ
et b
y 20
20
Pre-
prim
ary
educ
atio
n
Rat
e of
enr
olm
ent a
t pre
-prim
ary
educ
atio
n fo
r chi
ldre
n un
der 5
10
0
Enro
lmen
t rat
e am
ong
child
ren
at n
urse
ry sc
hool
age
s30
Enro
lmen
t rat
e am
ong
child
ren
at k
inde
rgar
ten
scho
ol a
ges
Mal
nutri
tion
redu
ctio
n ra
te a
t pre
-prim
ary
educ
atio
n in
stitu
tions
10
Bas
ic e
duca
tion
Net
enr
olm
ent r
ate
at p
rimar
y sc
hool
s99
Net
enr
olm
ent r
ate
at se
cond
ary
scho
ols
95
Rat
e of
you
ths w
ith u
pper
seco
ndar
y sc
hool
qua
lifica
tions
and
equ
ival
ent
80
Enro
lmen
t rat
e am
ong
disa
bled
chi
ldre
n70
Occ
upat
iona
l and
hig
her
educ
atio
n
Rat
e o
f hig
h sc
hool
gra
duat
e ad
mitt
ed a
t occ
upat
iona
l cen
ters
30
Rat
e of
wor
kers
with
occ
upat
iona
l or h
ighe
r edu
catio
n qu
alifi
catio
ns70
Rat
io o
f stu
dent
s/10
,000
350-
400

126
Indi
cato
rs
Targ
et b
y 20
20
Rec
urre
nt e
duca
tion
Lite
racy
rate
am
ong
peop
le a
ged
15 a
nd a
bove
98
Lite
racy
rate
am
ong
peop
le a
ged
15-3
599
Qua
lity
of te
ache
rs
Rat
e of
pre
-prim
ary
teac
hers
with
qua
lifica
tions
abo
ve a
vera
ge st
anda
rds
60
Rat
e of
prim
ary
teac
hers
with
qua
lifica
tions
abo
ve a
vera
ge st
anda
rds
100
Rat
e of
seco
ndar
y te
ache
rs w
ith q
ualifi
catio
ns a
bove
ave
rage
stan
dard
s88
Rat
e of
upp
er se
cond
ary
teac
hers
with
qua
lifica
tions
abo
ve a
vera
ge st
anda
rds
16.6
Rat
e of
teac
hers
at o
ccup
atio
nal s
choo
ls w
ith M
aste
r Deg
rees
38
.5
Rat
e of
col
lege
teac
hers
with
Mas
ter D
egre
e 60
Rat
e of
uni
vers
ity te
ache
rs w
ith M
aste
r Deg
ree
100
Rat
e of
hig
her e
duca
tion
teac
hers
with
pro
ficie
ncy
in a
t lea
st o
ne fo
reig
n la
ngua
ge10
0
Rat
e of
col
lege
teac
hers
with
Doc
tor D
egre
e 25
Rat
e of
uni
vers
ity te
ache
rs w
ith D
octo
r Deg
ree
8

127
5. H
ealth
indi
cato
rs
Tabl
e 1:
Nat
iona
l Hea
lth c
are
indi
cato
rs
N
atio
nal H
ealth
car
e in
dica
tors
20
1520
20
Indi
cato
rs/I
nput
indi
cato
rs1
Num
ber o
f doc
tors
/10,
000
inha
bita
nts
810
2N
umbe
r of p
harm
acis
ts/1
0,00
0 in
habi
tant
s2
2.2
3V
illag
es w
ith a
ctiv
e V
HW
(%)
90>9
04
Com
mun
e w
ith d
octo
r (%
)80
905
Com
mun
e w
ith m
idw
ife o
r ass
ista
nt d
octo
r in
obst
etric
and
ped
iatri
c ca
re (%
)>9
5>9
56
Hos
pita
l bed
per
10,
000
inha
bita
nts (
excl
ude
CH
S be
d)23
26In
whi
ch: N
on-p
ublic
bed
s 1.
52
Pe
rfor
man
ce in
dica
tors
7Fu
lly v
acci
nate
d in
fant
s (%
)>9
0>9
08
% o
f com
mun
e ac
hiev
ing
new
nat
iona
l ben
chm
ark
for c
omm
une
heal
th60
809
Hea
lth in
sura
nce
cove
rage
(%)
75>8
010
Prop
ortio
n of
hea
lth e
xam
inat
ion
and
treat
men
t by
com
bine
d tra
ditio
nal a
nd m
oder
n m
edic
ine
2025
11Pr
opor
tion
of so
lid m
edic
al w
aste
trea
ted
8510
0

128
N
atio
nal H
ealth
car
e in
dica
tors
20
1520
20
O
utpu
ts in
dica
tors
Life
exp
ecta
ncy
7475
12M
MR
(p10
0,00
0 liv
e bi
rths)
58.3
<52
13IM
R (p
1,00
0 liv
e bi
rths)
1411
14U
-5M
R (p
1,00
0 liv
e bi
rths)
19.3
1615
Und
er-fi
ve c
hild
mal
nutri
tion
rate
(wei
ght f
or a
ge) (
%)
1510
16N
ew b
orn
babi
es w
ith w
eigh
t und
er 2
,500
gra
m (%
)<
4<
417
Popu
latio
n si
ze (m
illio
n in
habi
tant
s)<9
3<9
818
Popu
latio
n gr
owth
rate
(%)
1<1
19Se
x ra
tio a
t birt
h (b
oys/
100
girls
)<1
13<1
1520
HIV
/AID
S pr
eval
ence
rate
(%)
< 0.
3<
0.3
21H
ouse
hold
exp
endi
ture
for h
ealth
car
e/to
tal h
ealth
exp
endi
ture
(%)
<45
<40

129
Tabl
e 2:
Pop
ulat
ion
and
Rep
rodu
ctiv
e H
ealth
Indi
cato
rs
Po
pula
tion
and
Rep
rodu
ctiv
e H
ealth
Indi
cato
rs20
1520
20
Targ
et 1
Con
trol p
opul
atio
n gr
owth
and
HD
I
Popu
latio
n gr
owth
rate
(%)
11
Hum
an D
evel
opm
ent I
ndex
(HID
) In
tern
atio
nal
high
ave
rage
Targ
et 2
Chi
ld h
ealth
U5M
R (p
er 1
,000
live
birt
hs)
19.3
16
Preg
nant
wom
en re
ceiv
ing
pre-
nata
l scr
eeni
ng te
sts (
%)
1550
New
bor
n ba
bies
rece
ivin
g sc
reen
ing
test
(%)
3080
Targ
et 3
Mat
erna
l hea
lth
MM
R (p
er 1
00,0
00 li
ve b
irths
)58
.352
Targ
et 4
Con
trol r
isin
g se
x ra
tio a
t bir
th
Sex
ratio
at b
irth
(boy
s/10
0 gi
rls)
113
115
Targ
et 5
Con
trol b
irth
rate
1.
91.
8
Birt
h ra
te (a
vera
ge n
umbe
r of c
hild
ren
born
to a
cou
ple
of re
prod
uctiv
e ag
es)
9398
Popu
latio
n si
ze (m
illio
n pe
ople
)

130
Po
pula
tion
and
Rep
rodu
ctiv
e H
ealth
Indi
cato
rs20
1520
20
Targ
et 6
Man
agin
g ab
ortio
n
Abo
rtion
rate
(per
100
live
birt
hs)
27<2
5
Targ
et 7
repr
oduc
tive
trac
t inf
ectio
ns a
nd se
xual
ly tr
ansm
itted
Dis
ease
s
repr
oduc
tive
tract
infe
ctio
ns d
eclin
e ra
te (%
)15
30
sexu
ally
tran
smitt
ed d
isea
ses d
eclin
e ra
te (%
)10
20
wom
en a
ged
30-5
4 te
sted
for c
ervi
cal c
ance
r (%
)20
50
wom
en a
ged
40 a
nd a
bove
test
ed fo
r bre
ast c
ance
r (%
)20
50
Targ
et 8
Adol
esce
nt a
nd y
outh
repr
oduc
tive
heal
th
incr
ease
in th
e nu
mbe
r of r
epro
duct
ive
heal
th c
are
cent
ers f
or a
dole
scen
ts (%
) 50
75
unw
ante
d pr
egna
ncy
rate
am
ong
adol
esce
nt20
50
Targ
et 9
Impr
ove
repr
oduc
tive
heal
th fo
r som
e pe
culia
r pop
ulat
ion
grou
ps
acce
ss to
repr
oduc
tive
heal
th o
f som
e pe
culia
r pop
ulat
ion
grou
ps
2050
Targ
et 1
0el
derl
y he
alth
car
e
incr
ease
in th
e nu
mbe
r of d
istri
ct h
ealth
car
e ce
nter
s for
the
elde
rly (%
)20
50
el
derly
hav
ing
acce
ss to
com
mun
ity-b
ased
hea
lth c
are
(%)
2050

131
Tabl
e 3:
Nut
ritio
n in
dica
tors
N
utri
tion
indi
cato
rs20
1520
20
Die
t im
prov
emen
t
1R
ate
of h
ouse
hold
s with
less
than
1,8
00 K
cal i
ntak
e pe
r hea
d (%
) 10
5
Mal
nutr
ition
am
ong
preg
nant
wom
en a
nd c
hild
ren
1St
untin
g pr
eval
ence
am
ong
child
ren
unde
r five
yea
rs o
f age
26
23
2U
nder
wei
ght p
reva
lenc
e am
ong
child
ren
unde
r five
yea
rs o
f age
15
12.5
3En
ergy
defi
cien
cy p
reva
lenc
e am
ong
wom
en a
t rep
rodu
ctiv
e ag
es15
12
Nut
rien
ts
1Pr
eval
ence
of l
ow V
itam
in A
(<0,
7 μm
ol/L
) am
ong
child
ren
unde
r five
(%)y
ears
of a
ge
<10
<8
2A
nem
ia d
efici
ency
am
ong
preg
nant
wom
en (%
)28
23
Obe
sity
and
ove
rwei
ght
1O
besi
ty p
reva
lenc
e am
ong
adul
ts (%
)<8
<12
Kno
wle
dge
on g
ood
nutr
ition
pra
ctic
e
1R
ate
of in
fant
s und
er 6
mon
ths e
xclu
sive
ly b
reas
tfed
(%)
2735
Perf
orm
ance
of n
utri
tion
netw
ork
1R
ate
of n
utrit
ion
staf
fs a
t pro
vinc
e le
vel t
rain
ed in
com
mun
ity n
utrit
ion
from
1 to
3 m
onth
s (%
)75
100
2R
ate
of n
utrit
ion
staf
fs a
t dis
trict
leve
l tra
ined
in c
omm
unity
nut
ritio
n fr
om 1
to 3
mon
ths (
%)
5075

132
Tabl
e 4:
HIV
/AID
S, M
alar
ia, T
B a
nd o
ther
dis
ease
s Pre
vent
ion
and
Con
trol
Indi
cato
rs
H
IV/A
IDS,
Mal
aria
, TB
and
oth
er d
isea
ses P
reve
ntio
n an
d C
ontr
ol In
dica
tors
20
1520
20
HIV
/AID
S
1Pe
ople
age
d 15
-49
with
com
preh
ensi
ve k
now
ledg
e on
HIV
/AID
S (%
)80
2Pe
ople
with
out s
ocia
l stig
ma
and
disc
rimin
atio
n ag
ains
t HIV
/AID
S pa
tient
s (%
)80
3To
redu
ce n
ew in
fect
ions
am
ong
the
IDU
gro
up (%
)50
80
4To
redu
ce n
ew H
IV in
fect
ions
thro
ugh
sexu
al in
terc
ours
es (%
)50
80
5H
IV tr
ansm
issi
on fr
om m
othe
r to
child
(%)
52
6H
IV in
fect
ed p
eopl
e re
ceiv
ing
ARV
trea
tmen
t (%
)80
Mal
aria
1M
alar
ia p
reva
lenc
e (p
er 1
,000
peo
ple)
0.
15
2M
alar
ia-r
elat
ed d
eath
s (pe
r 100
,000
peo
ple)
0.02
TB a
nd L
ung
dise
ases
1R
ate
of p
rovi
nces
with
hos
pita
ls sp
ecia
lizin
g in
TB
and
lung
dis
ease
s (%
)
100

133
6. E
nvir
onm
enta
l ind
icat
ors
Targ
ets a
nd in
dica
tors
for e
nvir
onm
enta
l pro
tect
ion
afte
r 201
5•
Red
uce
sign
ifica
ntly
env
ironm
enta
l po
llutio
n so
urce
s. Pr
even
t th
e oc
curr
ence
of
and
deal
com
plet
ely
with
fac
ilitie
s w
hich
se
vere
ly p
ollu
te t
he e
nviro
nmen
t. Im
prov
e en
viro
nmen
t in
pol
lute
d an
d de
grad
ed a
reas
; im
prov
e th
e liv
ing
cond
ition
s of
peo
ple.
C
ontro
l the
env
ironm
enta
l saf
ety
and
tack
le e
nviro
nmen
tal p
ollu
tions
cau
sed
by w
ars.
•Im
prov
e th
e qu
ality
of
air
envi
ronm
ent i
n ur
ban
area
s an
d hi
ghly
pop
ulat
ed a
reas
. Im
prov
e si
gnifi
cant
ly th
e en
viro
nmen
t of
hand
icra
ft vi
llage
s and
rura
l are
as.
•R
educ
e th
e de
gree
of d
eple
tion
and
degr
adat
ion
of n
atur
al re
sour
ces
and
rest
rain
the
loss
rate
of b
iodi
vers
ity a
nd e
xtin
ctio
ns.
Man
age
effe
ctiv
ely
fore
st e
xplo
itatio
n an
d pu
t an
early
end
to th
e ex
ploi
tatio
n of
nat
ural
reso
urce
s.
•In
crea
se th
e ca
paci
ty to
act
ivel
y re
spon
se to
clim
ate
chan
ge a
nd re
duce
the
cons
umpt
ion
of o
zone
-dep
letin
g su
bsta
nces
.
No.
Indi
cato
rsG
over
nmen
t age
ncie
s in
cha
rge
Roa
dmap
2020
1R
educ
e si
gnifi
cant
ly e
nvir
onm
enta
l pol
lutio
n so
urce
s
a.Pr
opor
tion
of n
ewly
con
stru
cted
bus
ines
s es
tabl
ishm
ents
mee
ting
the
requ
irem
ents
for
env
ironm
enta
l pr
otec
tion
MO
NR
E10
0%
b.Pr
opor
tion
of e
xist
ing
busi
ness
est
ablis
hmen
ts p
ollu
ting
envi
ronm
ent
MO
NR
ED
ecre
ase
by 5
0%
c.t.
2010
c.Pr
opor
tion
of in
dust
rial z
ones
mee
ting
the
requ
irem
ents
for e
nviro
nmen
tal p
rote
ctio
nM
ON
RE
95%
d.Pr
opor
tion
of tr
aditi
onal
vill
ages
mee
ting
the
requ
irem
ents
for e
nviro
nmen
tal p
rote
ctio
nM
ON
RE
60%
e.Pr
opor
tion
of c
omm
unes
mee
ting
sani
tatio
n an
d hy
gien
e st
anda
rds o
f new
rura
l pro
gram
me
MA
RD
50%
g.Th
e nu
mbe
r of c
hem
ical
, rad
iatio
n an
d nu
clea
r acc
iden
tsM
ST0
h.Pr
opor
tion
of u
rban
zon
es o
f ty
pe I
V a
nd h
ighe
r ha
ving
con
cent
rate
d w
aste
wat
er tr
eatm
ent s
yste
ms
mee
ting
the
requ
irem
ents
MO
C70
%

134
No.
Indi
cato
rsG
over
nmen
t age
ncie
s in
cha
rge
Roa
dmap
2020
i.Pr
opor
tion
of in
dust
rial a
nd p
roce
ssin
g zo
nes,
clus
ters
hav
ing
conc
entra
ted
was
te w
ater
trea
tmen
t sys
-te
ms m
eetin
g th
e re
quire
men
tsM
ON
RE
95%
k.Pr
opor
tion
of u
rban
solid
was
te c
olle
cted
MO
C95
%
l.Pr
opor
tion
of ru
ral s
olid
was
te c
olle
cted
MA
RD
75%
m.
Prop
ortio
n of
solid
was
te re
used
, rec
ycle
d or
reco
vere
d in
ene
rgy,
use
d fo
r fer
tiliz
er p
rodu
ctio
nM
ON
RE
85%
n.Pr
opor
tion
of h
azar
dous
was
te p
roce
ssed
, dis
pose
d an
d bu
ried
safe
ly a
fter b
eing
pro
cess
ed a
nd d
ispo
sed
MO
NR
E85
%
o.Th
e le
vel o
f pro
duct
ion
and
cons
umpt
ion
of p
ersi
sten
t bag
s and
pac
ksM
OIT
Dec
reas
e by
30%
c.
t. 20
10
p.Pr
opor
tion
of m
edic
al w
aste
pro
cess
ed, d
ispo
sed
and
burie
d sa
fely
afte
r bei
ng p
roce
ssed
and
dis
pose
dM
OH
100%
q.Th
e nu
mbe
r of l
andfi
ll si
tes m
eetin
g th
e te
chni
cal a
nd sa
nita
tion
requ
irem
ents
MO
NR
E90
%
r.Pr
opor
tion
of u
rban
, ind
ustri
al a
nd p
roce
ssin
g zo
nes,
indu
stria
l clu
ster
s pr
oces
sing
sol
id w
aste
, wat
er
was
te m
eetin
g th
e eq
uiva
lent
nat
iona
l tec
hnic
al st
anda
rds o
r cod
es (%
)M
OC
70%
s.Pr
opor
tion
of so
lid w
aste
col
lect
ed a
nd p
roce
ssed
com
plyi
ng w
ith th
e eq
uiva
lent
tech
nica
l sta
ndar
ds a
nd
code
s (%
)M
OC
90%
t.Pr
opor
tion
of h
ouse
hold
was
te re
used
or r
ecyc
led
MO
NR
E65
%
2Im
prov
e en
viro
nmen
t in
pollu
ted
and
degr
aded
are
as a
nd im
prov
e th
e liv
ing
cond
ition
s of p
eopl
e
a.Pr
opor
tion
of su
rfac
e w
ater
are
a of
pon
ds, l
akes
, can
als,
ditc
hes a
nd ri
vers
in u
rban
and
resi
dent
ial a
reas
, w
hich
hav
e be
en im
prov
ed a
nd re
stor
edM
OC
Incr
ease
by
70%
c.
t. 20
10
b.Pr
opor
tion
of im
prov
ed a
nd re
stor
ed la
nd a
reas
whi
ch w
ere
prev
ious
ly p
oiso
ned
and
cont
amin
ated
with
di
oxin
, che
mic
als,
pest
icid
es a
nd o
ther
pol
luta
nts
MO
NR
ED
ecre
ase
by 5
0%
c.t.
2010
c.Pr
opor
tion
of a
rea
of d
egra
ded
natu
ral e
colo
gica
l sys
tem
s whi
ch h
ave
been
impr
oved
and
reco
vere
dM
ON
RE
Incr
ease
by
50%
c.
t. 20
10
d.Pr
opor
tion
of u
rban
pop
ulat
ion
prov
ided
with
cle
an d
omes
tic w
ater
MO
C10
0%
e.Pr
opor
tion
of u
rban
pop
ulat
ion
usin
g cl
ean
and
safe
wat
erM
OC
95%

135
No.
Indi
cato
rsG
over
nmen
t age
ncie
s in
cha
rge
Roa
dmap
2020
g.Pr
opor
tion
of ru
ral p
opul
atio
n pr
ovid
ed w
ith c
lean
dom
estic
wat
erM
AR
D95
%
h.Pr
opor
tion
of ru
ral p
opul
atio
n us
ing
clea
n an
d sa
fe w
ater
MA
RD
90%
i.Pr
opor
tion
of ru
ral h
ouse
hold
s hav
ing
sani
tary
latri
nes
MA
RD
95%
j.Pr
opor
tion
of p
ublic
gre
en a
rea
in u
rban
and
resi
dent
ial a
reas
MO
CIn
crea
se b
y 30
%
c.t.
2010
k.Th
e am
ount
of h
azar
dous
subs
tanc
es in
the
air i
n ur
ban
and
resi
dent
ial a
reas
MO
NR
EC
ompl
y w
ith th
e st
anda
rd
l.D
ecre
ase
in th
e le
vel o
f gro
und
wat
er a
nd su
rfac
e w
ater
(m3/
pers
on/y
ear)
MO
NR
E17
70 m
3/pe
rson
/ye
ar
3R
educ
e th
e de
gree
of d
eple
tion
and
degr
adat
ion
of n
atur
al r
esou
rces
and
res
trai
n th
e lo
ss r
ate
of b
iodi
vers
ity a
nd e
xtin
ctio
ns
a.Pr
opor
tion
of a
rea
of a
gric
ultu
ral l
and
loss
due
to la
nd u
se c
hang
e, la
nd d
egra
datio
n, so
il ex
haus
tion
and
dese
rtific
atio
nM
AR
DD
ecre
ase
by 3
0%
c.t.
2010
b.A
rea
of ri
ce a
nd v
eget
able
farm
ing
land
MA
RD
3,6
mill
ion
hect
are
c.A
rea
of w
ater
surf
ace
of p
onds
, lak
es, c
anal
s, di
tche
s and
rive
rs in
urb
an a
nd re
side
ntia
l are
asM
OC
Not
dec
reas
e c.
t. 20
10
d.Th
e nu
mbe
r of a
reas
exp
erie
ncin
g w
ater
dep
letio
n du
e to
ove
rexp
loita
tion
MO
NR
EN
ot in
crea
se c
.t.
2010
e.C
onsu
mpt
ion
of w
ater
and
land
are
a pe
r uni
t of G
DP
MO
NR
ED
ecre
ase
by 3
0%
c.t.
2010
g.A
quat
ic re
sour
ces i
n co
asta
l wat
ers
MA
RD
Not
incr
ease
c.t.
20
10h.
Prop
ortio
n of
fore
st c
over
age
MA
RD
45%
i.A
rea
of p
rimev
al fo
rest
sM
AR
DN
ot d
ecre
ase
k.A
rea
of m
angr
ove
fore
sts
MA
RD
Not
dec
reas
e c.
t. 20
10
l.A
rea
of se
a-gr
ass b
eds
MO
NR
EN
ot d
ecre
ase
c.t.
2010

136
m.
Are
a of
cor
al re
efs
MO
NR
EN
ot d
ecre
ase
c.t.
2010
n.To
tal a
rea
of n
atur
e re
serv
esM
ON
RE
3,0
mill
ion
hect
are
o.Th
e nu
mbe
r of e
ndan
gere
d ra
re a
nd p
reci
ous s
peci
esM
ON
RE
Not
incr
ease
c.
t.201
0p.
The
num
ber o
f ext
inct
rare
and
pre
ciou
s spe
cies
MO
NR
E0
q.Th
e nu
mbe
r of e
xtin
ct h
igh
valu
ed a
nd p
reci
ous g
enet
ic re
sour
ces
MO
NR
EN
ot in
crea
se
c.t.2
010
r.Th
e nu
mbe
r of n
atur
al h
erita
ge si
tes,
land
scap
es a
nd n
atur
al b
eaut
y si
tes
MoC
STN
ot d
ecre
ase
c.t.2
010
s.Th
e nu
mbe
r of b
iolo
gica
lly u
nsaf
e in
cide
nts d
ue to
gen
etic
ally
mod
ified
org
anis
ms
MO
H0
t.Th
e nu
mbe
r and
the
inva
sion
leve
l of i
nvas
ive
alie
n sp
ecie
sM
ON
RE
Not
incr
ease
c.t.
20
10
4In
crea
se th
e ca
paci
ty to
act
ivel
y re
spon
se to
clim
ate
chan
ge a
nd r
educ
e sl
ight
ly th
e co
nsum
ptio
n of
ozo
ne-d
eple
ting
subs
tanc
es.
a.Pr
opor
tion
of p
opul
atio
n be
ing
awar
e of
and
hav
ing
know
ledg
e of
res
pons
e an
d ad
apta
tion
to c
limat
e ch
ange
MO
NR
E10
0%
b.Pr
opor
tion
of s
trate
gies
, pla
nnin
g, s
chem
es, p
rogr
amm
es a
nd p
roje
cts
taki
ng in
to c
onsi
dera
tion
the
im-
pact
of c
limat
e ch
ange
, esp
ecia
lly se
a le
vel r
ise
MPI
90%
c.Pr
opor
tion
of n
atur
al e
colo
gica
l sys
tem
s of n
atio
nal a
nd in
tern
atio
nal i
mpo
rtanc
e w
ith im
prov
ed c
limat
e ch
ange
ada
ptat
ion
capa
city
MO
NR
EIn
crea
se b
y 60
% c
.t 20
10
d.Pr
opor
tion
of c
omm
uniti
es in
vill
ages
, ham
lets
rece
ivin
g ca
paci
ty b
uild
ing
to a
ctiv
ely
resp
onse
to c
limat
e ch
ange
and
nat
ural
dis
aste
rsM
AR
DIn
crea
se b
y 90
% c
.t 20
10
e.C
onsu
mpt
ion
of a
ll O
zone
-Dep
letin
g Su
bsta
nces
per
uni
t of G
DP
MO
NR
ER
educ
e by
7-8
% c
.t 20
10
No.
Indi
cato
rsG
over
nmen
t age
ncie
s in
cha
rge
Roa
dmap
2020

137
Env
iron
men
tal p
rote
ctio
n in
dica
tors
by
2020
(cro
ss-c
uttin
g in
pol
icie
s on
min
eral
and
min
ing)
•In
exp
lora
tion,
min
ing,
pro
cess
ing
activ
ities
, it
is n
eces
sary
to
inve
st i
n te
chno
logy
ren
ovat
ion,
rep
lace
min
eral
pro
cess
ing
esta
blis
hmen
ts w
hich
are
out
date
d, h
as lo
w m
iner
al re
cove
ry ra
tio o
r pol
lute
the
envi
ronm
ent s
ever
ely.
Env
iron
men
tal p
rote
ctio
n in
dica
tors
by
2020
(cro
ss-c
uttin
g in
land
use
mas
ter p
lan)
Indi
cato
rsA
reas
in la
nd u
se m
aste
r pl
an u
ntil
2020
Uni
t: 10
00 h
ecta
re
1. A
gric
ultu
ral l
and
26,7
32
−R
ice
farm
ing
land
3,81
2
−O
f whi
ch: W
et ri
ce fa
rmin
g la
nd (m
ore
than
2 c
rops
)3,
222
−Pr
otec
tive
fore
st5,
842
−Sp
ecia
l use
fore
st2,
271
−Pr
oduc
tion
fore
st8,
132
−Sa
lt m
akin
g la
nd15
−A
quac
ultu
re la
nd79
0
2. N
on-a
gric
ultu
ral l
and
4,88
0
−La
nd fo
r lan
dsca
pe a
nd to
uris
t attr
actio
n28
−La
nd fo
r was
te d
ispo
sal a
nd p
roce
ssin
g (o
f whi
ch th
ere
is la
nd fo
r dis
posi
ng a
nd p
roce
ssin
g ha
zard
ous
was
te)
21
−La
nd fo
r urb
an re
side
ntia
l are
as20
2

138
Res
pons
e to
clim
ate
chan
ge in
dica
tors
by
2020
•Im
prov
e th
e ca
paci
ty o
f spe
cial
ized
gov
ernm
ent a
genc
ies
and
depa
rtmen
ts in
fore
cast
ing,
ale
rting
to a
nd s
uper
visi
ng c
limat
e ch
ange •
Esta
blis
h th
e pu
blic
’s a
war
enes
s of n
atur
al d
isas
ter p
reve
ntio
n an
d re
spon
se to
clim
ate
chan
ge
•R
educ
e st
eadi
ly th
e lo
sses
cau
sed
by n
atur
al d
isas
ters
in b
oth
casu
altie
s and
ass
ets
•Pr
oact
ivel
y pr
even
t, re
duce
the
impa
ct o
f flo
od-ti
de, fl
oodi
ng, s
altw
ater
intru
sion
cau
sed
by r
isin
g se
a le
vel i
n co
asta
l are
as,
espe
cial
ly M
ekon
g R
iver
Del
ta, R
ed R
iver
Del
ta, C
entra
l Coa
st a
nd fi
rst o
f all
in H
o C
hi M
inh
City
, Can
Tho
, Ca
Mau
and
oth
er c
oast
al
citie
s •R
educ
e th
e co
nsum
ptio
n of
gre
enho
use
gass
es p
er G
DP
unit
by 8
-10
perc
ent i
n co
mpa
rison
with
that
of 2
010
Impr
ovem
ents
in n
atur
al re
sour
ce m
anag
emen
t ind
icat
ors b
y 20
20•
Eval
uate
the
pote
ntia
l and
val
ue o
f im
porta
nt in
-land
reso
urce
s
•M
ake
impo
rtant
pro
gres
s in
basi
c su
rvey
of s
ea re
sour
ces
•Pl
an, m
anag
e an
d ex
ploi
t, us
e ec
onom
ical
ly, e
ffici
ently
and
sust
aina
bly
natio
nal r
esou
rces
•St
op th
e de
crea
se o
f for
est a
nd fr
eshw
ater
reso
urce
s
•Im
prov
e th
e ef
ficie
ncy
of w
ater
use
per
GD
P un
it
•En
sure
the
bala
nce
of la
nd fu
nd fo
r soc
io-e
cono
mic
dev
elop
men
t
•Pr
eser
ve a
nd u
se fl
exib
ly 3
.8 m
illio
n ha
of r
ice
farm
ing
land
to e
nsur
e fo
od se
curit
y an
d im
prov
e th
e ef
ficie
ncy
of la
nd u
se
•Ex
ploi
t sus
tain
ably
and
effe
ctiv
ely
ecol
ogic
al co
nditi
ons,
land
scap
e and
bio
logy
reso
urce
s. M
inim
ize
the e
xpor
t of r
aw m
iner
als
•C
hang
e th
e en
ergy
use
stru
ctur
e in
the
dire
ctio
n th
at in
crea
ses t
he p
ropo
rtion
of r
enew
able
ene
rgy
and
new
ene
rgy
to m
ore
than
5
perc
ent o
f tot
al p
rimar
y co
mm
erci
al e
nerg
y
•R
educ
e of
the
ener
gy c
onsu
mpt
ion
per G
DP
unit

139
Gre
en g
row
th in
dica
tors
by
2020
•Re
duce
the e
mis
sion
of g
reen
hous
e gas
ses a
nd p
rom
ote t
he co
nsum
ptio
n of
clea
n en
ergy
, ren
ewab
le en
ergy
to m
eet t
he fo
llow
ing
maj
or in
dica
tors
:
2011
-202
0 pe
riod:
Com
parin
g 20
20 to
201
0, r
educ
e th
e em
issi
on o
f gr
eenh
ouse
gas
ses
by 8
-10
perc
ent.
Red
uce
the
ener
gy
cons
umpt
ion
to G
DP
by 1
-1.5
per
cent
eac
h ye
ar. R
educ
e th
e em
issi
on o
f gre
enho
use
gass
es in
ene
rgy
cons
umpt
ion
activ
ities
by
10-2
0 pe
rcen
t com
pare
d to
that
of t
ypic
al d
evel
opm
ent p
lan.
The
vol
unta
ry re
duct
ion
is at
abou
t 10
perc
ent.
The r
emai
ning
10
perc
ent d
epen
ds
on in
tern
atio
nal a
ids.
Orie
ntat
ion
to 2
030:
Red
uce
the
emis
sion
of
gree
nhou
se g
asse
s by
at l
east
1.5
-2 p
erce
nt e
ach
year
. Red
uce
the
emis
sion
of
gree
nhou
se g
asse
s in
ene
rgy
cons
umpt
ion
activ
ities
by
20-3
0 pe
rcen
t com
pare
d to
that
of
typi
cal d
evel
opm
ent p
lan.
The
vol
unta
ry
redu
ctio
n is
at a
bout
20%
. The
rem
aini
ng 1
0 pe
rcen
t dep
ends
on
inte
rnat
iona
l aid
s.
Orie
ntat
ion
to 2
050:
Red
uce
the
emis
sion
of g
reen
hous
e ga
sses
by
1.5-
2 pe
rcen
t eac
h ye
ar.
•G
reen
pro
duct
ion
Impl
emen
t the
clea
n ind
ustri
al st
rate
gy by
revi
ewin
g and
adju
stin
g exi
stin
g ind
ustry
plan
ning
, usi
ng na
tura
l res
ourc
es ec
onom
ical
ly
and
effe
ctiv
ely,
enc
oura
ging
the
deve
lopm
ent o
f gre
en in
dust
ry a
nd a
gric
ultu
re w
ith e
co-f
riend
ly in
dust
ry s
truct
ure,
tech
nolo
gy a
nd
equi
pmen
t, in
vest
ing
in d
evel
opin
g na
tura
l cap
ital,
activ
ely
prev
entin
g an
d co
ntro
lling
pol
lutio
n
Maj
or in
dica
tors
unt
il 20
20 in
clud
e: th
e va
lue
of p
rodu
cts i
n hi
gh te
ch a
nd g
reen
indu
strie
s acc
ount
s for
42-
45 p
erce
nt o
f GD
P,
the
prop
ortio
n of
bus
ines
s est
ablis
hmen
ts m
eetin
g th
e en
viro
nmen
tal s
tand
ards
is 8
0 pe
rcen
t, th
e pr
opor
tion
of b
usin
ess e
stab
lishm
ents
ap
plyi
ng c
lean
tech
nolo
gies
is o
ver 5
0 pe
rcen
t, in
vest
men
t in
deve
lopi
ng e
nviro
nmen
tal p
rote
ctio
n su
ppor
ting
indu
strie
s and
enr
ichi
ng
natu
ral c
apita
l rea
ches
3-4
per
cent
of G
DP
•Pr
omot
e gr
een
lifes
tyle
and
sust
aina
ble
cons
umpt
ion
Com
bine
goo
d tra
ditio
nal l
ifest
yle
with
mod
ern
civi
lized
tool
s to
cre
ate
a co
nven
ient
, hig
h qu
ality
life
with
in-d
epth
nat
iona
l id
entit
ies f
or m
oder
n V
ietn
am so
ciet
y. Im
plem
ent r
apid
and
sust
aina
ble u
rban
izat
ion,
mai
ntai
n a h
arm
onio
us li
fe w
ith n
atur
e in
the r
ural
ar
ea a
nd e
stab
lish
sust
aina
ble
cons
umpt
ion
habi
ts in
the
cont
ext o
f glo
bal e
cono
mic
inte
grat
ion.
Maj
or in
dica
tors
unt
il 20
20 in
clud
e: T
he p
ropo
rtion
of t
ype
III c
ities
with
was
tew
ater
col
lect
ing
and
proc
essi
ng sy
stem
s mee
ting
the
stan
dard
s is
60
perc
ent.
That
of t
ype
IV, V
citi
es a
nd tr
ade
villa
ges
is 4
0 pe
rcen
t. Im
prov
e 10
0 pe
rcen
t of s
erio
usly
pol
lute
d ar
eas.
The
prop
ortio
n of
col
lect
ed a
nd p
roce
ssed
was
te m
eets
the
code
stat
ed in
the
Dec
isio
n N
o. 2
149/
QD
-TTg
. The
pro
porti
on o
f gre
en tr
ees
reac
hes t
he e
quiv
alen
t urb
an st
anda
rd. T
he p
ropo
rtion
of p
ublic
tran
spor
tatio
n se
rvic
e in
med
ium
and
larg
e si
zed
citie
s is 3
5-45
per
cent
. Th
e pr
opor
tion
of m
ediu
m a
nd la
rge
size
d ci
ties r
ecog
nize
d as
gre
en c
ities
is 5
0 pe
rcen
t

140
Bio
dive
rsity
indi
cato
rs
Targ
ets b
y 20
20•
Impr
ove
the
qual
ity a
nd in
crea
se th
e ar
ea o
f pro
tect
ed e
colo
gica
l sys
tem
s. Th
e ar
ea o
f in-
land
nat
ural
rese
rves
acc
ount
s for
9
perc
ent o
f nat
iona
l are
a, th
e ar
ea o
f sea
nat
ural
rese
rves
am
ount
s to
0.24
per
cent
of s
ea a
rea;
the
prop
ortio
n of
land
cov
ered
by
fore
st
reac
hes
45 p
erce
nt; t
he a
rea
of p
rimiti
ve fo
rest
is k
ept a
t 0.5
7 m
illio
n ha
. The
re is
an
effe
ctiv
e pr
otec
tion
plan
for p
rimiti
ve fo
rest
. Th
e ar
ea o
f man
grov
e fo
rest
, sea
gra
ss b
ed a
nd c
oral
reef
is m
aint
aine
d at
the
curr
ent l
evel
. Res
tore
15
perc
ent o
f the
deg
rade
d ar
ea o
f im
porta
nt n
atur
al e
colo
gica
l sys
tem
. The
num
ber o
f int
erna
tiona
l rec
ogni
zed
natu
re re
serv
es o
f Vie
tnam
am
ount
s to
10 R
amsa
r site
s, 10
bio
sphe
re re
serv
es, 1
0 A
SEA
N H
erita
ge P
arks
.
•Im
prov
e th
e qu
ality
and
qua
ntity
of t
he p
opul
atio
n of
end
ange
red,
rare
, pre
ciou
s, pr
iorit
ized
spe
cies
. Pre
vent
the
incr
ease
in
the
num
ber o
f dis
tinct
spec
ies.
Impr
ove
sign
ifica
ntly
the
cond
ition
s of e
ndan
gere
d, ra
re, p
reci
ous a
nd p
riorit
ized
spec
ies.
•In
vent
ory,
pre
serv
e an
d co
nser
ve r
are
and
prec
ious
loca
l gen
etic
sou
rces
(do
mes
tic a
nim
als,
crop
pla
nts,
mic
roor
gani
sms)
. Pr
even
t the
dec
reas
e an
d er
osio
n of
rare
and
pre
ciou
s loc
al g
enet
ic so
urce
s.
Targ
ets b
y 20
30: t
he p
ropo
rtion
of i
nter
natio
nally
and
natio
nally
impo
rtant
ecol
ogic
al sy
stem
rest
ored
is 2
5 pe
rcen
t. C
onse
rve
and
use
sust
aina
bly
biod
iver
sity
to p
rovi
de e
ssen
tial b
enefi
ts to
peo
ple
and
mak
e im
porta
nt c
ontri
butio
ns to
the
soci
o-ec
onom
ic
deve
lopm
ent o
f the
cou
ntry
.

141
Hou
sing
indi
cato
rs:
Targ
ets b
y 20
20•
The
natio
nal a
vera
ge fl
oor a
rea
per p
erso
n is
abo
ut 2
5 m
2. In
urb
an a
reas
, thi
s ta
rget
is a
bout
29
m2
and
in ru
ral a
reas
, thi
s ta
rget
is a
bout
22
m2.
Stri
ve to
reac
h th
e m
inim
um fl
oor a
rea
per p
erso
n is
8 m
2.
•D
urin
g th
e pe
riod
of 2
016-
2020
, stri
ve to
inve
st in
con
stru
ctio
n of
at l
east
12.
5 m
illio
n m
2 of
soc
ial h
ousi
ng in
urb
an a
reas
, sa
tisfy
ing
abou
t 80
perc
ent o
f the
num
ber o
f stu
dent
s of u
nive
rsiti
es, c
olle
ges,
prof
essi
onal
seco
ndar
y sc
hool
s and
voc
atio
nal s
choo
ls
and
abou
t 70
perc
ent o
f wor
kers
in in
dust
rial z
ones
; sup
porti
ng ab
out 5
00,0
00 h
ouse
hold
s (ac
cord
ing
to n
ew p
over
ty st
anda
rds)
livi
ng
in ru
ral a
reas
to im
prov
e ho
usin
g co
nditi
ons.
•Th
e pro
porti
on o
f per
man
ent h
ouse
s is a
bout
70
perc
ent.
In u
rban
area
s, th
is ta
rget
is ab
ove 7
5 pe
rcen
t, in
rura
l are
as, t
his t
arge
t re
ache
s 65
perc
ent.
Elim
inat
e al
l sim
ple
hous
es a
cros
s the
cou
ntry
. Inc
reas
e th
e pr
opor
tion
of h
ouse
hold
s hav
ing
sani
tary
latri
nes t
o 90
per
cent
. In
urba
n ar
eas,
this
targ
et is
app
roxi
mat
ely
100
perc
ent a
nd in
rura
l are
as, t
his t
arge
t is a
bove
80
perc
ent.
•Th
e pr
opor
tion
of a
partm
ents
in h
ousi
ng d
evel
opm
ent p
roje
cts
in s
peci
al c
ities
(Han
oi a
nd H
o C
hi M
inh
City
) is
abov
e 90
pe
rcen
t of t
he to
tal n
umbe
r of n
ewly
bui
lt ho
uses
. The
targ
et in
type
I an
d II
citi
es is
abo
ve 6
0 pe
rcen
t. Th
e ta
rget
in ty
pe II
I citi
es
is a
bove
40
perc
ent.
The
prop
ortio
n of
rent
ed h
ouse
s rea
ches
abo
ve 3
0 pe
rcen
t of t
he to
tal h
ousi
ng fu
nd in
type
III a
nd a
bove
citi
es.
Targ
ets b
y 20
30: T
he n
atio
nal a
vera
ge fl
oor a
rea
per p
erso
n is
abo
ve 3
0 m
2. T
he m
inim
um fl
oor a
rea
per p
erso
n is
12
m2.

142
7.
Oth
er in
dica
tors
Eth
nic
min
ority
indi
cato
rs b
y 20
20•
Rai
sing
the
inte
llect
ual s
tand
ard
of e
thni
c m
inor
ity a
nd d
evel
op e
thni
c m
inor
ity h
uman
reso
urce
s. Th
e pr
opor
tion
of e
thni
c m
inor
ity la
bor r
ecei
ving
edu
catio
n an
d tra
inin
g is
abo
ve 5
0 pe
rcen
t, of
whi
ch 2
0 pe
rcen
t rec
eive
s pr
ofes
sion
al tr
aini
ng. E
nsur
e th
at
ther
e is
per
man
ent s
choo
ls, s
choo
l offi
ces a
nd d
orm
itorie
s whe
re n
eces
sary
. The
pro
porti
on o
f sch
ool a
ge c
hild
ren
goin
g to
scho
ol is
95
per
cent
. The
num
ber o
f uni
vers
ity a
nd c
olle
ge s
tude
nts
is 3
00 p
er 1
0,00
0 ha
bita
nts.
The
prop
ortio
n of
agr
icul
ture
labo
rs is
abo
ut
50 p
er o
f the
labo
r for
ce.
•Et
hnic
min
ority
cad
res:
The
pol
itica
l sys
tem
s at
all
leve
l, pa
rticu
larly
adm
inis
trativ
e sy
stem
s in
eth
nic
min
ority
are
as h
ave
to e
nsur
e a
reas
onab
le p
ropo
rtion
and
stru
ctur
e of
eth
nic
min
ority
offi
cial
s. It
is e
ssen
tial t
o ha
ve e
thni
c m
inor
ity o
ffici
als
in k
ey
posi
tions
. The
pro
porti
on o
f com
mun
e of
ficia
ls re
ceiv
ing
train
ing
is 1
00 p
erce
nt. T
he p
ropo
rtion
of c
omm
une
offic
ials
hav
ing
colle
ge
and
univ
ersi
ty d
egre
es o
r hig
her i
s 70
perc
ent.
•Po
verty
eth
nic
min
ority
: Ave
rage
ann
ual p
over
ty r
educ
tion
rate
is 4
per
cent
; eth
nic
min
ority
pov
erty
red
uctio
n ra
te in
the
Nor
thw
est,
Cen
tral H
ighl
ands
, Sou
thw
est,
Cen
tral C
oast
, Eas
t Tru
ong
Son,
the
revo
lutio
nary
bas
e ar
eas
is 4
-5 p
erce
nt e
ach
year
; el
imin
ate
dila
pida
ted
hous
ing,
the
prop
ortio
n of
hou
ses
mee
ting
stan
dard
s is
70
perc
ent,
ensu
re a
vera
ge in
com
e pe
r cap
ita in
eth
nic
min
ority
area
s inc
reas
es 4
tim
es co
mpa
red
to th
e cur
rent
leve
l; ba
sica
lly so
lve t
he sh
orta
ge o
f lan
d an
d w
ater
for p
rodu
ctio
n; g
radu
ally
cr
eate
goo
ds a
nd p
rodu
cts
of h
igh
econ
omic
val
ue fo
r con
sum
ptio
n an
d ex
port;
impl
emen
t ins
uran
ce p
olic
ies
for s
ome
agric
ultu
re
prod
ucts
.
•In
fras
truct
ure
in e
thni
c m
inor
ity a
reas
: Ens
ure
100
perc
ent o
f int
er-c
omm
unal
road
s is a
spha
lt or
con
cret
e, a
nd o
ver 5
0 pe
rcen
t of
inte
r-ham
let,
inte
r-vill
age
road
s is
har
den
com
plyi
ng w
ith th
e te
chni
cal s
tand
ards
sta
ted
in N
ew ru
ral d
evel
opm
ent p
rogr
am; t
he
prop
ortio
n of
hou
seho
lds u
sing
ele
ctric
ity re
gula
rly is
ove
r 95
perc
ent;
the
prop
ortio
n of
hou
seho
lds u
sing
cle
an w
ater
is 1
00 p
erce
nt;
com
mun
es h
ave
post
al, t
elec
omm
unic
atio
ns, i
nter
net s
ervi
ce c
onne
ctin
g to
mos
t of t
he v
illag
es.

143
•C
ultu
re a
nd so
ciet
y in
eth
nic
min
ority
are
as: C
onse
rve
and
prom
ote
tradi
tiona
l cul
tura
l ide
ntiti
es; t
he p
ropo
rtion
of h
ouse
hold
s w
atch
ing
tele
visi
on is
100
per
cent
. Res
pond
incr
easi
ngly
bet
ter
to th
e ne
eds
of r
ecei
ving
rad
io a
nd te
levi
sion
cha
nnel
s. D
evel
op
hum
an re
sour
ces f
ully
in te
rms o
f int
elle
ctua
l, m
oral
, phy
sica
l, sp
iritu
al, c
itize
nshi
p an
d la
w-a
bidi
ng a
spec
ts. T
he p
ropo
rtion
of h
ealth
st
atio
ns m
eetin
g na
tiona
l sta
ndar
ds a
nd h
avin
g do
ctor
s is 1
00 p
erce
nt. I
mpl
emen
t hea
lth in
sura
nce
polic
y fo
r eth
nic
min
oriti
es.
•Li
ving
env
ironm
ent i
n et
hnic
min
ority
are
as: M
inim
ize
the
dam
age
caus
ed b
y en
viro
nmen
tal a
nd n
atur
al d
isas
ters
; rea
rran
ge
the
lives
tock
, pou
ltry
and
toile
t are
as to
ens
ure
hygi
enic
rura
l env
ironm
ent.
Scie
nce
and
tech
nolo
gy in
dica
tors
by
2020
•In
202
0, sc
ienc
e and
tech
nolo
gy co
ntrib
ute s
igni
fican
tly to
econ
omic
gro
wth
and
rest
ruct
urin
g. T
he v
alue
of h
igh
tech
pro
duct
s an
d pr
oduc
ts a
pply
ing
high
tech
nolo
gy re
ache
s 45
per
cent
of G
DP.
The
spe
ed o
f tec
hnol
ogic
al a
nd e
quip
men
t inn
ovat
ion
is o
ver 2
0 pe
rcen
t/yea
r in
the
perio
d of
201
6-20
20. T
he tr
ansa
ctio
n va
lue
of s
cien
ce a
nd te
chno
logy
mar
ket i
ncre
ases
by
an a
vera
ge o
f 15-
17
perc
ent/y
ear.
•Th
e nu
mbe
r of
inte
rnat
iona
l pub
licat
ions
fro
m r
esea
rch
proj
ects
fina
nced
by
stat
e bu
dget
incr
ease
by
an a
vera
ge o
f 15
-20
perc
ent/y
ear.
The
num
ber o
f pat
ents
in th
e pe
riod
of 2
016-
2020
dou
bles
com
pare
d w
ith th
at o
f the
per
iod
2011
-201
5. In
crea
se ra
pidl
y th
e nu
mbe
r of p
aten
ts re
sulte
d fr
om th
e na
tiona
l key
scie
ntifi
c an
d te
chno
logi
cal p
rogr
ams.
•St
rive
to in
crea
se to
tal s
ocia
l inv
estm
ent c
apita
l in
scie
nce
and
tech
nolo
gy to
ove
r 2
perc
ent o
f G
DP
in 2
020.
Ens
ure
that
in
vest
men
t fro
m th
e st
ate
budg
et fo
r sci
ence
and
tech
nolo
gy is
not
less
than
2 p
erce
nt o
f the
tota
l ann
ual s
tate
bud
get.
•In
202
0, e
stab
lish
60 b
asic
and
app
lied
rese
arch
org
aniz
atio
ns r
each
ing
regi
onal
and
inte
rnat
iona
l lev
el, c
apab
le o
f so
lvin
g cr
itica
l nat
iona
l pro
blem
s of s
cien
ce a
nd te
chno
logy
; 5,0
00 sc
ienc
e an
d te
chno
logy
com
pani
es; 6
0 hi
tech
incu
bato
rs.

144
Publ
ic d
ebt a
nd fo
reig
n de
bt in
dica
tors
By
2020
•Ra
ise
capi
tal
to m
eet
the
spen
ding
dem
and
of t
he s
tate
bud
get
and
cont
inue
inv
estm
ent
in p
rogr
ams
and
proj
ects
of
infr
astr
uctu
re c
onst
ruct
ion,
tran
spor
tatio
n, h
ealth
, edu
catio
n as
wel
l as
natio
nal t
arge
t pro
gram
follo
wed
the
reso
lutio
ns o
f the
N
atio
nal A
ssem
bly
in e
ach
peri
od.
Use
dom
estic
and
fore
ign
loan
s to
offs
et th
e st
ate
budg
et d
efici
t. G
radu
ally
redu
ce th
e st
ate
budg
et d
efici
t, st
rive
to re
duce
to
abou
t 4 p
erce
nt o
f GD
P fo
r the
per
iod
of 2
016
- 202
0 an
d an
ave
rage
of 3
per
cent
of G
DP
from
202
0 af
terw
ards
Issu
e go
vern
men
t bon
ds to
impl
emen
t inv
estm
ent p
rogr
ams f
or tr
ansp
orta
tion,
irrig
atio
n, h
ealth
, edu
catio
n to
bas
ical
ly m
eet
the
need
s of b
onds
. Iss
ue th
e m
axim
um o
f 500
trill
ion
VN
D o
f gov
ernm
ent b
onds
in th
e pe
riod
of 2
016-
2020
, of w
hich
350
trill
ion
VN
D is
spen
t for
dev
elop
men
t inv
estm
ent a
nd th
e re
st is
use
d fo
r deb
t sw
ap.
To m
obili
ze ab
out 5
50 tr
illio
n VN
D o
f loa
ns (a
t the
max
imum
aver
age o
f 55
trilli
on V
ND
per
yea
r) to
add
to th
e im
plem
enta
tion
of s
ynch
rono
us in
fras
truct
ure
syst
em c
onst
ruct
ion
proj
ects
sup
porti
ng th
e na
tiona
l ind
ustri
aliz
atio
n an
d m
oder
niza
tion
prog
ress
in
the
perio
d of
201
1-20
20.
Perf
orm
dut
ies
of in
vest
men
t cre
dit,
expo
rt cr
edit
and
polic
y cr
edit
of th
e St
ate
on th
e ba
sis
of ta
rget
sel
ectio
n, n
ot ta
rget
ex
pans
ion.
Rec
eive
and
pay
off
loca
l gov
ernm
ent l
oans
to in
vest
in s
ocio
-eco
nom
ic d
evel
opm
ent,
whi
ch b
elon
gs to
the
expe
nditu
re
of lo
cal g
over
nmen
t bud
get m
ade
with
in th
e an
nual
loan
lim
its u
nder
the
prov
isio
ns o
f Sta
te B
udge
t Law
and
Law
on
Publ
ic d
ebt
man
agem
ent.

145
Con
tinue
to su
ppor
t bus
ines
ses t
o ac
cess
fore
ign
capi
tal t
hrou
gh th
e m
echa
nism
of r
elen
ding
fore
ign
gove
rnm
ent l
oans
. Run
th
e go
vern
men
t gua
rant
ee sc
hem
e fo
r im
porta
nt p
rogr
ams a
nd p
roje
cts i
n th
e go
vern
men
t prio
rity
list a
t rea
sona
ble
leve
l with
in th
e sa
fe li
mits
of p
ublic
deb
t rat
ified
by
the
Nat
iona
l Ass
embl
y.
Fore
ign
loan
s of e
nter
pris
es, c
redi
t ins
titut
ions
hav
e to
stay
with
in th
e lim
its o
f cou
ntry
fore
ign
debt
app
rove
d by
the
deci
sion
of
the
Prim
e M
inis
ter.
•St
ruct
ure
the
port
folio
, ter
ms
and
use
of lo
ans
in th
e di
rect
ion
of in
crea
sing
dom
estic
deb
t, de
crea
sing
the
depe
nden
ce o
n fo
reig
n de
bt, e
nhan
cing
effi
cien
cy, g
uara
ntee
ing
repa
ymen
t abi
lity
at re
ason
able
cos
ts a
nd le
vel o
f ris
k.
Red
uce
the
prop
ortio
n of
fore
ign
debt
in to
tal g
over
nmen
t out
stan
ding
deb
t to
belo
w 5
0 pe
rcen
t and
mai
ntai
n th
e pr
opor
tion
of O
DA
loan
at n
o le
ss th
an 6
0 pe
rcen
t of t
he to
tal f
orei
gn o
utst
andi
ng d
ebt i
n 20
20.
Red
uce
the
risk
of re
finan
cing
, liq
uidi
ty, e
xcha
nge
rate
, cur
renc
y. F
orm
ulat
e a
prom
otin
g m
echa
nism
to d
evel
op g
over
nmen
t bo
nd m
arke
t and
striv
e to
ext
end
the
loan
term
to 6
-8 y
ears
by
issu
ing
gove
rnm
ent b
onds
dom
estic
ally
in th
e pe
riod
of 2
016-
2020
.
Fulfi
ll de
bt o
blig
atio
ns a
nd p
reve
nt o
verd
ue d
ebts
affe
ctin
g in
tern
atio
nal c
omm
itmen
ts o
f the
Gov
ernm
ent.
•M
aint
ain
the
indi
cato
rs o
f pub
lic d
ebt,
gove
rnm
ent d
ebt a
nd fo
reig
n de
bt a
t a sa
fe le
vel r
atifi
ed b
y th
e N
atio
nal A
ssem
bly
in
each
per
iod
and
follo
win
g ph
ases
com
plie
d w
ith in
tern
atio
nal p
ract
ices
.
By
2020
, pub
lic d
ebt (
incl
udin
g go
vern
men
t deb
t, de
bt g
uara
ntee
d by
gov
ernm
ent a
nd lo
cal g
over
nmen
t deb
t) do
es n
ot
exce
ed 6
5 pe
rcen
t of G
DP,
of w
hich
gov
ernm
ent o
utst
andi
ng d
ebt d
oes
not e
xcee
d 55
per
cent
of G
DP
and
fore
ign
debt
doe
s no
t ex
ceed
50
perc
ent o
f GD
P.

146
The
prop
ortio
n of
dire
ct d
ebt s
ervi
ces o
f the
gov
ernm
ent (
excl
udin
g re
lend
ing)
to th
e to
tal s
tate
bud
get r
even
ue d
oes n
ot e
xcee
d 25
per
cent
eac
h ye
ar a
nd a
nnua
l for
eign
deb
t ser
vice
s do
not e
xcee
d 25
per
cent
of t
he e
xpor
t tur
nove
r of g
oods
and
serv
ices
.
Ensu
re th
e pr
opor
tion
of fo
reig
n ex
chan
ge re
serv
es to
tota
l sho
rt-te
rm fo
reig
n ou
tsta
ndin
g de
bt is
mor
e th
an 2
00%
eac
h ye
ar.
•C
ontin
ue to
impr
ove
the
fram
ewor
k, in
stitu
tions
and
pol
icy
of p
ublic
deb
t, go
vern
men
t deb
t and
ext
erna
l deb
t man
agem
ent.
Ensu
re th
e co
nsis
tenc
y, st
abili
ty a
nd su
itabi
lity
with
the
requ
irem
ents
of i
nnov
atio
n, c
reat
e fa
vora
ble
cond
ition
s for
the
deve
lopm
ent o
f do
mes
tic c
apita
l mar
kets
and
enh
ance
the
abili
ty o
f pro
activ
ely
appr
oach
ing
and
part
icip
atin
g in
inte
rnat
iona
l cap
ital m
arke
t.•
Con
tinuo
usly
inn
ovat
e th
e or
gani
zatio
n, e
stab
lish
the
mod
ern
and
prof
essi
onal
deb
t m
anag
emen
t gr
adua
lly c
ompl
ied
with
in
tern
atio
nal p
ract
ices
.
By
2030
, gra
dual
ly re
duce
pub
lic d
ebt.
The
prop
ortio
n of
pub
lic d
ebt t
o G
DP
is n
ot m
ore
than
60
perc
ent,
the
prop
ortio
n of
go
vern
men
t deb
t ove
r GD
P is
not
mor
e tha
n 50
per
cent
and
the p
ropo
rtion
of f
orei
gn d
ebt o
ver G
DP
does
not
exce
ed 4
5 pe
rcen
t of G
DP.

147
MINISTRY OF PLANNING AND INVESTMENTDEPARTMENT FOR LABOR, CULTURE AND SOCIAL AFFAIRSMDG PROJECTNo.6B, Hoang Dieu, Ba Dinh, Ha NoiTelephone: +84.80.44577Fax: +84.4.38234453
MEKONG DEVELOPMENT RESEARCH INSTITUTE (MDRI)Level 8, Machinco Building, 444 Hoang Hoa Tham, Tay Ho, Ha NoiTelephone: +84.4.32474668Fax: +84.4.32474596 Website: www.mdri.org.vnEmail: [email protected]

148
Print 1.500 copies, size 20,5x29,5 cm by New Technology Printing Joint Stock Company
Publishing license No. 222 – 2013/CXB/179 – 05/GTVT
Completed and registered in December,2013
In charge of PublishingLE TU GIANG
In charge of ManuscriptMINISTRY OF PLANNING AND INVESTMENT
Graphic publishing and presentationNew Technology Printing Joint Stock Company
Design Nguyen Trung Dung
Photos Vietnam News Agency