ACG Final Pres
22
Fordham Capital ParentCo Proposal Eric Martina Ngoc(Tim) Do Edward Schwarzkopf Matthieu Frechin Samatha Howell
Transcript of ACG Final Pres

Fordham Capital
ParentCo Proposal
Eric MartinaNgoc(Tim) Do
Edward SchwarzkopfMatthieu Frechin
Samatha Howell

Agenda
• Options• Proposal• Valuations
– FashionCo– ApparelCo– MediaCo
• ParentCo Equity Carve-Out• Appendix
Appendix
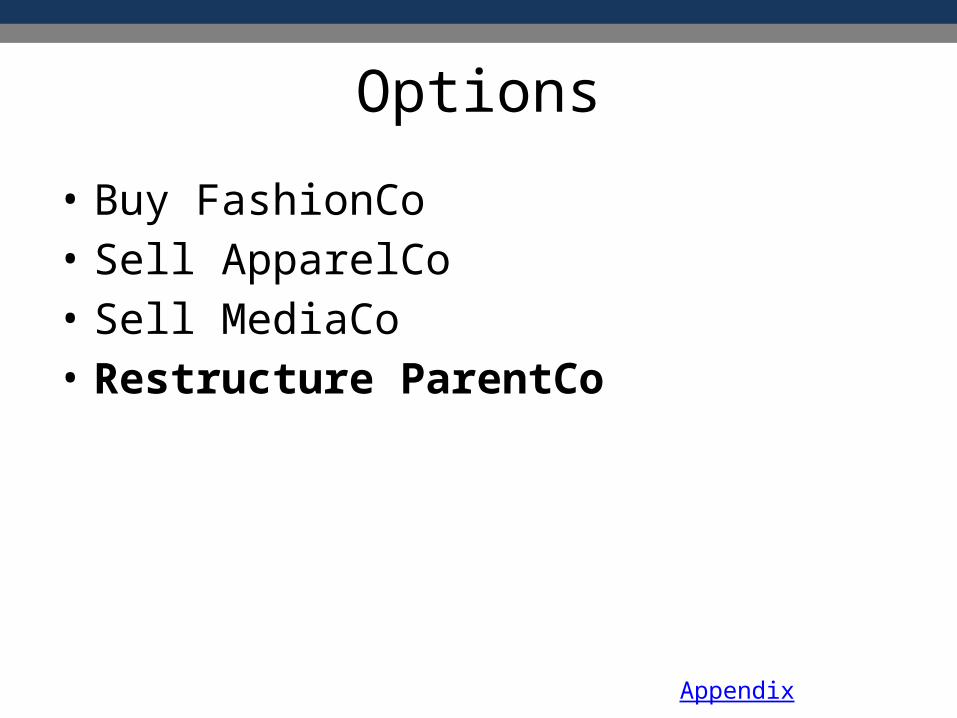
Options
• Buy FashionCo• Sell ApparelCo• Sell MediaCo• Restructure ParentCo
Appendix

Fashion Industry Outlook- Low to mid single digit growth rate- Cyclical - Trendier brands trade at a higher multiple but fall in and out of favor - Not dramatically affected by economic outlook
Appendix
Debt/Total C
apitaliz
ation
Equity/T
otal Capita
lization
ROA
Current R
atio0.0%
50.0%
100.0%
150.0%
200.0%
250.0%
52.7%47.3%
7.2%
146.7%
53.2%46.8%
6.4%
155.6%
20.4%
79.6%
7.1%
220.0%
Profit EBITDA Income0.0%
10.0%
20.0%
30.0%
40.0%
50.0%
ApparelCoFashionCoMean

FashionCo Valuation
Perpetuity Growth Method DCF
In Mil $ Downside Base Upside
EV $34.40 $76.60 $115.40
Appendix
EBITDA Multiple Method DCF
In Mil $ Downside Base Upside
EV $66.50 $119.60 $166.20
P/E Approach
In Mil $ 14.0x 15.0x 16.0x
EV $100.80 $108.00 $115.20
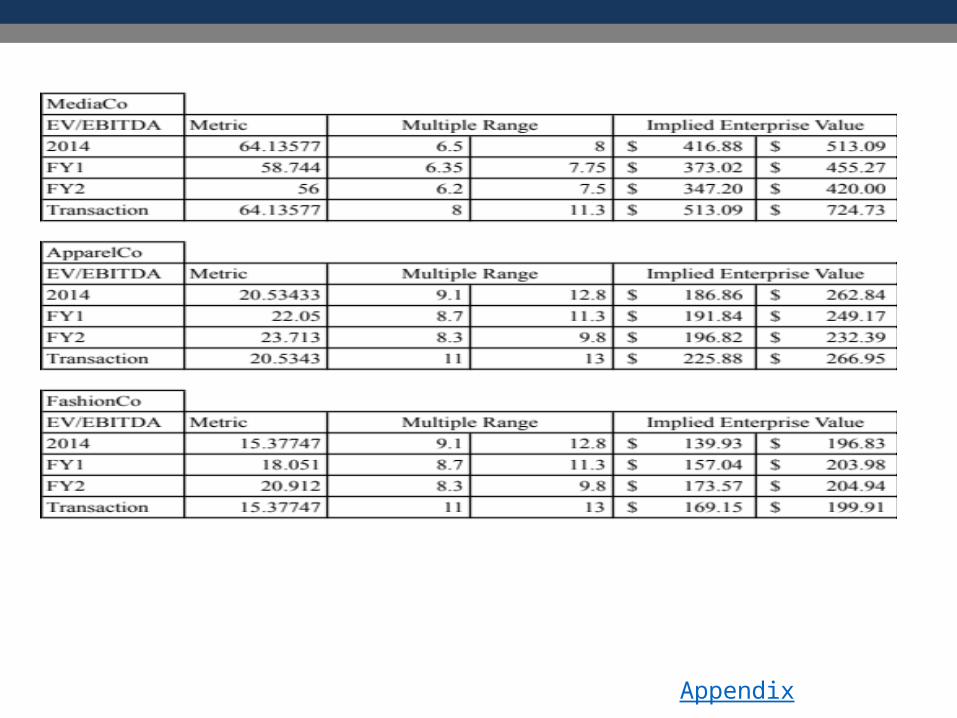
Comparable Multiple EV/EBITDA
In Mil $ 8.0x 9.0x 10.0x
EV $123.02 $138.60 $154.00
Assumptions• WACC: 13.5%• Sale Growth
• Base: 7.2%• Upside: 8%• Downside: 5%
• Net Income 2014: $7.2 Mil• EBITDA 2014: $15.4 Mil
Reasons• High Asking Price - $250 Million• High End vs. Low End• Synergy Analysis • Disagreement from Investor• Core Business – Media Co

ApparelCo Valuation
Perpetuity Growth Method DCF
In Mil $ Downside Base Upside
EV $48.40 $87.40 $164.70
EBITDA Multiple Method DCF
In Mil $ Downside Base Upside
EV $81.70 $123.60 $194.70
P/E Approach
In Mil $ 16.0x 17.0x 18.0x
EV $161.60 $171.70 $181.80
Comparable Multiple EV/EBITDA
In Mil $ 8.0x 9.0x 10.0x
EV $164.20 $184.80 $205.30
Assumptions• WACC: 12.0%• Sale Growth
• Base: 7.5%• Upside: 8.5%• Downside: 5%
• Net Income 2014: $10.1 Mil• EBITDA 2014: $20.5 Mil
Appendix

Media Industry Outlook- Performance in line with general market until the last recession,
lagging since- Lots of consolidation taking place- Little to no expected revenue growth
Appendix
Debt/Total Capital-ization
E/cap ROA Current Ratio-20.0%
0.0%
20.0%
40.0%
60.0%
80.0%
100.0%
120.0%
140.0%
160.0%
180.0%
109.5%
-9.5%
6.3%
99.7%
52.4% 47.6%
5.3%
152.8%
Profit EBITDA Income0.0%
10.0%
20.0%
30.0%
40.0%
50.0%
60.0%
MediaCoMean

MediaCo Valuation
Perpetuity Growth Method DCF
In Mil $ Downside Base Upside
EV $47.90 $247.60 $440.6
EBITDA Multiple Method DCF
In Mil $ Downside Base Upside
EV $79.60 $259.30 $498.30
P/E Approach
In Mil $ 14.0x 15.0x 16.0x
EV $358.40 $384.00 $409.60
Comparable Multiple EV/EBITDA
In Mil $ 6.0x 7.0x 8.0x
EV $384.80 $448.90 $513.10
Assumptions• WACC: 11.0%• Sale Growth
• Base: -1.0%• Upside: 2.5%• Downside: -4%
• Net Income 2014: $25.6 Mil• EBITDA 2014: $64.1 Mil
Appendix

ParentCo – Equity Carve-out• Carve-out stock of ApparellCo• Establish own equity – 100% owned by MediaCo to start
– If the parent keeps a majority interest, the subsidiary will be consolidated into the parent’s financial statements
– If the subsidiary issues new shares alone, and the parent doesn’t sell any shares of the subsidiary, the parent won’t recognize any immediate tax costs related to the transaction
– Retain low borrow rates of ParentCo– Option to completely divest if performance deteriorates.
• Carve-outs are much more common than tracking stocks, so the market understands carve-outs better.
• Carve-outs on average have the strongest TRS performance of any restructuring option, while their effect on P/E multiples is roughly comparable to the effect of the other possibilities.
Appendix

Equity Carve-Out Benefits• Increase in analyst coverage
– Floating equity in business units not previously exposed to the market makes their operating performance more transparent and raises shareholder returns by revealing hidden value
• Attract new investors– Little overlap between those who would invest in a parent company and those who
would invest in it’s subsidiaries after restructuring
• Improved operating performance– Restructuring of ownership will permit the company to push management/cost
accountability deeper into the organization. New accountability becomes tangible for management through lower or higher compensation based on stock performance
• New shares can be used as acquisition currency
Appendix

Where to go from here?• MediaCo
– Use retained low cost of capital to borrow at L+250bp and new MediaCo shares as currency in acquisition of media content management believes will grow at over 5%/year
– Explore growth opportunities online and through mobile apps with the goal of capturing younger customers
– Explore opportunities re-introducing MediaCo branded apparel lines– Explore Reduction of CapEx on PP&E via outsourcing of periodical printing
• ApparelCo– Provide new stock based incentives to management to bring performance in-line with
industry leaders– Explore acquisition options to develop synergies utilizing L+250bp borrowing rate and
new ApparellCO shares as acquisition currency• FashionCo
– Management expects to be paid far more than business is worth– Better synergies to be found for acquisitions by ApparellCO with other high-end apparel
producers with good distribution network opportunities
Appendix

APPENDIX
- DCF- WACC- Comparable- Fashion Industry- Media Industry- Valuation Fashion- Valuation Apparel- Valuation Media
- Restructuring
Appendix

Discounted Cash Flow Analysis for FashionCoFigures in millions, except per share
Historical Projected2012 2013 2014 2015 2016 2017 2018 2019
Sales $169.2 $181.9 $194.5 $208.5 $224.0 $240.1 $257.1 $274.6Cost of goods sold (excluding depr.) 137.8 147.5 158.7 169.5 181.2 195.4 208.8 222.5Gross Profit 31.4 34.4 35.8 39.0 42.8 44.7 48.3 52.2
SG & A (excluding amortizations) 16.0 19.6 20.4 20.9 21.9 23.7 25.5 27.5Other operating expense 0.3 0.0 0.0 0.0 0.0 0.0 0.0 0.0EBITDA 15.1 14.8 15.4 18.1 20.9 21.0 22.9 24.7
EBITDA Margin 8.9% 8.1% 7.9% 8.7% 9.3% 8.7% 8.9% 9.0%
Less: Depreciation (2.1) (2.7) (1.7) (2.9) (2.3) (3.3) (2.7) (4.0)Less: Amortization 0.0 0.0 0.0 0.0 0.0 0.0 0.0 0.0EBIT 13.1 12.2 13.8 15.2 18.5 17.7 20.2 20.8Less: Taxes @ 40.0% (5.2) (4.9) (5.5) (6.1) (7.4) (7.1) (8.1) (8.3)Tax-effected EBIT 7.9 7.3 8.3 9.1 11.1 10.6 12.1 12.5
Plus: Depreciation & Amortization 2.7 1.7 2.9 2.3 3.3 2.7 4.0Less: Capital Expenditures (2.61) (2.93) (2.05) (2.86) (4.30) (4.11) (4.39)Less: Additions to Intangibles 0.0 0.0 0.0 0.0 0.0 0.0 0.0(Increase)/decrease in working capital 0.3 1.3 (3.7) (1.9) (2.2) (2.1) (2.2)Unlevered Free Cash Flow $7.7 $8.3 $6.3 $8.7 $7.4 $8.6 $9.9
Perpetuity Growth Method EBITDA Multiple Method
Weighted average cost of capital: 13.5% Weighted average cost of capital: 13.5% Net present value of free cash flow (a) $27.8 Net present value of free cash flow (a) $27.8
Terminal growth rate 2.5% Terminal multiple 7.0xTerminal value $91.9 Terminal value $173.0 Present value of the terminal value (b) 48.8 Present value of the terminal value (c) 91.9
Enterprise Value $76.6 Enterprise Value $119.6 Less: Net debt (0.3) Less: Net debt (0.3) Add: Equity investment 0.0 Add: Equity investment 0.0 Equity Value $76.3 Equity Value $119.3
Appendix
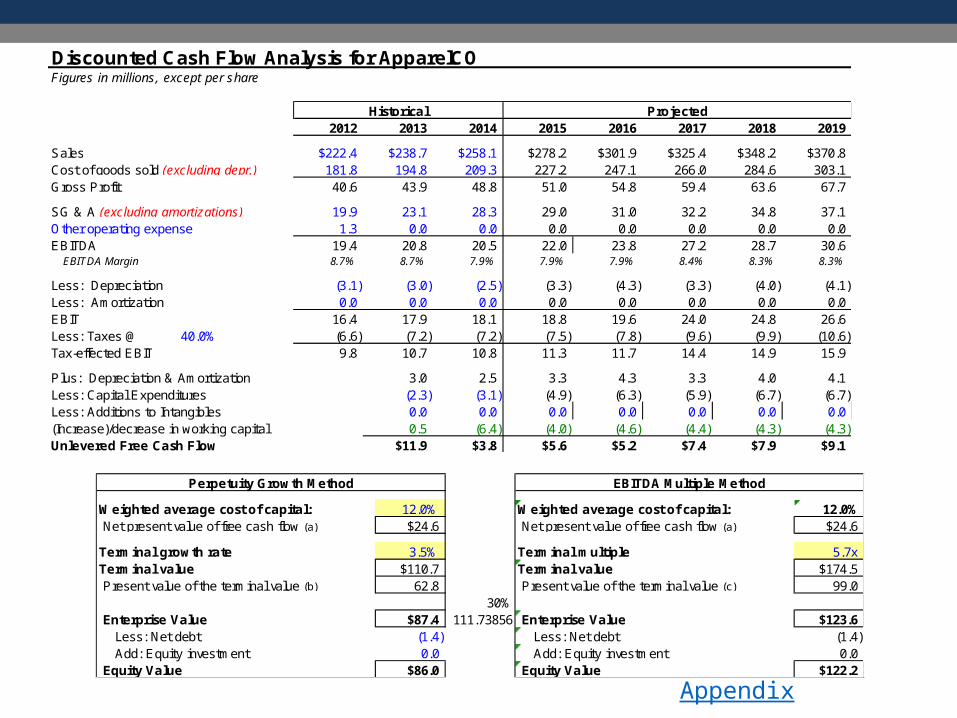
Discounted Cash Flow Analysis for ApparelCOFigures in millions, except per share
Historical Projected2012 2013 2014 2015 2016 2017 2018 2019
Sales $222.4 $238.7 $258.1 $278.2 $301.9 $325.4 $348.2 $370.8Cost of goods sold (excluding depr.) 181.8 194.8 209.3 227.2 247.1 266.0 284.6 303.1Gross Profit 40.6 43.9 48.8 51.0 54.8 59.4 63.6 67.7
SG & A (excluding amortizations) 19.9 23.1 28.3 29.0 31.0 32.2 34.8 37.1Other operating expense 1.3 0.0 0.0 0.0 0.0 0.0 0.0 0.0EBITDA 19.4 20.8 20.5 22.0 23.8 27.2 28.7 30.6
EBITDA Margin 8.7% 8.7% 7.9% 7.9% 7.9% 8.4% 8.3% 8.3%
Less: Depreciation (3.1) (3.0) (2.5) (3.3) (4.3) (3.3) (4.0) (4.1)Less: Amortization 0.0 0.0 0.0 0.0 0.0 0.0 0.0 0.0EBIT 16.4 17.9 18.1 18.8 19.6 24.0 24.8 26.6Less: Taxes @ 40.0% (6.6) (7.2) (7.2) (7.5) (7.8) (9.6) (9.9) (10.6)Tax-effected EBIT 9.8 10.7 10.8 11.3 11.7 14.4 14.9 15.9
Plus: Depreciation & Amortization 3.0 2.5 3.3 4.3 3.3 4.0 4.1Less: Capital Expenditures (2.3) (3.1) (4.9) (6.3) (5.9) (6.7) (6.7)Less: Additions to Intangibles 0.0 0.0 0.0 0.0 0.0 0.0 0.0(Increase)/decrease in working capital 0.5 (6.4) (4.0) (4.6) (4.4) (4.3) (4.3)Unlevered Free Cash Flow $11.9 $3.8 $5.6 $5.2 $7.4 $7.9 $9.1
Perpetuity Growth Method EBITDA Multiple Method
Weighted average cost of capital: 12.0% Weighted average cost of capital: 12.0% Net present value of free cash flow (a) $24.6 Net present value of free cash flow (a) $24.6
Terminal growth rate 3.5% Terminal multiple 5.7xTerminal value $110.7 Terminal value $174.5 Present value of the terminal value (b) 62.8 Present value of the terminal value (c) 99.0
30% Enterprise Value $87.4 111.73856 Enterprise Value $123.6 Less: Net debt (1.4) Less: Net debt (1.4) Add: Equity investment 0.0 Add: Equity investment 0.0 Equity Value $86.0 Equity Value $122.2
Appendix

Discounted Cash Flow Analysis for MediaCoFigures in millions, except per share
Historical Projected2012 2013 2014 2015 2016 2017 2018 2019
Sales $540.5 $551.8 $535.1 $527.6 $522.3 $522.3 $522.3 $522.8Cost of goods sold (excluding depr.) 313.1 328.5 316.0 313.2 311.2 305.7 308.1 308.5Gross Profit 227.4 223.3 219.1 214.4 211.1 216.5 214.1 214.3
SG & A (excluding amortizations) 162.5 154.8 155.0 155.8 155.1 154.6 154.6 154.7Other operating expense 0.0 0.0 0.0 0.0 0.0 0.0 0.0 0.0EBITDA 64.9 68.5 64.1 58.7 56.0 61.9 59.5 59.6
EBITDA Margin 12.0% 12.4% 12.0% 11.1% 10.7% 11.9% 11.4% 11.4%
Less: Depreciation (15.4) (14.9) (16.6) (16.0) (16.0) (14.2) (14.7) (15.3)Less: Amortization 0.0 0.0 0.0 0.0 0.0 0.0 0.0 0.0EBIT 49.6 53.7 47.6 42.8 40.1 47.9 44.9 44.5Less: Taxes @ 40.0% (19.8) (21.5) (19.0) (17.1) (16.0) (19.2) (18.0) (17.8)Tax-effected EBIT 29.8 32.2 28.6 25.7 24.1 28.7 27.0 26.7
Plus: Depreciation & Amortization 14.9 16.6 16.0 16.0 14.2 14.7 15.3Less: Capital Expenditures (14.9) (16.8) (16.3) (15.8) (16.3) (16.8) (17.4)Less: Additions to Intangibles 0.0 0.0 0.0 0.0 0.0 0.0 0.0(Increase)/decrease in working capital 20.4 5.3 (7.4) (0.5) (0.2) 0.1 0.0Unlevered Free Cash Flow $52.6 $33.7 $18.0 $23.8 $26.4 $24.9 $24.6
Perpetuity Growth Method EBITDA Multiple Method
Weighted average cost of capital: 11.0% Weighted average cost of capital: 11.0% Net present value of free cash flow (a) $85.9 Net present value of free cash flow (a) $85.9
Terminal growth rate 1.8% Terminal multiple 4.9xTerminal value $272.5 Terminal value $292.2 Present value of the terminal value (b) 161.7 Present value of the terminal value (c) 173.4
Enterprise Value $247.6 Enterprise Value $259.3 Less: Net debt (14.2) Less: Net debt (14.2) Add: Equity investment 0.0 Add: Equity investment 0.0 Equity Value $233.4 Equity Value $245.1
Appendix

FashionCo WACC
Cost of Debt
4.30%x After tax cost of debt
1 - Tax rate 2.58%1 - 40.00% x
% of debt8.80% Weighted average cost of capital
Risk free rate 14.00%2.24% % of equity
+ 86.40%Beta x
1.2 Cost of equityx 9.78%
Market risk premium6.00%
+Size premium
5.82%
Appendix

ApparelCo WACC
Cost of Debt
4.30%x After tax cost of debt
1 - Tax rate 2.58%1 - 40.00% x Weighted cost of debt
% of debt 0.34%13.30% Weighted average cost of capital
Risk free rate + 13.74%2.24% % of equity
+ 86.70% Weighted cost of equityBeta x 13.22%
1.24 Cost of equityx 15.25%
Market risk premium6.00%
+Size premium
5.82%
Appendix

MediaCo WACC
Cost of Debt
4.50%x After tax cost of debt
1 - Tax rate 2.70%1 - 40.00% x Weighted cost of debt
% of debt 0.42%15.50% Weighted average cost of capital
Risk free rate + 10.65%2.24% % of equity
+ 86.40% Weighted cost of equityBeta x 73.01%
1.2 Cost of equityx 84.50%
Market risk premium6.00%
+Size premium
2.70%
Appendix

Comparable Company Multiples(figures in millions except per share amount)
Shares LTM LTM LTM LTM PECompany Ticker Stock Price Outstanding Debt Cash Sales EBITDA EBIT Earnings
Gannett Co., Inc. GCI $31.50 225.6 $4,112.6 $1,374.5 $5,675.2 $1,254.7 $1,023.9 $476.9 14.9Lee Enterprises, Incorporated LEE 3.73 53.7 815.0 17.8 657.1 160.2 112.9 (85.1) -2.4The McClatchy Company MNI 3.56 86.7 1,560.3 225.1 1,215.2 248.9 144.6 83.9 3.7The New York Times Company NYT 12.84 150.3 669.4 414.6 1,587.7 232.1 152.8 64.1 30.1Time Inc. TIME 22.59 109.0 1,376.0 325.0 3,352.0 510.0 352.0 8.0 307.7
Shares LTM LTM LTM LTM PECompany Ticker Stock Price Outstanding Debt Cash Sales EBITDA EBIT Earnings
Ever-Glory International Group, Inc. EVK $6.19 14.8 $55.4 $25.0 $422.3 $27.0 $20.8 $12.8 7.1G-III Apparel Group, Ltd. GIII 79.35 22.4 71.2 21.5 1,931.7 152.4 135.9 80.2 22.2Oxford Industries Inc. OXM 61.25 16.5 108.5 6.4 951.8 121.9 85.3 45.9 22.0Perry Ellis International Inc. PERY 20.45 15.7 172.5 49.2 899.0 34.7 21.3 (25.1) -12.8PVH Corp. PVH 114.35 82.4 3,907.4 461.1 8,250.7 1,202.2 948.9 321.0 29.3V.F. Corporation VFC 67.68 431.1 2,083.5 496.5 11,993.4 2,047.8 1,775.2 1,293.1 22.6
LTM Operating Indications LTM Margins 2-Year Compound Annual Growth RateGross Net Gross Net
Company Revenue Profit EBITDA EBIT Income Profit EBITDA EBIT Income
Gannett Co., Inc. $5,675.2 $2,652.3 $1,254.7 $1,023.9 $476.9 46.7% 22.1% 18.0% 8.4%Lee Enterprises, Incorporated 657.1 374.0 160.2 112.9 (85.1) 56.9% 24.4% 17.2% -12.9%The McClatchy Company 1,215.2 675.6 248.9 144.6 83.9 55.6% 20.5% 11.9% 6.9%The New York Times Company 1,587.7 945.1 232.1 152.8 64.1 59.5% 14.6% 9.6% 4.0%Time Inc. 3,352.0 2,000.0 510.0 352.0 8.0 59.7% 15.2% 10.5% 0.2%
LTM Operating Indications LTM Margins 2-Year Compound Annual Growth RateGross Net Gross Net
Company Revenue Profit EBITDA EBIT Income Profit EBITDA EBIT Income
Ever-Glory International Group, Inc. $422.3 $110.0 $27.0 $20.8 $12.8 26.0% 6.4% 4.9% 3.0%G-III Apparel Group, Ltd. 1,931.7 672.1 152.4 135.9 80.2 34.8% 7.9% 7.0% 4.2%Oxford Industries Inc. 951.8 530.8 121.9 85.3 45.9 55.8% 12.8% 9.0% 4.8%Perry Ellis International Inc. 899.0 303.7 34.7 21.3 (25.1) 33.8% 3.9% 2.4% -2.8%PVH Corp. 8,250.7 4,330.2 1,202.2 948.9 321.0 52.5% 14.6% 11.5% 3.9%V.F. Corporation 11,993.4 5,824.1 2,047.8 1,775.2 1,293.1 48.6% 17.1% 14.8% 10.8%
Appendix
Appendix

Earnings Impact of Parent Co Acquisition of FashionCo at $0.00 per share50.0% Cash, 50.0% Stock
2015E 2016E 2017EParent Co diluted EPS $1.12 $1.18 $1.34Shares (MM) 30.000 30.000 30.000Parent Co Net Income $33.5 $35.4 $40.1
FashionCo diluted EPS $0.00 $0.00 $0.00Shares (MM) 0.000 0.000 0.000FashionCo Net Income $8.5 $10.6 $10.0
Combined Net Income (before adjustments) $42.0 $46.0 $50.1
Pre-tax Adjustments
Less: Additional interest expense(1) ($5.5) ($5.5) ($5.5)
+ / ( - ): Synergies(2) 1.7 1.7 1.7
+ / ( - ): Depreciation from write-up(3) (2.6) (2.6) (2.6)
+ / ( - ): Amortization from write-up(3) (0.6) (0.6) (0.6)Total Pre-tax Adjustments ($7.0) ($7.0) ($7.0) Less: taxes @ 40.0% 2.8 2.8 2.8Total After-tax Adjustments ($4.2) ($4.2) ($4.2)
Pro Forma Combined Net Income $37.8 $41.8 $45.9
Pro Forma Shares(4) 36.827 36.827 36.827
Pro Forma GAAP EPS $1.03 $1.13 $1.25Parent Co stand-alone GAAP EPS $1.12 $1.18 $1.34
Accretion / (Dilution)(5)
GAAP EPS Accretion / (Dilution) - $ ($0.09) ($0.05) ($0.09)GAAP EPS Accretion / (Dilution) - % (8.0%) (3.9%) (6.8%)Additional Pre-tax (Cushion) / Synergies to Breakeven $5.5 $2.8 $5.6

Synergy as a % of S&A
Estimated Synergies
EPS Accretion/Dilution
2.0% $0.97 -9.1%2.5% $1.22 -8.7%3.0% $1.46 -8.4%
3.5% $1.70 -8.0%4.0% $1.95 -7.7%4.5% $2.19 -7.3%5.0% $2.44 -6.9%9.7% $4.72 0.0%