ACE ACHIEVE INFOCOM LIMITED...2 (a) Note: Profit before income tax was arrived at after...
21
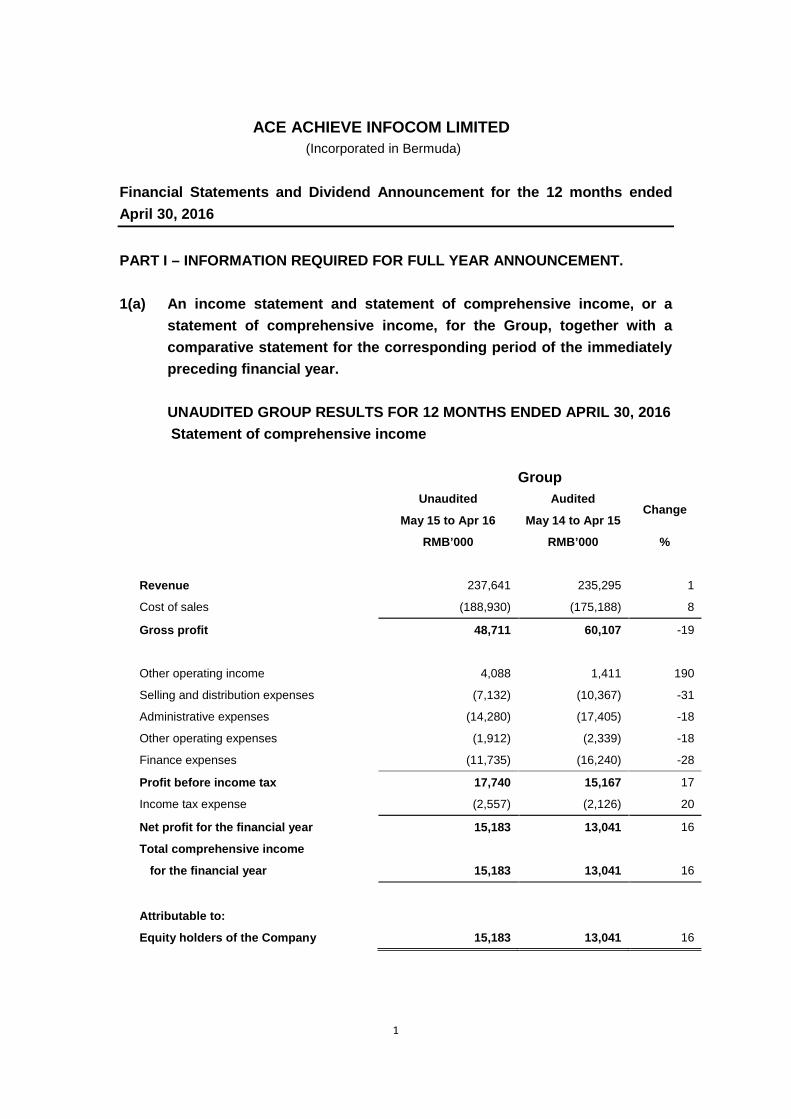
1 ACE ACHIEVE INFOCOM LIMITED (Incorporated in Bermuda) Financial Statements and Dividend Announcement for the 12 months ended April 30, 2016 PART I – INFORMATION REQUIRED FOR FULL YEAR ANNOUNCEMENT. 1(a) An income statement and statement of comprehensive income, or a statement of comprehensive income, for the Group, together with a comparative statement for the corresponding period of the immediately preceding financial year. UNAUDITED GROUP RESULTS FOR 12 MONTHS ENDED APRIL 30, 2016 Statement of comprehensive income Group Unaudited Audited Change May 15 to Apr 16 May 14 to Apr 15 RMB’000 RMB’000 % Revenue 237,641 235,295 1 Cost of sales (188,930) (175,188) 8 Gross profit 48,711 60,107 -19 Other operating income 4,088 1,411 190 Selling and distribution expenses (7,132) (10,367) -31 Administrative expenses (14,280) (17,405) -18 Other operating expenses (1,912) (2,339) -18 Finance expenses (11,735) (16,240) -28 Profit before income tax 17,740 15,167 17 Income tax expense (2,557) (2,126) 20 Net profit for the financial year 15,183 13,041 16 Total comprehensive income for the financial year 15,183 13,041 16 Attributable to: Equity holders of the Company 15,183 13,041 16
Transcript of ACE ACHIEVE INFOCOM LIMITED...2 (a) Note: Profit before income tax was arrived at after...
1
ACE ACHIEVE INFOCOM LIMITED(Incorporated in Bermuda)
Financial Statements and Dividend Announcement for the 12 months endedApril 30, 2016
PART I – INFORMATION REQUIRED FOR FULL YEAR ANNOUNCEMENT.
1(a) An income statement and statement of comprehensive income, or astatement of comprehensive income, for the Group, together with acomparative statement for the corresponding period of the immediatelypreceding financial year.
UNAUDITED GROUP RESULTS FOR 12 MONTHS ENDED APRIL 30, 2016Statement of comprehensive income
GroupUnaudited Audited
ChangeMay 15 to Apr 16 May 14 to Apr 15
RMB’000 RMB’000 %
Revenue 237,641 235,295 1
Cost of sales (188,930) (175,188) 8
Gross profit 48,711 60,107 -19
Other operating income 4,088 1,411 190
Selling and distribution expenses (7,132) (10,367) -31
Administrative expenses (14,280) (17,405) -18
Other operating expenses (1,912) (2,339) -18
Finance expenses (11,735) (16,240) -28
Profit before income tax 17,740 15,167 17
Income tax expense (2,557) (2,126) 20
Net profit for the financial year 15,183 13,041 16
Total comprehensive income
for the financial year 15,183 13,041 16
Attributable to:
Equity holders of the Company 15,183 13,041 16

2
(a) Note: Profit before income tax was arrived at after charging/(crediting) thefollowing:
Unaudited AuditedMay 15 to Apr 16 May 14 to Apr 15
RMB’000 RMB’000Depreciation of plant and equipment 463 542
PPE written off / Loss on disposal of PPE 203 -
Amortisation of intangible assets 3,035 3,288
Allowance for impairment of trade receivables 3,542 2,336
(Write back) of impairment of other receivables (1,805) -
Interest expenses 9,646 14,899
(Write back) / provision for warranty (1,969) 1,176
Interest income (66) (89)
Government incentives received (2,038) (1,303)

3
(b) (i) A statement of financial position (for the Issuer and Group), togetherwith a comparative statement as at the end of the immediatelypreceding financial year.
The Company The Group30-Apr-16 30-Apr-15 30-Apr-16 30-Apr-15RMB’000 RMB’000 RMB’000 RMB’000
Unaudited Audited Unaudited AuditedASSETSCurrent AssetsContract work-in-progress - - 314,308 237,442Trade receivables - - 352,129 483,251Other receivables 64 16 170,055 76,717Due from subsidiaries (non-trade) 162,215 166,586 - -Due from related parties (non-trade) - - - 135Cash and bank balances 4 4 74,186 17,366
Total current assets 162,283 166,606 910,678 814,911
Non-Current AssetsPlant and equipment - - 839 1,449Investment in subsidiaries 15,646 15,646 - -Intangible assets - - 8,073 8,978
Total non-current assets 15,646 15,646 8,912 10,427
Total assets 177,929 182,252 919,590 825,338

4
The Company The Group30-Apr-16 30-Apr-15 30-Apr-16 30-Apr-15RMB’000 RMB’000 RMB’000 RMB’000
Unaudited Audited Unaudited Audited
LIABILITIES AND EQUITYCurrent LiabilitiesTrade payables - - 152,565 97,223Other payables and accruals 1,522 3,770 57,923 63,942Due to directors (non-trade) 59 59 1,134 1,135Due to a related party - - 2,208 6,077Provision for warranty - - 3,554 5,523Borrowings - - 211,390 191,339Current tax liabilities - - 13,060 -
Total current liabilities 1,581 3,829 441,834 365,239
Non-Current LiabilitiesBorrowings - - 19,000 6,000Deferred tax liabilities - - 26,406 36,932
Total non-current liabilities - - 45,406 42,932
Total liabilities 1,581 3,829 487,240 408,171
Capital and Reserves attributable toequity holder of the Company
Share capital 92,938 92,938 92,938 92,938Share premium 85,226 85,226 85,226 85,226Statutory reserves - - 31,999 29,713Capital reserve - - 3,332 3,332(Accumulated losses) / Retainedearnings (1,816) 259 218,855 205,958
Total equity 176,348 178,423 432,350 417,167
Total liabilities and equity 177,929 182,252 919,590 825,338

5
1(b)(ii) Aggregate amount of Group’s borrowings and debts securities
Amount repayable in 1 year or less, or on demand
Group
April 30, 2016
Unaudited
Group
April 30, 2015
Audited
Secured Unsecured Secured Unsecured
RMB’000 RMB’000 RMB’000 RMB’000
211,390 - 191,339 -
Amount repayable after 1 year
Group
April 30, 2016
Unaudited
Group
April 30, 2015
Audited
Secured Unsecured Secured Unsecured
RMB’000 RMB’000 RMB’000 RMB’000
19,000 - 6,000 -
Group
April 30, 2016 April 30, 2015
RMB’000 RMB’000
Borrowings comprised
- Bank loans 100,410 167,339
- Notes payable 29,980 30,000
- Letter of credit 100,000 -
230,390 197,339
Details of any collateral
As at April 30, 2016 and April 30, 2015, the Group’s borrowings comprised ofmainly bank loans, notes payables and letter of credit. Bank borrowings aresecured over certain intangible assets; guaranteed by a director of theCompany; third parties; a key management personnel and third partiesfinancial institutions.
6
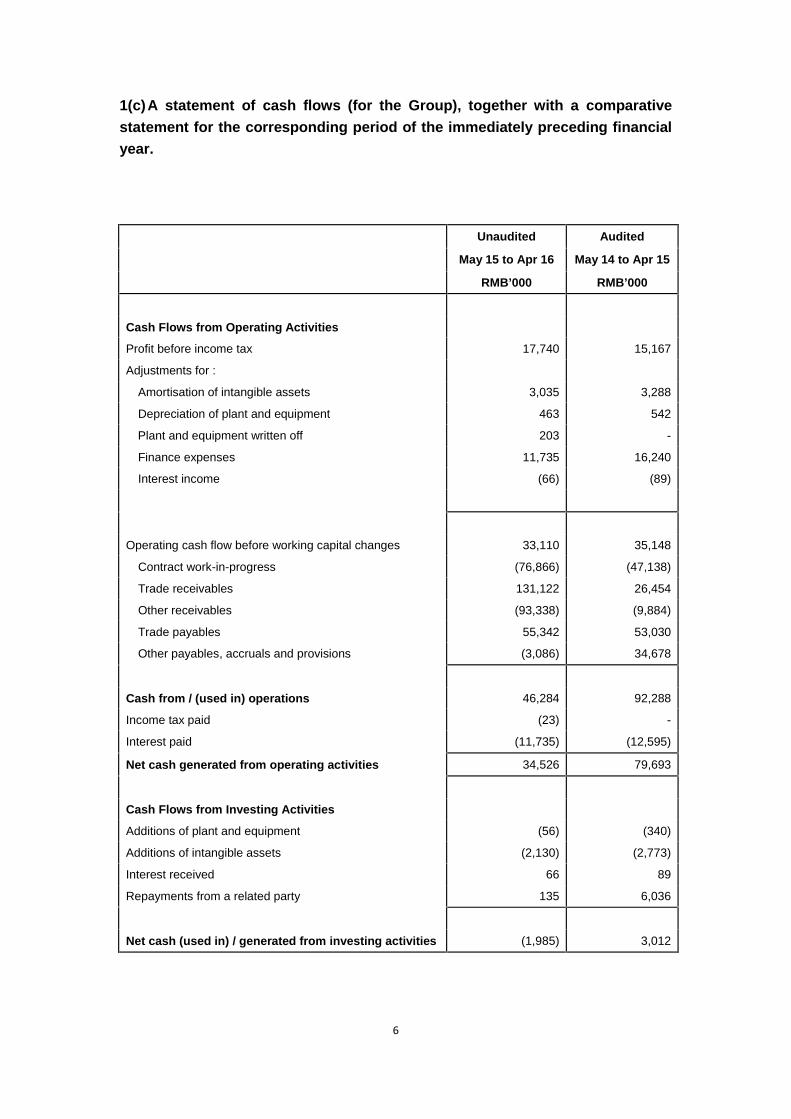
1(c)A statement of cash flows (for the Group), together with a comparativestatement for the corresponding period of the immediately preceding financialyear.
Unaudited Audited
May 15 to Apr 16 May 14 to Apr 15
RMB’000 RMB’000
Cash Flows from Operating Activities
Profit before income tax 17,740 15,167
Adjustments for :
Amortisation of intangible assets 3,035 3,288
Depreciation of plant and equipment 463 542
Plant and equipment written off 203 -
Finance expenses 11,735 16,240
Interest income (66) (89)
Operating cash flow before working capital changes 33,110 35,148
Contract work-in-progress (76,866) (47,138)
Trade receivables 131,122 26,454
Other receivables (93,338) (9,884)
Trade payables 55,342 53,030
Other payables, accruals and provisions (3,086) 34,678
Cash from / (used in) operations 46,284 92,288
Income tax paid (23) -
Interest paid (11,735) (12,595)
Net cash generated from operating activities 34,526 79,693
Cash Flows from Investing Activities
Additions of plant and equipment (56) (340)
Additions of intangible assets (2,130) (2,773)
Interest received 66 89
Repayments from a related party 135 6,036
Net cash (used in) / generated from investing activities (1,985) 3,012

7
CONSOLIDATED STATEMENT OF CASH FLOWS (CONTINUED)
Unaudited Audited
May 15 to Apr 16 May 14 to Apr 15
RMB’000 RMB’000
Cash flows from Financing Activities
Proceeds from bank borrowings 175,910 197,913
Repayments of bank borrowings (142,859) (344,618)
Advances from a related party, net - 20,197
Repayments to related parties, net (3,869) (15,120)
Loans from third parties 66,051 42,619
Repayments to third parties (70,953) (33,137)
(Repayment to) / Advances from directors (1) 806
Dividends paid - (1,504)
Movements in restricted bank balance (30,186) (9,973)
Net cash used in financing activities (5,907) (142,817)
Net increase / (decrease) in cash and cash equivalents 26,634 (60,112)
Cash and cash equivalents at the beginning of the
financial year 2,224 62,336
Cash and cash equivalents at the end of the financial
year 28,858 2,224
Cash and bank balances 74,186 17,366
Less: Restricted bank balances (45,328) (15,142)
Cash and cash equivalents for the purpose of presenting
the consolidated statement of cash flows 28,858 2,224

8
1 (d)(i) A statement (for the issuer and Group) showing either (i) all changes inequity or (ii) changes in equity other than those arising fromcapitalization issues and distributions to shareholders, together with acomparative statement for the corresponding period of the immediatelypreceding financial year.
Attributable to equity holders of the Company
Share
capital
Share
premium
Statutory
reserves
Capital
reserve
Retained
earnings TotalRMB’000 RMB’000 RMB’000 RMB’000 RMB’000 RMB’000
GroupBalance at 01.05.2014 92,938 85,226 27,616 3,332 196,518 405,630Total comprehensive income for
the financial year - - - - 13,041 13,041Dividends - - - - (1,504) (1,504)Transfer to statutory reserves - - 2,097 - (2,097) -
Balance at 30.04.2015 92,938 85,226 29,713 3,332 205,958 417,167
Balance at 01.05.2015 92,938 85,226 29,713 3,332 205,958 417,167
Total comprehensive income forthe financial year - - - - 15,183 15,183
Transfer to statutory reserves - - 2,286 - (2,286) -
Balance at 30.04.2016 92,938 85,226 31,999 3,332 218,855 432,350
Share
capital
Share
premium
Retained
earnings /
(Accumulated
losses) TotalRMB’000 RMB’000 RMB’000 RMB’000
CompanyBalance at 01.05.2014 92,938 85,226 4,691 182,855Total comprehensive loss for the
financial year - - (2,928) (2,928)Dividends - - (1,504) (1,504)
- - - - -Balance at 30.04.2015 92,938 85,226 259 178,423
Balance at 01.05.2015 92,938 85,226 259 178,423Total comprehensive loss for the
financial year - - (2,075) (2,075)- - - - -Balance at 30.04.2016 92,938 85,226 (1,816) 176,348

9
1(d)(ii) Details of any changes in the Company’s share capital arising fromrights issue, bonus issue, share buy-backs, exercise of share options orwarrants, conversion of other issues of equity securities, issue of shares forcash or as consideration for acquisition or for any other purpose since the endof the previous period reported on. State also the number of shares that may beissued on conversion of all the outstanding convertibles, as well as the numberof shares held as treasury shares, if any, against the total number of issuedshares excluding treasury shares of the issuer, as at the end of the currentfinancial period reported on and as at the end of the corresponding period ofthe immediately preceding financial year.
Number of ordinary shares issued and fully paid
As at April 30, 2015 752,000,000
As at April 30, 2016 752,000,000
There were no outstanding convertibles or treasury shares as at 30 April 2015and 30 April 2016.
1(d)(iii) To show the total number of issued shares excluding treasury shares asat the end of the current financial period and as at the end of theimmediately preceding year.
As at 30 April 2016 As at 30 April 2015Total number ofissued shares
752,000,000 752,000,000
Less: Treasury shares - -Number of issuedshares excludingtreasury shares
752,000,000 752,000,000

10
1(d)(iv)A statement showing all sales, transfers, disposal, cancellation and/oruse of treasury shares as at the end of the current financial periodreported on.
Not applicable.
During the current financial year and the immediately preceding financial year,the Company does not have any outstanding treasury shares.
2. Whether the figures have been audited or reviewed, and in accordancewith which auditing standard or practice.
The figures have not been audited or reviewed by the Company’s auditors.
3. Where the figures have been audited or reviewed, the auditors’ report(including any qualifications or emphasis of a matter).
Not applicable.
4. Whether the same accounting policies and methods of computation asin the issuer’s most recently audited annual financial statements havebeen applied.
The Group and the Company has applied the same accounting policies andmethods of computation in the financial statements for the current financialyear compared to the audited financial statements for the financial year 30 April2015, except for the adoption of the new and revised Financial ReportingStandards (“FRS”),Interpretations of FRS (“INT FRS”) and amendments toFRSs that are relevant to its operations and effective for annual periodsbeginning on or after 1 May 2015.

11
5. If there are any changes in the accounting policies and methods ofcomputation, including any required by an accounting standard, whathas changed, as well as the reasons for, and the effect of , the change.
The adoption of the new and revised FRS, INT FRSs and amendments toFRSs effective from 1 May 2015, as mentioned in Paragraph 4 above, has nomaterial financial impact on the financial statements of the Group andCompany for the financial year reported on.
6. Earnings per ordinary share of the Group for the current financial periodreported on and the corresponding period of the immediately precedingfinancial year, after deducting any provision for preference dividends:-
Earnings per ordinary share for the year based on
net profit attributable to shareholders
Unaudited Audited
(12 months)
May 15 to
Apr 16
(12 months)
May 14 to
Apr 15
Based on weighted average number of ordinary
shares on issue (RMB)0.020 0.017
Weighted average number of ordinary shares on
issue for basic earnings per share752,000,000 752,000,000
There is no dilutive instrument outstanding, hence the diluted earnings pershare is the same as the basic earnings per share.
7. Net asset value (for the issuer and Group) per ordinary share based onthe total number of issued shares excluding treasury shares of the issuerat the end of the:-
(a) Current financial period reported on; and(b) immediately preceding financial year.
Company Group
Unaudited Audited Unaudited Audited
Apr 30, 2016 Apr 30, 2015 Apr 30, 2016 Apr 30, 2015
Net asset value per ordinary share
based on the issued capital at the
end of the year (RMB)
0.23 0.24 0.57 0.55
Number of shares used in
calculating net asset value752,000,000 752,000,000 752,000,000 752,000,000

12
8. A review of the performance of the Group, to the extent necessary for areasonable understanding of the Group’s business. It must include adiscussion of the following:-(a) any significant factors that affected the turnover, costs, and earnings
of the Group for the current financial period reported on, including(where applicable) seasonal or cyclical factors; and
(b) any material factors that affected the cash flow, working capital,assets or liabilities of the Group during the current financial periodreported on.
Income statement
Revenue
The Group’s revenue increased by approximately 1% from RMB235.30 millionin FY2015 to RMB237.64 million in FY2016.
DivisionMay 15 to Apr 16 May 14 to Apr 15
RevenueRMB’000
Sales mixratio (%)
RevenueRMB’000
Sales mixratio (%)
ICT System Integration 127,197 53.52 150,766 64.08
Business Support
Solutions91,946 38.70 72,401 30.77
Maintenance &
Servicing18,498 7.78 12,128 5.15
Total 237,641 100.00 235,295 100.00
Gross profit and Gross profit margin
The Group’s gross profit decreased from RMB60.11 million in FY2015 to RMBRMB48.71 million in FY2016. It was mainly due to the decrease in the grossprofit of ICT System Integration which contributed the largest percentage ofthe Group’s revenue. Due to keen competition in the ICT System Integration inthe second half of the financial year, a lower gross margin was recorded forthe Group in FY2016.

13
Other operating income
The Group’s other operating income increased from RMB1.41 million in lastfinancial year to RMB4.09 million in the current financial year. This is mainlydue to the reversal of provision of warranty which is no longer required in thecurrent financial year.
Selling and distribution expenses
The Group’s selling and distribution expenses decreased by 31% fromRMB10.37 million in last financial year to RMB7.13 million in the currentfinancial year. It was mainly due to reduced headcount in FY2016 ascompared to prior year.
Administrative expenses
The Group’s administrative expenses decreased by 18% from RMB17.41million in last financial year to RMB14.28 million in the current financial year. Itwas mainly due to reduced general office expenses, recruitment fees andreduced headcount during the current financial year.
Other operating expenses
Other operating expenses decreased from RMB2.34 million in last financialyear to RMB1.91 million in the current financial year. This was mainly due tothe reduced net allowance for impairment of receivables.
Finance expenses
The Group’s finance expenses decreased by 28% from RMB16.24 million inlast financial year to RMB11.74 million in the current financial year. Thedecrease was mainly attributable to the decrease in bank interest rate andbank loans during the current financial year.
Net profit
Despite a reduction in gross profit, the Group’s net profit increased fromRMB13.04 million in the last financial year to RMB15.18 million in the currentfinancial year due to decrease in operating expenses.

14
Balance sheet
Cash and bank balances
The cash and bank balances increased from RMB17.37 million as at 30 April2015 to RMB74.19 million as at 30 April 2016. It was mainly due to the bettercollection of trade receivables.
Trade receivables
Trade receivables decreased from RMB483.25 million as at 30 April 2015 toRMB352.13 million as at 30 April 2016 as a result of better collection of longoverdue receivables during the current financial year.
Other receivables
Other receivables increased from RMB76.72 million as at 30 April 2015 toRMB170.06 million as at 30 April 2016. It was mainly due to the increase ofadvances to the suppliers for projects towards end of the current financialyear.
Contract work-in-progress
Contract work-in-progress increased from RMB237.44 million as at 30 April2015 to RMB314.31 million as at 30 April 2016. This was mainly attributed tothe increase in projects for the supply and installations of cloud computedfacilities for China Unicom.
Trade payables
Trade payables increased from RMB97.22 million as at 30 April 2015 toRMB152.57 million as at 30 April 2016. It was mainly due to the increase incontract work-in-progress.

15
Cash flow
Net cash generated from operating activities
Net cash inflow from operating activities were RMB34.52 million for the yearended 30 April 2016 as compared with a net cash inflow of RMB79.69 millionin the last corresponding year. This was mainly due to the increase ofadvances to the suppliers during the current financial year.
Net cash used in investing activities
Net cash outflow from investing activities were RMB1.98 million for the yearended 30 April 2016 as compared with a net cash inflow of RMB3.01 million inthe last corresponding year. This was mainly due to the additions of intangibleassets during the current financial year.
Net cash used in financing activities
Net cash outflow from financing activities for the year ended 30 April 2016amounted to RMB5.91 million as compared with a net cash outflow of RMB142.82 million in the last corresponding year. This was mainly due to higherrepayment of bank borrowings during the last financial year.
9. Where a forecast, or a prospect statement, has been previously disclosedto shareholders, any variance between it and the actual results.
Not applicable.

16
10. A commentary at the date of the announcement of the significant trendsand competitive conditions of the industry in which the Group operatesand any known factors or events that may affect the Group in the nextreporting period and the next 12 months.
For the financial year ended 30 April 2016, the growth of China’s economyhas significantly slowed down. Despite the launching of the 4G business bythe telco operators, there is a slowdown in overall investments due to theimpact of macroeconomic environment and market conditions. This has alsoled to the increase in market competition.
With the transformation of 4G network operating environment and thechanges in the macroeconomic trends in China, the Group will further align itsbusiness structure and foster new business growth in telecommunicationssoftware, hardware and service, mobile Internet and “Internet +”, includinginvestment in technology upgrading.

17
11. Dividend
(a) Current financial period reported on
Any dividend declared for the current financial period reported on?
No dividends have been declared for the current financial periodreported on.
(b) Corresponding period of the immediately preceding financial year
Any dividend declared for the corresponding period of the immediatelypreceding financial year?
No dividends have been declared for the corresponding period of theimmediately preceding financial year.
(c) Total Annual Dividend
Not applicable.
(d) Date payable
Not applicable.
(e) Books closure date
Not applicable
12. If no dividend has been declared (recommended), a statement to thateffect.
No dividend is recommended for the period under review.
13. If the Group has obtained a general mandate from shareholders for IPTs,the aggregate value of such transactions as required under Rule 920 (1)(a) (ii). If no IPT mandate has been obtained, a statement to that effect.
The Group did not obtain a general mandate from shareholders for IPTS.

18
PART II – ADDITIONAL INFORMATION REQUIRED FOR FULL YEARANNOUNCEMENT (This part is not applicable to Q1, Q2, Q3 or Half YearResults)
14. Segmented revenue and results for business or geographical segments(of the Group) in the form presented in the issuer’s most recently auditedannual financial statements, with comparative information for theimmediately preceding year.
Management monitors the operating results of its business units separately forthe purpose of making decisions about resource allocation and performanceassessment. Geographical segments are not presented as the Groupoperates predominantly in the PRC. Revenue of approximatelyRMB58,033,000 (2015: RMB133,176,000) is derived from 3 (2015: 3) externalcustomers located in the PRC. Assets of the Group are mainly located in thePRC.
Business Segments
ICT System
Integration
Business
Support
Solutions
Maintenance
& Servicing Total
RMB’000 RMB’000 RMB’000 RMB’000
2016
Revenue 127,197 91,946 18,498 237,641
Cost of sales (119,932) (53,393) (15,605) (188,930)
Segment result 7,265 38,553 2,893 48,711
Unallocated other
income 4,088
Unallocated costs (23,390)
Finance income 66
Finance expenses (11,735)
Profit before income
tax 17,740
Income tax expense (2,557)
Net profit after income
tax 15,183
Assets and
Liabilities
Unallocated assets
and total assets 919,590
Unallocated liabilities
and total liabilities 487,240

19
ICT System
Integration
Business
Support
Solutions
Maintenance
& Servicing Total
RMB’000 RMB’000 RMB’000 RMB’000
2015
Revenue 150,766 72,401 12,128 235,295
Cost of sales (121,895) (44,928) (8,365) (175,188)
Segment result 28,871 27,473 3,763 60,107
Unallocated other
income 1,322
Unallocated costs (30,111)
Finance income 89
Finance expenses (16,240)
Profit before income
tax 15,167
Income tax expense (2,126)
Net profit after income
tax 13,041
Assets and
Liabilities
Unallocated assets
and total assets 825,338
Unallocated liabilities
and total liabilities 408,171
15. In the review of performance, the factors leading to any material changesin contributions to turnover and earnings by the business orgeographical segments.
Not applicable.

20
16. Breakdown of sales as follows:
THE GROUPFY2016
RMB’000FY2015
RMB’000% change
(a) Sales reported for first halfyear
125,051 121,377 3.03
(b) Operating profit after taxbefore deductingnon-controlling interestsreported for first half year
16,006 15,641 2.33
(a) Sales reported for secondhalf year
112,590 113,918 (1.17)
(b) Operating profit / (loss)after tax before deductingnon-controlling interestsreported for second half year
(823) (2,600) 68.35
17. A breakdown of the total annual dividend (in dollar value) for the issuer’slatest full year and its previous full year as follows:
Not applicable.
18. Disclosure of person occupying a managerial position in the issuer orany of its principal subsidiaries who is a relative of a director or chiefexecutive officer or substantial shareholder of the issuer pursuant toRule 704(13) in the format below. If there are no such persons, the issuermust make an appropriate negative statement.
Not applicable.

21
19. Confirmation that the issuer has procured undertakings from all itsdirectors and executive officers (in the format set out in Appendix 7.7under Rule 720(1)
The Company confirms that it has procured undertakings from all of itsdirectors and executive officers in the required format.
BY ORDER OF THE BOARD
Deng ZelinExecutive Chairman24 June 2016