Accurate workload design for web performance - RiuNet - UPV
128
Accurate workload design for web performance evaluation RAÚL PEÑA ORTIZ
Transcript of Accurate workload design for web performance - RiuNet - UPV

Accurate workload design for web performance evaluation
RAÚL PEÑA ORTIZ

DEPARTAMENT D’INFORMATICA DE SISTEMES I
COMPUTADORS
Accurate workload design for webperformance evaluation
Thesis submitted in partial fulfillment of the requirementsfor the degree of Ph.D in the subject of Computer Science
Presented by:
Raul Pena-Ortiz
Supervised by:
Dr. Ana Pont SanjuanDr. Jose Antonio Gil SalinasDr. Julio Sahuquillo Borras
Valencia, Spain. January, 2013

This editorial is member of the UNE, which guarantees the diffusion and commercialization of its publications at national and international level.
© Raúl Peña Ortiz, 2013
© of the present edition: Editorial Universitat Politècnica de València www.editorial.upv.es ISBN: 978-84-9048-025-0 (printed version) Re. editorial: 5613 Any unauthorized copying, distribution, marketing, editing, and in general any other exploitation, for whatever reason, of this piece of work or any part thereof, is strictly prohibited without the authors’ expressed and written permission.

”Education is the passport to the future, for tomorrowbelongs to those who prepare for it today.”
Malcolm X.
”If today were the last day of my life,would I want to do what I am about to do today?
The only way to do great work is to love what you do.
Don’t settle.
You have to trust that the dots will somehowconnect in your future.”
Steve Jobs,
conference at Stanford University.
”But we’re talking about an objective doctoral thesis.”
Marathon Man, the film.
”Stay Hungry. Stay Foolish.”
The Whole Earth Catalog,
back cover of final issue.


Acknowledgments
These pages are dedicated to those who have given me their unconditional support intackling this challenge, especially to my advisors, colleagues, friends and dear family.

Abstract
The new web-based applications and services, which are becoming more and morepopular every day, have completely changed the way users interact with the Web.In less than half a decade the role of users has changed from passive consumers ofinformation to active and dynamic contributors to the contents offered. Moreover,this trend is expected to rise in the incoming Web.
This user’s behavior is a major concern when defining web workloads in order toprecisely estimate system performance for the current Web. However, the intrinsicdifficulty to represent the user’s dynamism in a workload model has led many researchworks to still use workloads non representative of the current web navigations.
This dissertation focuses on characterizing and reproducing more realistic work-load for web performance by mimicking the behavior of the real web users.
The state-of-the-art in modeling and generating workloads for web performancestudies presents several lacks in models and software that represent the different levelsof user’s dynamism. This fact motivates us to propose a more accurate workloadmodel and to develop a new workload generator based on this model. Both of themhave been validated against a traditional workload generation approach. To this end,a new testbed with the ability of reproducing traditional and dynamic workloadshas been developed by integrating the proposed generator with a commonly usedbenchmark.
In this Ph.D dissertation we also analyze and measure for the first time, to thebest of our knowledge, the impact of using representative dynamic user workloadson web performance metrics instead of traditional workloads. Experimental resultsdemonstrate that the use of an accurate workload model that considers user’s dy-namism when navigating the Web clearly affects system performance metrics as wellas the stress borderline of the server.
Finally, we explore the effect of considering the User-Browser Interaction as a partof user’s dynamic behavior on web workload characterization. The study proves thatrepresenting user’s dynamic interactions with the provided contents allows users toachieve their navigation goals sooner thus increasing the productivity of their navi-gations. In addition results demonstrate that this type of navigations also affects thestress borderline of the server and system resources utilization.
i


Resumen
Las nuevas aplicaciones y servicios web, cada vez mas populares en nuestro dıa adıa, han cambiado completamente la forma en la que los usuarios interactuan con laWeb. En menos de media decada, el papel que juegan los usuarios ha evolucionado demeros consumidores pasivos de informacion a activos colaboradores en la creacion decontenidos dinamicos, tıpicos de la Web actual. Y, ademas, esta tendencia se esperaque aumente y se consolide con el paso del tiempo.
Este comportamiento dinamico de los usuarios es una de las principales claves en ladefinicion de cargas de trabajo adecuadas para estimar con precision el rendimientode los sistemas web. No obstante, la dificultad intrınseca a la caracterizacion deldinamismo del usuario y su aplicacion en un modelo de carga, propicia que muchostrabajos de investigacion sigan todavıa empleando cargas no representativas de lasnavegaciones web actuales.
Esta tesis doctoral se centra en la caracterizacion y reproduccion, para estudiosde evaluacion de prestaciones, de un tipo de carga web mas realista, capaz de imitarel comportamiento de los usuarios de la Web actual.
El estado del arte en el modelado y generacion de cargas para los estudios deprestaciones de la Web presenta varias carencias en relacion a modelos y aplicacionessoftware que representen los diferentes niveles de dinamismo del usuario. Este hechonos motiva a proponer un modelo mas preciso y a desarrollar un nuevo generadorde carga basado en este nuevo modelo. Ambas propuestas han sido validadas enrelacion a una aproximacion tradicional de generacion de carga web. Con este fin, seha desarrollado un nuevo entorno de experimentacion con la capacidad de reproducircargas web tradicionales y dinamicas, mediante la integracion del generador propuestocon un benchmark de uso comun.
En esta tesis doctoral tambien se analiza y evalua por primera vez, segun nuestrosaber y entender, el impacto que tiene el empleo de cargas de trabajo dinamicasen las metricas de rendimiento de los sistemas web, con respecto al uso de cargastradicionales. Los resultados experimentales demuestran que usar modelos de cargamas precisos, en los que se considera el comportamiento dinamico de los usuarioscuando navegan por la Web, afecta claramente a las metricas de rendimiento de lossistemas, ası como a su frontera de estres.
iii

Finalmente en este trabajo se explora el efecto de considerar la interaccion delusuario con el navegador web como parte de su comportamiento dinamico en la car-acterizacion de la carga. El estudio muestra un aumento de la productividad de lasnavegaciones del usuario cuando se considera su interaccion con los contenidos web atraves de las facilidades que ofrecen los navegadores. Los resultados demuestran quelos usuarios alcanzan antes sus objetivos generando nuevos patrones de navegacion,que a su vez afectan al rendimiento de los sistemas web, tanto a sus fronteras de estrescomo a la utilizacion de sus recursos.
iv

Resum
Les noves aplicacions i serveis web, cada vegada mes populars en el nostre dia adia, han canviat completament la forma en que els usuaris interactuen amb la Web.En menys de mitja decada, el paper que juguen els usuaris ha evolucionat de mersconsumidors passius d’informacio a actius col·laboradors en la creacio de contingutsdinamics, tıpics de la Web actual. I, a mes, aquesta tendencia s’espera que augmentei es consolide amb el pas del temps.
Aquest comportament dinamic dels usuaris es una de les principals claus en ladefinicio de carregues de treball adequades per a estimar amb precisio el rendimentdels sistemes web. No obstant aixo, la dificultat intrınseca a la caracteritzacio deldinamisme de l’usuari i la seua aplicacio en un model de carrega, propıcia que moltstreballs d’investigacio seguisquen encara emprant carregues no representatives de lesnavegacions web actuals.
Aquesta tesi doctoral se centra en la caracteritzacio i reproduccio, per a estudisd’avaluacio de prestacions, d’un tipus de carrega web mes realista, capac d’imitar elcomportament dels usuaris de la Web actual.
L’estat de l’art en el modelatge i generacio de carregues per als estudis de presta-cions de la Web presenta diverses carencies en relacio a models i aplicacions programarique representen els diferents nivells de dinamisme de l’usuari. Aquest fet ens motivaa proposar un model mes precıs i a desenvolupar un nou generador de carrega basaten aquest nou model. Ambdos propostes han sigut validades en relacio a una aprox-imacio tradicional de generacio de carrega web. Amb aquest fi, s’ha desenvolupat unnou entorn d’experimentacio amb la capacitat de reproduir carregues web tradicionalsi dinamiques, per mitja de la integracio del generador proposat amb un benchmarkd’us comu.
En aquesta tesi doctoral tambe s’analitza i avalua per primera vegada, segons elnostre saber i entendre, l’impacte que te l’ocupacio de carregues de treball dinamiquesen les metriques de rendiment dels sistemes web, respecte a l’us de carregues tradi-cionals. Els resultats experimentals demostren que usar models de carrega mes pre-cisos, en els que es considera el comportament dinamic dels usuaris quan naveguenper la Web, afecta clarament les metriques de rendiment dels sistemes, aixı com a laseua frontera d’estres.
v

Finalment en aquest treball s’explora l’efecte de considerar la interaccio de l’usuariamb el navegador web com a part del seu comportament dinamic en la caracteritzaciode la carrega. L’estudi mostra un augment de la productivitat de les navegacionsde l’usuari quan es considera la seua interaccio amb els continguts web a traves deles facilitats que oferixen els navegadors. Els resultats demostren que els usuarisaconseguixen abans els seus objectius generant nous patrons de navegacio, que al seutorn afecten el rendiment dels sistemes web, tant a les seues fronteres d’estres com ala utilitzacio dels seus recursos.
vi

Contents
1 Introduction 11.1 Motivation and main goals . . . . . . . . . . . . . . . . . . . . . . . . . 21.2 Contributions of the thesis . . . . . . . . . . . . . . . . . . . . . . . . . 31.3 Research context . . . . . . . . . . . . . . . . . . . . . . . . . . . . . . 31.4 Outline . . . . . . . . . . . . . . . . . . . . . . . . . . . . . . . . . . . 3
2 Characterizing and generating workload for web performanceevaluation 52.1 Workload models and the current Web . . . . . . . . . . . . . . . . . . 52.2 Web workload generators overview . . . . . . . . . . . . . . . . . . . . 9
2.2.1 Software tools study . . . . . . . . . . . . . . . . . . . . . . . . 102.2.2 A survey on reproducing user’s dynamism . . . . . . . . . . . . 22
2.3 Summary . . . . . . . . . . . . . . . . . . . . . . . . . . . . . . . . . . 26
3 DWEB: modeling user’s dynamism on web workload characteri-zation 273.1 The user’s navigation . . . . . . . . . . . . . . . . . . . . . . . . . . . . 273.2 The user’s roles . . . . . . . . . . . . . . . . . . . . . . . . . . . . . . . 313.3 Summary . . . . . . . . . . . . . . . . . . . . . . . . . . . . . . . . . . 32
4 GUERNICA: a workload generator for current Web 334.1 The application suite . . . . . . . . . . . . . . . . . . . . . . . . . . . . 334.2 Testing phases . . . . . . . . . . . . . . . . . . . . . . . . . . . . . . . 354.3 Architecture . . . . . . . . . . . . . . . . . . . . . . . . . . . . . . . . . 384.4 Main features . . . . . . . . . . . . . . . . . . . . . . . . . . . . . . . . 394.5 Case study . . . . . . . . . . . . . . . . . . . . . . . . . . . . . . . . . 404.6 Summary . . . . . . . . . . . . . . . . . . . . . . . . . . . . . . . . . . 44
5 GUERNICA validation: a new testbed for web performanceevaluation 475.1 The TPC-W framework . . . . . . . . . . . . . . . . . . . . . . . . . . 485.2 Testbed architecture . . . . . . . . . . . . . . . . . . . . . . . . . . . . 49
vii

CONTENTS
5.3 Experimental setup . . . . . . . . . . . . . . . . . . . . . . . . . . . . . 515.4 Performance metrics . . . . . . . . . . . . . . . . . . . . . . . . . . . . 525.5 GUERNICA validation . . . . . . . . . . . . . . . . . . . . . . . . . . . 525.6 Summary . . . . . . . . . . . . . . . . . . . . . . . . . . . . . . . . . . 61
6 The impact of dynamic user workloads on web performance 636.1 Workload design . . . . . . . . . . . . . . . . . . . . . . . . . . . . . . 63
6.1.1 Considering dynamism on user’s navigations . . . . . . . . . . 646.1.2 One step ahead: evolving user’s profile using dynamic roles . . 66
6.2 Impact of the dynamic workloads on web system performance . . . . . 696.3 Summary . . . . . . . . . . . . . . . . . . . . . . . . . . . . . . . . . . 76
7 The impact of User-Browser Interaction on web performance 777.1 Workload design . . . . . . . . . . . . . . . . . . . . . . . . . . . . . . 77
7.1.1 The back button: rapid return to recently visited pages . . . . 787.1.2 Optimizing user productivity: the parallel tab browsing behavior 79
7.2 Impact of UBI on web performance . . . . . . . . . . . . . . . . . . . . 837.3 Summary . . . . . . . . . . . . . . . . . . . . . . . . . . . . . . . . . . 90
8 Conclusions and open research lines 938.1 Conclusions . . . . . . . . . . . . . . . . . . . . . . . . . . . . . . . . . 938.2 Open research lines . . . . . . . . . . . . . . . . . . . . . . . . . . . . . 948.3 Publications related to the thesis . . . . . . . . . . . . . . . . . . . . . 95
A Acronyms 99
B Glossary 101
C Bibliography 103
viii

List of Figures
2.1 Example of a simplified CBMG model . . . . . . . . . . . . . . . . . . 72.2 Example of a VBMG model for blurkers . . . . . . . . . . . . . . . . . 72.3 Example of a simplified EFSM model for an e-commerce system . . . 82.4 Transition probability in the Clickstream Model for an OSN . . . . . . 92.5 WebStone architecture . . . . . . . . . . . . . . . . . . . . . . . . . . . 102.6 Logical components of SPECweb2009 . . . . . . . . . . . . . . . . . . 122.7 SURGE architecture . . . . . . . . . . . . . . . . . . . . . . . . . . . . 132.8 S-Clients design . . . . . . . . . . . . . . . . . . . . . . . . . . . . . . . 152.9 TPC-W architecture . . . . . . . . . . . . . . . . . . . . . . . . . . . . 162.10 How LoadRunner works . . . . . . . . . . . . . . . . . . . . . . . . . . 182.11 LoadRunner scripting for Web 2.0 applications . . . . . . . . . . . . . 192.12 WebLOAD architecture . . . . . . . . . . . . . . . . . . . . . . . . . . 20
3.1 Google Search navigation pattern . . . . . . . . . . . . . . . . . . . . . 303.2 User’s roles example: working and leisure behaviors . . . . . . . . . . . 31
4.1 Main applications of GUERNICA . . . . . . . . . . . . . . . . . . . . . 344.2 Testing phases in GUERNICA . . . . . . . . . . . . . . . . . . . . . . 354.3 Distribution of workload generation . . . . . . . . . . . . . . . . . . . . 374.4 Architecture of GUERNICA . . . . . . . . . . . . . . . . . . . . . . . . 384.5 Web searcher and surfer user’s behaviors . . . . . . . . . . . . . . . . . 414.6 A simple search in Google . . . . . . . . . . . . . . . . . . . . . . . . . 42
5.1 TPC-W reduced website map . . . . . . . . . . . . . . . . . . . . . . . 485.2 Main software components of TPC-W Java implementation . . . . . . 495.3 Testbed architecture . . . . . . . . . . . . . . . . . . . . . . . . . . . . 505.4 Experimental setup . . . . . . . . . . . . . . . . . . . . . . . . . . . . . 515.5 CBMG model for shopping scenario in GUERNICA validation . . . . 545.6 Client metrics obtained for the shopping scenario in GUERNICA vali-
dation . . . . . . . . . . . . . . . . . . . . . . . . . . . . . . . . . . . . 555.7 Server metrics obtained for the shopping scenario in GUERNICA val-
idation . . . . . . . . . . . . . . . . . . . . . . . . . . . . . . . . . . . . 56
ix

LIST OF FIGURES
5.8 Client metrics obtained for the browsing scenario in GUERNICA vali-dation . . . . . . . . . . . . . . . . . . . . . . . . . . . . . . . . . . . . 57
5.9 Server metrics obtained for the browsing scenario in GUERNICA val-idation . . . . . . . . . . . . . . . . . . . . . . . . . . . . . . . . . . . . 58
5.10 Client metrics obtained for the ordering scenario in GUERNICA vali-dation . . . . . . . . . . . . . . . . . . . . . . . . . . . . . . . . . . . . 59
5.11 Server metrics obtained for the ordering scenario in GUERNICA vali-dation . . . . . . . . . . . . . . . . . . . . . . . . . . . . . . . . . . . . 60
6.1 DWEB workload I - DW1: navigation for loyalty promotion behavior . 656.2 DWEB workload II - DW2: characterization based on user’s dynamic
roles . . . . . . . . . . . . . . . . . . . . . . . . . . . . . . . . . . . . . 686.3 Main performance client metrics values . . . . . . . . . . . . . . . . . . 706.4 Main performance server metrics values . . . . . . . . . . . . . . . . . 716.5 CPU utilization by query cache status . . . . . . . . . . . . . . . . . . 746.6 Cummulative distribution for page response time . . . . . . . . . . . . 75
7.1 LOY workload: loyalty promotion behaviors conducted by goals . . . . 807.2 LOYB workload: LOY workload considering the back button . . . . . 817.3 Example of parallel tab browsing session . . . . . . . . . . . . . . . . . 827.4 LOYT workload: parallel tab browsing behavior in LOY workload . . 847.5 User’s productivity evolution . . . . . . . . . . . . . . . . . . . . . . . 857.6 Total served pages . . . . . . . . . . . . . . . . . . . . . . . . . . . . . 867.7 Mean served pages by type . . . . . . . . . . . . . . . . . . . . . . . . 877.8 Apache throughput . . . . . . . . . . . . . . . . . . . . . . . . . . . . . 887.9 CPU utilization . . . . . . . . . . . . . . . . . . . . . . . . . . . . . . . 887.10 MySQL Throughput . . . . . . . . . . . . . . . . . . . . . . . . . . . . 907.11 Execution time per query type . . . . . . . . . . . . . . . . . . . . . . 91
x

List of Tables
2.1 Main features and disadvantages of WebStone . . . . . . . . . . . . . 112.2 Main features and disadvantages of SPECweb2009 . . . . . . . . . . . 122.3 Main features and disadvantages of SURGE . . . . . . . . . . . . . . 142.4 Main features and disadvantages of S-Clients . . . . . . . . . . . . . . 152.5 Main features and disadvantages of WebJamma . . . . . . . . . . . . 162.6 Main features and disadvantages of TPC-W . . . . . . . . . . . . . . 172.7 Main features and disadvantages of Web Polygraph . . . . . . . . . . 182.8 Main features and disadvantages of LoadRunner . . . . . . . . . . . . 202.9 Main features and disadvantages of WebLOAD . . . . . . . . . . . . . 212.10 Main features and disadvantages of JMeter . . . . . . . . . . . . . . . 222.11 Main features and disadvantages of testing scripts and tools . . . . . 232.12 Web workload generators and grade in which main features are fulfilled 252.13 Web workload generators and how challenges of user’s dynamism are
fulfilled . . . . . . . . . . . . . . . . . . . . . . . . . . . . . . . . . . . 26
3.1 User’s navigation notation . . . . . . . . . . . . . . . . . . . . . . . . . 29
4.1 GUERNICA features . . . . . . . . . . . . . . . . . . . . . . . . . . . . 394.2 Challenges of user’s dynamism fulfilled by GUERNICA . . . . . . . . 40
5.1 Performance metrics classification according to the evaluated resource 53
6.1 Cases of dynamism in the loyalty promotion behavior . . . . . . . . . 646.2 Cases of dynamism in the new pre-sales promotion behavior . . . . . . 676.3 CPU consumption (in jiffies) foreach application . . . . . . . . . . . . 72
7.1 Cases of dynamism in the loyalty promotion behaviors conducted bygoals . . . . . . . . . . . . . . . . . . . . . . . . . . . . . . . . . . . . . 79
7.2 Extra cases of dynamism in the loyalty promotion behavior conductedby goals to represent parallel tab browsing . . . . . . . . . . . . . . . . 83
7.3 Mean user productivity considering 100 simultaneous users in the system 857.4 CPU consumption (in jiffies) for each application . . . . . . . . . . . . 89
xi

LIST OF TABLES
8.1 List of main publications . . . . . . . . . . . . . . . . . . . . . . . . . . 96
xii

CHAPTER 1
Introduction
There are few technological success stories as dramatic as that of the Web. Originallydesigned to share static contents among a small group of researchers, the Web isbeing used today by many millions of people as a part of their daily routines andsocial lives. Our society is progressively becoming more densely connected, and theparadigm where users access the Web from a desktop computer is making way for anew paradigm dominated by pervasive mobile devices like smart phones and tablets.
This incessant evolution has been possible thanks to the continuous changes intechnology that have introduced new features in the current and incoming Web, bothin its applications, users, and infrastructure [Rod09]. For instance, e-commerce sys-tems, on-line social networks, blogs, wikis or service oriented architectures are someexamples that manifest how websites are evolving from typical hypermedia informa-tion repositories of the First Web Generation (Web 1.0) to hypermedia distributedapplications and services representative of the Second Web Generation (Web 2.0).With the emergence of this kind of applications and services, users are no longer pas-sive consumers, but they become participative contributors to the dynamic contentaccessible on the Web [CK08]. Nowadays, web contents and services are even moredynamic [Ore07], which consequently increases the number of changes over time inuser’s interactions with the Web [RSD+12]. Therefore, a new user’s dynamic behaviorcan be distinguished. Moreover, this user’s behavior is expected to be more relevantand meaningful in the incoming Web, also referred to as Web 3.0 [Hen09] or FutureInternet [TGG+09].
As a system that is continuously changing, both in the offered applications andinfrastructure, performance evaluation studies are necessary in order to provide soundproposals when designing new web-related systems [BC98], such as web services, webservers, proxies or content distribution policies. As in any performance evaluation pro-cess, accurate and representative workload models must be used in order to guaranteethe validity of the results. Regarding web systems, the user’s dynamic behavior makesdifficult the design of accurate web workload representing realistic users’ navigations.
In general, there are three main challenges that must be addressed when modelingthe user’s dynamic behavior on representative workloads:
1

CHAPTER 1. INTRODUCTION
Challenge I: The dynamism in user’s behavior when surfing the Web must be takeninto account [BC98]. That is, users’ behaviors as they interact withweb contents and services have to be characterized, modeling the dif-ferent aspects that determine users’ navigation decisions. For instance,personal preferences, navigation goals, visited resources or connectivityconditions.
Challenge II: The different user’s roles when navigating a website must be identifiedand defined as user’s behaviors [WOHM06]. For instance, searcherand surfer roles refer to users who start navigations with a queryin a given searcher engine, or navigate the web by following directhyperlinks, respectively [PP99].
Challenge III: Continuous changes in these user’s roles during the same navigationsession must be modeled and considered [GBGP10]. That is, changesin users’ behaviors over the time have to be characterized.
This thesis focuses on modeling and analyzing representative workloads for perfor-mance studies with the aim of accurately estimating systems performance indexes incurrent and incoming Web. To this end, the three main challenges mentioned aboveare analyzed and addressed in a progressive way in order to provide a new and morerepresentative web workload for performance evaluation.
1.1 Motivation and main goals
Although web evolution has introduced significant changes on user’s behavior, manyperformance studies still check their approaches with traditional workloads, which aretypical of the early Web 1.0 and do not represent current web trends. Three mainshortcomings can be observed in the open literature about both commercial productsand academic research results:
1. To date, web workload models do not consider user’s dynamism in an appro-priate and accurate way because they only take partially into account the men-tioned challenges.
2. There is a lack of web workload generators that can reproduce representativetraffic of Web 2.0 applications and services.
3. The effect of using dynamic workloads on web performance evaluation, insteadof traditional workloads, has not been analyzed and measured yet to the bestof our knowledge.
These shortcomings define the main objectives of this thesis and encouraged us topropose a new model to cover the main gaps found in current web workload character-ization research. Based on this model, in this Ph.D dissertation a new web workloadgenerator and testbed are proposed, validated and used for performance evaluation.
2

1.2. CONTRIBUTIONS OF THE THESIS
1.2 Contributions of the thesis
This thesis presents three main contributions:
• The first contribution is the proposal of a new workload model that permitsto define accurate workloads for performance evaluation studies in current andincoming Web. This model takes into account the three mentioned challenges byintroducing progressively different levels of dynamism in user’s behavior whencharacterizing web workload.
• Based on this model, a web workload generator has been developed in orderto reproduce user’s dynamism in web performance studies, which is the secondcontribution of this thesis.
• Finally, the last main contribution is the analysis of using representative dy-namic workload on the web performance metrics. To this end, we provide anew testbed for web performance evaluation by integrating our generator witha commonly used benchmark with the aim of contrasting performance metricsfor traditional and dynamic workloads.
1.3 Research context
Part of this thesis has been developed in the context of the research project GENER-ICA, which was led by the iSOCO S.L company in collaboration with the Web Ar-chitecture Research Group (Universitat Politecnica de Valencia) and the Institute ofComputer Technology. This project was partially supported by the Spanish Gov-ernment Grant (FIT 340000-2004-236) and the Regional Valencian Government andIMPIVA Grant (IMIDTD 2004/92, and IMIDTD 2005/15).
The global goal of GENERICA was the development of a methodology to evaluateperformance and functionality of web applications typical in Web 2.0, by using a newworkload generator with the ability to generate representative dynamic workload.
GENERICA was managed by the author of this Ph.D dissertation, who worked ac-tively in the project results, both software development and several technical reports,and co-authored in some international and national publications.
1.4 Outline
The remainder of this thesis is organized as follows. First, Chapter 2 presents thecurrent state of the art in characterizing and generating workloads for web perfor-mance evaluation. It reviews the most relevant perspectives to define web workloads,and classifies a representative subset of software tools proposed in the open litera-ture according to their main features and their ability to generate workloads for thedynamic Web.
3

CHAPTER 1. INTRODUCTION
After that, Chapter 3 proposes a new web workload model with the aim of char-acterizing a more realistic workload to evaluate the performance of current web appli-cations. The chapter describes the main concepts of this model and introduces someexamples of user’s dynamism representation.
Next, Chapter 4 propounds a new web workload generator based on the model.This chapter describes the main features, applications, and architecture of the genera-tor. It also introduces an example of web performance evaluation using this software,that has been appropriately validated against a traditional workload generator. Then,with the aim of providing a more flexible tool to evaluate web performance, a newtestbed with the ability of reproducing dynamic user workloads has been developed.Chapter 5 presents both testbed design and validation.
Chapters 6 and 7 analyze for the first time, to the best of our knowledge, the impactof considering user’s dynamism on web workload characterization in performancestudies. Chapter 6 proves that the web user’s dynamic behavior is a crucial pointthat must be addressed in web performance in order to accurately estimate systemperformance indexes. On the other hand, Chapter 7 measures the effect of modelingthe User-Browser Interaction as a part of user’s dynamic behavior on web workloadcharacterization.
Finally, Chapter 8 summarizes the main contributions of this thesis, presents someconcluding remarks and the open research lines derived from this dissertation.
4

CHAPTER 2
Characterizing and generating workload forweb performance evaluation
Web workload characterization studies that help us to model and reproduce users’behaviors grow in importance with the massively use of web applications and services[BC98]. Moreover, both types of applications are developed using new technologiesthat have a strong impact on the system performance. Some previous attempts havebeen published to reflect this fact. For instance, Cecchet et al. [CMZ02] investigatethe effect of different J2EE application deployments on the performance scalability ofapplication servers. Schneider et al. [SAAF08] point out that the use of AJAX andmashups generates more aggressive and bursty network usage compared to the overallHTTP traffic. Similar conclusions but considering server performance are presentedin [ONUI09] by Ohara et al. Unfortunately, these studies only consider specific webparadigms, thus the workload used is not representative enough of current users’navigations.
This chapter presents the current state of the art in characterizing and generatingworkloads for web performance evaluation. First, Section 2.1 reviews a representativesubset of the most relevant perspectives to define web workloads, and analyzes themain drawbacks that we have to tackle in order to obtain representative workloadsfor current web applications. Moreover, we go over different approaches to representuser’s behavior on web workload characterization. After that, Section 2.2 evaluatesand classifies the most commonly used software tools proposed in the open literatureaccording to their main features and ability to generate workloads for the dynamicWeb. Finally, Section 2.3 presents some concluding remarks about this work, whichmotivate the main contributions of this dissertation.
2.1 Workload models and the current Web
Web workload models are abstractions of the real workload that reproduce users’behaviors and ensure that a particular web application performs as it would do when
5

CHAPTER 2. CHARACTERIZING AND GENERATING WORKLOAD FORWEB PERFORMANCE EVALUATION
working with real users. To this end, the model represents a set of users of the webapplication and avoids those characteristics that are superfluous for a particular study.Workload models can be classified into two main groups: trace-based and analyticalmodels.
Traces log the sequence of HTTP requests and commands received by a web appli-cation during a certain period of time under given conditions. Traces are obtained fora particular environment; that is, specific server speed, network bandwidth, browsercache capacity, etc. This means that if any system parameter varied, the obtainedtrace would be different. Therefore, the main challenge of trace-based models isto achieve a good representativeness, especially when requests received by differentservers exhibit a large variability. Consequently, trace based models are not appro-priate to model changes in the user’s behavior.
The analytical approach uses mathematical models to simulate the user’s behavioror the characteristics of specific workloads. These models allow us to consider differentscenarios by setting some input parameters that specify the main characteristics of theworkload to be characterized. Analytical models are a flexible approach for modelingchanges in the user’s behavior.
Some studies [FP01, SCK03] confirm how difficult is to model and generate rep-resentative web requests, especially when trying to model the characteristics of thedynamic Web and its users. In this dissertation, the main difficulties when model-ing the user’s behavior on realistic web workload have been summarized in the threechallenges reported on page 1.
There have been few but interesting efforts to model user’s behavior in order toobtain more representative users workloads for specific web applications. Menasce etal. [MA00] introduced the Customer Behavior Model Graph (CBMG) that describespatterns of user’s behavior in the workloads of e-commerce websites by using anapproach based on Finite State Machines (FSMs). The CBMG model consists of allpages of an on-line bookstore and the associated transition probability. For illustrativepurposes, Figure 2.1 depicts an example of CBMG for a search process, showing thatusers may visit several pages and move among these pages according to the arcsweight. Numbers in the arcs indicate the probability of taking that transition. Forexample, the probability of going to the Product Detail page from the Search Resultspage is 60%. This value means that after a search, regardless of whether the searchreturns a list of books or a void list, the Product Detail page will be visited 60% ofthe times.
Duarte et al. [DMA+08] introduced the Visitor Behavior Model Graph (VBMG)for workload definition of the blogspace by extending CBMG. Blog visitors can begrouped into different categories according to their visiting patterns. These categoriesare characterized by different VBMGs in terms of the state transition probabilities.For example, Figure 2.2 shows the typical behavior of blurkers, who tend to reada lot of blogs but never post any comments. This behavior only considers that ablurker can start reading a new blog or can continue reading the same blog. Notice
6

2.1. WORKLOAD MODELS AND THE CURRENT WEB
100 // Home100 // Search
100
��ProductDetail
100
OO
SearchResults60
oo
35
^^
5
JJ
Figure 2.1: Example of a simplified CBMG model
start readinga new blog
1%��
99%
''continue reading
the same blog
50%��
7%
gg43%
��
Figure 2.2: Example of a VBMG model for blurkers
Source [DMA+08]
that, if a blurker reads the same blog at least twice, he can also leave the blog witha probability of 43% (exit transition).
Shams et al. [SKF06] proposed an application modeling methodology to han-dle inter-request and data dependencies. The methodology relies on Extended Fi-nite State Machines (EFSMs) that can model applications with higher-order requestdependencies without encountering the state explosion problem [LY96], typical inFSM-based approaches. Consequently, EFSM is better suited for modeling web ap-plications than CBMG and VBMG. Figure 2.3 depicts and example of EFSM foran e-commerce system, where nodes are states in the user’s navigation and arcs arerequests to the web application. Two request dependency state variables are usedto enforce inter-request dependencies. The items in cart is an integer variable thatindicates the number of items in the shopping cart and the signed on is a boolean vari-able that states whether a user has signed on or not. For example, the items in cartvariable is incremented by 1 when the user executes the Add request type (transitionfrom S2 to S3), and it is decremented by 1 when the user executes the Delete requesttype (transition from S3 to S4). So that, the Checkout request type (transition fromS4 to S5) is only allowed when the previous sequences of requests have resulted in atleast one item in the shopping cart (items in cart > 0).
Benevenuto et al. [BRdMCA09] introduced the Clickstream Model to characterizeuser’s behavior in On-line Social Network (OSN). This approach identifies and de-scribes representative users’ behaviors in OSNs by characterizing the type, frequency,and sequence of their activities. The modeling of the system implies two steps: i) to
7

CHAPTER 2. CHARACTERIZING AND GENERATING WORKLOAD FORWEB PERFORMANCE EVALUATION
input. To accommodate the approach described in Section 3, we introduce several additional model elements. Firstly, to facilitate the generation of an input trace of sessionlets an EFSM always has a Start state and an Exit state. They model respectively, the starting and termination of interactions a user has with the Web-based application. Secondly, each transition has two distinct sets of predicates and actions. Request dependency predicates and request dependency actions are involved in enforcing correct inter-request dependencies. Data dependency predicates and data dependency actions are used to satisfy data dependencies. As described later, such a distinction is necessitated by the two step trace generation process described in Section 3. Finally, data dependency actions may invoke select functions. The select function is used to choose a specific value for a given request parameter from among all the possible values for the parameter. The following sections provide a detailed description of these elements along with examples.
4.2 Modeling Inter-Request Dependencies As described in Section 3, the sequence generator uses the application model to create a trace of input sessionlets. A sessionlet is generated as follows. The model is initialized by providing initial values to the state variables. The sequence generator causes a transition from the Start state by executing a randomly selected transition from among the set of allowed transitions from that state. Another transition is executed in a similar manner if the resulting state is not the End state. Sessionlet generation is complete if the End state is reached. The sequence generator outputs the sequence of inputs (i.e., request types) corresponding to the sequence of transitions executed. It then re-initializes the application model to generate more sessionlets. Valid sessionlets are produced as long as the application model enforces the correct inter-request dependencies.
We now present an e-commerce application example to illustrate modeling of inter-request dependencies. Figure 2 shows a simplified model for the application. In this application users execute the Home request type to request the homepage. The Sign-in request type allows a user to login as a registered user. A user can view product information through the Browse request type. The Add and Delete request types allow a user to add and delete items from the shopping cart, respectively. The Checkout request type allows a user to initiate ordering of products in the shopping cart. A user submits the Purchase request type to provide payment details for finalizing the order.
Two request dependency state variables are used to enforce inter-request dependencies. The items_in_cart is an integer variable that indicates the number of items in the shopping cart. The signed_on Boolean variable states whether a user has signed on or not. The initial values of the items_in_cart and signed_on variables are 0 and FALSE, respectively. The values of these variables are changed by actions associated with several transitions. For example, from Figure 2, submitting the Sign-in request type (transitions S1 to S7 and S5 to S7) changes the value of signed_on to TRUE. Similarly an Add request type (transition S2 to S3) increments items_in_cart variable by 1 while a Delete request type (transitions S3 to S4 and S4 to S4) decrements the variable by 1.
From Figure 2, certain transitions depend only on the current state of the EFSM. These first-order transitions are not associated with any predicates. For example, a user can submit a Browse request type after submitting a Home request type as indicated by the transition from S1 to S2. Similarly, a user can browse another product after browsing a particular product as indicated by the transition from S2 to S2.
Our application model also allows higher-order dependencies between request types to be captured. For example, consider the transition from S4 to S5 in Figure 2. In this transition, the user submits a checkout request after deleting an item from the shopping cart. This transition is allowed only when the previous sequences of requests have resulted in at least one item in the shopping cart. This dependency is enforced by the predicate associated with the transition which checks whether the items_in_cart variable is greater than 0. Consequently, the sequence [Home, Browse, Add, Browse, Add,
Delete, Checkout] is allowed while the sequence [Home, Browse, Add, Delete, Checkout] is not.
The EFSM can model different ways in which a user can complete a given task. Such a scenario is very common in Web-based applications. In the example considered a user can either sign-in just immediately before purchasing (transition S5 to S7 in Figure 2) or sign-in immediately after visiting the homepage (transition S1 to S7 in Figure 2). As a result, the sequences [Home, Browse, Add, Checkout, Sign-in, Purchase] and [Home, Sign-in, Browse, Add, Checkout,
Purchase] represent two possible ways for a user to purchase
Figure 2. An EFSM for an e-commerce system
Proceedings of the Third International Workshop on Software Quality Assurance (SOQUA’06)
58
Figure 2.3: Example of a simplified EFSM model for an e-commerce system
Source [SKF06]
identify dominant user’s activities in clickstreams, and ii) to compute the transitionrates between activities. For illustrative purposes, Figure 2.4 shows the transitionprobability in the Clickstream Model for an OSN.
These four models only characterize web workload for specific paradigms or appli-cations, but they either do not model user’s dynamic behavior for a general contextand in an appropriate and accurate way (Challenge I ) or do not consider user’s dy-namic roles (Challenges II and III ).
On the other hand, there is an evidence of an important change of user interactionwith the Web. For instance, a recent study showed that 57.4% of web sessions involveparallel browsing behavior [HW10]. This behavior was originally found in the experi-enced users, who surf the Web by using multiple browsers tabs or windows to supportbacktracking or multitasking with the aim of enhancing their navigation productivity
8

2.2. WEB WORKLOAD GENERATORS OVERVIEWActivity at time t
Activ
ity a
t tim
e t+
1
StartSearch
ScrapbookMessage
TestimonialVideo
Photo
Profile & Friends
Community
Other
5 10 15 20 25 30 35 40
5
10
15
20
25
30
35
40
Tran
sitio
n pr
obab
ility
0.8
0.7
0.6
0.5
0.4
0.3
0.2
0.1
−0
2: browse scraps
18: browse home
17: browse profile
(a) User behaviors at the level of activities
(b) User behaviors at the level of categories
Figure 6: Transition probability in the clickstream model for Orkut
57
Figure 2.4: Transition probability in the Clickstream Model for an OSN
Source [BRdMCA09]
[AJK05, Tha08]. Moreover, the history-back button, included in any current webbrowser, is still one of the world’s most heavily used user interface components in theweb context, and accounts for up to 31% of all revisits [OWHM07]. This importantchange has been considered in several studies and tools to improve the website usabil-ity [ASW06], to test web applications [DLDP03] or learning user preferences [SZ00].However, to the best of our knowledge, User-Browser Interaction (UBI) have not beentaken into account when modeling user’s dynamism on workload characterization inweb performance studies yet.
2.2 Web workload generators overview
Workload generators are software products based on workload models to generateHTTP requests sequences similar to real requests. They are designed and imple-mented as versatile software tools for performing tuning or capacity planning studies.
Comparing web workload generators is a laborious and difficult task since theyoffer a large amount and diversity of features. In this section we contrast genera-tors according to a wide set of features and capabilities, focusing on their ability toreproduce user’s dynamism in performance studies for current Web.
To this end, Section 2.2.1 analyzes a representative subset of state-of-the-art work-load generators as a first step, highlighting their main features as web performanceevaluation software and their main disadvantages when reproducing accurate work-load for current Web. After that, in Section 2.2.2 we evaluate and classify thesegenerators, concentrating on those that consider user’s dynamic behavior.
9

CHAPTER 2. CHARACTERIZING AND GENERATING WORKLOAD FORWEB PERFORMANCE EVALUATION
2.2.1 Software tools study
2.2.1.1 WebStone
WebStone [Min02b] was designed by Silicon Graphics in 1996 to measure the perfor-mance of web server software and hardware products. It was acquired by Mindcraft,Inc. that improved its reliability and portability as well as the reproducibility ofperformance tests. Moreover, new workloads for CGI, NSAPI and ISAPI tests wereprovided. Nowadays, both executable and source code for WebStone are available forfree.
The benchmark generates a web server load by simulating multiple web clientsnavigating a website as shown in Figure 2.5. These clients can be considered as users,web browsers, or other software that makes requests to the website files, which can beclassified in different categories according to their size. The simulation is carried outusing multiple clients running on one or more computers to generate large loads ona web server. All the testings done by the benchmark are controlled by a webmaster,which is a program that can be run on one of the client computers or on a different one.The webmaster distributes the web client software and test configuration files to theclient computers. After that, it starts the execution and waits for the clients to reportthe performance they measured. Finally, the webmaster combines the performanceresults from all the clients into a single report.
The performance measured by WebStone depends on the set of files used by theweb clients. The set used by default is based on a model of the Silicon Graphics websitein 1995, although it is possible to change the file set to one that better simulates thewebsite of interest.
Figure 2.5: WebStone architecture
Source [Min02a]
10

2.2. WEB WORKLOAD GENERATORS OVERVIEW
To sum up, WebStone is one of the first software products proposed to measurethe performance of web systems but it seems obsolete for the current Web. Table 2.1summarizes its main features and disadvantages.
Main features
• Parameterized workload.
• Distributed model for workload generation.
• Open performance reports.
• Open source solution.
Disadvantages
• Basic HTTP protocol only.
• No users’ navigations characterization.
• No facilities to consider user’s dynamism.
Table 2.1: Main features and disadvantages of WebStone
2.2.1.2 SPEC’s Benchmarks for Web Servers
The Standard Performance Evaluation Corporation (SPEC) has commercialized Bench-marks for Web Servers [SPE09] from 1996 to the early 2012. This benchmarks’ familyis designed to measure the performance of systems offering services in the Web. Thelast member of the family, named SPECweb2009, includes many sophisticated andstate-of-the-art enhancements to meet the modern demands of the current Web, suchas requests to static and dynamic content (ASP, JSP, and PHP), simultaneous usersessions, parallel HTTP connections to request page images or simulates browsercaching effects.
Figure 2.6 shows the logical components of SPECweb2009. The prime client ini-tializes and manages the other clients, sets up the web server and the back-end sim-ulator, and stores the results of the benchmark tests. The web server handles therequests issued by the clients by itself or by communicating with the back-end sim-ulator in order to retrieve specific information needed to complete HTTP responses.This simulator emulates the communication between a web server and a back-end ap-plication server. Each benchmark client generates HTTP requests according to certainworkloads that are defined by studying three representative types of web applications(banking, e-commerce, and support).
Table 2.2 presents the main features and disadvantages of SPECweb2009. Asobserved, SPEC software is a mature benchmark that has evolved with the Web,nonetheless it has not achieved to reproduce realistic workload in the performancestudies for the current Web because it does not consider user’s dynamism on workloadcharacterization.
11

CHAPTER 2. CHARACTERIZING AND GENERATING WORKLOAD FORWEB PERFORMANCE EVALUATION
<<component>>Prime Client
<<component>>Client 1
<<component>>Client 2
<<component>>Client n
<<component>>Web Server
<<component>>Back-EndSimulator
Figure 2.6: Logical components of SPECweb2009
Main features
• Parameterized workload.
• Different types of workloads according to the kind ofweb application.
• Distributed model for workload generation.
• Full HTTP protocol (cookies, HTTPS, dynamic con-tent, etc).
• Performance reports.
• Proprietary software.
Disadvantages
• No users’ navigations characterization.
• No facilities to consider user’s dynamism.
Table 2.2: Main features and disadvantages of SPECweb2009
2.2.1.3 SURGE
The Scalable URL Reference Generator (SURGE) [Bar98] was developed by Barfordin 1998 with the goal of measuring the server behavior while varying the user load.The need to develop SURGE appeared with the difficulty to generate representativetraces for the Web because workloads generated by web users have a number of un-usual features, such as the highly variable demands experienced by the web serversor the self-similarity shown by the network traffic [BC98]. To tackle these drawbacks,SURGE performs an analytical characterization of the user load and a set of math-ematical models that generate the HTTP requests in the server [BBBC99]. Thesemodels characterize:
• The distribution of sizes of unique files requested from web servers.
12

2.2. WEB WORKLOAD GENERATORS OVERVIEW
• The distribution of sizes of all files transferred from web servers.
• The popularity of all requested files.
• The temporal locality of requested files.
• The active (ON) and inactive (OFF) periods of time for the emulated users.
• The number of documents transferred during an active period.
SURGE was designed as a scalable software framework where the previous modelsare combined according to the various components of the Web [BC97]. The softwareresides on a sets of clients that are connected to a web server as depicted in Figure2.7. Each client executes a set of threads that request sets of documents which arethen transferred by the server (ON time). After receiving a set, the thread sleeps fora some amount of time (OFF time) simulating the user’s think time.
In summary, SURGE was a step forward on modeling accurate workload for eval-uating the performance of Web 1.0. Specifically, it was able to produce self-similarnetwork traffic under conditions of both high and low workload intensity. However, italso seems to be obsolete for the current Web because its generation process is basedon analytical models that do not consider user’s dynamism, and it cannot model 3-tier architectures for dynamic content generation. Table 2.3 summarizes the mainfeatures and disadvantages of SURGE.
Web ServerSURGE Client
SURGE Client
SURGE Client
ON/OFF Thread
ON/OFF Thread
ON/OFF Thread
ON/OFF Thread
System
System
System
System
LAN
Figure 2.7: SURGE architecture
Source [BC97]
13

CHAPTER 2. CHARACTERIZING AND GENERATING WORKLOAD FORWEB PERFORMANCE EVALUATION
Main features
• Workload generation architecture based on analyticalmodels.
• Distributed model for workload generation.
• Open source solution.
Disadvantages
• Basic HTTP protocol only.
• No users’ navigations characterization.
• No facilities to consider user’s dynamism.
Table 2.3: Main features and disadvantages of SURGE
2.2.1.4 S-Clients
Banga and Druschel proposed in their approach a new improved methodology forHTTP request generation [BD99]. In this context, S-Clients was designed with theaim of reproducing bursty traffic with peak loads exceeding the capacity of the serveras well as the modeling delay and loss characteristics of Wide Area Networks (WANs).
Figure 2.8 shows the S-Clients design. It defines an architecture (Figure 2.8a)where a set of client machines are connected to the server machine being testedthrough a router, which has sufficient capacity to support the maximum client trafficspecification. The purpose of the router is to simulate WAN effects by introducing anartificial delay and/or dropping packets at a controlled rate. Each client machine runsa number of scalable client processes. S-Clients splits the process of generating tracedHTTP requests in two subprocesses: one for obtaining the connection and other forrecovering the content (Figure 2.8b), so enabling a relative parallelism.
To sum up, S-Clients was an architecture devised to improve workload generatorsfor Web 1.0 that is still interesting to be considered in Web 2.0. Table 2.4 presentsthe main features and disadvantages of S-Clients.
2.2.1.5 WebJamma
WebJamma was a library to generate HTTP traffic written by the Network ResearchGroup at Virginia Tech [CAJ+99]. It is aimed at serving as baseline for developing afull web workload generator.
This library works in a simple way by taking a URL file that provides the sourceof the HTTP requests to be generated, so it cannot represent user’s dynamism. Ituses a multiprocessing architecture based on distributed generation nodes to test theperformance of web caching subsystems.
In summary, WebJamma was an interesting open source library to generate HTTPrequests in a easy way. Table 2.5 shows its main features and disadvantages.
14

2.2. WEB WORKLOAD GENERATORS OVERVIEW
G. Banga, P. Druschel / Measuring Web server capacity 73
Fox et al. 1997; Maltzahn et al. 1997] and other typesof servers.WAN delays also cause an increase in the bandwidth-
delay product experienced by a TCP connection. There-fore, the server TCP needs to provide increased amounts ofbuffer space (in the form of socket send buffers) for Webtransfers to proceed at full speed. This increased demandfor buffer space may reduce the amount of main mem-ory available for the document cache. Current Web serverbenchmarks do not expose these performance aspects ofservers.Other aspects of the network subsystem, such as the
server TCP’s timeout mechanism, are never exercised dur-ing benchmarking and may perform poorly in practice. Ourexperiments, described in detail later in section 5, suggestthat these factors are important in practice.
3.3. Client and network resource constraints
When generating synthetic HTTP requests from a smallnumber of client machines, care must be taken that resourceconstraints on the client machine do not accidentally dis-tort the measured server performance. With an increasingnumber of simulated clients per client machine, client-sideCPU and memory contention is likely to arise. Eventually,a point is reached where the bottleneck in a Web trans-action is no longer the server but the client. Designersof commercial Web server benchmarks have also noticedthis pitfall. The WebStone benchmark [Mindcraft 1998]explicitly warns about this potential problem, but gives nosystematic method to avoid it.The primary factor in preventing client bottlenecks from
affecting server performance results is to limit the numberof simulated clients per client machine. In addition, it isimportant to use an efficient implementation of TCP/IP (inparticular, an efficient PCB table implementation) on theclient machines, and to avoid I/O operations in the simu-lated clients that could affect the rate of HTTP transactionsin uncontrolled ways. For example, writing logging infor-mation to disk can affect the client behavior in complexand undesirable ways.Similarly, while benchmarking a Web server, it is impor-
tant to ensure that the bandwidth of the network connectingthe client machines to the server is not a bottleneck factor.Many modern workstations can saturate a single 100 Mbpslink. Therefore, it may be necessary to use multiple net-work interfaces in the Web server machine to measure itstrue capacity.
4. A new method for generating HTTP requests
In this section, we describe the design of a new methodto generate Web traffic. This method addresses the prob-lems raised in the previous section. It should be noted thatour work does not by itself address the problem of accu-rate simulation of Web workloads in terms of the request
Figure 3. Test-bed architecture.
file types, transfer sizes and locality of reference in URLsrequested; instead, we concentrate on mechanisms for gen-erating heavy concurrent traffic that has a temporal behaviorsimilar to that of real Web traffic. Our work is intended tocomplement the existing work done on Web workload char-acterization [Bestavros et al. 1995; Braun and Claffy 1994;Chankhunthod et al. 1996; Seltzer and Gwertzman 1995;Williams et al. 1996], and can be easily used in conjunc-tion with it.
4.1. Basic architecture
The basic architecture of our test-bed is shown in fig-ure 3. A set of P client machines are connected to theserver machine being tested. Each client machine runs anumber of S-Client (short for Scalable Client) processes.The structure of an S-Client, and the number of S-Clientsthat run on a single machine are critical to our methodand are described in detail below. The client machines areconnected to the server through a router that has sufficientcapacity to carry the maximum client traffic anticipated.The purpose of the router is to simulate WAN effects byintroducing an artificial delay and/or dropping packets at acontrolled rate.
4.2. S-Clients
An S-Client (figure 4) consists of a pair of processesconnected by a UNIX domain socketpair. One process inthe S-Client, the connection establishment process, is re-sponsible for generating HTTP requests at a certain rateand with a certain request distribution. After a connectionis established, the connection establishment process sendsan HTTP request to the server, then it passes on the con-nection to the connection handling process, which handlesthe HTTP response.
(a) Basic architecture
74 G. Banga, P. Druschel / Measuring Web server capacity
Figure 4. A Scalable Client.
The connection establishment process of an S-Clientworks as follows: The process opens D connections tothe server using D sockets in non-blocking mode. TheseD connection requests7 are spaced out over T milliseconds.T is required to be larger than the maximal round-trip delaybetween client and server (remember that an artificial delaymay be added at the router).After the process executes a non-blocking connect() to
initiate a connection, it records the current time in a variableassociated with the used socket. In a tight loop, the processchecks if for any of its D active sockets, the connection iscomplete, or if T milliseconds have elapsed since a con-nect() was performed on this socket. In the former case,the process sends an HTTP request on the newly estab-lished connection, hands off this connection to the otherprocess of the S-Client through the UNIX domain socket-pair, closes the socket, and then initiates another connectionto the server. In the latter case, the process simply closes thesocket and initiates another connection to the server. No-tice that closing the socket in both cases does not generateany TCP packets on the network. In the first case, the closemerely releases a reference to the corresponding socket. Inthe second case, the close prematurely aborts TCP’s con-nection establishment timeout period and releases socketresources in the kernel.The connection handling process of an S-Client waits for
(1) data to arrive on any of the active connections, or (2) for7 In this paper, we model only HTTP/1.0, which uses a dedicated connec-tion for each distinct HTTP request.
a new connection to arrive on the UNIX domain socketconnecting it to the other process. In case of new data onan active socket, it reads this data; if this completes theserver’s response, it closes the socket. A new connectionarriving at the UNIX domain socket is simply added to theset of active connections.The rationale behind the structure of an S-Client is as
follows. The two key ideas are to (1) shorten TCP’s connec-tion establishment timeout, and (2) to maintain a constantnumber of unconnected sockets (simulated clients) that aretrying to establish new connections. Condition (1) is ac-complished by using non-blocking connects and closing thesocket if no connection was established after T seconds.The fact that the connection establishment process tries toestablish another connection immediately after a connectionwas established ensures condition (2).The purpose of (1) is to allow the generation of request
rates beyond the capacity of the server with a reasonablenumber of client sockets. Its effect is that each client socketgenerates SYN packets at a rate of at least 1/T . Shorteningthe connection establishment timeout to 500 ms by itselfwould cause the system’s request rate to follow the dashedline in figure 2.The idea behind (2) is to ensure that the generated re-
quest rate is independent of the rate at which the server han-dles requests. In particular, once the request rate matchesthe capacity of the server, the additional queuing delaysin the server’s accept queue no longer reduce the requestrate of the simulated clients. Once the server’s capacityis reached, adding more sockets (descriptors) increases the
(b) A Scalable Client
Figure 2.8: S-Clients design
Source [BD99]
Main features
• Parameterized workload.
• A router to simulate WAN effects.
• A split generation process to avoid limits on HTTPrequests.
• Open source solution.
Disadvantages
• Only an architecture for workload generation.
• Basic HTTP protocol only.
• No users’ navigations characterization.
• No facilities to consider user’s dynamism.
Table 2.4: Main features and disadvantages of S-Clients
2.2.1.6 TPC BenchmarkTM W
TPC BenchmarkTM W (TPC-W) is a transactional web benchmark defined by theTransaction Processing Performance Council [Tra02a]. It models a representativee-commerce system, specifically an on-line bookstore environment, with the aim of
15

CHAPTER 2. CHARACTERIZING AND GENERATING WORKLOAD FORWEB PERFORMANCE EVALUATION
Main features
• Easy to use as a baseline of other software generators.
• Open source solution.
Disadvantages
• Basic stressing functionalities.
• No users’ navigations characterization.
• No facilities to consider user’s dynamism.
Table 2.5: Main features and disadvantages of WebJamma
evaluating the architecture performance on a generic profile. To this end, the bench-mark provides both models of business-client and business-business and examines realfeatures of e-commerce applications, such as: catalog, searcher, security, etc.
As shown in Figure 2.9, TPC-W presents a client-server architecture. The remotebrowser emulators are located in the client side and generate workload towards thee-commerce web application, which is located in the server side (e-commerce server).With the aim of reproducing a representative workload, the emulators simulate realusers’ behaviors when they surf the website by using the CBMG model, which is com-posed of all pages of the on-line bookstore and the associated transition probability.The server hosts the system under test, which consists of a web server and its storageof static contents, and an application server with a database system to generate dy-namic content. The payment gateway emulator represents an entity to authorize users’payments. These three main architecture components are interconnected through adedicated network.
Figure 2.9: TPC-W architecture
16

2.2. WEB WORKLOAD GENERATORS OVERVIEW
To sum up, TPC-W was the first benchmark for e-commerce considering the users’behaviors on workload generation. To this end, TPC-W adopts CBMG model todefine web workload in spite of this model only characterizes user’s dynamic behaviorpartially, as introduced in Section 2.1. The benchmark, which has been commonlyaccepted by the scientific community in many research works [DMB01, ACC+02,GG03], presents the main features and disadvantages shown in Table 2.6.
Main features
• Parameterized workload.
• Different types of workloads according to the type ofscenario.
• Distributed model for workload generation.
• Full HTTP protocol (cookies, HTTPS, dynamic con-tent, etc).
• Basic facilities to consider user’s behavior.
• Performance reports.
• Open source solution.
Disadvantages
• Basic users’ navigations characterization.
• No advanced facilities to consider user’s dynamism.
Table 2.6: Main features and disadvantages of TPC-W
2.2.1.7 Web Polygraph
Web Polygraph is a performance testing tool for caching proxies, origin server accel-erators, L4/7 switches, content filters, and other web intermediaries. It was originallydeveloped at the University of California by Wessels and Rousskov in the contextof the IRCache project [RWC99]. Nowadays, it is copyrighted by The MeasurementFactory [MF12] that authorizes the use of Polygraph under the Apache License.
The benchmark consists of virtual clients and servers glued together with an ex-periment configuration file [RW03]. Clients, named robots, generate HTTP requestsfor the simulated objects. These requests may be sent directly to the servers (e.g.web servers), or through an intermediary (e.g. proxy cache or load balancer) using aconfigurable mix of HTTP/1.0 and HTTP/1.1 protocols, optionally encrypted withSSL or TLS. The benchmark can be configured to produce a variety of realistic andunrealistic workloads based on a synthetic workload characterization. As Polygraphruns, measurements and statistics are gathered for a detailed postmortem analysis.
In summary, Web Polygraph is a versatile tool for generating web traffic andmeasuring proxy performance that was chosen for several industry-wide benchmarking
17

CHAPTER 2. CHARACTERIZING AND GENERATING WORKLOAD FORWEB PERFORMANCE EVALUATION
events. Table 2.7 shows its main features and disadvantages focusing on workloadgeneration.
Main features
• Synthetic workload characterization.
• Distributed model for workload generation.
• Full HTTP protocol.
• Performance reports.
• Successful industrial solution.
• Apache License.
Disadvantages
• No users’ navigations characterization.
• No facilities to consider user’s dynamism.
Table 2.7: Main features and disadvantages of Web Polygraph
2.2.1.8 LoadRunner
LoadRunner is one of the most popular industry-standard software products for func-tional and performance testing. It was originally developed by Mercury Interactive,but nowadays it is commercialized by Hewlett-Packard [HP12a].
Figure 2.10 shows how LoadRunner works [HP12b]. As observed, it tests a webapplication by emulating an environment where multiple users work concurrently.Moreover, it accurately measures, monitors, and analyzes performance and function-
8
Figure 5How HP LoadRunner works
Hundreds of virtual usersperform real-lifetransactions to simulateproduction traffic
Real-time monitors captureperformance data across alltiers, servers and networkresources and displayinformation on the Controller
Results are stored in adatabase repositoryallowing users to generate reports andperform analysisThe Controller is a
central console fromwhich the load tests aremanaged and monitored
2 3
4
1
6WHS����'HƭQLQJ�WKH�SHUIRUPDQFH�WHVWV�VFHQDULRV�
The performance test scenario contains information about the groups of Vusers that can run the scripts and the load machines on which the groups are running. To run a successful scenario, you PXVW�ƭUVW�FDWHJRUL]H�\RXU�FXVWRPHUV�LQWR�JURXSV�EDVHG�RQ�WKHLU�WUDQVDFWLRQV��7KHQ��\RX�QHHG�WR�GHƭQH�DQG�GLVWULEXWH�WKH�WRWDO�QXPEHU�RI�9XVHUV��<RX�FDQ�DVVLJQ�D�YDU\LQJ�QXPEHU�RI�9XVHUV�WR�LQGLYLGXDO�EXVLQHVV�SURFHVVHV�WR�HPXODWH�XVHU�JURXSV�SHUIRUPLQJ�multiple transactions. One group may be searching for a book, while the second and third groups are entering payment information or VKLSSLQJ�DGGUHVVHV��$IWHU�9XVHU�JURXSV�KDYH�EHHQ�DVVLJQHG��\RX�must determine which load-generating machines the Vusers can run on. You can add load generator machines to the client side of the system architecture to run additional Vusers. Finally, you need to specify how the scenario will run. You can run the Vuser groups either in staggered or parallel formation. Staggering the Vusers DOORZV�\RX�WR�H[DPLQH�D�JUDGXDO�LQFUHDVH�RI�WKH�XVHU�ORDG�WR�D�SHDN��
r� Creating load testing scenarios with HP LoadRunner +3�/RDG5XQQHU�&RQWUROOHU�LV�XVHG�WR�FUHDWH�VFHQDULRV��SURYLGLQJ�\RX�ZLWK�FRPSOHWH�YLVLELOLW\�RI�WKH�WHVWV�DQG�WKH�9XVHUV�IURP�D�single point of control. The Controller facilitates the process of creating a load test scenario by allowing you to:
Ơ $VVLJQ�VFULSWV�WR�LQGLYLGXDO�JURXSV
Ơ 'HƭQH�WKH�WRWDO�QXPEHU�RI�9XVHUV�QHHGHG�WR�UXQ�WKH�WHVWV
Ơ 'HƭQH�WKH�KRVW�PDFKLQHV�RQ�ZKLFK�9XVHUV�DUH�UXQQLQJ
,Q�DGGLWLRQ��+3�/RDG5XQQHU�RƫHUV�D�VFHQDULR�ZL]DUG��D�VFKHGXOHU�DQG�7XUER/RDG�WR�HQKDQFH�\RXU�H[SHULHQFH�GXULQJ�WHVWLQJ��7KH�HP LoadRunner scenario wizard allows you to quickly compose
PXOWLXVHU�ORDG�WHVW�VFHQDULRV��8VLQJ�ƭYH�HDV\�WR�IROORZ�VFUHHQV��the scenario wizard leads you through a process of selecting the workstations that can host the Vusers, as well as the test scripts to run.
During this step-by-step process, you also create simulation groups of Vusers. The HP LoadRunner scheduler is used to ramp Vuser numbers up or down in order to position Vusers in both the UHDG\�VWDWH�DQG�WKH�UXQQLQJ�VWDWH��)RU�H[DPSOH��\RX�PD\�ZDQW�WR�gradually increase the number of customers logging onto your site ZLWK�D�ƭ[HG�EDWFK�VL]H��7KLV�LV�UHIHUUHG�WR�DV�WKH�UHDG\�VWDWH��7KLV�PHWKRG�KHOSV�DYRLG�XQQHFHVVDU\�VWUDLQ�RQ�WKH�V\VWHP�
The scheduler also manages scheduling and features an automated process that allows the user to run the script without being present. In real time, this would be similar to running a script GXULQJ�Rƫ�SHDN�KRXUVtVXFK�DV���S�P��WR���D�P��7R�VFKHGXOH�D�WHVW��you simply click the Run Scenario button and enter the desired starting time.
r� Create network impact tests. The network test uses information about where the groups of 9XVHUV�FDQ�EH�ORFDWHG�UHODWLYH�WR�WKH�VHUYHU��'XULQJ�WKH�WHVW��RQO\�WKH�QHWZRUN�FKDUDFWHULVWLFVtVXFK�DV�EDQGZLGWK�DYDLODELOLW\��contention, latency, errors, and jitter—can change; the number of Vusers in this test remains constant. By staggering the decreases in network bandwidth or increases in latency, HUURUV��DQG�MLWWHU��\RX�FDQ�XQGHUVWDQG�WKHLU�UHODWLYH�LQƯXHQFH�RQ�DSSOLFDWLRQ�EHKDYLRU��7KLV�GDWD�FDQ�EH�XVHG�WR�VHW�QHWZRUN�requirements for the application when it is deployed. You can FRQGXFW�WKLV�NLQG�RI�WHVWLQJ�GLUHFWO\�RYHU�WKH�QHWZRUN�WR�UHPRWH�
Figure 2.10: How LoadRunner works
Source [HP12b]
18

2.2. WEB WORKLOAD GENERATORS OVERVIEW
ality of the application while it is working under load. The testing process is controlledby a central console.
LoadRunner supports the definition of users’ navigations, which are representedusing a scripting language, to characterize users’ families. Figure 2.11 depicts thesequential approach to scripting a Web 2.0 application using LoadRunner [HP12c].First the basic steps are recorded, creating a shell script. Next, this script is thentaken off-line, and undergoes further manual steps such as data parameterizationand correlations. Finally, the desired performance scripts are obtained after addingtransactions and any other required logic. LoadRunner scripting permits only topartially reproduce user’s dynamism when generating web workload because it cannotdefine neither advanced interactions of users, such as parallel browsing behavior, norcontinuous changes in user’s behaviors.
4
%XW��DV�DOZD\V��ZLWK�SRZHU�FRPHV�FRPSOH[LW\��DQG�LQQRYDWLYH�WHFKQRORJLHV�FDQ�FUHDWH�XQIRUHVHHQ�FKDOOHQJHV�LI�QRW�SURSHUO\�WHVWHG��,Q�:HE�����DSSOLFDWLRQV��WKH�FOLHQWV�EHFRPH�pWKLFNHU�q�ULFKHU�LQ�IHDWXUHV�DQG�IXQFWLRQDOLW\��DQG�PRUH�UHVRXUFH�LQWHQVLYH��6LPLODUO\��IHDWXUHV�OLNH�SUHIHWFKLQJtDQ�LQWHUDFWLYH�ZD\�RI�UHWXUQLQJ�D�TXHU\�ZLWK�HYHU\�NH\VWURNHtFDQ�VLJQLƭFDQWO\�LQFUHDVH�WKH�URXQGWULS�WUDưF�WR�WKH�GDWDEDVH�DQG�JUHDWO\�LPSDFW�SHUIRUPDQFH��7KLV�FDQ�SRWHQWLDOO\�FUHDWH�D�FRQVLGHUDEOH�DPRXQW�RI�SHUIRUPDQFH�LVVXHV��YLRODWH�6/$V��DQG�QHJDWLYHO\�LPSDFW�WKH�HQG�XVHU�H[SHULHQFH�
Adjusting for modern methods5LFK�,QWHUQHW�DSSOLFDWLRQV�DOORZ�IRU�G\QDPLF��DV\QFKURQRXV�GDWD�WUDQVIHU��XVLQJ�PXOWLSOH�SURWRFROV�DQG�D�YDULHW\�RI�VHUYHUV��7KH\�JDWKHU�GDWD�IURP�GLVWULEXWHG��KHWHURJHQHRXV�VRXUFHV��LQFOXGLQJ�FORXG�EDVHG�DQG�H[WHUQDO�GDWD�VWRUDJH�RSWLRQV��7KLFN�FOLHQWV�ZLWK�ZLGJHWV�DQG�FOLHQW�VLGH�IXQFWLRQDOLW\�RIWHQ�KDYH�VHUYHU�VLGH�FRPSRQHQWV��ZKLFK�PD\�QHHG�DGGLWLRQDO�SURFHVVLQJ�EHIRUH�WKH�VHUYHU�VHQGV�WKH�GDWD�EDFN�WR�WKH�FOLHQW��'HYHORSHUV�ZKR�EXLOG�WKHVH�ZLGJHWVtRIWHQ�DGGLQJ�WKHP�IURP�DYDLODEOH�WRRONLWVtGR�LW�RQ�WKHLU�GHYHORSPHQW�PDFKLQHV�DQG�GRQoW�UHDOL]H�WKDW�RQFH�VHSDUDWHG�DFURVV�WKH�QHWZRUN��WKH�VHUYHU�FRPSRQHQW�PD\�FDXVH�ODWHQF\�DQG�DƫHFW�WKH�RYHUDOO�V\VWHP�SHUIRUPDQFH��
1HZ�WHFKQRORJLHV�VXFK�DV�$MD[�HQDEOH�SUHIHWFKLQJ��ZKHUH�HYHU\� new letter that a user enters into a search engine suggests a QHZ�VHW�RI�UHVXOWV�WKDW�DUH�G\QDPLFDOO\�GHOLYHUHG�IURP�WKH�VHUYHU�� $OO�WKLV�DFWLYLW\�JHQHUDWHV�D�ORW�RI�QHWZRUN�WUDưF�DQG�FDQ�VLJQLƭFDQWO\�LPSDFW�SHUIRUPDQFH��1HWZRUN�ODWHQF\�DQG�EDQGZLGWK�FRQVWUDLQWV�FDQ�DOVR�FUHDWH�SHUIRUPDQFH�ERWWOHQHFNV��7R�DFFXUDWHO\�SUHGLFW�WKH�SHUIRUPDQFH�RI�DQ�DSSOLFDWLRQ��LW�LV�QHFHVVDU\�WR�WHVW�LQGLYLGXDO�FRPSRQHQWV�DQG�VHUYLFHV��EXW�HTXDOO\�FULWLFDO�DUH�VHUYHU�PRQLWRULQJ�DQG�HQG�WR�HQG�SHUIRUPDQFH�WHVWLQJ��DORQJ�ZLWK�accurate WAN emulation.
Testing Web 2.0 applications presents its own set of challenges.1 The FRPSOH[LW\�RI�QHZ�WHFKQRORJLHV��WKH�ODFN�RI�FRPPRQO\�UHFRJQL]HG�DQG�DFFHSWHG�VWDQGDUGV��DQG�WKH�VKHHU�PXOWLWXGH�RI�HPHUJLQJ�IUDPHZRUNV�DQG�WRRONLWV�PDNH�LW�GLưFXOW�IRU�FRPSDQLHV�WR�EXLOG�:HE�2.0 testing strategies and select appropriate automation solutions. 7UDGLWLRQDO�WHVWLQJ�WRROV�IRFXV�RQ�SURWRFRO�OHYHO�YHULƭFDWLRQ��RƫHULQJ�QR�IUDPHZRUN�OHYHO�VXSSRUW�RU�DELOLW\�WR�DFFXUDWHO\�UHFRJQL]H�REMHFWV�LQ�WKHVH�QHZ��ULFK�FOLHQWV��PDNLQJ�LW�YLUWXDOO\�LPSRVVLEOH�WR�HƫHFWLYHO\�YDOLGDWH�WKH�SHUIRUPDQFH�RI�:HE�����DSSOLFDWLRQV��6FULSW�FUHDWLRQ��ZKLFK�KDV�DOZD\V�EHHQ�D�OHQJWK\��WLPH�FRQVXPLQJ�SURFHVV�WKDW�UHTXLUHV�GRPDLQ�DQG�DSSOLFDWLRQ�H[SHUWLVH��EHFRPHV�HYHQ�PRUH�complex in Web 2.0 applications.
Out with the old: The trouble with traditional testing tools The emergence of new Web 2.0 technologies has also transformed WKH�ZRUOG�RI�WHVWLQJ��,Q�WKH�HDUO\�:HE�GD\V��WHVWLQJ�WRROV�ZHUH�EDVHG�RQ�SURWRFRO�OHYHO�UHFRUGLQJ��7KH\�UHFRUGHG�WKH�KWWS�UHTXHVWV�IURP�WKH�EURZVHU�WR�WKH�VHUYHU�DQG�EDFN��'\QDPLF�YDOXHV�WKDW�WKH�VHUYHU�VHQW�EDFN��VXFK�DV�VHVVLRQ�,'V��KDG�WR�EH�PDQXDOO\�FRUUHODWHG��$V�DSSOLFDWLRQV�EHFDPH�PRUH�FRPSOH[��VR�GLG�WKH�VFULSWLQJ��&RUUHODWLRQV�VWDUWHG�WR�UHTXLUH�DGYDQFHG�VFULSWLQJ�DQG�DSSOLFDWLRQ�H[SHUWLVH��DQG�IT scripting became a complex and time-consuming process.
1 https://h10078.www1.hp.com/cda/hpdc/navigation.do?action=downloadPDF&caid=47��FS ��B����B���]Q EWRƭOHQDPH �$$������(1:�SGI
Record a script
Parameterize data
Do Correlations
Add transactions
Add logic
Figure 2: 6FULSWLQJ�IRU�:HE�����DSSOLFDWLRQV�VXFK�DV�$MD[�FDQ�EH�H[WUHPHO\�FRPSOLFDWHG
Figure 2.11: LoadRunner scripting for Web 2.0 applications
Source [HP12c]
To sum up, LoadRunner is one of the most important software products to testthe functionality and performance of a web application. It presents some facilitiesto consider user’s dynamism on the workload generation process, but only partially.Table 2.8 summarizes its main features and disadvantages.
2.2.1.9 WebLOAD
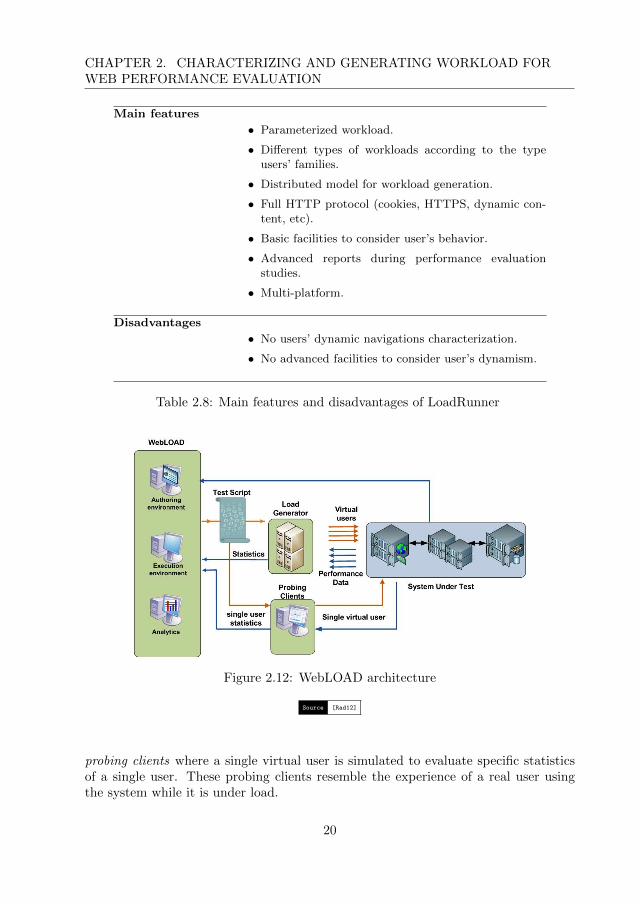
WebLOAD [Rad12] is a software for web performance commercialized by RadViewsince 1997. It is oriented to explore the performance of critical web applications byquantifying the utilization of the main server resources.
Figure 2.12 depicts the WebLOAD architecture. The authoring environment is asoftware tool to create scenarios that try to mimic the navigations of real users. Tothis end, it provides facilities to record, edit and debug test scripts, that are usedto define the scenarios on workload characterization. The execution environment isa console to manage tests execution, whose results are analyzed in the Analyticsapplication. Since WebLOAD is a distributed system, it is possible to deploy severalload generators to reproduce the desired load. Load generators can also be used as
19
CHAPTER 2. CHARACTERIZING AND GENERATING WORKLOAD FORWEB PERFORMANCE EVALUATION
Main features
• Parameterized workload.
• Different types of workloads according to the typeusers’ families.
• Distributed model for workload generation.
• Full HTTP protocol (cookies, HTTPS, dynamic con-tent, etc).
• Basic facilities to consider user’s behavior.
• Advanced reports during performance evaluationstudies.
• Multi-platform.
Disadvantages
• No users’ dynamic navigations characterization.
• No advanced facilities to consider user’s dynamism.
Table 2.8: Main features and disadvantages of LoadRunner
Figure 2.12: WebLOAD architecture
Source [Rad12]
probing clients where a single virtual user is simulated to evaluate specific statisticsof a single user. These probing clients resemble the experience of a real user usingthe system while it is under load.
20

2.2. WEB WORKLOAD GENERATORS OVERVIEW
In summary, WebLOAD is a commercial software that presents some capabilityto generate user’s dynamic behavior, but only in a partial way, when evaluatingperformance of a given web application. Table 2.9 shows the main features anddisadvantages of WebLOAD.
Main features
• Parameterized workload.
• Different types of workloads according to the type ofscenario.
• Distributed model for workload generation.
• Full HTTP protocol (cookies, HTTPS, dynamic con-tent, etc).
• Basic facilities to consider user’s behavior.
• Advanced reports during performance evaluationstudies.
• Multi-platform.
Disadvantages
• No users’ dynamic navigations characterization.
• No advanced facilities to consider user’s dynamism.
Table 2.9: Main features and disadvantages of WebLOAD
2.2.1.10 JMeter
JMeter [ASF12] is an open source solution presented by the Apache Software Foun-dation and designed to generate web workload with the aim of testing client/serversoftware, such as web applications and services.
The generator is written entirely in Java and provides an easily configurable andvisual API to define, execute and analyze web performance tests from the clientside. It presents partial capability to generate dynamic user’s workload by defininga navigation test based on patterns (e.g. regular expressions). Additionally, JMeterpresents some facilities to check the functionality of a web application, such as testscripts which use assertions to validate that the application returns the expectedresults. Table 2.10 summarizes its main features and disadvantages.
2.2.1.11 Testing scripts and tools
With the increasing popularity of web applications, some software and testing factoriesor web developers have created several scripts and tools, which are usually basic and
21
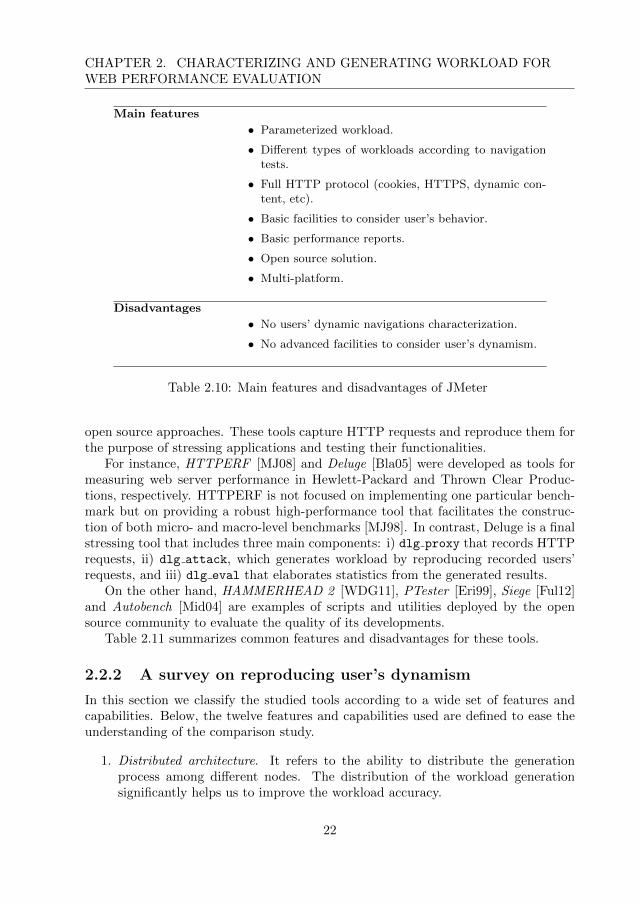
CHAPTER 2. CHARACTERIZING AND GENERATING WORKLOAD FORWEB PERFORMANCE EVALUATION
Main features
• Parameterized workload.
• Different types of workloads according to navigationtests.
• Full HTTP protocol (cookies, HTTPS, dynamic con-tent, etc).
• Basic facilities to consider user’s behavior.
• Basic performance reports.
• Open source solution.
• Multi-platform.
Disadvantages
• No users’ dynamic navigations characterization.
• No advanced facilities to consider user’s dynamism.
Table 2.10: Main features and disadvantages of JMeter
open source approaches. These tools capture HTTP requests and reproduce them forthe purpose of stressing applications and testing their functionalities.
For instance, HTTPERF [MJ08] and Deluge [Bla05] were developed as tools formeasuring web server performance in Hewlett-Packard and Thrown Clear Produc-tions, respectively. HTTPERF is not focused on implementing one particular bench-mark but on providing a robust high-performance tool that facilitates the construc-tion of both micro- and macro-level benchmarks [MJ98]. In contrast, Deluge is a finalstressing tool that includes three main components: i) dlg proxy that records HTTPrequests, ii) dlg attack, which generates workload by reproducing recorded users’requests, and iii) dlg eval that elaborates statistics from the generated results.
On the other hand, HAMMERHEAD 2 [WDG11], PTester [Eri99], Siege [Ful12]and Autobench [Mid04] are examples of scripts and utilities deployed by the opensource community to evaluate the quality of its developments.
Table 2.11 summarizes common features and disadvantages for these tools.
2.2.2 A survey on reproducing user’s dynamism
In this section we classify the studied tools according to a wide set of features andcapabilities. Below, the twelve features and capabilities used are defined to ease theunderstanding of the comparison study.
1. Distributed architecture. It refers to the ability to distribute the generationprocess among different nodes. The distribution of the workload generationsignificantly helps us to improve the workload accuracy.
22
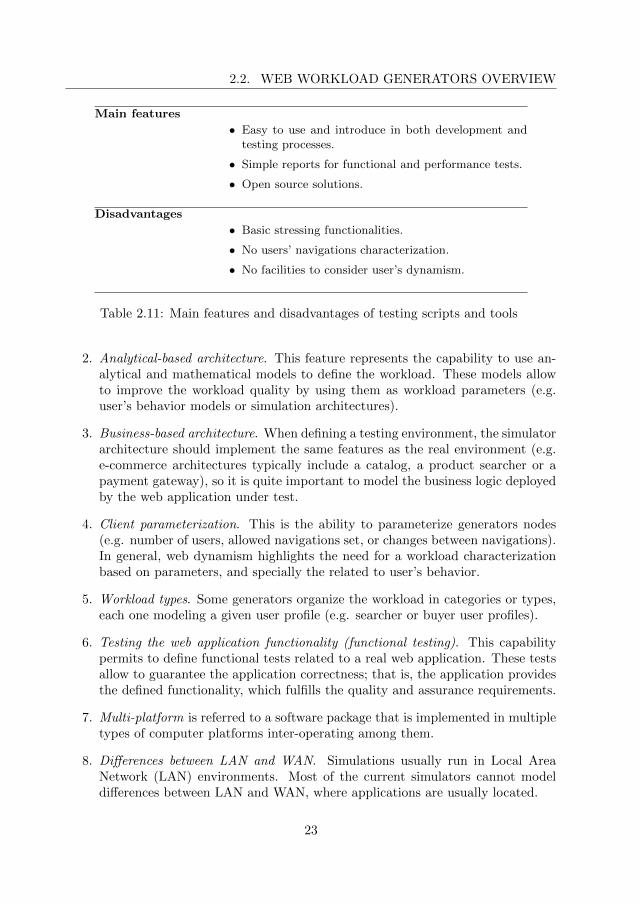
2.2. WEB WORKLOAD GENERATORS OVERVIEW
Main features
• Easy to use and introduce in both development andtesting processes.
• Simple reports for functional and performance tests.
• Open source solutions.
Disadvantages
• Basic stressing functionalities.
• No users’ navigations characterization.
• No facilities to consider user’s dynamism.
Table 2.11: Main features and disadvantages of testing scripts and tools
2. Analytical-based architecture. This feature represents the capability to use an-alytical and mathematical models to define the workload. These models allowto improve the workload quality by using them as workload parameters (e.g.user’s behavior models or simulation architectures).
3. Business-based architecture. When defining a testing environment, the simulatorarchitecture should implement the same features as the real environment (e.g.e-commerce architectures typically include a catalog, a product searcher or apayment gateway), so it is quite important to model the business logic deployedby the web application under test.
4. Client parameterization. This is the ability to parameterize generators nodes(e.g. number of users, allowed navigations set, or changes between navigations).In general, web dynamism highlights the need for a workload characterizationbased on parameters, and specially the related to user’s behavior.
5. Workload types. Some generators organize the workload in categories or types,each one modeling a given user profile (e.g. searcher or buyer user profiles).
6. Testing the web application functionality (functional testing). This capabilitypermits to define functional tests related to a real web application. These testsallow to guarantee the application correctness; that is, the application providesthe defined functionality, which fulfills the quality and assurance requirements.
7. Multi-platform is referred to a software package that is implemented in multipletypes of computer platforms inter-operating among them.
8. Differences between LAN and WAN. Simulations usually run in Local AreaNetwork (LAN) environments. Most of the current simulators cannot modeldifferences between LAN and WAN, where applications are usually located.
23

CHAPTER 2. CHARACTERIZING AND GENERATING WORKLOAD FORWEB PERFORMANCE EVALUATION
9. Ease of use. The generator should be a friendly application carrying out usabil-ity guidelines, mainly in commercial products.
10. Performance reports. The elaborated results by the generation process are usu-ally presented by using both on-line and off-line graphical plots.
11. Open source. This feature allows the open source community to develop exten-sions or different generation alternatives over the generator architecture.
12. User’s dynamism. This is the main feature we are interested in, because thedynamism in contents and users is the most relevant characteristic in the currentWeb that makes workload generation difficult.
Table 2.12 summarizes the studied software packages used to generate web work-load as well as the grade (full or partial) in which they fulfill the features describedabove. These software packages can be classified in three groups according to theirmain application contexts:
• Group I: Benchmarks that model the client and server paradigm in web con-text. In this case, among the five studied benchmarks, only TPC-W provides aworkload generation process that considers user’s dynamism, but only partially.The others do not model user’s dynamism because: i) they are simulation ap-proaches that do not reproduce real workload (WebStone and Web Polygraph),or ii) they are based on analytical models that do not consider user’s dynamismas a parameter (SPECweb and SURGE).
• Group II: Software products to evaluate performance and functionality of a givenweb application, such as LoadRunner, WebLOAD and JMeter. All of themprovide abilities to generate web workload taking into account user’s dynamismin a partial way.
• Group III: Testing tools and other approaches for traffic generation, that cannotreproduce user’s dynamic behavior due to they are based on HTTP traces.
As observed, only four of the studied approaches (i.e. TPC-W, LoadRunner,WebLOAD and JMeter) present some capability to reproduce user’s dynamism. Table2.13 deals with the ability of considering user’s dynamism in depth, and explores howeach approach takes into account the three challenges. Notice that, the four generatorsprovide some capability to partially reproduce the dynamism of users when they surfa website (Challenge I ) but in a different way. For instance, TPC-W only considersa probabilistic approach to define users’ navigations by using the CBMG model. Onthe other hand, LoadRunner, WebLOAD and JMeter provide scripting languages thatpermit to define users’ navigations considering conditional transitions between theirpages. Among these three generators, only the commercial products (LoadRunnerand WebLOAD) offer software artifacts to represent the different behaviors of users(Challenge II ), but they do not mind continuous changes in these behaviors.
24
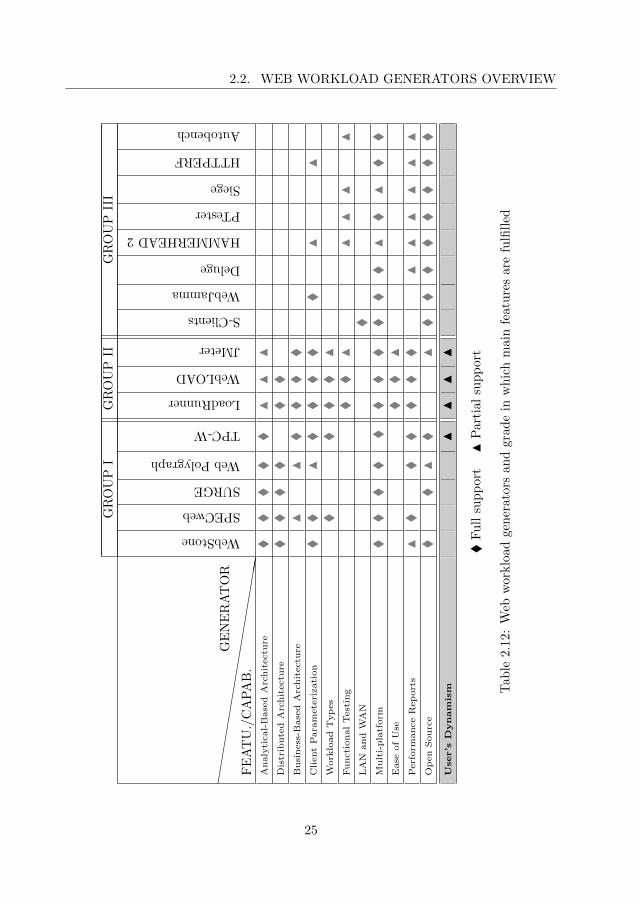
2.2. WEB WORKLOAD GENERATORS OVERVIEW
GR
OU
PI
GR
OU
PII
GR
OU
PII
I
hhh
hh
hhh
hhh
hhh
hh
h hF
EA
TU
./C
AP
AB
.
GE
NE
RA
TO
R
WebStone
SPECweb
SURGE
WebPolygraph
TPC-W
LoadRunner
WebLOAD
JMeter
S-Clients
WebJamma
Deluge
HAMMERHEAD2
PTester
Siege
HTTPERF
Autobench
Analytical-Based
Architectu
re���
��
NN
NDistributed
Architectu
re���
���
Business-B
ased
Architectu
reN
N�
��
�ClientPara
meterization
��
N�
��
��
NN
Work
load
Types
��
��
NFunctionalTesting
��
NNN
NN
LAN
and
WAN
�M
ulti-platform
���
��
��
���
�N�
N��
Ease
ofUse
��
NPerform
anceReports
N�
��
��
�N
NN
NNN
Open
Source
��N
�N
��
���
���
User’s
Dynam
ism
NNN
N
�F
ull
sup
por
tN
Part
ial
sup
port
Tab
le2.
12:
Web
wor
klo
adge
ner
ator
san
dgr
ade
inw
hic
hm
ain
featu
res
are
fulfi
lled
25

CHAPTER 2. CHARACTERIZING AND GENERATING WORKLOAD FORWEB PERFORMANCE EVALUATION
TPC-W LoadRunner WebLOAD JMeterChallenge I } ~ ~ ~Challenge II s sChallenge III
} Analytical approach ~ Scripting s Software artifact
Table 2.13: Web workload generators and how challenges of user’s dynamism arefulfilled
2.3 Summary
This chapter has analyzed state-of-the-art workload models and generators for webperformance evaluation, focusing on the capability to fulfill the three challenges thathave been introduced in Chapter 1.
With the aim of improving workload models, few approaches (CBMG, VBMG,EFSM and Clickstream Model) provided some capabilities to represent user’s behavioron web workload characterization, but they do not offer an accurate solution to modeluser’s dynamism.
Furthermore, among the studied software tools, only one benchmark for e-commerce(TPC-W) and three software solutions to evaluate functionality and performance ofa given web application (LoadRunner, WebLOAD and JMeter) provide mechanismsto reproduce users’ navigations in current Web. However, these mechanisms do notconsider all challenges when reproducing user’s dynamic behavior, so they are notenough to mimic real patterns of HTTP requests.
These lacks in models and software motivate us to propose a more accurate work-load model in order to develop a new workload generator with the aim of analyzingthe effect of using dynamic workloads on web performance evaluation, instead oftraditional workloads.
A first review of this state-of-the-art can be found in the context of the GENER-ICA project as a technical report [GENERICA’04a]. A summary of this work waspublished in [WOSP’05, IJEB’05]. In [WEBIST’11], an updated state-of-the-art waspresented.
26

CHAPTER 3
DWEB: modeling user’s dynamism on webworkload characterization
This chapter proposes the Dynamic WEB workload model (DWEB) with the aim ofcharacterizing a more realistic workload when evaluating the performance of currentweb applications.
DWEB tackles in a progressive way the three previously mentioned challengeswhen modeling the user’s behavior on representative workloads. To this end, it de-fines a couple of new concepts: user’s navigations and user’s roles. These conceptscharacterize different levels of dynamism in the workload definition by means of mod-eling web users’ behaviors.
The remainder of this chapter is organized as follows. Section 3.1 introduces thenavigation concept in general terms, describes its notation and provides an example ofmodeling a first level of dynamism. Section 3.2 defines the concept of role and presentsan example of representing a second level of dynamism. Finally, some concludingremarks are drawn in Section 3.3.
3.1 The user’s navigation
The concept of user’s navigation defines a first level of user’s dynamism and satis-fies the Challenge I by modeling user’s dynamic behavior when interacting with thecontents and services offered by the Web.
For instance, a typical navigation of a user searching for specific information,usually begins with a query on a web finder. Queries are frequently cancelled whenthe response time surpasses a certain value, which is characteristic for each user andhis current navigation conditions. In the case of obtaining results, users usually visitthe first site on the list or refine the search when receiving too much information.Analyzing this simple example, one can see that each user request depends not onlyon the response itself but also on other issues related to the quality of service (e.g.response time length or content amount), and the users’ states. That is, users take
27

CHAPTER 3. DWEB: MODELING USER’S DYNAMISM ON WEBWORKLOAD CHARACTERIZATION
their navigation decisions according to their personal preferences, navigation goals,visited resources, network and connectivity conditions, etc.
The navigation concept is not just limited to reproduce human behavior, since itcan be further applied to any web client, such as software automatons, that are easierto model than users because they follow a given navigation pattern. Nevertheless,the strong point of the concept lies in the flexibility to represent dynamism in user’sbehavior when interacting with the Web.
Formally, a user’s navigation N is defined as a sequence of n URLs of HTTPrequests where each visited URL depends on the previously visited ones, as definedin equation 3.1.
N = {url1, url2, ..., urln} / ∀i = 2..n : urli depends on urlk for
k < i and user’s-statei−1
(3.1)
where urli refers both to the content related to the resource i and its associated char-acteristics and, user’s-statei−1 denotes the user’s state resulting from the interactionwith the previously visited resource.
A graph where nodes were pages of websites and arcs were transitions betweenpages is not enough as a visual representation of a user’s navigation, because we need avisual modeling language that allows us to define user’s state. Moreover, this languagehas to provide mechanisms to easily model the user’s dynamism when navigating.
There are several successful extensions of Unified Modeling Language (UML) ap-plied to web engineering. For instance, User eXperience diagrams [Con03] are in-troduced to model the storyboards and the dynamic information of pages in build-ing model-driven web applications. Moreover, these diagrams were extended torapidly develop and deploy public administration portals considering usability fac-tors [FPZ07].
Due to these reasons, we decide to represent a navigation using a state machineview of UML. In general, a state machine is a graph of states and transitions thatdescribes the response of an object to the events that it receives [RJB99]. We simplifythis model by considering only a reduced set of graphical elements where states are webpages, as shown in Table 3.1. The result has been adopted for visual representationof the navigation concept.
For illustrative purposes, Figure 3.1 shows the visual navigation correspondingto a Google search where some dynamic issues in the user’s behavior (e.g. dynamicthink time or conditional and parallel requests) are introduced. Two main parts canbe distinguished in this navigation:
1. The upper part of the diagram (before reaching branch b1 ) shows the two waysin which the search can be initiated:
(1) On the left side, the user makes use of a search toolbar of a web browser(e.g. Google toolbar for Mozilla Firefox) to make the query directly.
(2) On the right side of the figure, the user reaches branch b1 after theGoogle.HOME node, where the user requests the main page to the web
28

3.1. THE USER’S NAVIGATION
Notation Name Description
76 Part 2 • UML Concepts
Transitions into or out of a composite state invoke the entry actions or exit ac-tions of the state. If there are several composite states, a transition across severallevels may invoke multiple entry actions (outermost first) or several exit actions
Table 6-4: Kinds of States
State Kind Description Notation
simple state A state with no substructure
concurrent com-posite state
A state that is divided into two or more concurrent substates, all of which are concurrently active when the composite state is active
sequential com-posite state
A state that contains one or more disjoint substates, exactly one of which is active at one time when the composite state is active
initial state A pseudostate that indicates the starting state when the enclosing state in invoked
final state A special state whose activation indi-cates the enclosing state has com-pleted activity
junction state A pseudostate that chains transition segments into a single run-to-completion transition
history state A pseudostate whose activation restores the previously active state within a composite state
submachine refer-ence state
A state that references a submachine, which is implicitly inserted in place of the submachine reference state
stub state A pseudostate within a submachine reference state that identifies a state in the referenced state machine
H
include S
T
BeginningThe initial state in a state machine represents thebeginning of a navigation.
76 Part 2 • UML Concepts
Transitions into or out of a composite state invoke the entry actions or exit ac-tions of the state. If there are several composite states, a transition across severallevels may invoke multiple entry actions (outermost first) or several exit actions
Table 6-4: Kinds of States
State Kind Description Notation
simple state A state with no substructure
concurrent com-posite state
A state that is divided into two or more concurrent substates, all of which are concurrently active when the composite state is active
sequential com-posite state
A state that contains one or more disjoint substates, exactly one of which is active at one time when the composite state is active
initial state A pseudostate that indicates the starting state when the enclosing state in invoked
final state A special state whose activation indi-cates the enclosing state has com-pleted activity
junction state A pseudostate that chains transition segments into a single run-to-completion transition
history state A pseudostate whose activation restores the previously active state within a composite state
submachine refer-ence state
A state that references a submachine, which is implicitly inserted in place of the submachine reference state
stub state A pseudostate within a submachine reference state that identifies a state in the referenced state machine
H
include S
T
EndThe final state in a state machine defines the endof a navigation; that is, the user leaves the website.
internal act ion[guard condit ion]State2Page action [guard condit ion]
Page
Pages are states where a user can execute actions(e.g. user’s think time) when their guard condi-tions are true. These conditions can also considerprobabilities in the same way than CBMG.
internal act ion[guard condit ion]
internal act ion[guard condit ion]State2Page
State2Page
action [guard condit ion]
action [guard condit ion] HTTPrequest
Transitions are HTTP requests to pages that areexecuted when their guard conditions are true.These conditions can also consider probabilities inthe same way than CBMG.
internal act ion[guard condit ion]
internal act ion[guard condit ion]
[Guard condit ion]
State2Page
State2
Pagefalse
t rue
action [guard condit ion]
action [guard condit ion]
If/elseA simple condition is introduced to ease under-standing of branches in user’s way.
internal act ion[guard condit ion]
internal act ion[guard condit ion]State2Page
State2Page
action [guard condit ion]
action [guard condit ion]
ParallelHTTPrequest
A parallel request starts parallelism on navigat-ing to execute n HTTP requests using n differentthreads.
internal act ion[guard condit ion]
internal act ion[guard condit ion]
[Guard condit ion]
State2Page
State2
Pagefalse
t rue
action [guard condit ion]
action [guard condit ion]
End ofparal-lelism
It transforms the parallel navigation in a sequentialnavigation again by killing the threading.
internal act ion[guard condit ion]
internal act ion[guard condit ion]
[Guard condit ion]
State2Page
State2
Pagefalse
t rue
action [guard condit ion]
action [guard condit ion]
Extension
It introduces a new extension point in the naviga-tion (e.g. call to external constraints or functions),that is used to highlight issues of dynamism.
76 Part 2 • UML Concepts
Transitions into or out of a composite state invoke the entry actions or exit ac-tions of the state. If there are several composite states, a transition across severallevels may invoke multiple entry actions (outermost first) or several exit actions
Table 6-4: Kinds of States
State Kind Description Notation
simple state A state with no substructure
concurrent com-posite state
A state that is divided into two or more concurrent substates, all of which are concurrently active when the composite state is active
sequential com-posite state
A state that contains one or more disjoint substates, exactly one of which is active at one time when the composite state is active
initial state A pseudostate that indicates the starting state when the enclosing state in invoked
final state A special state whose activation indi-cates the enclosing state has com-pleted activity
junction state A pseudostate that chains transition segments into a single run-to-completion transition
history state A pseudostate whose activation restores the previously active state within a composite state
submachine refer-ence state
A state that references a submachine, which is implicitly inserted in place of the submachine reference state
stub state A pseudostate within a submachine reference state that identifies a state in the referenced state machine
H
include S
T
Callothernaviga-tion
It calls another navigation that is defined outsidethe model.
internal act ion[guard condit ion]
internal act ion[guard condit ion]
[Guard condit ion]
State2Page
State2
Pagefalse
t rue
action [guard condit ion]
action [guard condit ion]
Statesset/get
It allows users to store (set) and recover (get) someinformation at their states (e.g. cookies or visitedcontents).
Table 3.1: User’s navigation notation
29

CHAPTER 3. DWEB: MODELING USER’S DYNAMISM ON WEBWORKLOAD CHARACTERIZATION
searcher engine (www.google.com). After that, he waits for a while (timereferred to as the user’s think time) and then the user makes the query.
2. In the bottom of the diagram, the user analyzes the results for a dynamic thinktime, which depends on the number of results, and takes a decision (conditionalrequest):
(1) If the web search engine provides results (path from b1 to b2 ) the useranalyzes them. After that, he can refine the results by making a newquery, refined query in the figure (path from b2 to b1 ), or access the top10 sites provided by using multiple browsers tabs (one for each result).Finally, he finishes the navigation (path from b2 to black dot throughX TH RESULTS.HOME node).
(2) On the contrary, when no results are provided (path from b1 to b3 ), theuser can make a new query, other query in the figure (path from b3 to b1 ),or finish the process (path from b3 to black dot).
Figure 3.1: Google Search navigation pattern
30

3.2. THE USER’S ROLES
3.2 The user’s roles
The DWEB model proposes the concept of user’s roles to fulfill the Challenges II andIII by introducing a second level of dynamism in user’s behavior. This level is relatedto the roles that users play when navigating the Web. The continuous changes ofthese roles defines users’ behaviors.
For instance, assume people at the Import and Export Department in a typicalmultinational company who usually access the Web during their working time. As-sume also that the company has got an intranet (web ERP) which allows web access.Most of the time, workers use Internet for professional purposes (e.g. intranet naviga-tions, suppliers sites navigations, or professional web searches), but sometimes theyuse the web for leisure purposes (e.g. reading the news with Google Reader, perform-ing personal searches, or checking the mail). So we can distinguish between two roleswhen a department member navigates the web: working behavior (professional navi-gations), and leisure behavior (personal navigations). Figure 3.2 defines the workingand leisure behaviors of the example, and the likelihood to change between behaviorsby using balanced arcs (the arc weight is the probability to change from the sourcebehavior to the destination behavior). These behaviors are defined as automatons,where their nodes represent navigations, and their balanced arcs indicate the transi-tions between navigations (the arc weight indicates the probability to take that arc).
Figure 3.2: User’s roles example: working and leisure behaviors
31

CHAPTER 3. DWEB: MODELING USER’S DYNAMISM ON WEBWORKLOAD CHARACTERIZATION
Formally, we define user’s roles R(C,ϕ:CxC→N), where:
• C is the set of navigations; that is, C = {n1,n2 ... ,nk} with ni ε N.
• ϕ:CxC→N. ϕ is the function which provides the next navigation to be executedin terms of probabilities.
3.3 Summary
In this chapter we proposed the Dynamic WEB workload model (DWEB) with theaim of characterizing workload in a more accurate and appropriate way when evalu-ating the performance of current web applications. To this end, DWEB tackles in aprogressive way the three challenges when modeling the user’s behavior on represen-tative workloads (introduced in Chapter 1) by using a couple of new concepts: user’snavigation and user’s roles.
The user’s navigation defines a first level of user’s dynamism by modeling user’sdynamic behavior when interacting with the current Web, and consequently fulfillsthe Challenge I.
On the other hand, the concept of user’s roles satisfies Challenges II and IIIby modeling a second level of dynamism related to the roles that users play whennavigating the Web, and the continuous changes of these roles. Each role is explainedin the terms defined by the navigation concept.
For illustrative purposes, some examples of using DWEB concepts have been pre-sented, and the main visual notation has been described.
A summary of this contribution was published in [WOSP’05, COMCOMJ’09].
32

CHAPTER 4
GUERNICA: a workload generator forcurrent Web
This chapter presents the Universal Generator of Dynamic Workload under WWWPlatforms (GUERNICA), which is a web workload generator and testing tool to eval-uate performance and functionality of web applications. GUERNICA was developedas a result of the cooperation among the Web Architecture Research Group (Universi-tat Politecnica de Valencia), iSOCO S.L, and the Institute of Computer Technology ;thereby, bridging the gap between academia and industry.
The main aim of GUERNICA is its workload generation process, which is based onDWEB model that characterizes web workload modeling user’s behavior as describedin Chapter 3.
The remainder of this chapter is organized as follows. Section 4.1 introduces themain applications of GUERNICA, which permit to carry out performance studiesbased on the five phases detailed in Section 4.2. Next, the software architecture isdescribed in Section 4.3, and the main features are recapitulated in Section 4.4. Forillustrative purposes, Section 4.5 shows an example of web performance evaluationusing the generator. Finally, we draw some concluding remarks in Section 4.6.
4.1 The application suite
GUERNICA is a software made up of three main applications (workload generator,performance evaluator and performance tests planner) as shown in Figure 4.1. Eachapplication, described below, permits an autonomous distribution among differentmachines of the main activities in the evaluation of performance and functional spec-ifications of a web application.
• The performance tests planner manages the testing process. Its main function-alities are: i) to define both performance and functional testing cases, ii) toplan their execution, iii) to monitor on-line results, which are generated by the
33

CHAPTER 4. GUERNICA: A WORKLOAD GENERATOR FOR CURRENTWEB
Figure 4.1: Main applications of GUERNICA
distributed clients, and iv) to elaborate final reports combining the obtainedresults.
• Workload generators reproduce web workload for stressing purposes. They arenot required to be executed in the same machine as the planner, which configuresgenerators and controls the executions. Each generator mimics user’s behaviorand notifies navigation statistics and results to the planner, which performs thecorresponding graphical representation. Alternatively, a generator must stop itsexecution when the planner requires it.
• The performance evaluator, also known as probe client, is aimed at evaluatingthe major functionalities of a given web application while it is stressed by theworkload generators, from the user’s point of view. A probe client also canexecute functional tests notifying their results to the planner.
In addition to these main applications, there are two software extensions thatassist the suite:
• CARENA [NdlOG+05] is a Mozilla plugin that helps GUERNICA to defineusers’ navigations. It captures and reproduces a real sequence of HTTP requests
34

4.2. TESTING PHASES
that a user makes when surfing the Web. GUERNICA provides conversion fromCARENA data format to its own data format.
• SemViz [BCCPB07] is an application to visualize knowledge based on ontologiesby using 3D technology. GUERNICA transforms results of functional tests inan external format based on an ontology that SemViz can read and displaygraphically in a 3D representation.
4.2 Testing phases
GUERNICA permits to carry out a website evaluation of performance and functionalspecifications by following the next five phases (see Figure 4.2).
2 31
4 5
Figure 4.2: Testing phases in GUERNICA
1. The navigation definition phase characterizes the first level of user’s dynamismby modeling his interactions with the dynamic web contents, typical of the cur-rent Web. To this end, GUERNICA adopts the user’s navigation concept ofDWEB, and implements it as a navigational plugin. As mentioned, CARENA
35

CHAPTER 4. GUERNICA: A WORKLOAD GENERATOR FOR CURRENTWEB
helps GUERNICA to define user’s navigations by capturing real HTTP se-quences that are converted, in a second step, to navigational plugins.
2. The performance test definition phase specifies the behaviors that users playin a website using workload tests that implement the user’s roles concept ofDWEB. A workload test specifies a set of navigational plugins that defineuser’s behaviors by considering the capability of changing them with time.
3. The execution configuration phase sets others execution parameters, such asthe number and type of users, the types of reports or the workload distribution.The distribution allows GUERNICA to improve the workload accuracy by dis-persing its generation among different machines. Figure 4.3 shows the threemain workload generation approaches that can be used by the performance testplanner to coordinate the set of secondary workload generation processes.
In the ideal distributed model, the planner, the generators, and the probe clientare located in different machines. This is the best way to evaluate the per-formance of web applications because the probe is in an individual machine;therefore it is influenced neither by other generators nor by the planner.
The advanced distributed model stipulates only three machines to host the plan-ner, the generators and the probe. The main drawback of this approach is thatall generators are in the same machine. In this model, the generated workloadis not as real as in the ideal model because in a real environment different usersare usually in different machines. Even so, this model can be used when thereare not enough machines to perform the evaluation.
In the basic model, the generators, the probe client, and the planner are locatedin the same machine. Thus, if the performance of this machine is not goodenough, the approach will introduce noise in the tests. This model can be usedas a first attempt in the workload generation to identify performance bottlenecksin web applications. Nevertheless, ideal or advanced approaches are requiredfor a more accurate performance evaluation.
4. Tests execution. This phase executes workload tests gathering performance andfunctional statistics. Results collected by generators and probe clients are givento the planner, that groups, classifies and reaches a consensus among them inorder to obtain a uniform set of results.
5. Results analysis. Finally, GUERNICA analyzes the performance of the systemunder test and represents performance indexes in different formats (e.g. graph-ical plots or tabular text). As introduced, SemViz visualizes results by using3D technology.
36

4.2. TESTING PHASES
Figure 4.3: Distribution of workload generation
37

CHAPTER 4. GUERNICA: A WORKLOAD GENERATOR FOR CURRENTWEB
4.3 Architecture
The GUERNICA suite presents a distributed software architecture as depicted in thedeployment diagram (UML 2.1) of Figure 4.4.
Figure 4.4: Architecture of GUERNICA
The three main applications (WorkloadGeneratorApp, PlannerApp and ProbeApp)have been programmed in Java using web services technology, so they run indepen-dently of the execution platform. Their business logics are provided by three interfacesof the core library: WorkloadPlanner, Probe and WorkloadGenerator.
The core is the main component of the architecture and carries out the work-load generation process by using DWEB. Navigational plugins and workload testsare implemented by WorkloadNavigation and WorkloadTest interfaces, respectively.The NavigationEngine defines an API to reproduce the user’s behavior; its con-figuration is described in terms of DWEB, and it is stored in a repository calledWorkloadTestRespository. The engine can operate with any technology fulfilling
38

4.4. MAIN FEATURES
its API, but it currently supports Personal Content Aggregator (PCA) technology toimplement the navigational plugin execution. To this end, the PCANavigation andthe PCANavigationEngine classes have been provided.
The PCA technology, developed by iSOCO, offers: i) a scripting language thatallows GUERNICA to easily define dynamic user’s navigations for the current Web,and ii) an engine to carry out automatic executions for the navigational plugins.
Finally, the util package helps the main library, that can be accessed by usingthe CoreManager in a centralized way.
4.4 Main features
GUERNICA supports, totally or partially, the main features introduced in well-knownworkload generators proposed in the open literature (see Section 2.2.2), as well as thecapability to represent the user’s dynamism, as shown in Table 4.1.
FEATURE/CAPABILITY GUERNICAAnalytical-Based Architecture NDistributed Architecture �Business-Based Architecture NClient Parameterization �Workload Types �Functional Testing NLAN and WAN NMulti-platform �Ease of Use �Performance Reports �Open Source N
User’s Dynamism �
� Full support N Partial support
Table 4.1: GUERNICA features
Regarding the totally supported features, the generator presents a distributedarchitecture based on web services. That is, GUERNICA allows to distribute thegeneration process among different nodes which emulate users working on differentmachines. Furthermore, the generator implements the DWEB model that offers im-portant capabilities. For instance, it provides an analytical approach (user’s roles) tocharacterize users’ dynamic behaviors as well as their continuous changes (ChallengeII and III ). That is, GUERNICA can organize the workload in dynamic categoriesor types, each of them modeling a given user profile by using a workload test. Themodel also introduces some client variables to parameterize the user behavior (e.g.
39

CHAPTER 4. GUERNICA: A WORKLOAD GENERATOR FOR CURRENTWEB
the user’s think time by means of a Gaussian distribution), which are provided byGUERNICA as a part of the scripting language. This language allows the generatorto reproduce users’ dynamic navigations (Challenge I ). Table 4.2 summarizes howGUERNICA technology fulfills the challenges when representing user’s dynamism.
GUERNICAChallenge I Navigational plugins ~Challenge II
Workload tests }Challenge III
} Analytical approach ~ Scripting
Table 4.2: Challenges of user’s dynamism fulfilled by GUERNICA
Among other features supported by GUERNICA, one can observe its ease of use(e.g. CARENA to define user navigation), the ability to generate performance reports(e.g. 3D graphical representation), and the capability to model differences betweenLAN (where generators are usually run) and WAN (where applications are usuallylocated). Moreover, the workload tests can be used as web application functional tests,and the generation process can be easily applied to different business architectures.Finally, it should be noted that a significant part of the code (the applications andthe core packages that do not use PCA technology) has been written under an opensource license.
4.5 Case study
The objective of this case study is not to present a detailed performance evaluationbut to show how GUERNICA can be used in web performance studies.
The case study considers that users can behave as searchers or surfers [CPCP01]when navigating the Web. Searchers are users who start their navigations with aquery in a search engine like Google. On the other hand, surfers prefer to navigatethrough the Web using its direct hyperlinks. With the aim of illustrating these twobehaviors, different navigations looking for some information related with the USpresident election in 2012 are chosen.
Figure 4.5 presents an automaton that defines the surfer and searcher users’ be-haviors, and the continuous changes of behavior when they are looking for someinformation about the candidates. The automaton shows how a typical user can pro-ceed: i) to search the name of a candidate in the searcher engine, or ii) to navigatethrough one of the most important news sites (the CNN website). The automatonstates the same probability (50%) to start a user’s navigation searching in Google thedemocratic candidate name (Obama) or the republican (Romney). Then, the usercan search the other candidate in Google (25%), can browse the CNN website to lookfor some information about the same candidate (50%), or can finish the navigation
40

4.5. CASE STUDY
Figure 4.5: Web searcher and surfer user’s behaviors
(25% of probability). When the user has found the information in the CNN website,he can navigate to the other candidate page in the site (30% of probability), or he canchange his behavior by executing a new search looking for some information aboutthe other candidate (30%). The third alternative is to finish the navigation (40%).
For illustrative purposes, Figure 4.6 specifies the searcher behavior by modeling asimple search in Google. As observed, once the main page of Google (www.google.es)is accessed, the user spends some time thinking (think time - 1000 ms) until heasks Google for some information (www.google.es/search). After that, Googlereturns the results page (SEARCH RESULTS) and a new user’s think time (given bya Gaussian distribution as 3500 ms of average with 1500 ms standard deviation)is provided. Then, the user has two options represented by two branches in thegraph; if the searcher engine provides results for the candidate name (left branch)the user will access the candidate site (first site provided); otherwise, the user willfinish the process (right branch). If the user accesses the candidate home page(www.first result.home), he spends time thinking about the returned contents be-fore finishing the navigation (black dot).
GUERNICA was implemented by using a model language based on XML labelsto define workload tests, navigational plugins and workload distribution. Listing 4.1shows the XML file that implements as a workload test the automaton of Figure 4.5.On the other hand, Listing 4.2 presents the navigational plugin for a simple searchin Google (Figure 4.6). The PCA-Plugin is the XML file that defines, by using thePCA technology, the user’s navigation.
41

CHAPTER 4. GUERNICA: A WORKLOAD GENERATOR FOR CURRENTWEB
page
FIRST_RESULT.HOME
Google.HOME
Google.SEARCH_RESULTS
GET(http://www.google.es)
Figure 4.6: A simple search in Google
Listing 4.1: Workload test
<?xml version="1.0" encoding="UTF -8"?><WorkloadTest id="test_searcher_vs_surfer">
<UsersNumber >2</UsersNumber ><NavigationGraph >
<InitialNavigations ><InitialNavigation id="google_obama" prob="0.50"/><InitialNavigation id="google_romney" prob="0.50"/>
</InitialNavigations ><NavigationTransitions >
<NavigationTransition from="google_obama" to="cnn_obama" prob="0.50"/><NavigationTransition from="google_obama" to="google_romney" prob="0.25"/><NavigationTransition from="google_romney" to="cnn_romney" prob="0.50"/><NavigationTransition from="google_romney" to="google_obama" prob="0.25"/><NavigationTransition from="cnn_obama" to="google_romney" prob="0.30"/><NavigationTransition from="cnn_obama" to="cnn_romney" prob="0.30"/><NavigationTransition from="cnn_romney" to="google_obama" prob="0.30"/><NavigationTransition from="cnn_romney" to="cnn_obama" prob="0.30"/>
</NavigationTransitions ></NavigationGraph >
</WorkloadTest >
42

4.5. CASE STUDY
Listing 4.2: Searching Obama in Google for the US President Election 2012
<?xml version="1.0" encoding="UTF -8"?>
<Navigation id="google_obama"><InputData >
<Param name="phrase" value="Obama"/></InputData ><ExecutionCode >
<PCA -Plugin name="google.pca.xml"/></ExecutionCode ><StatisticsConfiguration >
<StatisticAttribute name="NavigationTime"/><StatisticAttribute name="ExecutionTime"/><StatisticAttribute name="HttpRoute">
<StatisticAttribute name="URL"/><StatisticAttribute name="HttpMethod"/><StatisticAttribute name="Stablished"/><StatisticAttribute name="StablishmentTime"/><StatisticAttribute name="TransferTime"/><StatisticAttribute name="ThinkUserTime"/><StatisticAttribute name="ContentSize"/>
</StatisticAttribute ></StatisticsConfiguration >
</Navigation >
Finally, Listing 4.3 shows the XML file that distributes the workload generationprocess. This file configures GUERNICA in the basic generation approach with onlya workload generator process (generator-1) in a single machine.
Listing 4.3: Workload distribution for the US President Election 2012
<?xml version="1.0" encoding="UTF -8"?><WorkloadPlannerConfiguration >
<PlannerIdentifier >election -2004</PlannerIdentifier ><WorkloadGenerators >
<WorkloadGenerator ><Id>generator -1</Id>
</WorkloadGenerator ></WorkloadGenerators ><WorkloadTestAssignations >
<WorkloadtestAssignation testId="test_searcher_vs_surfer"generatorId="generator -1"/>
</WorkloadTestAssignations ></WorkloadPlannerConfiguration >
Once the workload test has been run, we obtain the plan of conducted navigationsand their HTTP requests, each one having different outcome. Listing 4.4 illustratesan example showing the results of an execution for two users. As observed, a set ofglobal statistics is obtained, such as the total execution time of the experiment orthe navigation time. For each HTTP request, the test execution produces differentstatistics, such as the GET or POST method, the time for establishing the connec-tion, the transfer time, the user think time, the content size, accessed URL, or thesuccessfulness when making the connection (Established).
43

CHAPTER 4. GUERNICA: A WORKLOAD GENERATOR FOR CURRENTWEB
Listing 4.4: Testing results for the US President Election 2012
<?xml version="1.0" encoding="UTF -8"?>
<WorkloadTestStatistics id="..." testId="test_searcher_vs_surfer"<UserNavigations >
<NavigationStatistic navigationId="google_obama" date="..."><NavigationTime >17065 </NavigationTime ><ExecutionTime >18453</ExecutionTime ><HttpRoute >
<HttpRouteElement ><URL>http://www.google.es</URL><HttpMethod >GET</HttpMethod >...
</HttpRouteElement ><HttpRouteElement >
<URL>http://www.google.es/search?q=Obama </URL><HttpMethod >GET</HttpMethod ><Established >true</Established ><EstablishmentTime >116</EstablishmentTime ><TransferTime >1084</TransferTime ><ThinkTime >5622</ThinkTime ><ContentSize >19896</ContentSize >
</HttpRouteElement ><HttpRouteElement >
...<TransferTime >257</TransferTime ><ThinkTime >5000</ThinkTime ><ContentSize >15545</ContentSize >
</HttpRouteElement ></HttpRoute >
</NavigationStatistic >
<NavigationStatistic navigationId="cnn_obama" date="...">...
</NavigationStatistic >
<NavigationStatistic navigationId="google_romney" date="...">...
</NavigationStatistic >
<NavigationStatistic navigationId="cnn_romney" date="...">...
</NavigationStatistic ></UserNavigations ><UserNavigations >
<NavigationStatistic navigationId="google_obama" date="...">...
</NavigationStatistic ></UserNavigations >
</WorkloadTestStatistics >
4.6 Summary
This chapter has presented GUERNICA, a new web workload generator based onDWEB model with the aim of reproducing dynamic users workload in a more accurateand appropriate way than traditional approaches to workload generation.
GUERNICA implements the main DWEB concepts with the aim of adopting themodel: i) the user’s navigation is incorporated with a scripting approach named nav-igational plugin, and the workload test carries out the concept of user’s roles from ananalytical perspective. Furthermore, the generator represents the physical distribu-
44

4.6. SUMMARY
tion of users in the Web by providing a distributed architecture, which permits to setup different approaches (basic, advanced, and ideal) when generating web workload.
Additionally, GUERNICA supports, totally or partially, the main features intro-duced in well-known workload generators proposed in the open literature. These fea-tures work together under a five-phases methodology allowing GUERNICA to carryout performance and functional evaluation of web application in the current Web.
The main results of this chapter were published in [WOSP’05, COMCOMJ’09].Further details about GUERNICA design and features can be found in the context ofthe GENERICA project as a technical reports [GENERICA’04b, GENERICA’04c].Furthermore, more information about CARENA and SemViz can be obtained in[GENERICA’04d, GENERICA’04e].
45


CHAPTER 5
GUERNICA validation: a new testbed forweb performance evaluation
Before widely using GUERNICA in web performance studies, we need to validateit against a traditional approach to workload generation. To this end, we devise anew testbed with the ability of reproducing different types of workloads. After thevalidation process, the testbed will be used to analyze the effect of applying dynamicworkloads on the web performance metrics, instead of traditional workloads. Thischapter introduces the testbed design and describes the validation process.
The new testbed has to accomplish three main goals. First, it must define andreproduce traditional web workloads by using a parameterized and extensible archi-tecture that allows us to integrate the workload generation process of GUERNICA.Second, it must be able to provide client and server metrics with the aim of being usedfor web performance evaluation studies. Finally, it should be representative of webtransactional systems that have been established in recent years, such as e-commercewebsites, blogs or OSNs.
Among the evaluated benchmarks in Section 2.2, TPC-W is the best candidateto provide an appropriate testbed for our purposes, because it satisfies the previousgoals and also considers user’s behavior on workload generation although in a partialway. Consequently, with the aim of validating GUERNICA against the traditionalapproach to workload generation of TPC-W, we deploy a new testbed for web per-formance evaluation by integrating our generator into the benchmark.
The remainder of this chapter is organized as follows. Section 5.1 presents the mainfeatures of the TPC-W implementation that is adopted as a framework of the testbed.After that, in Section 5.2, we show the devised architecture of integrating GUERNICAinto TPC-W. Section 5.3 and Section 5.4 describe the experimental setup and themain measured performance metrics in the validation process, respectively. Thisprocess is discussed in Section 5.5. Finally, we draw some concluding remarks inSection 5.6.
47

CHAPTER 5. GUERNICA VALIDATION: A NEW TESTBED FOR WEBPERFORMANCE EVALUATION
5.1 The TPC-W framework
As mentioned in Section 2.2.1.6, the TPC-W is a transactional web benchmark thatmodels an on-line bookstore environment. The benchmark specification [Tra02b] de-fines a full website map for the on-line bookstore that consists of 14 unique pages andtheir navigation transitions. Figure 5.1 depicts a reduced TPC-W website map, wherepages with related functionality are included in the same group: ordering, shopping,browsing, admin and search. Navigation hyperlinks among them are also indicated.
Page GROUP OFPAGES
ADMIN
Product DetailPage
BROWSING
SHOPPING
SEARCH
ORDERING
Home Page
Figure 5.1: TPC-W reduced website map
The search group provides a book searcher by using the Search page to requestthe query and the Search Results page to show a list of results. The browsing groupembraces the Best-sellers and the New Products pages, which arrange the bookstorecatalog according to the sales and the publication date, respectively. The shoppinggroup is the largest set of pages and provides i) sale functionality by managing theshopping cart (ShoppingCart page), ii) the buy request and its confirmation (BuyRequest page and Buy Confirm page, respectively), and iii) the pay through a securednavigation (Customer Registration page). The ordering group includes a set of pagesthat allows checking the order status (Order Inquiry page and Order Display page).The admin group manages the catalog of books (using Admin Request and ProductUpdated pages). Finally, the most referred pages (Home page and Product Detailpage) are also included. Search and shopping groups implement the most interactive
48

5.2. TESTBED ARCHITECTURE
and personalized functionality in the website, so they are potentially interesting asdynamic user workload.
The benchmark provides a standard environment that is independent of the un-derlying technology, designed architecture and deployed infrastructure. A TPC-WJava implementation developed by the UW-Madison Computer Architecture Group[CRML01] was selected as framework of our testbed. As shown in Figure 5.2, thearchitecture client side is a Java console application that provides two interfaces forworkload generation; an Emulated Browser (EB) and a factory (EBFactory) to cre-ate, configure and manage it. These interfaces allow us to define new processes forworkload generation. The server side was developed as a Java web application madeof a set of Servlets. Each Servlet resolves client requests by looking in the databaseinformation.
Figure 5.2: Main software components of TPC-W Java implementation
5.2 Testbed architecture
The architecture of integrating GUERNICA into TPC-W is organized in three mainlayers as depicted in Figure 5.3 and detailed below.
• The top layer is defined at the client side of TPC-W and supplies the two inter-faces related to the workload generation process (EB, EBFactory), as introducedin Section 5.1.
49

CHAPTER 5. GUERNICA VALIDATION: A NEW TESTBED FOR WEBPERFORMANCE EVALUATION
• The bottom layer is related to the process of workload generation in GUERNICA,detailed in Chapter 4.
• Finally, the intermediate layer defines the integration between GUERNICAand TPC-W. This integration is provided by an independent Java librarynamed TGI. This library implements a new type of EB (DwebEB) that uses theGUERNICA core to reproduce user’s dynamic behavior in the workload genera-tion process. In order to simplify the new EB, a workload generation engine(DwebExecutorEngine) is implemented to carry out the generation process. Abrowser factory (DwebEBFactory) is also developed to manage the creation andconfiguration of the new EB.
Figure 5.3: Testbed architecture
50

5.3. EXPERIMENTAL SETUP
5.3 Experimental setup
The experimental setup used in this dissertation is a typical two-tier configuration con-sisting of an Ubuntu Linux Server back-end tier and an Ubuntu Linux client front-endtier. The back-end runs the on-line bookstore, which core is a Java web application(TPC-W web app) deployed on the Tomcat web application server. Requests to staticcontent, such as images, are served by the Apache web server, which redirects requestsfor dynamic content to Tomcat. TPC-W web app generates the dynamic content byfetching data from the MySQL database. On the other hand, the front-end tier isable to generate the workload either using conventional or dynamic models. Bothweb application and workload generators are run on the SUN Java Runtime Envi-ronment 5.0 (JRE 5.0). Figure 5.4 illustrates the hardware/software platform of theexperimental setup used in this dissertation.
Given the multi-tier configuration of this environment, system parameters (bothin the server and in the workload generators) have been properly tuned to avoidthat middleware and infrastructure bottlenecks interfere in the results. The on-linebookstore has been configured with 300 EBs and a large number of items (100,000books) that forced us to balance accesses in the database (e.g. the pool connectionsize), static content service by Apache (e.g. the number of processes to attend HTTPrequests), or dynamic content service by Tomcat (e.g. the number of threads provid-ing dynamic contents). For each experiment, the measurements were performed forseveral runs with a 20-minute collecting-data phase after a 15-minute warm-up phase.
Figure 5.4: Experimental setup
51

CHAPTER 5. GUERNICA VALIDATION: A NEW TESTBED FOR WEBPERFORMANCE EVALUATION
5.4 Performance metrics
Table 5.1 summarizes the performance metrics available in the experimental setup.The main metrics measured on the client side are the total number of requests per pageand the response time, which is expressed as Web Interaction Response Time (WIRT).On the server side, the platform collects the server performance statistics requiredby the TPC-W specification (CPU and memory utilization, database I/O activity,system I/O activity, and web server statistics) as well as other optional statistics.These metrics allow a better understanding of the system behavior under test andpermit to check the techniques used to improve performance when applying a dynamicworkload. The collected metrics can be classified in two main groups: metrics relatedwith the usage of main hardware resources, and performance metrics for the softwarecomponents of the back-end. For evaluation purposes, we used a middleware namedcollectd [For12] that collects system performance statistics periodically.
5.5 GUERNICA validation
This section validates GUERNICA by using the devised testbed to compare our work-load generation approach against the TPC-W approach. According to the TPC-Wspecification three scenarios are defined when characterizing the web workload: shop-ping, browsing, and ordering. The shopping scenario presents intensive browsing andordering activities while the browsing and ordering scenarios reduce ordering andbrowsing activities, respectively. TPC-W describes these scenarios as three differentfull CBMGs.
Regarding the validation test, we contrast both workload characterization approx-imations (i.e. CBMG and DWEB) for each scenario. Figure 5.5 depicts the shoppingscenario workload as an illustrative example. Note that we are able to model thesame workload by using only the navigation concept of DWEB, and disabling all theparameters used to include user dynamism in the workload characterization. Thevalidation test considers 50 EBs because the Java implementation of the TPC-Wgenerator presents some limitations in the workload generation process. The mea-surements were performed for 50 runs and obtaining confidence intervals with a 99%confidence level.
For illustrative purposes, this section presents results of a subset of the mostsignificative metrics when running TPC-W for the three scenarios defined by CBMGand DWEB.
Figure 5.6 and Figure 5.7 depicts client and server performance metrics for theshopping scenario, respectively.
52

5.5. GUERNICA VALIDATIONReso
urc
eM
etric
Description/Form
ula
Clien
tSid
e
Res
ponse
Tim
e(W
IRT
)
WIR
Tis
defi
ned
by
TP
C-W
ast2−
t1,
wher
et1
isth
eti
me
mea
sure
dat
the
Em
ula
ted
Bro
wse
rsw
hen
the
firs
tbyte
of
the
firs
tH
TT
Pre
ques
tof
the
web
inte
ract
ion
isse
nt
by
the
bro
wse
rto
the
serv
er,andt2
isth
eti
me
when
the
last
byte
of
the
last
HT
TP
resp
onse
that
com
ple
tes
the
web
inte
ract
ion
isre
ceiv
ed.
Aver
age
Res
ponse
Tim
e(W
IRT
)W
IRT
=∑ i∈
PagesW
IRTi∗R
eqi
∑ i∈PagesReq
i
Req
page
Req
ues
tsp
erP
age
(Req
page)
are
the
tota
lnum
ber
of
con-
nec
tions
for
apage
reques
ted
by
Em
ula
ted
Bro
wse
rsand
ac-
cepte
dby
the
serv
er.
ServerSide
CP
UU
CPU
Met
rics
for
hard
ware
reso
urc
esin
clude
uti
liza
tion
for
all
of
them
,and
thro
ughput
for
the
dis
kand
the
net
work
.
Hard
ware
Mem
ory
Um
em
ory
Dis
kU
dis
k,X
dis
k
Net
work
Unet,X
net
Apach
eX
apache,C
PU
apache,M
EM
apache
Per
form
ance
met
rics
for
soft
ware
com
ponen
tsof
serv
erin
-cl
ude:
thei
rth
roughput,
the
CP
Uand
mem
ory
consu
mpti
on,
the
num
ber
of
pro
cess
esor
thre
ads,
etc
Soft
ware
Tom
cat
Xto
mcat,C
PU
tom
cat,M
EM
tom
cat
MySQ
LX
mysql,CPU
mysql,M
EM
mysql
Tab
le5.
1:P
erfo
rman
cem
etri
cscl
assi
fica
tion
acc
ord
ing
toth
eev
alu
ate
dre
sou
rce
53

CHAPTER 5. GUERNICA VALIDATION: A NEW TESTBED FOR WEBPERFORMANCE EVALUATION
ChoicePage GROUP OF
PAGESDynamic behavior
ORDERING
BROWSING
ADMIN
SHOPPING
SEARCH
BuyConfirm Page
BuyRequest PageCustomerRegister Page
ShoppingCart Page
Product Detail Page
Search Results PageSearch Page
HomePage
0.07
13.96
98.65
4.69
1.35
1.43
47.52
1.63
62.5
49.42
0.43
99.57
0.59
99.15
0.85
19.32
12.39
0.94
34.53
6.958.64
74.07
29.73
46.15
86.67
25.86
4.56
26.58
73.15
7.74
66.37
0.10
85.00
6.36
3.08
H*
H*
H*
Have I
book cost
Do I know which
ORDERING
Order Display PageOrder InquiryPage
Home Page
C.1.1C1.2
C2
TTdynamic
BuyConfirm Page
BuyRequest PageCustomerRegister Page
ShoppingCart Page
Search Results PageSearch Page
ChoicePage GROUP OF... Cx referes to Case X of dynamic behavior
ORDERING
BROWSING
ADMIN
SHOPPING
Product Detail Page
SEARCH
HomePage
1 0 0
1 0 01 0 0
1 0 0
1 0 0
100[No]
100[Yes]
[Yes]
100[No]
[No]
13.96
98.65
1.35
4.69
1.43
47.52
1.63
49.42
62.5
0.43
99.57
0.59
99.15
0.85
46.15
74.07
25.860.07
[Yes]
34.53
6.958.64
29.73
12.39
0.9486.67
19.32
73.15
7.744.56
66.37
26.58
0.10
85.00
6.36
3.08
Figure 5.5: CBMG model for shopping scenario in GUERNICA validation
54

5.5. GUERNICA VALIDATION
0
500
1000
1500
2000
2500
3000
3500
4000
Search Results
Search Request
Home
Order Display
Best Sellers
New Products
Admin Request
Customer Regist
Product Detail
Buy Confirm
Admin Confirm
Buy request
Order Inquiry
Shopping Cart
User
Pag
e Re
ques
ts
CBMGDWEB
(a) User page requests
0
200
400
600
800
1000
1200Search Results
Search Request
Home
Order Display
Best Sellers
New Products
Admin Request
Customer Regist
Product Detail
Buy Confirm
Admin Confirm
Buy request
Order Inquiry
Shopping Cart
Average Site
WIR
T (m
s)
101k 104k
CBMGDWEB
(b) WIRT
Figure 5.6: Client metrics obtained for the shopping scenario in GUERNICA valida-tion
55

CHAPTER 5. GUERNICA VALIDATION: A NEW TESTBED FOR WEBPERFORMANCE EVALUATION
0 %
5 %
10 %
15 %
20 %
25 %
30 %
35 %
40 %
45 %
Memory CPU
Util
izat
ion
CBMGDWEB
(a) Server memory and CPU utilization
0 %
0.5 %
1 %
1.5 %
2 %
2.5 %
Incomming Outgoing
Utiliz
atio
n
CBMGDWEB
(b) Server network utilization
Figure 5.7: Server metrics obtained for the shopping scenario in GUERNICA valida-tion
56

5.5. GUERNICA VALIDATION
0
500
1000
1500
2000
2500
Search Results
Search Request
Home
Order Display
Best Sellers
New Products
Admin Request
Customer Regist
Product Detail
Buy Confirm
Admin Confirm
Buy request
Order Inquiry
Shopping Cart
User
Pag
e Re
ques
ts
CBMGDWEB
(a) User page requests
0
500
1000
1500
2000
Search Results
Search Request
Home
Order Display
Best Sellers
New Products
Admin Request
Customer Regist
Product Detail
Buy Confirm
Admin Confirm
Buy request
Order Inquiry
Shopping Cart
Average Site
WIR
T (m
s)
125k 121k
CBMGDWEB
(b) WIRT
Figure 5.8: Client metrics obtained for the browsing scenario in GUERNICA valida-tion
57
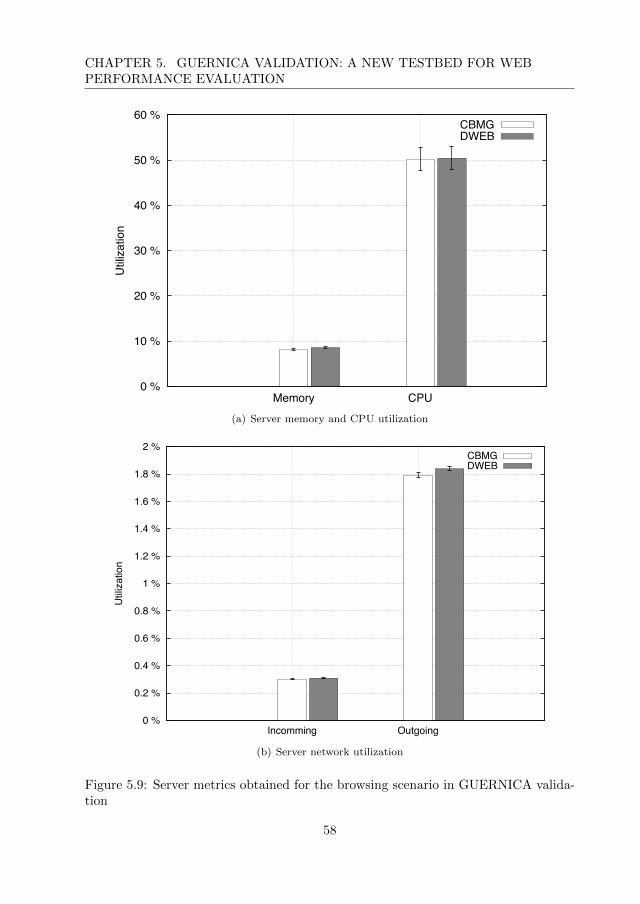
CHAPTER 5. GUERNICA VALIDATION: A NEW TESTBED FOR WEBPERFORMANCE EVALUATION
0 %
10 %
20 %
30 %
40 %
50 %
60 %
Memory CPU
Util
izat
ion
CBMGDWEB
(a) Server memory and CPU utilization
0 %
0.2 %
0.4 %
0.6 %
0.8 %
1 %
1.2 %
1.4 %
1.6 %
1.8 %
2 %
Incomming Outgoing
Utiliz
atio
n
CBMGDWEB
(b) Server network utilization
Figure 5.9: Server metrics obtained for the browsing scenario in GUERNICA valida-tion
58
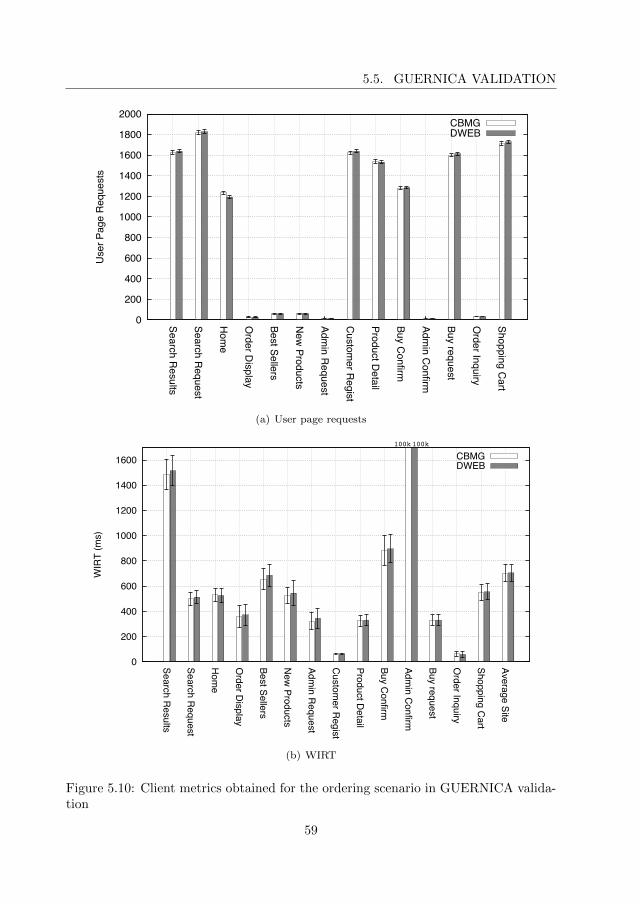
5.5. GUERNICA VALIDATION
0
200
400
600
800
1000
1200
1400
1600
1800
2000
Search Results
Search Request
Home
Order Display
Best Sellers
New Products
Admin Request
Customer Regist
Product Detail
Buy Confirm
Admin Confirm
Buy request
Order Inquiry
Shopping Cart
User
Pag
e Re
ques
ts
CBMGDWEB
(a) User page requests
0
200
400
600
800
1000
1200
1400
1600Search Results
Search Request
Home
Order Display
Best Sellers
New Products
Admin Request
Customer Regist
Product Detail
Buy Confirm
Admin Confirm
Buy request
Order Inquiry
Shopping Cart
Average Site
WIR
T (m
s)
100k 100k
CBMGDWEB
(b) WIRT
Figure 5.10: Client metrics obtained for the ordering scenario in GUERNICA valida-tion
59

CHAPTER 5. GUERNICA VALIDATION: A NEW TESTBED FOR WEBPERFORMANCE EVALUATION
0 %
5 %
10 %
15 %
20 %
25 %
30 %
35 %
40 %
45 %
Memory CPU
Util
izat
ion
CBMGDWEB
(a) Server memory and CPU utilization
0 %
0.2 %
0.4 %
0.6 %
0.8 %
1 %
1.2 %
1.4 %
Incomming Outgoing
Utiliz
atio
n
CBMGDWEB
(b) Server network utilization
Figure 5.11: Server metrics obtained for the ordering scenario in GUERNICA valida-tion
60

5.6. SUMMARY
As shown in Figure 5.6a, both approximations generate a similar number of pagerequests. Figure 5.6b shows that the DWEB response time is, on average, 5% higherthan that of CBMG, because some pages (e.g. Search Results or Buy Confirm) presentvery wide confidence intervals in this scenario. However, this difference does not affectthe server performance metrics since, as observed in Figure 5.7, the highest utilizationis below 40% in both cases. The utilization for CPU and memory is rather low andsimilar in both cases (see Figure 5.7a). Incoming and outgoing traffics do not increasenetwork utilization more than 2% in the studied workloads (see Figure 5.7b). Finally,the disk utilization is lower than 0.2% in both workloads (not shown in the figures).
Browsing scenario results are illustrated in Figure 5.8 and Figure 5.9. Both work-loads generate a similar number of page requests and response time as shown in Figure5.8a and Figure 5.8b, respectively. On the other hand, the server is characterized bya middle level of stress in both cases. CPU utilization is by 50%, while the memory,network and disk utilizations are low, as observed in Figures 5.9a and Figure 5.9b,respectively.
Figure 5.10 and Figure 5.11 depict the results for the ordering scenario. Theformer shows that both workloads present similar levels of client metrics. The latterpresents how the highest server’s utilization is lower than 40% in both cases.
Finally, we can conclude that the DWEB model and GUERNICA can generateaccurate traditional workloads for web performance studies based on TPC-W. More-over, due to their designs, our new testbed can be used to generate web workloadswith user’s dynamic behavior.
5.6 Summary
This chapter has discussed the validation of GUERNICA against a traditional ap-proach to workload generation. With this aim, we have developed a new testbedfor performance evaluation with the ability of generating dynamic user workload byintegrating GUERNICA into TPC-W.
We have validated our approach by contrasting the new testbed main function-alities and behavior against TPC-W, and found that both implementations presentsimilar behavior in traditional web workloads. Moreover, our approach represents amore valuable alternative because DWEB and GUERNICA are able to model andreproduce user’s dynamism on workload characterization in an accurate and appro-priate way, respectively. The devised testbed will help us to prove it.
In [CLEIej’12], a summary of both testbed and validation introduced in this chap-ter was presented.
61


CHAPTER 6
The impact of dynamic user workloads onweb performance
This chapter proves that the web user’s dynamic behavior is a crucial issue that mustbe addressed in web performance studies in order to accurately estimate system per-formance indexes. To this end, using the testbed presented in Chapter 5, we analyzeand measure for the first time, to the best of our knowledge, the effect of consider-ing different levels of dynamic workload on web performance evaluation, instead oftraditional workloads.
Results show that CPU utilization can increase as large as 30% with dynamicuser workloads. These more realistic workloads show that processor utilization isnot uniformly balanced along time, but overloaded peaks rise when considering user’sdynamic behavior. As a consequence, the probability of a long response time is higher,and the number of user’s abandonments can increase (up to 40%).
The remainder of this chapter is organized as follows. Section 6.1 presents thedynamic workloads proposals and how they can be modeled by the approaches understudy. Then, Section 6.2 shows the effect of the different workloads on the web systemperformance. Finally, we draw some concluding remarks in Section 6.3.
6.1 Workload design
This section presents the experimental workloads used in the study. We would liketo emphasize that the aim of this work is not to present a detailed dynamic workloadbased on current user’s behavior, but to explore how typical web performance metricsare affected by introducing different degrees of dynamism.
This study assumes CBMG model to define traditional web workload, and DWEBmodel to introduce different levels of user’s dynamism on workload characterization.First, Section 6.1.1 focuses only on user’s navigation in order to represent dynamismon workload characterization by using the user’s navigation concept. Second, Section
63

CHAPTER 6. THE IMPACT OF DYNAMIC USER WORKLOADS ON WEBPERFORMANCE
6.1.2 introduces a more realistic dynamic workload that also models changes on theuser’s roles by using the user’s roles concept.
6.1.1 Considering dynamism on user’s navigations
In a first step, a dynamic workload (DWEB workload I - DW1) is defined with theaim of introducing user’s dynamic navigations on workload characterization. For thispurpose, we assume a common scenario of e-commerce where the main objective isto avoid the defection of customers. A large percentage of new customers - morethan 60% in some sectors - defect before their third anniversary with an e-commercewebsite [RS00]. Consequently, these websites care deeply about customer retentionand consider loyalty vital to the success of their on-line operations.
For the studied scenario, regarding customer retention in the on-line bookstore, wedefine a loyalty promotion consisting of a general discount only for those customerswho buy at least once a month. The promotion introduces a new behavior with fourcases of dynamism as summarized in Table 6.1.
Case Description
1 If customers do not remember their last order status, they will check them bynavigating into the ordering group of pages.
2Because the customer has to buy at least once a month to keep the discount,a buying session must finish with a payment when he has not bought anythingduring that month.
3 An experienced customer only buys a book when its cost is 25% cheaper than inother markets.
4 The higher the number of provided search results, the longer the time that a usertakes to read and think about them.
Table 6.1: Cases of dynamism in the loyalty promotion behavior
DWEB allows the modeling of these cases of dynamism, which cannot be repre-sented with this level of accuracy using traditional approaches such as CBMG.
Figure 5.5, which was introduced in Chapter 5 as the shopping scenario for the on-line bookstore, depicts the workload described using the traditional approach (CBMGworkload). On the other hand, Figure 6.1 shows the workload characterization usingDWEB (DW1 workload). Both graphs focus on searching and shopping groups of theTPC-W website, and highlight their main pages and transitions.
CBMG workload considers the think time based on the TPC-W specification[Tra02b]. This benchmark defines the user think time (TT) as TT = T2 − T1,where T1 is the time measured at the emulated browser when the last byte of thelast web interaction is received from the server, and T2 is the time measured when
64

6.1. WORKLOAD DESIGN
H*
H*
H*
Have I
book cost
Do I know which
Home Page Order Display PageOrder InquiryPage
ORDERING
C1C2
C3
TTdynamic
BuyConfirm Page
BuyRequest PageCustomerRegister Page
ShoppingCart Page
Search Results PageSearch Page
ChoicePage GROUP OF
PAGESCx referes to Case X of dynamic behavior
ORDERING
BROWSING
ADMIN
SHOPPING
Product Detail Page
SEARCH
HomePage
1 0 01 0 0 1 0 0
1 0 0
100[No]
100[Yes]
[Yes]
100[No]
[No]
13.96
98.65
1.35
4.69
1.43
47.52
1.63
49.42
62.5
0.43
99.57
0.59
99.15
0.85
46.15
74.07
25.860.07
[Yes]
34.53
6.958.64
29.73
12.39
0.9486.67
19.32
73.15
7.744.56
66.37
26.58
0.10
85.00
6.36
3.08
H*
H*
H*
Have I
book cost
Do I know which
Home Page Order Display PageOrder InquiryPage
ORDERING
C1C2
C3
TTdynamic
BuyConfirm Page
BuyRequest PageCustomerRegister Page
ShoppingCart Page
Search Results PageSearch Page
ChoicePage GROUP OF
PAGESCx referes to Case X of dynamic behavior
ORDERING
BROWSING
ADMIN
SHOPPING
Product Detail Page
SEARCH
HomePage
1 0 01 0 0 1 0 0
1 0 0
100[No]
100[Yes]
[Yes]
100[No]
[No]
13.96
98.65
1.35
4.69
1.43
47.52
1.63
49.42
62.5
0.43
99.57
0.59
99.15
0.85
46.15
74.07
25.860.07
[Yes]
34.53
6.958.64
29.73
12.39
0.9486.67
19.32
73.15
7.744.56
66.37
26.58
0.10
85.00
6.36
3.08
Figure 6.1: DWEB workload I - DW1: navigation for loyalty promotion behavior
65

CHAPTER 6. THE IMPACT OF DYNAMIC USER WORKLOADS ON WEBPERFORMANCE
the first byte of the first HTTP request of the next web interaction is sent from theemulated browser to the server. TPC-W considers that each think time must be takenindependently from a negative exponential distribution, with the restriction that theaverage value must be greater than 7 seconds and lower than 8 seconds, as shown inequation (6.1). An important drawback of this approach is that it does not considerthe results of the current search (web contents) on the actual user think time as occursin real navigations.
TTTPC−W = −ln(r) ∗ p , where (0 < r < 1) ∧ (7 ≤ p ≤ 8) (6.1)
In contrast, DWEB allows us to define a dynamic think time (TTdynamic) accordingto the number of items returned by the search as shown in equation 6.2, which is closerto real web activities like the one defined in case 4. DW1 workload is still assumingTT for the less dynamic pages in the website (e.g. the Home page or the ProductDetail page), but it uses TTdynamic in the Search Results page.
TTdynamic = −ln(r) ∗ p , where (0 < r < 1) ∧
(p = 7 +Number of Search Results
Max. Search Results)
(6.2)
The remaining cases of dynamism have been characterized using conditional tran-sitions with DWEB. The transition from the Buy Request to the Buy Confirm pagesdepends on the last customer’s purchase. If the customer did not buy any book duringa given month, he has to commit the buying process, otherwise, he may finish thepurchase or navigate to the Home page according to estimated probabilities of arcsas defined in case 2. Notice that, when a customer does not remember the date ofhis last purchase, he must visit the ordering group in order to find out it, as definedin case 1. Finally, case 3 has been implemented in DW1 workload with a conditionaltransition between the Product Detail and the Shopping Cart pages. This transitiononly allows users to add a book to the shopping cart in case that its cost is 25%cheaper than in other markets.
6.1.2 One step ahead: evolving user’s profile using dynamicroles
A common behavior characteristic of the web users community is the dynamism inthe user’s roles. In other words, the different roles that users adopt and the changesamong them. Chang et al. [CACB97] reported three phases of marketing in an e-commerce website that can induce the mentioned dynamic evolution of web users.These phases are: pre-sales, on-line, and after sales. The pre-sales phase includescompany efforts to attract customers by advertising, public relations, new productsor service announcements, and other related activities such as discounts in some prod-ucts or freebies (e.g. Apple promotions: Back to school and 12 Days of Christmas).Customers’ electronic purchasing activities take place in the on-line sales where orders
66

6.1. WORKLOAD DESIGN
and charges are done through web facilities. The after-sales phase includes customerservice, problem resolution, etc.
In the second scenario, we define a new DWEB workload (DWEB workload II- DW2) that reproduces how user’s behavior evolves from pre-sales to on-line userprofiles. We adopt the loyalty promotion behavior presented above as an example ofon-line user profile, and define a new behavior based on a pre-sales promotion on thestudied on-line bookstore. The pre-sales promotion consists of 1000 bonus to acquirecommon books in a buying session. This promotion should present a different userbehavior with five cases of dynamism as summarized in Table 6.2.
Case Description
1 Books that are best-sellers or new products cannot be added to the shoppingcart because the bonus is only valid for common books.
2 The customer can buy a book only if the cost of the resulting shopping cart islower than the bonus value.
3 A buying session (navigation session) finishes with a payment when the shoppingcart cost is at least 75% of the bonus value.
4 A customer leaves the website when the buying session finishes.
5 The higher the number of provided search results, the longer the time that a usertakes to read and think about them.
Table 6.2: Cases of dynamism in the new pre-sales promotion behavior
Figure 6.2 depicts the DW2 workload. This characterization defines the pre-salespromotion behavior using the DWEB navigation concept (Figure 6.2a). Case 1 andcase 2 have been implemented with a conditional transition between the ProductDetail and the Shopping Cart pages. This transition depends on the user’s state (theavailable user’s bonus) and the user’s navigation path. That is, it only allows users toadd a book to the shopping cart in case that they arrive at the Product Detail pagefrom other pages than the Best-sellers or New Products ones. The transition fromthe Shopping Cart to the Customer Register page depends on the content of the firstpage (case 3 ), and it implies the end of the user navigation when the buying processis committed (case 4 ). We also use the dynamic think time based on the number ofitems returned by the search (case 5 ).
Finally, we combine both promotion behaviors (behaviors for loyalty and pre-salespromotions) as dynamic roles by using the user’s roles concept of DWEB (Figure6.2b). The user’s roles automaton considers that the average response of the pre-salespromotion is 25% of users, based on the suggestions made in [SAP02]. The transitionbetween the pre-sales promotion and the loyalty promotion behaviors models theevolution from a new user to a loyal customer, according to the average percentage of
67

CHAPTER 6. THE IMPACT OF DYNAMIC USER WORKLOADS ON WEBPERFORMANCE
ChoicePage GROUP OF
PAGESDynamic behavior
Is there more money ?
TTdynamic
Do offer condit ions cover the book buying ?
ORDERING
BROWSING
ADMIN
BuyConfirm Page
BuyRequest PageCustomerRegister Page
ShoppingCart Page
Search Results PageSearch Page
SHOPPING
Product Detail Page
SEARCH
HomePage
1 0 0
1 0 0
100[No]
13.96[No]
0.07
85.00
99.57
99.33
62.50
49.42
1.63
0.10
1.43
0.43
4.69
29.73
4.56
66.37
98.6526.58
34.53
8.64 6.95
0.59
7.74
13.96[Yes]
6.36
1.35
3.08
47.52
73.15
1 0 0
(a) Navigation for pre-sales promotion behavior
25%
��75%
��Pre-sales promotion
behavior
60%
��
40% // Loyalty promotionbehavior
60%
��• •
(b) User’s roles: promotion behaviors
Figure 6.2: DWEB workload II - DW2: characterization based on user’s dynamicroles
68

6.2. IMPACT OF THE DYNAMIC WORKLOADS ON WEB SYSTEMPERFORMANCE
customer retention (40%) reported in [RS00], while the arcs arriving to a final staterepresent the users’ defection (60%).
6.2 Impact of the dynamic workloads on web sys-tem performance
Experimental tests have been devised to compare performance metrics obtained withCBMG workload versus those obtained with the studied DWEB workloads (DW1and DW2). With the aim of finding out the stress borderline of the server for eachworkload, we varied the number of EBs ranging from 30 to 75 in 5-user steps. Allthe experiments were done repeating 50 runs to obtain a margin of error with 99%confidence level.
Although experiments measured all the performance metrics listed in Table 5.1,only those present significant differences between traditional and dynamic workloads(e.g. number of requests, response time, CPU utilization and MySQL throughput)are shown in Figure 6.3 and Figure 6.4. Note that, in general, considering user’sdynamism degrades the service conditions more than using traditional workloads,even though dynamic workloads generate a lower number of requests.
The object requests per second generated by CBMG workload is 45% to 60% higherthan the generated by dynamic workloads (see Figure 6.3a). However, the responsetime for DWEB workloads presents exponential curves with more pronounced slopesthan CBMG curve (see Figure 6.3b), for instance, DW2 workload increases the differ-ence with respect to CBMG workload by 10%. On the other hand, the total numberof page requests shows different values depending on the stressing server conditions(see Figure 6.3a). When the server is characterized by a poor stress level (e.g. lessthan 40 browsers), the number of page requests generated by the dynamic workloadsis by 3% higher than the generated by CBMG, because TTdynamic reduces idle timeswhen there are simultaneous requests on a search process. However, CBMG workloadrequests a higher number of pages than DWEB workloads for a significative level ofstress (e.g. more than 40 browsers), because the dynamism produces, in general, morecomplex requests that require extra service time and consequently, reducing servicerate.
Regarding the utilization of the main hardware resources (CPU, memory, networkand disk), only the processor presents significant differences. As expected, the CPUutilization increases with the number of emulated browsers as shown in Figure 6.4a.However, although the workloads present similar CPU utilization for a low numberof browsers, differences between dynamic and traditional workloads can be as largeas 30% when considering dynamism. Notice that a high CPU utilization means thatthe processor acts as the main performance bottleneck.
To better understand why the CPU utilization is so high, we studied how the mainsoftware components use the processor (Apache, Tomcat and MySQL). As observed inTable 6.3, MySQL almost monopolizes the processor since its execution time is more
69

CHAPTER 6. THE IMPACT OF DYNAMIC USER WORKLOADS ON WEBPERFORMANCE
7k
8k
9k
10k
11k
12k
13k
14k
15k
16k
17k
30 35 40 45 50 55 60 65 70 75 20
40
60
80
100
120
140
160To
tal N
umbe
r of P
age
Requ
ests
(TNP
R)
Obj
ect R
eque
sts
per S
econ
d (O
RS)
Emulated browsers
TNPR. CBMGORS. CBMG
TNPR. DW1ORS. DW1
TNPR. DW2ORS. DW2
(a) Requests
0
1
2
3
4
5
6
30 35 40 45 50 55 60 65 70 75
Aver
age
Page
Res
pons
e Ti
me
(s)
Emulated Browsers
DW1DW2
CBMG
(b) Page Response Time
Figure 6.3: Main performance client metrics values
70

6.2. IMPACT OF THE DYNAMIC WORKLOADS ON WEB SYSTEMPERFORMANCE
0 %
20 %
40 %
60 %
80 %
100 %
30 35 40 45 50 55 60 65 70 75
CPU
Util
izat
ion
Emulated Browsers
DW1DW2
CBMG
(a) CPU utilization
6
7
8
9
10
11
12
13
14
30 35 40 45 50 55 60 65 70 75
Exec
uted
que
ries/
s
Emulated Browsers
DW1DW2
CBMG
(b) MySQL throughput
Figure 6.4: Main performance server metrics values
71

CHAPTER 6. THE IMPACT OF DYNAMIC USER WORKLOADS ON WEBPERFORMANCE
EBs Workload Apache Tomcat MySQL
30CBMG 7.71 4.55 886.48DW1 2.64 4.65 972.87DW2 2.61 4.93 1044.66
35CBMG 9.36 5.41 1103.24DW1 3.44 6.47 1390.73DW2 3.25 6.34 1462.59
40CBMG 11.01 6.45 1301.23DW1 3.87 7.51 1612.87DW2 3.86 7.92 1693.67
45CBMG 13.16 8.03 1573.35DW1 4.52 9.05 1862.63DW2 4.67 9.59 2003.51
50CBMG 14.95 9.64 1760.76DW1 5.45 11.52 2486.49DW2 5.32 11.45 2398.61
55CBMG 17.13 11.59 1979.87DW1 6.00 12.95 2703.26DW2 6.04 13.03 2732.06
60CBMG 19.04 12.98 2171.47DW1 6.45 13.82 2868.51DW2 6.55 14.11 2948.50
65CBMG 21.97 15.42 2489.40DW1 6.81 14.97 3043.73DW2 7.00 15.19 3152.04
70CBMG 23.51 16.81 2575.40DW1 6.97 14.99 3190.34DW2 7.28 15.72 3222.43
75CBMG 25.68 18.08 2748.36DW1 7.23 15.33 3246.03DW2 7.32 15.80 3264.57
Table 6.3: CPU consumption (in jiffies) foreach application
than two orders of magnitude higher than the time devoted to Tomcat, specially withdynamic workloads. Figure 6.4b shows the executed queries rate by MySQL for eachworkload. As observed, for a relatively low number of emulated browsers (e.g. 45),this rate is by 15% higher when considering dynamism. But, more than 60 browserscause that the number of executed queries becomes almost constant with dynamicworkloads. That is due to a higher CPU utilization (greater than 80%) as depicted inFigure 6.4a. Consequently, MySQL database is the major candidate to be a softwarebottleneck.
With the aim of evaluating the impact of dynamism on server stress peaks, weanalyze the database usage done by dynamic workloads. Before this study, we need tounderstand how MySQL database works. This database includes qcache as a cache of
72

6.2. IMPACT OF THE DYNAMIC WORKLOADS ON WEB SYSTEMPERFORMANCE
executed queries, where queries result in hit or miss. We also distinguish not cachedqueries as a part of misses that cannot be cached for their dynamic nature or theircomplexity [Ora12]. Listing 6.1 shows a not cached query example at TPC-W website.�SELECT o l i i d FROM orders , o r d e r l i n eWHERE
orde r s . o i d = o r d e r l i n e . o l o i dANDNOT ( o r d e r l i n e . o l i i d = 93234)AND orde r s . o c i d IN (
SELECT o c i d FROM orders , o r d e r l i n eWHERE orde r s . o i d = o r d e r l i n e . o l o i d AND
orde r s . o i d > (SELECTMAX( o i d ) . . . )) . . .� �
Listing 6.1: Not cached queries example at TPC-W website
For a deeper study, we compared the cache status of the executed queries versusCPU utilization for several stress levels. Figure 6.5 shows the values for 35, 55 and75 emulated browsers as examples of poor stress, significative stress, and overloadedsituation at the server side, respectively. DW2 workload (the right column) presentsa higher number of misses than DW1 and CBMG workloads (center and left columns,respectively). CPU overload peaks become larger and larger with the increase of notcached queries, which is caused by the dynamic query nature, specially for the DW2workload that presents higher increase than the DW1 workload. Note that hits arenot represented because their execution time is around one millisecond while the timetaken by misses might be more than eight seconds.
Finally, we present an example illustrating how the system level of stressing causedby user’s dynamism might induce higher probability of user abandonment. Accordingto a Jupiter Research report [Jup06] commissioned by Akamai, web page renderingshould be not longer than four seconds to avoid user abandonment. Figure 6.6 de-picts how dynamic workloads increase the probability that a response takes over fourseconds, specially when considering changes of user’s behaviors in a overloaded sys-tem. Consequently, if the server is not properly tuned, the extra workload inducedby the user’s dynamic behavior can increase the probability of user abandonment (upto 40%).
In summary, results show that considering user’s dynamism when characterizingweb workload affects system performance. Dynamism on workloads characterizationintroduces new patterns of HTTP requests. These patterns, in general, reduce thenumber of requests to objects but increases the number of requests to dynamic webcontent so incurring differences in the system performance metrics, specially on theprocessor usage and the database throughput. As a result, the server performancedegradation affects service conditions, increasing the average response time that in-duces a higher number of user abandonments. Results have also proved that consid-ering user’s dynamic navigations on workload characterization has a higher impact
73

CHAPTER 6. THE IMPACT OF DYNAMIC USER WORKLOADS ON WEBPERFORMANCE
0 2 4 6 8
10
0 100
200 300
400 500
600 700
800 10 %
20 %
30 %
40 %
50 %
60 %
70 %
80 %
90 %
100 %
Average execution time (s)
CPU Utilization
Timeline (s)
CBM
G. EBs = 35
Misses
Not cached
CPU
0 2 4 6 8
10
0 100
200 300
400 500
600 700
800 10 %
20 %
30 %
40 %
50 %
60 %
70 %
80 %
90 %
100 %
Average execution time (s)
CPU Utilization
Timeline (s)
DW
1. EBs = 35
Misses
Not cached
CPU
0 2 4 6 8
10
0 100
200 300
400 500
600 700
800 10 %
20 %
30 %
40 %
50 %
60 %
70 %
80 %
90 %
100 %
Average execution time (s)
CPU Utilization
Timeline (s)
DW
2. EBs = 35
Misses
Not cached
CPU
0 2 4 6 8
10
0 100
200 300
400 500
600 700
800 10 %
20 %
30 %
40 %
50 %
60 %
70 %
80 %
90 %
100 %
Average execution time (s)
CPU Utilization
Timeline (s)
CBM
G. EBs = 55
Misses
Not cached
CPU
0 2 4 6 8
10
0 100
200 300
400 500
600 700
800 10 %
20 %
30 %
40 %
50 %
60 %
70 %
80 %
90 %
100 %
Average execution time (s)
CPU Utilization
Timeline (s)
DW
1. EBs = 55
Misses
Not cached
CPU
0 2 4 6 8
10
0 100
200 300
400 500
600 700
800 10 %
20 %
30 %
40 %
50 %
60 %
70 %
80 %
90 %
100 %
Average execution time (s)
CPU Utilization
Timeline (s)
DW
2. EBs = 55
Misses
Not cached
CPU
0 2 4 6 8
10
0 100
200 300
400 500
600 700
800 10 %
20 %
30 %
40 %
50 %
60 %
70 %
80 %
90 %
100 %
Average execution time (s)
CPU Utilization
Timeline (s)
CBM
G. EBs = 75
Misses
Not cached
CPU
0 2 4 6 8
10
0 100
200 300
400 500
600 700
800 10 %
20 %
30 %
40 %
50 %
60 %
70 %
80 %
90 %
100 %
Average execution time (s)
CPU Utilization
Timeline (s)
DW
1. EBs = 75
Misses
Not cached
CPU
0 2 4 6 8
10
0 100
200 300
400 500
600 700
800 10 %
20 %
30 %
40 %
50 %
60 %
70 %
80 %
90 %
100 %
Average execution time (s)
CPU Utilization
Timeline (s)
DW
2. EBs = 75
Misses
Not cached
CPU
0 2 4 6 8
10
0 100
200 300
400 500
600 700
800 900
1000 1100 10 %
20 %
30 %
40 %
50 %
60 %
70 %
80 %
90 %
100 %
Average execution time (s)
CPU Utilization
Timeline (s)
DW
EB. EBs = 75
Misses
Not cached
CPU
0 2 4 6 8
10
0 100
200 300
400 500
600 700
800 900
1000 1100 10 %
20 %
30 %
40 %
50 %
60 %
70 %
80 %
90 %
100 %
Average execution time (s)
CPU Utilization
Timeline (s)
DW
EB. EBs = 75
Misses
Not cached
CPU
Figu
re6.5:
CP
Uu
tilization
by
qu
eryca
che
statu
s
74
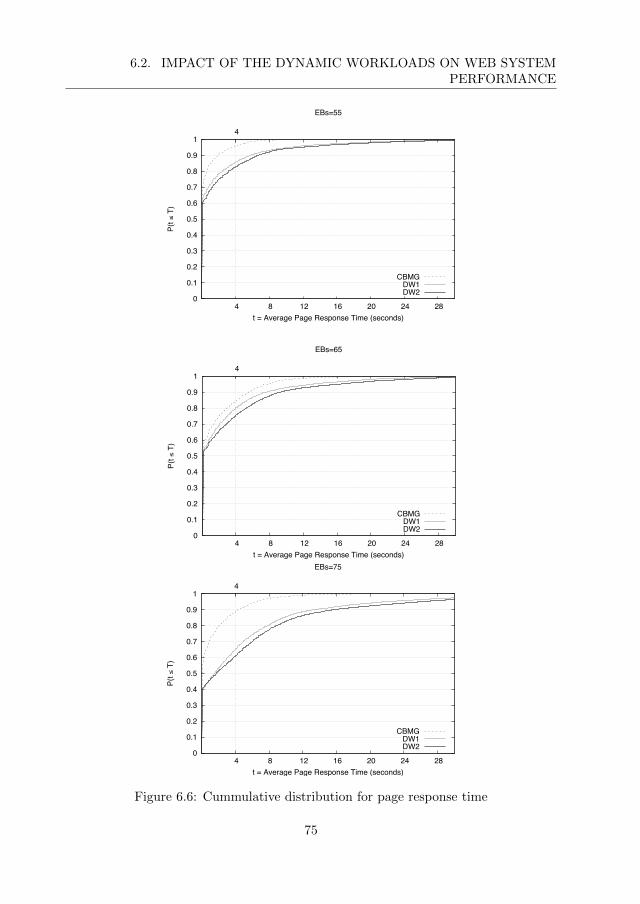
6.2. IMPACT OF THE DYNAMIC WORKLOADS ON WEB SYSTEMPERFORMANCE
0
0.1
0.2
0.3
0.4
0.5
0.6
0.7
0.8
0.9
1
4 8 12 16 20 24 28
4
P(t )
T)
t = Average Page Response Time (seconds)
EBs=55
CBMGDW1DW2
0
0.1
0.2
0.3
0.4
0.5
0.6
0.7
0.8
0.9
1
4 8 12 16 20 24 28
4
P(t )
T)
t = Average Page Response Time (seconds)
EBs=65
CBMGDW1DW2
0
0.1
0.2
0.3
0.4
0.5
0.6
0.7
0.8
0.9
1
4 8 12 16 20 24 28
4
P(t )
T)
t = Average Page Response Time (seconds)
EBs=75
CBMGDW1DW2
Figure 6.6: Cummulative distribution for page response time
75

CHAPTER 6. THE IMPACT OF DYNAMIC USER WORKLOADS ON WEBPERFORMANCE
on the system performance metrics than modeling changes in user’s roles because thedynamism is more present in navigations than in user’s role changes.
6.3 Summary
This chapter has explored the effects of using dynamic user workload on web perfor-mance evaluation studies. The obtained results have been compared against thosegenerated with traditional workloads. To this end, a scenario based on a typicale-commerce website has been recreated and different user’s dynamic behaviors havebeen reproduced. We have used DWEB model to define the dynamic workloads be-cause it permits easily to model these behaviors, which cannot be represented withthis level of accuracy with traditional approaches, such as the CBMG model. Further-more, DWEB allowed us to define the workloads considering not only the dynamismin user’s interaction but also the dynamic changes in the role when navigating thewebsite. With the aim of evaluating the effect of these levels of dynamism on thesystem performance, a large and representative set of the most commonly used per-formance metrics has been measured for each experiment, such as client metrics (totalnumber of page requests or response time), server hardware metrics (CPU utilization),or metrics for the main software components at the server (executed queries rate).
Experimental results have shown that dynamic workloads affect the stress border-line on the server, which is more degraded than when using traditional workloads inthe studied cases. The object requests rate has decreased between 45% and 60%, butdynamic workloads have also changed the request nature, which has become moredynamic. This change has implied an important growth by 15% in the number ofexecuted queries by the database with a significant increase in their dynamic naturethat led the database to be an overloaded application. Consequently, the CPU uti-lization increased by 30% and consolidates the processor as the main performancebottleneck. The server performance degradation affects the service conditions in-creasing the average response time exponentially, which yield to higher probability ofuser abandonment (up to 40%). Furthermore, we observed that considering user’s dy-namic navigations on workload characterization has a stronger impact on the systemperformance metrics than modeling changes in the role, because dynamism is morepresent in navigations than in user’s roles.
In [IEEE-NCA’12, COMCOMJ’13], a summary of the study introduced in thischapter was presented.
76

CHAPTER 7
The impact of User-Browser Interaction onweb performance
This chapter analyzes and measures the effect of considering the User-Browser Inter-action (UBI) as a part of user’s dynamic behavior on web workload characterization inperformance studies. To this end, we evaluate a typical e-commerce scenario by usingthe testbed presented in Chapter 5, and compare the obtained results for differentbehaviors that take user’s interaction with browser interface facilities into account,such as the use of the back button and parallel browsing originated by browser tabsor opening new windows when surfing a website.
Experimental results show that these interaction patterns allow users to achievetheir navigation objectives sooner than when browsing in a sequential way, so in-creasing their productivity up to 200% when surfing the website. In addition, resultsprove that when this type of behaviors is taken into account, performance indexescan widely differ and relax the stress borderline of the server. For instance, the serverutilization drops as much as 45% due to parallel browsing behavior permitting thesystem either to devote more resources to other applications or to serve more users.
The remainder of this chapter is organized as follows. Section 7.1 presents theworkloads considering UBI when modeling user’s behavior. Section 7.2 shows theeffect of the proposed workloads on the web system performance. Finally, we drawsome concluding remarks in Section 7.3.
7.1 Workload design
This work uses DWEB to introduce different levels of user’s dynamism on work-load characterization, especifically dynamism related to the interaction with the webbrowser. Section 7.1.1 focuses on user’s goals when surfing a website and defines user’snavigations according to this end. After that, a more realistic dynamic workload isdefined considering rapid return to recently visited pages by using the history-back
77

CHAPTER 7. THE IMPACT OF USER-BROWSER INTERACTION ON WEBPERFORMANCE
button on web browsers. Section 7.1.2 introduces parallel tab browsing behavior onworkload characterization.
7.1.1 The back button: rapid return to recently visited pages
Web browsers includes a stack-based model for web page navigation [CMJ02]. In thismodel, there are two traditional ways of displaying pages in the browser: load andreload. Pages are loaded when the user clicks on a link, types a URL or selects afavorite page. The effect of load is to add the page to the top of the visited pagesstack. Pages are reloaded with the back and forward buttons, and the effect is to alterthe position within the stack. Each back click shows the next page down the stackuntil the stack bottom is reached. Forward clicks shows pages up the stack until thestack top is reached.
An important factor of the back button success is the chance of rapid return torecently visited pages [CG00], which can avoid new HTTP requests and consequentlychanges the causes of the stressing conditions of a given website. However, onlycertain visited pages can be cached by a web browser with the aim of going backusing the back button. That is, some web contents such as audio or video streaming,dynamic contents or web forms are not cached according to their HTTP headers. Forthese types of contents the back button does not have any effect because pages arecompletely reloaded.
With the purpose of measuring the effect of UBI in web performance evaluation wecompare different dynamic workloads. In a first step, a workload (LOY) conductedby user’s goals is defined. To this end, we extend the loyalty promotion behaviorpresented in Section 6.1.1 by adding a new case of dynamism to establish that a userleaves the website when his goals are satisfied. The new behavior is characterized byfive cases of dynamism as summarized in Table 7.1.
Secondly, a new DWEB workload (LOYB) is defined by extending the LOY work-load with an extra case of dynamism that characterizes the use of the back button onweb browser (see Table 7.1).
Figure 7.1 and Figure 7.2 show the workloads generated using DWEB for the loy-alty promotion behavior conducted by goals (LOY) and its extended version (LOYB)considering the back button, respectively. Both workloads assume TT (see equation6.1) as think time for the less dynamic pages in the website (e.g. the Home pageor the Product Detail page), and TTdynamic (see equation 6.2) in the Search Resultpage, that is closer to real web activities like that defined in case 4 listed in Table7.1.
The remaining cases of dynamism have been characterized using conditional tran-sitions with DWEB. The transition from the Buy Request page to the Buy Confirmpage depends on the last customer’s purchase. If the customer does not buy any bookduring a given month, he has to commit the buying process, which means the end ofthe navigation session (case 5 ). Otherwise, he may finish the purchase or navigate tothe Home page according to estimated probabilities of arcs as defined in case 2 and
78

7.1. WORKLOAD DESIGN
Case Description
1 If customers do not remember their last order status, they will check them bynavigating into the ordering group of pages.
2Because the customer has to buy at least once a month to keep the discount,a buying session must finish with a payment when he has not bought anythingduring that month.
3 A experienced customer only buys a book when its cost is 25% cheaper than inother markets.
4 The higher the number of provided search results, the longer the time that a usertakes to read and think about them.
5 A customer leaves the website when the buying session finishes because his goalshave been satisfied.
Extra case in the extended behavior
6A customer can return to recently visited listings of books (browsing listings orsearch results) without repeating a request to the web server through the backbutton.
Table 7.1: Cases of dynamism in the loyalty promotion behaviors conducted by goals
shown in both figures. Notice that when a customer does not remember the date ofhis last purchase, he must visit the ordering group in order to find out it, as definedin case 1. Case 3 has been implemented with a conditional transition between theProduct Detail and the Shopping Cart pages. This transition represents users addinga book to the shopping cart because its cost is 25% cheaper than in other markets.Finally, the back button has been characterized in LOYB workload as a cache thatonly stores the immediately previous listing page (case 6 ).
7.1.2 Optimizing user productivity: the parallel tab browsingbehavior
Parallel browsing describes a behavior where users visit web pages in multiple con-current threads by using web browsers tabs or windows. To help the understandingof how parallel browsing works, Figure 7.3 illustrates a parallel tab browsing sessionapplied to the on-line bookstore. It shows how a web user uses parallel browsingbased on three web browser tabs to improve his navigation time avoiding searches ofbooks. The user begins a navigation session in a window with the aim of buying abook that fulfills several requirements as soon as possible. After he visits some pages,a search result is provided. At this point of time, he starts a parallel tab browsing
79

CHAPTER 7. THE IMPACT OF USER-BROWSER INTERACTION ON WEBPERFORMANCE
H*
H*
H*
Have I
book cost
Do I know which
Order Display PageOrder InquiryPage
C1C2
TTdynamic
BuyConfirm Page
BuyRequest PageCustomerRegister Page
ShoppingCart Page
C3
Search Results PageSearch Page
Home Page
ORDERING
ChoicePage GROUP OF... Cx referes to Case X of dynamic behavior
ORDERING
BROWSING
ADMIN
SHOPPING
Product Detail Page
SEARCH
HomePage
100
1 0 01 0 0 1 0 0
1 0 0
100[No]
[No]
[Yes]
13.96
98.65
1.35
4.69
1.43
47.52
1.63
49.42
62.5
0.43
99.57
0.59
34.53
86.67
100[Yes]
12.39
0.94
25.86
[Yes]
100[No]
74.07
0.07
6.958.64
29.73
46.15
19.32
73.15
7.744.56
66.37
26.58
0.10
85.00
6.36
3.08
Figure 7.1: LOY workload: loyalty promotion behaviors conducted by goals
80

7.1. WORKLOAD DESIGN
H*
H*
Have I
book cost
Do I know which
H*Choice
Page GROUP OFPAGES
Cx referes to Case X of dynamic behavior
Get previous page
Cache previous page
Order Display Page
C1C2
TTdynamic
Order InquiryPage
BuyConfirm Page
BuyRequest PageCustomerRegister Page
ShoppingCart Page
C3
Search Results PageSearch Page
Home Page
ORDERING
ORDERING
BROWSING
ADMIN
SHOPPING
Product Detail Page
SEARCH
HomePage
[Yes]
[No]
100
1 0 01 0 01 0 0
1 0 0
100[No]
13.96
98.65
1.35
4.69
49.42
47.52
1.43
1.63
62.5
0.43
99.57 0.59[No browser tab]
100[Yes]
[Yes]
100[No]
0.9486.67
12.39
25.86
46.15
19.32
74.0734.53
0.07
8.64
29.73
6.95
73.15[No browser tab]
7.74[No browser tab]
66.37
4.56[No browser tab]
26.58
0.10
85.00
6.36
3.08
Figure 7.2: LOYB workload: LOY workload considering the back button
81

CHAPTER 7. THE IMPACT OF USER-BROWSER INTERACTION ON WEBPERFORMANCE
Browser Tab 4
Browser Tab 3
Browser Tab 2
WebsiteBrowser Tab 1User
Think Time-6
http://server/ADD_TO_BASKET/2 GET Shopping Cart Page?ID=2
close
Think Time-5
closeThink Time-4
GET Product Detail Page?ID=3
open
GET Product Detail Page?ID=2
open
http://server/PRODUCT_DETAIL/3
http://server/PRODUCT_DETAIL/2
GET Product Detail Page?ID=1
http://server/PRODUCT_DETAIL/1
[PARALLEL NAVIGATION]
open
Think Time-3
GET Search Results Page?query=----http://server/SEARCH/submit
Think Time-2
GET Search Request Pagehttp://server/SEARCHThink Time-1
GET Home Pagehttp://server/HOME
Figure 7.3: Example of parallel tab browsing session
behavior by opening three new tabs with the detail of three different books selectedfrom the results. Then, he takes some time calculated according to equation 6.1,such as Think Time 4 or Think Time 5 (see Figure 7.3), to evaluate the content ofeach tab until he finds a book satisfying his requirements. When a book does notfulfill the requirements, the user closes its associated tab and switches to the nextone. Otherwise he discards the rest of tabs and adds the book to the shopping cart,
82
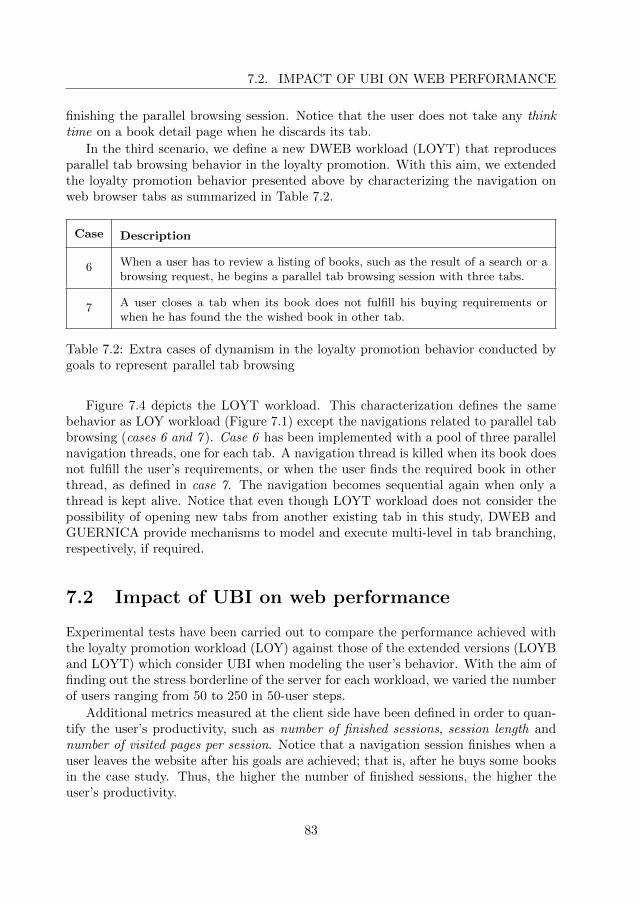
7.2. IMPACT OF UBI ON WEB PERFORMANCE
finishing the parallel browsing session. Notice that the user does not take any thinktime on a book detail page when he discards its tab.
In the third scenario, we define a new DWEB workload (LOYT) that reproducesparallel tab browsing behavior in the loyalty promotion. With this aim, we extendedthe loyalty promotion behavior presented above by characterizing the navigation onweb browser tabs as summarized in Table 7.2.
Case Description
6 When a user has to review a listing of books, such as the result of a search or abrowsing request, he begins a parallel tab browsing session with three tabs.
7 A user closes a tab when its book does not fulfill his buying requirements orwhen he has found the the wished book in other tab.
Table 7.2: Extra cases of dynamism in the loyalty promotion behavior conducted bygoals to represent parallel tab browsing
Figure 7.4 depicts the LOYT workload. This characterization defines the samebehavior as LOY workload (Figure 7.1) except the navigations related to parallel tabbrowsing (cases 6 and 7 ). Case 6 has been implemented with a pool of three parallelnavigation threads, one for each tab. A navigation thread is killed when its book doesnot fulfill the user’s requirements, or when the user finds the required book in otherthread, as defined in case 7. The navigation becomes sequential again when only athread is kept alive. Notice that even though LOYT workload does not consider thepossibility of opening new tabs from another existing tab in this study, DWEB andGUERNICA provide mechanisms to model and execute multi-level in tab branching,respectively, if required.
7.2 Impact of UBI on web performance
Experimental tests have been carried out to compare the performance achieved withthe loyalty promotion workload (LOY) against those of the extended versions (LOYBand LOYT) which consider UBI when modeling the user’s behavior. With the aim offinding out the stress borderline of the server for each workload, we varied the numberof users ranging from 50 to 250 in 50-user steps.
Additional metrics measured at the client side have been defined in order to quan-tify the user’s productivity, such as number of finished sessions, session length andnumber of visited pages per session. Notice that a navigation session finishes when auser leaves the website after his goals are achieved; that is, after he buys some booksin the case study. Thus, the higher the number of finished sessions, the higher theuser’s productivity.
83

CHAPTER 7. THE IMPACT OF USER-BROWSER INTERACTION ON WEBPERFORMANCE
H*
H*
H*
Have I
book cost
Do I know which
Order Display Page
C1C2
TTdynamic
Order InquiryPage
BuyConfirm Page
BuyRequest PageCustomerRegister Page
ShoppingCart Page
C3
Search Results PageSearch Page
Select the bookand close tabs
Home Page
ORDERING
ChoicePage GROUP OFPAGES
Cx referes to Case X of dynamic behavior
ORDERING
BROWSING
ADMIN
SHOPPING
Product Detail Page
SEARCH
HomePage
BrowserTabs
Navigation
66.37{1..3} {1..3}
49.42
4.56[No browser tab]
46.15
12.39[Yes]
100[No]
1.43
29.73
6.95
19.32
1 0 0
62.5
3.08
1.63
26.58
6.36
100[No]
34.53
8.64
4.69
100
99.57
25.86
[Yes]
[No]
[No]
73.15[No browser tab]
[No]
47.52
[Yes]
[Yes]
100[Yes]
0.9486.67
0.59[No browser tab]
1 0 0 1 0 01 0 0
0.43
74.07
7.74[No browser tab]
1.35
98.65 0.10
85.00
13.96
0.07
Figure 7.4: LOYT workload: parallel tab browsing behavior in LOY workload
84

7.2. IMPACT OF UBI ON WEB PERFORMANCE
Although we measured all the performance metrics listed in Table 5.1, only thoseshowing significant differences in the studied workloads are discussed below.
Figure 7.5 shows how the user’s productivity (measured in number of finished ses-sions) increases when considering UBI on workload characterization, specially when aparallel browsing behavior is introduced, because both the session length (in seconds)and the number of visited pages per session are lower in these workloads (see Table 7.3considering 100 simultaneous users as example). Therefore, user’s productivity is im-proved when the user changes his navigation patterns as a result of parallel browsingbehavior (up to 200%) or using the back button (up to 100%).
0
100
200
300
400
500
600
50 100 150 200 250
Num
ber o
f Fin
ished
Ses
sions
Users
LOYLOYBLOYT
Figure 7.5: User’s productivity evolution
Metric LOY LOYB LOYT
Number of finished sessions 177.530 348.180 526.380
Session length (sec) 598.024 230.032 132.839
Number of visited pages per session 78.909 26.146 18.814
Table 7.3: Mean user productivity considering 100 simultaneous users in the system
In general, the extended workloads also increase the server throughput, despiteof the LOY workload degrades the service conditions more than considering the in-teractive behaviors as depicted in Figure 7.6. Considering a significative number ofsimultaneous users (e.g. from 100 users on), the total served pages is on average by25% and 90% higher for the extended workloads (Figure 7.6). To identify the causes
85

CHAPTER 7. THE IMPACT OF USER-BROWSER INTERACTION ON WEBPERFORMANCE
12k
14k
16k
18k
20k
22k
24k
26k
28k
30k
50 100 150 200 250
Mea
n Se
rved
Pag
es
Users
LOYBLOYT
LOY
Figure 7.6: Total served pages
of this high increase, served pages are classified in three main types: search resultspage, product detail page and others. As observed in Figure 7.7, the interactive behav-iors generate less requests to the search engine (Figure 7.7a) and increase the numberof requests to the product detail page (Figure 7.7b) and to the others (Figure 7.7c),especially for the LOYT workload. This new pattern of HTTP requests reduces thecomplexity of database queries when decreasing searches, so the throughput of theweb server increases as shown in Figure 7.8. Specifically, the Apache HTTP requestsper second generated by LOY workload is by 25% and 75% lower than those generatedby the LOYB and the LOYT workloads, respectively.
Figure 7.9 shows the CPU utilization, which is the only element that presentssignificant differences among the main hardware resources. Stress conditions havebeen classified in three levels according to the CPU utilization values: low stress(UCPU < 50%), significant stress (50% ≤ UCPU ≤ 80%), and high stress - here byoverload at server - (UCPU > 80%). As can be seen, the processor utilization forthe extended workloads is always lower than for the LOY workload. For instance,considering 100 users, the utilization decreases by 15% and 45% for the LOYB andthe LOYT workloads, respectively. Notice that the high CPU utilization value denotesthat the processor acts as the main performance bottleneck but the stress borderlinemoves from 100 users for the LOY workload to 150 and 200 users for the LOYB andthe LOYT workloads, respectively. This means that the web server allows the systemto serve about 50% and 100% more users for the LOYB and the LOYT workloads.
86

7.2. IMPACT OF UBI ON WEB PERFORMANCE
1k
1.2k
1.4k
1.6k
1.8k
2k
2.2k
2.4k
2.6k
50 100 150 200 250
Mea
n Se
rved
Pag
es
Users
LOYBLOYT
LOY
(a) Search results page
1k
2k
3k
4k
5k
6k
7k
8k
9k
50 100 150 200 250
Mea
n Se
rved
Pag
es
Users
LOYBLOYT
LOY
(b) Product detail page
8k
9k
10k
11k
12k
13k
14k
15k
16k
17k
18k
19k
50 100 150 200 250
Mea
n Se
rved
Pag
es
Users
LOYBLOYT
LOY
(c) Others
Figure 7.7: Mean served pages by type
87

CHAPTER 7. THE IMPACT OF USER-BROWSER INTERACTION ON WEBPERFORMANCE
60
70
80
90
100
110
120
130
50 100 150 200 250
Apac
he H
TTP
Requ
ests
/s
Users
LOYBLOYT
LOY
Figure 7.8: Apache throughput
0 %
10 %
20 %
30 %
40 %
50 %
60 %
70 %
80 %
90 %
100 %
50 100 150 200 250
CPU
Utiliz
atio
n
Users
LOYBLOYT
LOY
Figure 7.9: CPU utilization
88

7.2. IMPACT OF UBI ON WEB PERFORMANCE
To better understand why the CPU utilization decreases, we studied how the mainsoftware components (Apache, Tomcat and MySQL) make use of the processor. Asobserved in Table 7.4, MySQL almost monopolizes the processor for the differentworkloads since its execution time is more than two orders of magnitude higher thanthe time devoted to Tomcat and Apache. Consequently, MySQL database is the majorcandidate to be a software bottleneck. However, despite of the executed queries ratefor the extended workloads can be as large as 30% and 93% higher than for theLOY workload (Figure 7.10), the CPU time consumed by MySQL for the extendedworkloads is by 30% and 55% lower than for the LOY workload. Moreover, the CPUconsumption of Tomcat and Apache increases for the extended workloads. That is,there is a change in the patterns of HTTP requests and consequently in the type ofexecuted queries at MySQL.
(a) LOYXXXXXXXXXSoft.
Users50 100 150 200 250
MySQL 1315 2883 2807 2768 2897
Tomcat 10 22 22 23 23
Apache 4 9 10 10 10
(b) LOYBXXXXXXXXXSoft.
Users50 100 150 200 250
MySQL 931 2439 2606 2540 2624
Tomcat 9 24 26 27 28
Apache 3 9 11 12 13
(c) LOYTXXXXXXXXXSoft.
Users50 100 150 200 250
MySQL 567 1808 2381 2434 2424
Tomcat 8 27 33 34 34
Apache 3 10 15 17 18
Table 7.4: CPU consumption (in jiffies) for each application
We performed a deeper study to provide a sound understanding about how thedatabase is used by these workloads. As introduced in Chapter 6, MySQL databaseincludes qcache[Ora12] as a cache of executed queries, where a query results in a hitor miss. Figure 7.11 shows the mean execution time for hits, misses and total queriesconsidering 50, 100 and 250 simultaneous users in the system as examples of the dif-ferent stress conditions: low stress (Figure 7.11a), significant stress (Figure 7.11b)and overload at server (Figure 7.11c). As observed, the mean execution time for aquery when considering the extended workloads is always lower than for LOY work-
89
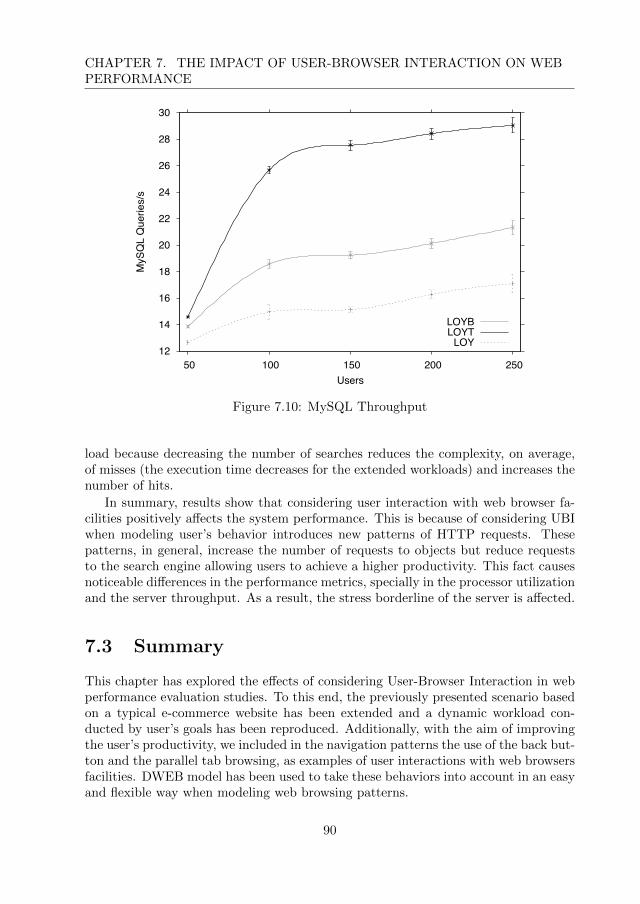
CHAPTER 7. THE IMPACT OF USER-BROWSER INTERACTION ON WEBPERFORMANCE
12
14
16
18
20
22
24
26
28
30
50 100 150 200 250
MyS
QL
Que
ries/
s
Users
LOYBLOYT
LOY
Figure 7.10: MySQL Throughput
load because decreasing the number of searches reduces the complexity, on average,of misses (the execution time decreases for the extended workloads) and increases thenumber of hits.
In summary, results show that considering user interaction with web browser fa-cilities positively affects the system performance. This is because of considering UBIwhen modeling user’s behavior introduces new patterns of HTTP requests. Thesepatterns, in general, increase the number of requests to objects but reduce requeststo the search engine allowing users to achieve a higher productivity. This fact causesnoticeable differences in the performance metrics, specially in the processor utilizationand the server throughput. As a result, the stress borderline of the server is affected.
7.3 Summary
This chapter has explored the effects of considering User-Browser Interaction in webperformance evaluation studies. To this end, the previously presented scenario basedon a typical e-commerce website has been extended and a dynamic workload con-ducted by user’s goals has been reproduced. Additionally, with the aim of improvingthe user’s productivity, we included in the navigation patterns the use of the back but-ton and the parallel tab browsing, as examples of user interactions with web browsersfacilities. DWEB model has been used to take these behaviors into account in an easyand flexible way when modeling web browsing patterns.
90

7.3. SUMMARY
0k
2k
4k
6k
8k
10k
TOTAL HITS MISSES
Mea
n Ex
ecut
ion
Que
ry T
ime
(ms)
50 Users
190 136 660.55 0.49 0.49
283kLOY
LOYBLOYT
(a) Low stress conditions
0k
2k
4k
6k
8k
10k
TOTAL HITS MISSES
Mea
n Ex
ecut
ion
Que
ry T
ime
(ms)
100 Users
0.70 0.60 0.55
229kLOY
LOYBLOYT
(b) Significative stress conditions
0k
2k
4k
6k
8k
10k
TOTAL HITS MISSES
Mea
n Ex
ecut
ion
Que
ry T
ime
(ms)
250 Users
0.78 0.71 0.68
385kLOY
LOYBLOYT
(c) Overload at server
Figure 7.11: Execution time per query type
91

CHAPTER 7. THE IMPACT OF USER-BROWSER INTERACTION ON WEBPERFORMANCE
The study has considered a wide set of traditional performance metrics measuredboth at client side and server side. In addition, new metrics have been defined in orderto quantify the productivity in the web navigations from the user point of view, suchas number of finished session, number of visited pages per session or session length.
This study proved that navigations using the back button or opening new tabs,which result from considering a user dynamic interaction with the provided contents,clearly allow users to achieve their goals in less time, so increasing their navigationproductivity. These browsing patterns also affect the utilization and the throughputof the main system resources, and consequently the stress borderline on the server.Experimental results have shown that parallel tab browsing behavior noticeably in-creases the user’s productivity (measured in number of finished sessions) up to 200%with respect to browsing the website in a sequential way. The new navigation patternsalso increase the number of served pages (up to 90%). Nevertheless, they generateless requests to the search engine so reducing the complexity of the executed databasequeries and decreasing their execution time. This means an important drop in theprocessor utilization (up to 45%) and a noticeable rise in the web server throughput(up to 75%). As a consequence, the stress borderline is relaxed permitting the systemeither to support more applications or serve more users.
In [SAC’13], a summary of the study introduced in this chapter will be presented.
92

CHAPTER 8
Conclusions and open research lines
This chapter presents the main conclusions of this dissertation, summarizes the con-tributions and lists the publications in international and national journals and con-ferences related to this work. Possible research lines that are opened by this studyare also drawn.
8.1 Conclusions
The current Web introduces a new paradigm where users become contributors to thedynamic contents and services offered. As a result, the behavior of users and theirinteraction patterns have evolved and are currently more active and dynamic. Con-sequently, web performance studies should take this new user behavior into accountin the workload models to guarantee the validity of the results. According to theopen literature three different problems must be addressed when modeling the user’sbehavior on web workload characterization: i) the dynamic behaviors of users [BC98],ii) the different roles that they can play when surfing the Web [WOHM06], and iii)the continuous changes among these roles [GBGP10].
This thesis has analyzed the current state of the art in modeling and generatingworkloads for web performance evaluation, focusing on the capability to fulfill thethree open problems before mentioned. The lack of appropriate models and softwareapplications motivated us to propose a more accurate workload model (first thesiscontribution) and to develop a new workload generator (second thesis contribution),based on this model, with the aim of analyzing the effect of using dynamic work-loads on web performance evaluation, instead of traditional workloads (third thesiscontribution).
The proposed model, named DWEB, characterizes web workload in a more accu-rate and appropriate way by using a couple of concepts: user’s navigation and user’sroles. Both concepts tackle in a progressive way the implicit dynamism in user’sinteraction and user’s roles, respectively, when navigating the Web.
93
CHAPTER 8. CONCLUSIONS AND OPEN RESEARCH LINES
Once this model was defined, the GUERNICA web workload generator was devel-oped in order to reproduce more realistic workload mimicking the behavior of the realweb users community. GUERNICA implements the two concepts of DWEB with theaim of adopting the model, and represents the physical distribution of users in theWeb, which improves the workload accuracy by providing a distributed architecture.
Finally, we analyzed and measured the effect of using representative dynamicworkloads on the web performance metrics. To this end, we previously validatedGUERNICA in a new testbed for web performance studies. This testbed integratesour generator with the TPC-W benchmark in order to contrast performance metricsfor traditional and dynamic workloads.
As a first step, we evaluated the impact of representing different levels of user’sdynamism in web workload characterization. The obtained results were comparedagainst those obtained with traditional workloads proving that dynamic workloadsnegatively affect the stress borderline on the server in the studied cases. Furthermore,we observed that considering user’s dynamic navigations on workload characterizationhas a stronger impact on the system performance metrics than modeling changes inthe role, because dynamism is more present in the navigations than in modelingchanges.
In a second study, we explored the effects of considering User-Browser Interactionin web performance evaluation. This study proved that navigations using the backbutton or opening new tabs, which result from considering a user dynamic interactionwith the provided contents, clearly allow users to achieve their goals in less time, soincreasing productivity. These browsing patterns also affect the utilization and thethroughput of the main system resources, and consequently the stress borderline onthe server, which is relaxed permitting the system either to support more applicationsor serve more users.
The work presented in this dissertation permits us to state that workload modelshave to consider the different levels of user’s dynamism in order to precisely estimatesystem performance for the dynamic Web.
8.2 Open research lines
The work done through this dissertation opens several research lines and new researchfields based on its contributions. Some of them are briefly described below:
• DWEB could be formalized with the aim of: i) developing a graphical designersoftware, and ii) generating automatically web workloads from real traffic logs.To this end, approaches as the model driven development or the semantic knowl-edge would be considered.
• GUERNICA can be improved as a software product, or its generation processcan be integrated in one of the most important commercial or open sourcecommunity solutions with the aim of transferring the research knowledge intothe industry.
94

8.3. PUBLICATIONS RELATED TO THE THESIS
• Other contexts of the current Web could be modeled, analyzed and evaluatedusing our approach, such as On-line Social Network or Mobile Apps.
• Traffic generation using DWEB and GUERNICA could be applied to otherresearch contexts. After a research stay at Coventry University, the possibilityof extending our approach to the web security context was suggested by Dr.Siraj Ahmed Shaikh. To this end, we can study how to generate traffic for:
– Distributed Denial of Service (DDoS) attacks. These attacks are explicitattempts to disrupt the services of a provider, which are intended for itslegitimate clients, by consuming computing and networking resources.
– Flash Events (FEs) scenarios, which represent a period of time when aweb-server experiences a dramatic increase in incoming traffic.
– Flash-Crowd attacks, that are a popular form of DDoS targeted at application-level floods, where attackers mimic FEs by deploying a large, distributedbot network and generating legitimate application requests that overwhelmthe victim.
8.3 Publications related to the thesis
Table 8.1 classifies the main publications related to this dissertation, which are de-tailed below, according to the publication type and provides the next information:
• REFERENCE : The publication identifier.
• RANK : The publication class according to the next rankings:
– CORE: Conference class in the Computing Research Education (CORE)classification [Aus06] of 2006.
– ERA: Conference class in the Excellence in Research for Australia (ERA)classification [Aus10] of 2010.
– JCR: Journal class in the Journal Citation Reports (JCR) classification[Tho11] of 2009 and 2011.
– SJR: Journal class in the SCImago Journal Rank (SJR) [SCI11] of 2009and 2011.
• CITATIONS : Paper citations (source Google Scholar [Goo12]).
95

CHAPTER 8. CONCLUSIONS AND OPEN RESEARCH LINES
REFERENCE RANK CITATIONS TYPE[IJEB’05] - 5
Jou
rnal
s
[COMCOMJ’09]JCR-Q2
12SJR-Q1
[CLEIej’12] - 1
[COMCOMJ’13]JCR-Q2
-SJR-Q1
[INFOSCI’13]a - -[HET-NET’04] - 2
Intern
ational
Con
fere
nce
s
[WOSP’05] CORE-B 5[CLEI’06] - -
[WEBIST’11] ERA-C -[CLEI’11] - -
[IEEE-NCA’12] ERA-A -[SAC’13] ERA-B -
[JSWEB’05] - -
National
[JJPP’10] - -[JJPP’11] - -
[GENERICA’04a] - -
Rep
orts[GENERICA’04b] - -
[GENERICA’04c] - -[GENERICA’04d] - -[GENERICA’04e] - -
Table 8.1: List of main publications
aSubmitted
96

BIBLIOGRAPHY
[HET-NET’04] Raul Pena-Ortiz, Julio Sahuquillo, Ana Pont, and Jose Antonio Gil.Modeling users’ dynamic behavior in web aplication environments. In 2nd In-ternational Working Conference on Performance Modelling and Evaluation ofHeterogeneous Networks (HET-NET’04), ISBN 0-99540151-6-9, pages P50/1–P50/10. Ilkley, West Yorkshire, UK, July, 2004.
[GENERICA’04a] GENERICA. Estudio del estado actual de los generadores decarga. Technical report. iSOCO S.L, December 2004.
[GENERICA’04b] GENERICA. Arquitectura. Technical report. iSOCO S.L, De-cember 2004.
[GENERICA’04c] GENERICA. Arquitectura del Motor de navegaciones. Technicalreport. iSOCO S.L, December 2004.
[GENERICA’04d] GENERICA. Arquitectura de CARENA. Technical report.iSOCO S.L, December 2004.
[GENERICA’04e] GENERICA. Componente de visualizacion de navegaciones. Tech-nical report. iSOCO S.L, December 2004.
[IJEB’05] Raul Pena-Ortiz, Julio Sahuquillo, Ana Pont, and Jose Antonio Gil. Model-ing users’ dynamic behavior in e-business environments using navigations. Inter-national Journal of Electronic Business (IJEB), ISSN 1741-5063, 3(3):225–242,May-June 2005. doi: 10.1504/IJEB.2005.007268.
[WOSP’05] Raul Pena-Ortiz, Julio Sahuquillo, Ana Pont, and Jose Antonio Gil. Mod-eling continuos changes of the user’s web dynamic behavior in the WWW. InFifth International Workshop on Software and Performance (WOSP’05), ISBN1-59593-087-6, pages 175–180. Palma de Mallorca, Spain, July 2005.
[JSWEB’05] Raul Pena-Ortiz, Julio Sahuquillo, Ana Pont, and Jose Antonio Gil.Modelado de patrones de comportamiento de usuarios WWW de segunda gen-eracion. In I Jornadas Cientıfico-Tecnicas en Servicios Web (JSWEB’05), ISBN84-9732-455-2, pages 251–254. Granada, Spain, September, 2005.
[CLEI’06] Raul Pena-Ortiz, Julio Sahuquillo, Ana Pont, and Jose Antonio Gil. In-corporacion de modelado dinamico a un generador de carga para la Web 2.0. InXXXII Conferencia Latinoamericana de Informatica (CLEI’06), pages 158–168.Santiago de Chile, Chile, August, 2006.
[COMCOMJ’09] Raul Pena-Ortiz, Julio Sahuquillo, Ana Pont, and Jose AntonioGil. DWEB model: Representing Web 2.0 dynamism. Computer Communi-cations Journal (COMCOMJ), ISSN 0140-3664, 32(6):1118–1128, 2009. doi:10.1016/j.comcom.2009.01.002.
97

BIBLIOGRAPHY
[JJPP’10] Raul Pena-Ortiz, Julio Sahuquillo, Ana Pont, and Jose Antonio Gil. Gen-erating dynamic workload for web performance evaluation. In XXI Jornadasde Paralelismo (JJPP’10), ISBN 978-84-92812-49-3, pages 711–718. Valencia,Spain, September, 2010.
[WEBIST’11] Raul Pena-Ortiz, Julio Sahuquillo, Ana Pont, and Jose Antonio Gil.WEB WORKLOAD GENERATORS: A survey focusing on user dynamism rep-resentation. In 7th International Conference on Web Information Systems andTechnologies (WEBIST’11) , ISBN 978-989-8425-51-5, pages 119–126. Noordwi-jkerhout, The Netherlands, May, 2011.
[JJPP’11] Raul Pena-Ortiz, Jose Antonio Gil, Julio Sahuquillo, and Ana Pont. Incor-poracion del dinamismo del usuario en un benchmark de comercio electronico. InXXII Jornadas de Paralelismo (JJPP’11), ISBN 978-84-694-1791-1, pages 459–465. La Laguna, Tenerife, Spain, September, 2011.
[CLEI’11] Raul Pena-Ortiz, Jose Antonio Gil, Julio Sahuquillo, and Ana Pont. In-tegracion del comportamiento dinamico del usuario en TPC-W. In XXXVIIConferencia Latinoamericana de Informatica (CLEI’11), pages 34–48. Quito,Ecuador, October, 2011.
[CLEIej’12] Raul Pena-Ortiz, Jose Antonio Gil, Julio Sahuquillo, and Ana Pont.Providing TPC-W with web user dynamic behavior. CLEI electronic journal(CLEIej), ISSN 0717-5000, 15(2):1. August, 2012.
[IEEE-NCA’12] Raul Pena-Ortiz, Jose Antonio Gil, Julio Sahuquillo, and Ana Pont.The impact of user’s dynamic behavior on web performance. In 11th IEEE Inter-national Symposium on Network Computing and Applications (IEEE-NCA’12),ISBN 978-0-7695-4773-2/12, pages 143–150. Cambridge, Massachusetts, USA,August, 2012. doi: 10.1109/NCA.2012.9.
[COMCOMJ’13] Raul Pena-Ortiz, Jose Antonio Gil, Julio Sahuquillo, and Ana Pont.Analyzing web server performance under dynamic user workloads. ComputerCommunications Journal (COMCOMJ), ISSN 0140-3664. Accepted but not yetpublished. doi: 10.1016/j.comcom.2012.11.005.
[SAC’13] Raul Pena-Ortiz, Jose Antonio Gil, Julio Sahuquillo, and Ana Pont. Theimpact of User-Browser Interaction on web performance. In 28th Symposium OnApplied Computing (SAC). Accepted but not yet published.
[INFOSCI’13] Raul Pena-Ortiz, Jose Antonio Gil, Julio Sahuquillo, and Ana Pont.Surfing the web using browser interface facilities: a performance evaluation ap-proach. Information Sciences (INFOSCI), ISSN 0020-0255. Submitted.
98

APPENDIX A
Acronyms
Web 1.0 First Web Generation . . . . . . . . . . . . . . . . . . . . . . . . . . . . . . . . . . . . . . . . . . . . . . . . . . 1
Web 2.0 Second Web Generation . . . . . . . . . . . . . . . . . . . . . . . . . . . . . . . . . . . . . . . . . . . . . . . . 1
CBMG Customer Behavior Model Graph . . . . . . . . . . . . . . . . . . . . . . . . . . . . . . . . . . . . . . . . 6
FSM Finite State Machine . . . . . . . . . . . . . . . . . . . . . . . . . . . . . . . . . . . . . . . . . . . . . . . . . . . . . . . 6
VBMG Visitor Behavior Model Graph. . . . . . . . . . . . . . . . . . . . . . . . . . . . . . . . . . . . . . . . . . .6
EFSM Extended Finite State Machine . . . . . . . . . . . . . . . . . . . . . . . . . . . . . . . . . . . . . . . . . . . 7
OSN On-line Social Network . . . . . . . . . . . . . . . . . . . . . . . . . . . . . . . . . . . . . . . . . . . . . . . . . . . . . 7
SPEC Standard Performance Evaluation Corporation . . . . . . . . . . . . . . . . . . . . . . . . . . . 11
SURGE Scalable URL Reference Generator . . . . . . . . . . . . . . . . . . . . . . . . . . . . . . . . . . . . 12
TPC-W TPC BenchmarkTM W . . . . . . . . . . . . . . . . . . . . . . . . . . . . . . . . . . . . . . . . . . . . . . . . 15
EB Emulated Browser . . . . . . . . . . . . . . . . . . . . . . . . . . . . . . . . . . . . . . . . . . . . . . . . . . . . . . . . . . 49
99

APPENDIX A. ACRONYMS
WAN Wide Area Network . . . . . . . . . . . . . . . . . . . . . . . . . . . . . . . . . . . . . . . . . . . . . . . . . . . . . . 14
LAN Local Area Network. . . . . . . . . . . . . . . . . . . . . . . . . . . . . . . . . . . . . . . . . . . . . . . . . . . . . . .23
DWEB Dynamic WEB workload model . . . . . . . . . . . . . . . . . . . . . . . . . . . . . . . . . . . . . . . . 27
UML Unified Modeling Language . . . . . . . . . . . . . . . . . . . . . . . . . . . . . . . . . . . . . . . . . . . . . . . 28
GUERNICA Universal Generator of Dynamic Workload under WWW Platforms33
PCA Personal Content Aggregator. . . . . . . . . . . . . . . . . . . . . . . . . . . . . . . . . . . . . . . . . . . . . .39
WIRT Web Interaction Response Time . . . . . . . . . . . . . . . . . . . . . . . . . . . . . . . . . . . . . . . . . 52
UBI User-Browser Interaction. . . . . . . . . . . . . . . . . . . . . . . . . . . . . . . . . . . . . . . . . . . . . . . . . . . .9
CORE Computing Research Education . . . . . . . . . . . . . . . . . . . . . . . . . . . . . . . . . . . . . . . . . 95
ERA Excellence in Research for Australia. . . . . . . . . . . . . . . . . . . . . . . . . . . . . . . . . . . . . . .95
JCR Journal Citation Reports . . . . . . . . . . . . . . . . . . . . . . . . . . . . . . . . . . . . . . . . . . . . . . . . . . 95
SJR SCImago Journal Rank . . . . . . . . . . . . . . . . . . . . . . . . . . . . . . . . . . . . . . . . . . . . . . . . . . . . 95
DDoS Distributed Denial of Service. . . . . . . . . . . . . . . . . . . . . . . . . . . . . . . . . . . . . . . . . . . . .95
FE Flash Event . . . . . . . . . . . . . . . . . . . . . . . . . . . . . . . . . . . . . . . . . . . . . . . . . . . . . . . . . . . . . . . . . 95
100

APPENDIX B
Glossary
3-tier architecture 3-tier architecture is a client–server architecture that typicallycomprises a presentation tier, a business or data access tier, and a data tier. 13
AJAX AJAX (Asynchronous JavaScript and XML) is a group of interrelated webdevelopment techniques used on the client-side to create asynchronous web ap-plications. 5
ASP Active Server Pages, also known as Classic ASP, was Microsoft’s first server-sidescript engine for dynamically generated web pages. 11
blurker A blog lurker (blurker) is someone who reads a lot of blogs but never postsany comments. 6
CGI The Common Gateway Interface (CGI) is a standard method for web serversoftware to delegate the generation of dynamic web content to executable files,which are known as CGI scripts. 10
ERP Enterprise Resource Planning (ERP) is an application used by large organiza-tions to manage inventory, resources, and business processes across departments.31
ISAPI Internet Server Application Programming Interface (ISAPI) is an N-tier ap-plication programming interface of Internet Information Services (IIS). Themost prominent application of IIS and ISAPI is Microsoft’s web server. 10
J2EE Java Platform Enterprise Edition (J2EE) is an enterprise Java computing plat-form that provides an API and runtime environment for developing and runningenterprise software, including network and web services, and other large-scale,multi-tiered, scalable, reliable, and secure network applications. 5
101
Glossary
JSP JavaServer Pages (JSP) is a technology that helps software developers createdynamically generated web pages based on HTML, XML, or other documenttypes. 11
L4/7 switches Layer 4/7 switching refers to content or application aware intelligentswitching and deep packet inspection of IP application traffic. By increasingperformance, security, availability, and scalability through content-aware intel-ligence, Layer 4/7 switching has become an indispensable component of newdata center and network infrastructures. 17
NSAPI Netscape Server Application Programming Interface (NSAPI) is an appli-cation programming interface for extending web server software. 10
PHP General-purpose server-side scripting language originally designed for web de-velopment to produce dynamic web pages. 11
102

APPENDIX C
Bibliography
[ACC+02] Cristiana Amza, Anupam Chanda, Alan L. Cox, Sameh Elnikety,Romer Gil, Karthick Rajamani, Emmanuel Cecchet, Julie Marguerite,and Willy Zwaenepoel. Specification and implementation of dynamicweb site benchmarks. In Workshop on Workload Characterization,pages 3–13, November 2002.
[AJK05] Anne Aula, Natalie Jhaveri, and Mika Kaki. Information Search andRe-access Strategies of Experienced Web Users. In Conference onWorld Wide Web, pages 583–592, May 2005.
[ASF12] ASF (Apache Software Foundation). Apache JMeterTM [online]. 2012.Available from: http://jmeter.apache.org/ [cited July 2012].
[ASW06] Ernesto Arroyo, Ted Selker, and Willy Wei. Usability tool for analysisof web designs using mouse tracks. In Conference on Human factorsin computing systems, pages 484–489. ACM, April 2006.
[Aus06] Australian Research Council. Australian Ranking of ICT conferences[online]. 2006. Available from: http://core.edu.au/rankings/
ConferenceRankingMain.html [cited April 2006].
[Aus10] Australian Research Council. Archived material from ERA 2010 [on-line]. 2010. Available from: http://www.arc.gov.au/era/era_2010/archive/era_journal_list.htm [cited October 2012].
[Bar98] Paul Barford. The SURGE Web Workloaad Generator [online]. 1998.Available from: http://pages.cs.wisc.edu/~pb/software_data.
html [cited 2005].
[BBBC99] Paul Barford, Azer Bestavros, Adam Bradley, and Mark E. Crovella.Changes in Web client access patterns: Characteristics and cachingimplications. World Wide Web Internet and Web Information Systems,2(1):15–28, 1999.
103

BIBLIOGRAPHY
[BC97] Paul Barford and Mark Crovella. An architecture for a WWW work-load generator. In World Wide Web Consortium Workshop on Work-load Characterization, October 1997.
[BC98] Paul Barford and Mark Crovella. Generating representative web work-loads for network and server performance evaluation. In SIGMET-RICS ’98/PERFORMANCE ’98, Joint International Conference onMeasurement and Modeling of Computer Systems, pages 151–160, June1998.
[BCCPB07] Mercedes Blazquez-Cıvico, Jesus Contreras-Cino, Raul Pena-Ortiz,and V. Richard Benjamins. Trends on Legal Knowledge, the SemanticWeb and the Regulation of Electronic Social Systems, chapter Visual-ization of Semantic Content. European Press Academic Publishing,2007.
[BD99] Gaurav Banga and Peter Druschel. Measuring the capacity of a Webserver under realistic loads. World Wide Web Internet and Web In-formation Systems, 2(1/2):69–83, 1999.
[Bla05] Michael Blakeley. Deluge: website stress test tool [online]. 2005. Avail-able from: http://deluge.sourceforge.net/ [cited 2010].
[BRdMCA09] Fabrıcio Benevenuto, Tiago Rodrigues de Magalhaes, Meeyoung Cha,and Virgilio A.F Almeida. Characterizing user behavior in online socialnetworks. In Internet Measurement Conference, pages 49–62, Novem-ber 2009.
[CACB97] Liu Chang, Kirk P. Arnett, Louis M. Capella, and Robert C. Beatty.Web sites of the Fortune 500 companies: Facing customers throughhome pages. Information & Management Journal, 31(6):335–345, Jan-uary 1997.
[CAJ+99] Hua Chen, Marc Abrams, Tommy Johnson, Anup Mathur, Ibraz An-war, and John Stevenson. Wormhole caching with HTTP PUSHmethod for a satellite-based web content multicast and replication sys-tem. In Web Caching Workshop, 1999.
[CG00] Andy Cockburn and Saul Greenberg. Issues of Page Representationand Organisation in Web Browser’s Revisitation Tools. AustralasianJournal of Information Systems, 7(2), May 2000.
[CK08] Graham Cormode and Balachander Krishnamurthy. Key differencesbetween Web 1.0 and Web 2.0. First Monday Journal, 13(6), 2008.
[CMJ02] A. Cockburn, B. McKenzie, and M. JasonSmith. Pushing back:evaluating a new behaviour for the back and forward buttons in
104

BIBLIOGRAPHY
web browsers. International Journal of Human-Computer Studies,57(5):397–414, November 2002.
[CMZ02] Emmanuel Cecchet, Julie Marguerite, and Willy Zwaenepoel. Perfor-mance and scalability of EJB applications. In Conference on Object-oriented programming, systems, languages, and applications, pages246–261. ACM Request Permissions, November 2002.
[Con03] Jim Conallen. Building Web Applications With UML. Addison-WesleyProfessional, 2003.
[CPCP01] Ed H. Chi, Peter Pirolli, Kim Chen, and James Pitkow. Using in-formation scent to model user information needs and actions and theWeb. In Conference on Human factors in computing systems, pages490–497, 2001.
[CRML01] Harold W. Cain, Ravi Rajwar, Morris Marden, and Mikko H. Lipasti.An Architectural Evaluation of Java TPC-W. In International Sympo-sium on High-Performance Computer Architecture, page 229, January2001.
[DLDP03] Giuseppe A. Di Lucca and Massimiliano Di Penta. Considering browserinteraction in web application testing. In International Workshop onWeb Site Evolution, pages 74–81. IEEE, September 2003.
[DMA+08] Fernando Duarte, Bernardo Mattos, Jussara Almeida, Virgilio A.FAlmeida, Mariela Curiel, and Azer Bestavros. Hierarchical charac-terization and generation of blogosphere workloads. Technical report,October 2008.
[DMB01] Ronald C. Jr Dodge, Daniel A. Menasce, and Daniel Barbara. Testinge-commerce site scalability with TPC-W. In Computer MeasurementGroup Conference, pages 457–466, December 2001.
[Eri99] Peter Eriksson. PTester [online]. 1999. Available from: http://www.
lysator.liu.se/~pen/ptester/ [cited 2005].
[For12] Florian Forster. Collectd – The system statistics collection daemon[online]. 2012. Available from: http://collectd.org/ [cited June2012].
[FP01] Sally Floyd and Vern Paxson. Difficulties in simulating the Internet.IEEE/ACM Transactions on Networking, 9(4):392–403, August 2001.
[FPZ07] Pierfrancesco Foglia, Cosimo Antonio Prete, and Michele Zanda. Mod-elling Public Administration Portals. In Encyclopedia of Portal Tech-nologies and Applications, pages 606–614. 2007.
105

BIBLIOGRAPHY
[Ful12] Jeffrey Fulmer. SIEGE [online]. 2012. Available from: http://www.
joedog.org/siege-home/ [cited July 2012].
[GBGP10] Sharad Goel, Andrei Broder, Evgeniy Gabrilovich, and Bo Pang.Anatomy of the long tail: ordinary people with extraordinary tastes.In ACM International Conference on Web Search and Data Mining,pages 201–210. Yahoo Research, February 2010.
[GG03] Daniel F. Garcıa and Javier Garcıa. TPC-W e-commerce benchmarkevaluation. Computer, 36(2):42–48, February 2003.
[Goo12] Google. Google Scholar [online]. 2012. Available from: http:
//scholar.google.com/ [cited October 2012].
[Hen09] Jim Hendler. Web 3.0 Emerging. Computer, 42(1):111–113, 2009.
[HP12a] Hewlett-Packard. HP LoadRunner [online]. 2012. Available from:http://www8.hp.com/us/en/software-solutions/software.html?
compURI=1175451 [cited July 2012].
[HP12b] Hewlett-Packard. Load factor: performance testing for web applica-tions business white paper. Business white paper, June 2012.
[HP12c] Hewlett-Packard. Setting the pace for testing modern applications.Business white paper, May 2012.
[HW10] Jeff Huang and Ryen W. White. Parallel browsing behavior on theweb. In Conference on Hypertext and hypermedia, pages 13–18. ACM,June 2010.
[Jup06] Jupiter Research. Retail Web Site Performance: Consumer Reactionto a Poor Online Shopping Experience. Technical report, Akamai, June2006.
[LY96] David Lee and Mihalis Yannakakis. Principles and methods of testingfinite state machines-a survey. Proceedings of the IEEE, 84(8):1090–1123, 1996.
[MA00] Daniel A. Menasce and Virgilio A.F Almeida. Scaling for E-Business:Technologies, Models, Performance, and Capacity Planning. PrenticeHall, 2000.
[MF12] The Measurement Factory. Web Polygraph [online]. 2012. Availablefrom: http://www.web-polygraph.org/ [cited July 2012].
[Mid04] Julian T.J Midgley. AUTOBENCH [online]. 2004. Available from:http://www.xenoclast.org/autobench [cited 2005].
106

BIBLIOGRAPHY
[Min02a] Mindcraft. WebStone 2.x Benchmark Description [online]. 2002. Avail-able from: http://www.mindcraft.com/webstone/ws201-descr.
html [cited 2005].
[Min02b] Mindcraft. WebStone: The Benchmark for Web Servers [online]. 2002.Available from: http://www.mindcraft.com/webstone/ [cited 2005].
[MJ98] David Mosberger and Tai Jin. httperf—a tool for measuring web serverperformance. Performance Evaluation Review, 26(3), December 1998.
[MJ08] David Mosberger and Tai Jin. HTTPERF [online]. 2008. Availablefrom: http://www.hpl.hp.com/research/linux/httperf/ [cited2010].
[NdlOG+05] Ingrid Juliana Nino, Bernardo de la Ossa, Jose Antonio Gil, JulioSahuquillo, and Ana Pont. CARENA: a tool to capture and replayweb navigation sessions. In End-to-End Monitoring Techniques andServices, pages 127–141, May 2005.
[ONUI09] Moriyoshi Ohara, Priya Nagpurkar, Yohei Ueda, and Kazuaki Ishizaki.The Data-centricity of Web 2.0 Workloads and its Impact on ServerPerformance. In IEEE International Symposium on Workload Char-acterization, pages 133–142, October 2009.
[Ora12] Oracle. MySQL 5.1 Reference Manual: How the Query Cache Operates[online]. 2012. Available from: http://dev.mysql.com/doc/refman/5.1/en/query-cache-operation.html [cited April 2012].
[Ore07] Tim Oreilly. What is Web 2.0: Design patterns and business models forthe next generation of software. Communications & Strategies, 1:17,January 2007.
[OWHM07] Hartmut Obendorf, Harald Weinreich, Eelco Herder, and MatthiasMayer. Web page revisitation revisited: implications of a long-termclick-stream study of browser usage. In Conference on Human factorsin computing systems, pages 597–606, April-May 2007.
[PP99] Peter L.T. Pirolli and James E. Pitkow. Distributions of surfers’ pathsthrough the World Wide Web: Empirical characterizations. WorldWide Web, 2(1/2):29–45, 1999.
[Rad12] RadView Software. WebLOAD [online]. 2012. Available from: http:
//www.radview.com/product/Product.aspx [cited July 2012].
[RJB99] James Rumbaugh, Ivar Jacobson, and Grady Booch. The Unified Mod-eling Language Reference Manual. 1999.
107

BIBLIOGRAPHY
[Rod09] Pablo Rodriguez. Web Infrastructure for the 21st Century. In Confer-ence on World Wide Web. Telefonica I+D, January 2009.
[RS00] Frederick F. Reichheld and Phil Schefter. E-Loyalty: Your SecretWeapon on the Web. Harvard Business Review Magazine, 78:105, De-cember 2000.
[RSD+12] Kira Radinsky, Krysta Svore, Susan Dumais, Jaime Teevan, AlexBocharov, and Eric Horvitz. Modeling and predicting behavioral dy-namics on the web. In Conference on World Wide Web, pages 599–608.ACM, April 2012.
[RW03] Alex Rousskov and Duane Wessels. High performance benchmarkingwith Web Polygraph. Software: Practice and Experience, 1:1–10, 2003.
[RWC99] Alex Rousskov, Duane Wessels, and Glenn Chisholm. The First IR-Cache Web Cache Bake-off. In Web Caching Workshop, 1999.
[SAAF08] Fabian Schneider, Sachin Agarwal, Tansu Alpcan, and Anja Feldmann.The new web: Characterizing AJAX traffic. In International Confer-ence on Passive and Active Network Measurement, pages 31–40, April2008.
[SAP02] Srini S. Srinivasan, Rolph Anderson, and Kishore Ponnavolu. Cus-tomer loyalty in e-commerce: an exploration of its antecedents andconsequences. Journal of Retailing, 78(1):41–50, 2002.
[SCI11] SCImago Lab. SCImago Journal and Country Rank [online]. 2011.Available from: http://www.scimagojr.com [cited December 2012].
[SCK03] Weisong Song Shi, Elizabeth Collins, and Vijay Karamcheti. Modelingobject characteristics of dynamic web content. Journal of Parallel andDistributed Computing, 63(10):963–980, October 2003.
[SKF06] Mahnaz Shams, Diwakar Krishnamurthy, and Behrouz Far. A model-based approach for testing the performance of web applications. InInternational Workshop on Software Quality Assurance, pages 54–61.ACM, November 2006.
[SPE09] SPEC. SPEC’s Benchmarks for Web Servers [online]. 2009. Availablefrom: http://www.spec.org/benchmarks.html#web [cited 2012].
[SZ00] Young-Woo Seo and Byoung-Tak Zhang. Learning user’s preferencesby analyzing Web-browsing behaviors. In International conference onautonomous agents, pages 381–387. ACM, June 2000.
108

BIBLIOGRAPHY
[TGG+09] Georgios Tselentis, Alex Galis, Anastasius Gavras, Srdjan Krco, Volk-mar Lotz, Elena Simperl, Burkhard Stiller, and Theodore Zahariadis.Towards the Future Internet: A European Research Perspective. IOSPress, May 2009.
[Tha08] Andrew Thatcher. Web search strategies: The influence of Web expe-rience and task type. Information Processing & Management, 44(3),May 2008.
[Tho11] Thomson Reuters. Journal Citation Reports [online]. 2011. Availablefrom: http://thomsonreuters.com/products_services/science/
science_products/a-z/journal_citation_reports/ [cited Decem-ber 2012].
[Tra02a] Transaction Processing Performance Council. TPC BenchmarkTM W[online]. 2002. Available from: http://www.tpc.org/tpcw/ [cited2005].
[Tra02b] Transaction Processing Performance Council. TPC BenchmarkTM WSpecification. Version 1.8. Technical report, February 2002.
[WDG11] Geoff Wong, Mick Dwyer, and Jon Gifford. Hammerhead 2.0 [on-line]. 2011. Available from: http://sourceforge.net/projects/
hammerhead/ [cited July 2012].
[WOHM06] Harald Weinreich, Hartmut Obendorf, Eelco Herder, and MatthiasMayer. Off the beaten tracks: exploring three aspects of web nav-igation. In Conference on World Wide Web, pages 133–142, June2006.
109