Accurate determination of ethanol in water by qNMR ...acgpubs.org/JCM/2017/Volume 11/Issue...
7
ORIGINAL ARTICLE The article was published by Academy of Chemistry of Globe Publications www.acgpubs.org/jcm © Published 03/31/2017 EISSN:1307-6183 http://doi.org/10.25135/jcm.2.17.03.035 J. Chem. Metrol. 11:1 (2017) 9-15 Accurate determination of ethanol in water by qNMR: Validation and uncertainty assessment İlker Ün * and Ahmet C Goren TUBITAK, UME, P.Box:54 41470 Gebze-Kocaeli, Türkiye (Received February 27, 2017; Revised March 23, 2017; Accepted March 25, 2017) Abstract: A rapid and simple method, having high reproducibility and low uncertainty for determination of low concentration of ethanol in water has been developed by using qNMR. Method validation was performed applying CRM and calibration solutions. The correlation coefficient for the analyte in the calibration interval was 1. At a concentration range of 0.5 mg /g to 5 mg/g, the recovery was determined to be 99.71%. The relative uncertainties for ethanol solutions of 0.8123 mg/g and 3.8029 mg/g in water were found to be 0.0053 mg/g and 0.0027 mg/g, respectively. Keywords: qNMR; ethanol ; traceability; method validation; uncertainty. © 2017 ACG Publications. All rights reserved. 1. Introduction qNMR applications is now widely available in various fields, such as drug industry [1], manufacturing of reference materials [2], food analyses [3, 4] and metabolite determination in human body fluids [5-11]. Moreover, applications of qNMR involve determination of purity of a compound and amount and concentration of a sample inside a matrix. NMR is the sole method, which can determine, with one analysis, a small molecule having a single proton or an oligosaccharide possessing multiple protons. In addition to its easy and quick sample preparation procedure, recovering the sample after the analysis is possible especially in case of using external standard method, which is not possible with chromatographic techniques. While the reference material is used as independent of the sample in qNMR, it must have a structural similarity to the sample in chromatographic analyses Also, the chromatographic techniques require calibration curve, but it is up to the operator in qNMR. Due to its practical and reliable results, it looks, qNMR will attract even more interest in near future with upcoming cost reductions. Following quantitative determinations of active substances in drug and food supplements by qNMR [12], a rapid measure of alcohol concentration in food samples, with high accuracy and lower uncertainty is possible. qNMR can be used as an alternative and practical method for determination the amount of ethanol instead of GC-MS in food samples [13]. This method is particularly applicable for liquid samples such as wine [14] and alcohols in frozen fruit extracts [15]. In European pharmacopeia, the limits for the presence of organic solvents in drug samples have already been established. Ethanol has a concentration limit of 5000 ppm per day as it displays a lower toxicity [16]. The aim of this study is to determine the amount of ethanol in water samples at high and low concentration levels. The developed method will be fully validated and measurement uncertainty will be evaluated. * Corresponding author: E-Mail: [email protected] , Tel.:(+90) 262 679 50 00 - 6109
Transcript of Accurate determination of ethanol in water by qNMR ...acgpubs.org/JCM/2017/Volume 11/Issue...

ORIGINAL ARTICLE
The article was published by Academy of Chemistry of Globe Publications
www.acgpubs.org/jcm © Published 03/31/2017 EISSN:1307-6183
http://doi.org/10.25135/jcm.2.17.03.035
J. Chem. Metrol. 11:1 (2017) 9-15
Accurate determination of ethanol in water by qNMR: Validation
and uncertainty assessment
İlker Ün* and Ahmet C Goren
TUBITAK, UME, P.Box:54 41470 Gebze-Kocaeli, Türkiye
(Received February 27, 2017; Revised March 23, 2017; Accepted March 25, 2017)
Abstract: A rapid and simple method, having high reproducibility and low uncertainty for determination of low
concentration of ethanol in water has been developed by using qNMR. Method validation was performed
applying CRM and calibration solutions. The correlation coefficient for the analyte in the calibration interval
was 1. At a concentration range of 0.5 mg /g to 5 mg/g, the recovery was determined to be 99.71%. The relative
uncertainties for ethanol solutions of 0.8123 mg/g and 3.8029 mg/g in water were found to be 0.0053 mg/g and
0.0027 mg/g, respectively.
Keywords: qNMR; ethanol; traceability; method validation; uncertainty. © 2017 ACG Publications. All rights
reserved.
1. Introduction
qNMR applications is now widely available in various fields, such as drug industry [1],
manufacturing of reference materials [2], food analyses [3, 4] and metabolite determination in human
body fluids [5-11]. Moreover, applications of qNMR involve determination of purity of a compound
and amount and concentration of a sample inside a matrix. NMR is the sole method, which can
determine, with one analysis, a small molecule having a single proton or an oligosaccharide possessing
multiple protons. In addition to its easy and quick sample preparation procedure, recovering the
sample after the analysis is possible especially in case of using external standard method, which is not
possible with chromatographic techniques. While the reference material is used as independent of the
sample in qNMR, it must have a structural similarity to the sample in chromatographic analyses Also,
the chromatographic techniques require calibration curve, but it is up to the operator in qNMR. Due to
its practical and reliable results, it looks, qNMR will attract even more interest in near future with
upcoming cost reductions.
Following quantitative determinations of active substances in drug and food supplements by
qNMR [12], a rapid measure of alcohol concentration in food samples, with high accuracy and lower
uncertainty is possible. qNMR can be used as an alternative and practical method for determination the
amount of ethanol instead of GC-MS in food samples [13]. This method is particularly applicable for
liquid samples such as wine [14] and alcohols in frozen fruit extracts [15]. In European pharmacopeia,
the limits for the presence of organic solvents in drug samples have already been established. Ethanol
has a concentration limit of 5000 ppm per day as it displays a lower toxicity [16].
The aim of this study is to determine the amount of ethanol in water samples at high and low
concentration levels. The developed method will be fully validated and measurement uncertainty will
be evaluated.
* Corresponding author: E-Mail: [email protected], Tel.:(+90) 262 679 50 00 - 6109
qNMR for ethanol measurements in water
10
2. Experimental
2.1. Chemicals
Sample for applications; Ethanol-Water Solution (0.5% and 0.05%). Sample for trueness
studies; Standard Reference Material 2894 NIST. Internal standard for ethanol concentration; 3-
(Trimethylsilyl)propionic-2,2,3,3-d4 acid sodium salt (TSP-d4) Sigma Aldrich. NMR Solvent;
Deuterium oxide 99.9 % Merck. Internal standard for TSP-d4 purity; Benzoic acid Standard Reference
Material NIST 350b. Certified reference material for traceability; Chloramphenicol Primary Calibrant
UME CRM 1301 (certified value 99.58% ± 0.15%).
2.2. qNMR Conditions
All NMR experiments were performed at 298.15 K on a Varian VNMRS 600 spectrometer
(Varian, San Francisco, CA, USA) operating at 599.747 MHz for proton (1H) resonance frequency
equipped with a 5 mm One NMR probe using 5 mm sample tubes (5 mm diameter, 178 mm length,
Duran Group, Mainz, Germany). The VnmrJ 4.2 (Agilent Technologies, Santa Clara, CA, USA) and
MestReNova 11.0.0 (Mestrelab Research S.L., Santiago de Compostela, Spain) softwares were used
for data acquisition and data processing, respectively. More detailed phase and baseline correction can
be done with MestReNova software. For this reason, MestReNova software was used for data
processing. 1H NMR experiments were recorded with 32 scans without sample spinning. The
measurements were conducted with the following parameters optimized for 1H NMR: pulse angles of
90, 64 k data points, acquisition time of 4 s and auto gain function. T1 was approximately 3.48 s for
ethanol -CH3 resonance, and 6.50 s for TSP-d4 -CH3 resonance. 15xT1 was used to ensure a complete
relaxation and reducing the influence of relaxation delay. Therefore the relaxation delay between two
scans was set to 98 s. Spectral width of 9615.4 Hz and transmitter offset at 0.59 ppm were applied.
Fourier transformation was performed after zero filling the data to 64 k time domain points. Prior to
Fourier transformation, an exponential line-broadening function of 0.2 Hz was applied to FID (Free
Induction Decay) in all NMR experiments. During the data processing, phase and baseline were
corrected manually and the signals were also integrated manually for the same region. Chemical shift
was referenced to the TSP-d4 signal at 0.00 ppm in D2O. Each sample was measured once due to the
long analysis period, and the concentrations were calculated with the mean of the parallel detection
results.
2.3. Sample preparation
The weighing processes were performed on a micro balance (XP56, Mettler-Toledo GmbH,
Switzerland) with a readability of 0.001 mg, certified by UME (TÜBİTAK National Metrology
Institute) and checked with the class E2 weights. The balance is positioned on a 500 kg stone table,
with a U-electrode in place to remove potential static charge. Screw cap clear glass vials with the
capacity of 4 ml were used for sample preparation. Firstly, an empty vial was weighed and then TSP-
d4 was added as an internal reference (3-8 mg) into the vial. The weighing was repeated 3 times for the
empty vial and internal standard. Finally, water sample which contains ethanol was weighed (0.4 mL)
quickly in the same vial. 0.6 mL D2O was added into the vial and screw cap was tightly closed. The
solutions were mixed via vortex until a clear solution was obtained. Then, 0.7 mL of solution was
transferred into a NMR tube.
3. Results and discussion
3.1. Theory
Quantitative determination of ethanol concentration by qNMR was conducted by dissolving
the sample with known quantity together with the internal standard in completely deuterated water.

Ün and Goren, J. Chem.Metrol.. 11:1 (2017) 9-15
11
The quantitative value was calculated using integral values of ethanol and the internal standard signals
in the spectrum. In order to determine the correct integral values, phase and baseline corrections of the
spectrum were made manually. The calculation equation of qNMR for the analyte purity is as follows:
(1)
IStd, NStd, MStd, mStd and PStd are the peak area, number of proton, molecular weight, weighed
mass and purity of the internal standard, respectively. The terms IEtOH, NEtOH, MEtOH, and CEtOH indicate
the peak area, number of proton, molecular weight and concentration of the analyte (ethanol), mSample
weighed mass for ethanol in water sample respectively.
3.2. Method Validation
Trueness, linearity, limit of detection (LOD), limit of quantification (LOQ), specificity and
selectivitiy parameters were evaluated to validate the method. Additionally, traceability was
established to obtain comparable results and measurement uncertainty was calculated.
3.2.1. Trueness
In order to assess trueness, two different ways were followed, in the first method the NIST
2894 standard reference material, in which ethanol concentration was reported as 1.0084 mg/g ±
0.0083, was used. The results of the analysis conducted with 5 different samples are given in Table 1.
When the obtained results were evaluated, it was determined that the ethanol concentration found by
qNMR analysis and the certificate value of ethanol solution in water were very close to each other in
terms of both concentration and uncertainty.
Table 1. qNMR results of NIST 2894 SRM
NIST 2894 qNMR Results
(mg/g)
Sample 1 1.0063
Sample 2 1.0203
Sample 3 0.9996
Sample 4 1.0167
Sample 5 1.0032
Mean 1.0092
Standard Deviation 0.0089
In the second validation method, qNMR analyzes were performed by preparing ethanol water
solution in 6 different concentrations between 0.5 mg/g and 5 mg/g. Recovery studies were conducted
through dilution of the standard stock solution to different concentrations. The average recovery value
for linearity samples was found to be 99.71% and the relative standard deviation value was 1.52
(Table 2). Recovery was calculated according to the following formula.
(2)

qNMR for ethanol measurements in water
12
Table 2. Recovery evaluation by qNMR
Sample
Spiked
(mg/g)
Found
(mg/g)
Expanded Uncertainty
(mg/g) Recovery %
Ethanol in Water 0,5 mg/g 0.483 0.492 0.001 101.86
Ethanol in Water 1 mg/g 0.937 0.950 0.008 101.39
Ethanol in Water 2 mg/g 1.809 1.796 0.022 99.28
Ethanol in Water 3 mg/g 2.838 2.794 0.012 98.45
Ethanol in Water 4 mg/g 3.629 3.573 0.019 98.46
Ethanol in Water 5 mg/g 4.774 4.719 0.022 98.85
Mean 99.71
SD 1.52
% RSD 1.52
3.2.2. Linearity
The linearity was evaluated by preparing three different samples from each concentration and
drawing a linearity pilot using the average values of these samples (Figure 1).
y = 0.9818x + 0.0195R² = 1
0.00
0.50
1.00
1.50
2.00
2.50
3.00
3.50
4.00
4.50
5.00
0.000 1.000 2.000 3.000 4.000 5.000 6.000
Fou
nd
Eth
ano
l C
on
cen
trat
ion
(m
g/g)
Ethanol Concentration in Water (mg/g)
Figure 1. Linearity study pilot for ethanol concentration in water
3.2.3. LOD and LOQ
LOD and LOQ values were studied with different samples by lowering ethanol concentration
in water. The limit of detection (LOD) of the method was found to be 0.005 mg/g for ethanol. The
limits of quantification (LOQ) was calculated to be 0.09 mg/g, (for S/N ratio >100 and the above
concentrations).
3.2.4. Specificity and selectivity
Figure 3 shows
1H NMR spectra of ethanol in water and TSP-d4 in D2O. It was obvious that
the signals obtained at 1.17(t) ppm for ethanol [17] and 0.02 ppm for TSP-d4 were not disturbed by
water and excipients. Moreover, the signals of ethanol and TSP-d4 were well separated from each
other in sample preparations. A representative qNMR spectrum of ethanol in water sample is shown in
Figure 2.

Ün and Goren, J. Chem.Metrol.. 11:1 (2017) 9-15
13
Figure 2. Representative qNMR spectrum of ethanol in water sample solved in D2O
3.3. Traceability
In quantitative NMR analyzes, the TSP-d4 reference was used as the internal standard. TSP-d4
purity was determined by qNMR using the benzoic acid internal standard in the traceability chain of
UME-CRM-1301 (chloramphenicol primary calibrator). Analyzes carried out on this basis were
conducted by establishing a calibration chain that reaches the primary national or international
standards, i.e. the International System of Units (SI).
3.4. Estimation of Uncertainty
The combined uncertainty u(Cx) containing additional quantities were calculated via equation
(3), according to the literature [18] for determination of ethanol concentrations (Table 4). The letter X
represents the ethanol.
(3)
Equation (4) was used for the calculation of uncertainty component of molar masses u(M).
Where, Nj indicates the number of atoms of the element j (e.g. C, H, etc.) and u(j) indicates the
uncertainties of the atom masses.
(4)
The uncertainties of the initial weighing u(m), given by the uncertainty parameters of balance,
were calculated using equation (5).
(5)
Table 4. Results from uncertainty evaluation of the 1qNMR method
Value (x) u(x) u(x)/x
Ethanol Concentration (%) 0.081232 0.000192 0.002362
Reference Purity (%) 96.120000 0.107500 0.001118
MW Ethanol (g/mol) 46.068440 0.000971 2.11E-05
MW TSP-d4 (g/mol) 172.266129 0.002831 1.64E-05
m Sample (mg) 399.987211 0.001155 2.89E-06
m Reference (mg) 7.309667 0.002309 0.000316
0.002633
Ethanol Concentration in water % 0.08123
Combined uncertainty, u 0.00021
Expanded uncertainty, U (k=2) 0.00043
qNMR for ethanol measurements in water
14
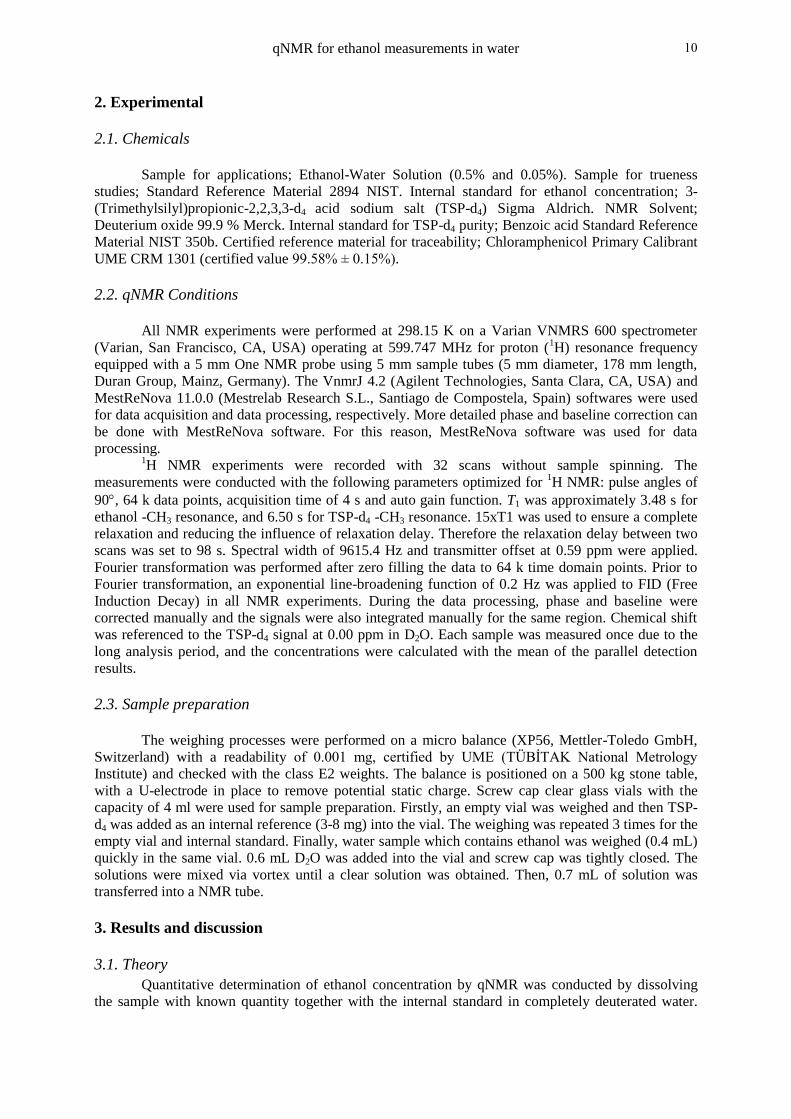
3.5. Application of two different concentrations for ethanol in water sample by qNMR
Ethanol concentration was determined at two different levels in water by qNMR. Five
different sub-samples were prepared per day for each solution and analyzed on three different days. A
total of fifteen NMR sub-samples were prepared from each concentration. The results for each day are
given in Table 2 for low and high concentrations.
Table 3. qNMR results for two different concentrations of ethanol samples
Ethanol in Low Level Concentration (mg/g) High Level Concentration (mg/g)
Water Day 1 Day 2 Day 3 Day 1 Day 2 Day 3
Sample 1 0.8053 0.8180 0.8256 3.8038 3.7973 3.8134
Sample 2 0.8116 0.8088 0.8128 3.8155 3.7993 3.8009
Sample 3 0.8114 0.7999 0.8231 3.8261 3.8050 3.7978
Sample 4 0.8149 0.8071 0.8050 3.7936 3.8069 3.7997
Sample 5 0.8068 0.8230 0.8117 3.7926 3.7912 3.8005
Mean 0.8100 0.8113 0.8156 3.8063 3.7999 3.8025
SD 0.0039 0.0092 0.0085 0.0144 0.0063 0.0062
Com. Unc. u 0.0020 0.0042 0.0039 0.0078 0.0052 0.0052
Exp. Unc. U 0.0040 0.0084 0.0079 0.0156 0.0105 0.0104
Averages and uncertainty values of 15 sub-samples for each concentration were found as follows. The
value for low concentration was found to be 0.8123 mg/g and the expanded uncertainty was 0.0043
mg/g. The value for high concentration was found to be 3.8029 mg/g and the expanded uncertainty
was 0.0101 mg/g.
4. Conclusion
The qNMR provides significant advantages over other chromatographic, spectroscopic and
titrimetric methods, considering lesser analysis time, faster method development, easier data analysis
and readiness of the instrument all the time. In this study, two different ethanol solutions, having lower
and higher concentrations were studied. At both concentrations, the amount of ethanol was determined
and reported with all the uncertainty components. It has been shown that the NMR instrument can be
used as an important analytical technique for quantitative calculations of low concentrations of alcohol
or metabolites in liquid solutions with high reproducibility and low uncertainty.
Acknowledgements
The authors would like to thank Professor Turan Ozturk, Istanbul Technical University for
excellent technical support.
References
[1] U. Holzgrabe, (2008), Chapter 5 - qNMR Spectroscopy in Drug Analysis – A General View, NMR
Spectroscopy in Pharmaceutical Analysis, 131-137, Amsterdam.
[2] M. Weber, C. Hellriegel, A. Rück, R. Sauermoser and J. Wüthrich, (2013). Using high-performance
quantitative NMR (HP-qNMR®) for certifying traceable and highly accurate purity values of organic
reference materials with uncertainties <0.1 %, Accredit Qual. Assur. 18:(2), 91-98.
[3] T. Ohtsuki, K. Sato, N. Sugimoto, H. Akiyama and Y. Kawamura, (2012). Absolute quantitative analysis
for sorbic acid in processed foods using proton nuclear magnetic resonance spectroscopy, Anal. Chim.
Acta. 734, 54-61.

Ün and Goren, J. Chem.Metrol.. 11:1 (2017) 9-15
15
[4] T. Ohtsuki, K. Sato, N. Sugimoto, H. Akiyama and Y. Kawamura, (2012). Absolute quantification for
benzoic acid in processed foods using quantitative proton nuclear magnetic resonance spectroscopy,
Talanta. 99, 342-348.
[5] M.W. Couch, N.P. Das, K.N. Scott, C.M. Williams and R.L. Foltz, (1973). Identification and quantitative
determination of saccharin in biological fluids, Biochem. Med. Metab. B. 8:(3), 362-370.
[6] J.C. Lindon, J.K. Nicholson, E. Holmes and J.R. Everett, (2000). Metabonomics: Metabolic processes
studied by NMR spectroscopy of biofluids, Concept Magnetic Res. 12:(5), 289-320.
[7] B. Cartigny, N. Azaroual, M. Imbenotte, D. Mathieu, G. Vermeersch, J.P. Goulle and M. Lhermitte,
(2004). Determination of glyphosate in biological fluids by 1H and
31P NMR spectroscopy, Forensic Sci.
Int. 143:(2-3), 141-5.
[8] E.J. Saude, C.M. Slupsky and B.D. Sykes, (2006). Optimization of NMR analysis of biological fluids for
quantitative accuracy, Metabolomics. 2:(3), 113-123.
[9] T.N. Kolokolova, O.Y. Savel’ev and N.M. Sergeev, (2011). Metabolic analysis of human biological
fluids by 1H NMR spectroscopy, J. Anal. Chem. 63:(2), 104-120.
[10] R.K. Rai and N. Sinha, (2012). Fast and accurate quantitative metabolic profiling of body fluids by
nonlinear sampling of 1H-
13C two-dimensional nuclear magnetic resonance spectroscopy, Anal. Chem.
84:(22), 10005-11.
[11] T.J. Athersuch, S. Malik, A. Weljie, J. Newton and H.C. Keun, (2013). Evaluation of 1H NMR metabolic
profiling using biofluid mixture design, Anal. Chem. 85:(14), 6674-81.
[12] İ. Ün, B. Vatansever, A. Şimşek and A.C. Gören, (2016). Comparison of qNMR and HPLC-UV
techniques for measurement of coenzyme Q10 in dietary supplement capsules, J. Chem. Metrol. 10:(1), 1-
10.
[13] S. Gunduz, H. Yilmaz and A.C. Goren, (2013). Halal food and metrology: ethyl alcohol contents of
beverages, J. Chem. Metrol. 7:(1), 7-9.
[14] E. López-Rituerto, S. Cabredo, M. López, A. Avenoza, J.H. Busto and J.M. Peregrina, (2009). A
Thorough Study on the Use of Quantitative 1H NMR in Rioja Red Wine Fermentation Processes, J. Agr.
Food Chem. 57:(6), 2112-2118.
[15] W. da Silva Nunes, C.S. de Oliveira and G.B. Alcantara, (2016). Ethanol determination in frozen fruit
pulps: an application of quantitative nuclear magnetic resonance, Magn. Reson. Chem.: MRC. 54:(4),
334-40.
[16] International conference on harmonization (ICH) of technical requirement for registration of
Pharmaceutical for human use, topic Q3C, Impurities guideline for residual solvents, (2005),
www.ich.org.
[17] G.R. Fulmer, A.J.M. Miller, N.H. Sherden, H.E. Gottlieb, A. Nudelman, B.M. Stoltz, J.E. Bercaw and
K.I. Goldberg, (2010). NMR Chemical Shifts of Trace Impurities: Common Laboratory Solvents,
Organics, and Gases in Deuterated Solvents Relevant to the Organometallic Chemist, Organometallics.
29:(9), 2176-2179.
[18] F. Malz and H. Jancke, (2005). Validation of quantitative NMR, J. Pharma. Biomed. Anal. 38:(5), 813-
23.
© 2017 ACG Publications


![FALL SEMESTER SPRING SEMESTER · 2019-07-05 · 3 JCM 211: Jazz Composition [6] 3 JCM 212: Jazz Composition [6] 1 JCM 200: Large Jazz Ensemble [4] 2 JCM 225: Jazz Comp. & Arranging](https://static.fdocuments.us/doc/165x107/5e5bc8a6b05fc406b243fd16/fall-semester-spring-semester-2019-07-05-3-jcm-211-jazz-composition-6-3-jcm.jpg)