Accurate and reliable quantification of 25-hydroxy-vitamin D species by liquid … · Accurate and...
20
Accurate and reliable quantification of 25-hydroxy-vitamin D species by liquid chromatography high-resolution tandem mass spectrometry Gerhard Liebisch, Silke Matysik Institute for Clinical Chemistry and Laboratory Medicine, University of Regensburg, Germany. Short Title: 25-OH-vitamin D quantification by LC-MS/HRMS Corresponding author: PD Dr. Gerhard Liebisch Institut für Klinische Chemie und Laboratoriumsmedizin Universität Regensburg D-93053 Regensburg Germany Phone: +49-941-944-6240 Fax: +49-941-944-6202 e-mail: [email protected] by guest, on August 30, 2018 www.jlr.org Downloaded from
Transcript of Accurate and reliable quantification of 25-hydroxy-vitamin D species by liquid … · Accurate and...
Accurate and reliable quantification of 25-hydroxy-vitamin D species by liquid
chromatography high-resolution tandem mass spectrometry
Gerhard Liebisch, Silke Matysik
Institute for Clinical Chemistry and Laboratory Medicine, University of Regensburg,
Germany.
Short Title: 25-OH-vitamin D quantification by LC-MS/HRMS
Corresponding author:
PD Dr. Gerhard Liebisch
Institut für Klinische Chemie und Laboratoriumsmedizin
Universität Regensburg
D-93053 Regensburg
Germany
Phone: +49-941-944-6240
Fax: +49-941-944-6202
e-mail: [email protected]
by guest, on August 30, 2018
ww
w.jlr.org
Dow
nloaded from
Liebisch et. al 25-OH-vitamin D quantification by LC-MS/HRMS 2
Abbreviations
25(OH)D 25-hydroxyvitamin D
BHT butylated hydroxytoluene
HR-MS high resolution tandem mass spectrometry
IS internal standard
LC-MS/HR-MS liquid chromatography-high resolution tandem mass
spectrometry
LoD Limit of detection
LoQ Limit of quantification
MF matrix factor
QQQ triple quadrupole mass spectrometers
SIM selected ion monitoring
by guest, on August 30, 2018
ww
w.jlr.org
Dow
nloaded from
Liebisch et. al 25-OH-vitamin D quantification by LC-MS/HRMS 3
Abstract
In general, mass spectrometric quantification of small molecules in routine laboratory
testing utilizes liquid chromatography coupled to low mass resolution triple
quadrupole mass spectrometers (QQQ). Here we introduce high resolution tandem
mass spectrometry (quadrupole-Orbitrap) for the quantification of 25-hydroxy-vitamin
D [25(OH)D], a marker of the vitamin D status, since the specificity of 25(OH)D-
immunoassays is still questionable and mass spectrometric quantification is
becoming increasingly important. Liquid chromatography coupled to high resolution
tandem mass spectrometry (LC-MS/HR-MS) was used to quantify 25-hydroxy-
cholecalciferol [25(OH)D3], 25-hydroxy-ergocalciferol [25(OH)D2] and their C3-
epimers 3-epi-25(OH)D3, 3-epi-25(OH)D2. The method has a run time of 5min and
was validated according to the U.S. Food and Drug Administration (FDA) and the
European Medicines Agency (EMA) guidelines. High mass resolution was
advantageously applied to separate a quasi-isobaric interference of the internal
standard D6-25(OH)D2 with 3-epi-25(OH)D3. All analytes showed an imprecision of
below 10% CV, trueness between 90 and 110% as well as LoQs below 10nmol/l.
Concentrations measured by LC-MS/HR-MS are in good agreement with those of the
National Institute of Standards and Technology (NIST) reference methods using LC-
MS/MS (QQQ). In conclusion, quantification of 25(OH)D by LC-MS/HR-MS is
applicable for routine testing and holds promise also for highly specific quantification
of other small molecules.
by guest, on August 30, 2018
ww
w.jlr.org
Dow
nloaded from
Liebisch et. al 25-OH-vitamin D quantification by LC-MS/HRMS 4
Introduction
It is increasingly recognized that an adequate vitamin D status beside the regulation
of bone and calcium-phosphate metabolism seems to be protective against a number
of diseases including diabetes, cancer, musculoskeletal disorders, cardiovascular,
infectious, autoimmune diseases and dementia (1). 25-hydroxyvitamin D [25(OH)D]
is widely accepted as a reliable indicator of the vitamin D status. There is an ongoing
debate about the standardization and specificity of 25(OH)D immunoassays (2-4).
Thus, sources of inaccuracy may be related to variations in the levels of vitamin D
binding protein (5) and cross-reactivity to 24,25-dihydroxyvitamin D (6). Therefore, a
number of laboratories introduced liquid chromatography tandem mass spectrometry
(LC-MS/MS) methods for the quantification of 25(OH)D (reviewed in (7)). Moreover,
global standardization is advanced with LC-MS/MS reference methods (8;9) and the
availability of NIST reference material (10).
Application of LC-MS/MS allows the separation of different 25(OH)D species i.e. 25-
hydroxy-cholecalciferol [25(OH)D3], 25-hydroxy-ergocalciferol [25(OH)D2] and their
C3-epimers 3-epi-25(OH)D3, 3-epi-25(OH)D2. Meanwhile it is recognized that
accurate quantification of 25(OH)D by LC-MS/MS requires LC separation of
25(OH)D-epimers due to an increased analytical response of the epimers (11;12) and
significant concentrations of epimers not only in infants but also adults (13;14).
In general, quantification of small molecules involves triple quadrupole instruments
(QQQ) operated at unit mass resolution. Until now there have been only two methods
published for 25(OH)D quantification by high resolution mass spectrometry (HR-MS).
One applied LC-HR-MS (15) and the second performed LC-HR-MS3 of derivatized
25(OH)D3 species with an ion trap-Orbitrap mass spectrometer (16). Here we present
a novel method for the fast and accurate quantification of 25(OH)D3, 25(OH)D2 and
by guest, on August 30, 2018
ww
w.jlr.org
Dow
nloaded from

Liebisch et. al 25-OH-vitamin D quantification by LC-MS/HRMS 5
their C3-epimers by liquid chromatography-high resolution tandem mass
spectrometry (LC-MS/HR-MS) using a quadrupole-Orbitrap instrument.
by guest, on August 30, 2018
ww
w.jlr.org
Dow
nloaded from

Liebisch et. al 25-OH-vitamin D quantification by LC-MS/HRMS 6
Material and Methods
Reagents
Ammonium acetate analytical grade, formic acid analytical grade, ethanol absolute
EMSURE and isopropanol LiChrosolv were purchase from Merck (Darmstadt,
Germany). Chloroform ROTISOLV® was from Carl Roth GmbH (Karlsruhe,
Germany) and methanol LC-MS Chromasolv from Fluka (Buchs, Switzerland).
25(OH)D3, 25(OH)D
2, D
6-25(OH)D
3, D
6-25(OH)D
2 and 3-epi-25(OH)D
3 were
purchased from Toronto research chemicals (Toronto, Canada). Butylated
hydroxytoluene (BHT), 3-epi-25(OH)D2, iso-octane ACS reagent and Zone-Free
Films were from Sigma Aldrich (München, Germany).
Calibrators and quality controls
Assay validation was performed with serum controls MassCheck® 3-epi-25-OH-
D3/D2 and 25-OH-D3/D2 Level I (medium) and II (high) (Table 2), purchased from
Chromsystems (München, Germany). A low level control was prepared by 5-fold
dilution of Level I with physiological human albumin solution ALBUNORM 5%
(Octapharma, Langenfeld, Germany). Additionally, pooled serum was used as an in-
house quality control. Calibrators were prepared by standard addition from
methanolic solutions of authentic standards to pooled human serum. ALBUNORM
was used as analyte free level and did not contain any detectable 25(OH)D species
(please see Figures S4 to 7, Cal 0). The level I calibrator was prepared by 4-fold
dilution of a serum pool with ALBUNORM. The in-house calibrators (blank + 5 levels,
see Supplemental Figures 4-7) were calibrated by repeated quantification (n=6) using
NIST traceable serum calibrators 3PLUS1® Multilevel Serum Calibrator Set 3-epi-25-
by guest, on August 30, 2018
ww
w.jlr.org
Dow
nloaded from
Liebisch et. al 25-OH-vitamin D quantification by LC-MS/HRMS 7
OH-D3/D2 and 25-OH-D3/D2 (four calibration levels including a low level) obtained
from Chromsystems (München, Germany).
Sample preparation
Liquid-liquid extraction was used as described by Midttun et al. (17). In brief, 100µl
serum/control/calibrator were placed into 96-well deep-wells (2ml Costar Assay
Block; Corning, Amsterdam, The Netherlands) and deproteinized by 200µl of an
ethanolic solution containing 50ng/ml each D6-25(OH)D3, D6-25(OH)D2 and 1g/l BHT.
Extraction was performed with 600µl iso-octane/chloroform = 3/1 (v/v). 400µl of the
upper phase was recovered using a Tecan Genesis (Männedorf, Switzerland) and
transferred to another 96-well deep-well plate. Solvent was removed by vacuum-
centrifugation. The samples were re-dissolved in 50µl methanol containing 1g/l BHT
and sealed with Zone-Free Film.
LC-MS/HR-MS:
25(OH)D analysis was performed by liquid chromatography-high resolution tandem
mass spectrometry (LC-MS/HR-MS). The LC consisted of an UltiMate 3000 XRS
quaternary UHPLC pump, an UltiMate 3000 RS column oven and an UltiMate 3000
isocratic pump (Thermo Fisher Scientific Waltham, MA USA) connected to a PAL
HTS-xt autosampler (CTC Analytics, Zwingen, CH) and a hybrid quadrupole-orbitrap
mass spectrometer QExactive (Thermo Fisher Scientific, Bremen, Germany)
equipped with a heated electrospray ionization source. 5µl of the re-dissolved
samples were injected and separated on a Kinetex™ 2.6 µm PFP (50 x 2.1 mm,
Phenomenex, Aschaffenburg, Germany) equipped with a 0.5µm inline filter (Vici
Valco, Schenkon, Switzerland) at a column temperature of 40°C. Mobile phase A
consisted of methanol/water (5/95; v/v), mobile phase B was 100% methanol, both
by guest, on August 30, 2018
ww
w.jlr.org
Dow
nloaded from
Liebisch et. al 25-OH-vitamin D quantification by LC-MS/HRMS 8
containing 0.1% formic acid and 2mmol/L ammonium acetate. Gradient elution
started at 100% A with a flow rate of 500µl/min, a linear increase to 68% B in 0.1min,
followed by an increase to 73% B until 4 min. For column cleaning the methanol
percentage and flow were increased to 100% and 800µl/min within 0.1min,
respectively. After flushing for 0.5min, the solvent composition was changed to 100%
A within 0.1min and hold until 5min at a flow rate of 800µL/min. To minimize
contamination of the mass spectrometer, the column flow was directed only from 3.0
to 4.0min into the mass spectrometer using a divert valve. Otherwise methanol with a
flow rate of 200µL/min was delivered into the mass spectrometer. The ion source
was operated in the positive ion-mode using the following settings: Ion spray 3500V,
sheath gas 53, aux gas 14, sweep gas 3 and aux gas heater temperature of 250°C.
Capillary temperature was set to 269°C and the S-lens RF level to 55. Data were
collected from 3.0 to 4.0min in the targeted MS2 mode with the following settings:
Resolution 35,000, AGC target: 5e5, maximum IT 100ms with a multiplex of 2 and
quadrupole isolation window of 0.8 m/z. Data analysis was performed with
TraceFinder 3.1 Clinical (Thermo Fisher Scientific), a software module which extracts
target ions (Table 1) within ±5ppm mass window, generates calibration lines (Figures
S-4 to S-7), checks quality controls and ion ratios of quantifier to qualifier ions (Table
1).
Method validation
Method validation was performed on the basis of the FDA (18) and EMA (19)
guidelines on bioanalytical method validation (for details see Supplemental Data).
Results
by guest, on August 30, 2018
ww
w.jlr.org
Dow
nloaded from

Liebisch et. al 25-OH-vitamin D quantification by LC-MS/HRMS 9
Aim of the current study was to develop an accurate and fast method for the
quantification of 25(OH)D species by LC-MS/HR-MS using a quadrupole-Orbitrap
hybrid mass spectrometer. A core-shell pentafluorophenyl column with polar and
aromatic selectivity was selected to separate the isobaric 3β-25(OH)D and 3α-
25(OH)D (= epi) isomers as described in previous studies (7). We could achieve
almost base-line separation of 25(OH)D3 and 3-epi-25(OH)D3 as well as 25(OH)D2
and 3-epi-25(OH)D2 within a run-time of 5min (Figure 1A). Due to the fact that HR-
MS offers increased specificity compared to unit resolution usually provided by
quadrupoles, [M+H-H2O]+ ions were selected as sensitive fragment ions for all
analytes (Table 1). During first tests including the internal standards (IS) D6-
25(OH)D3 and D6-25(OH)D2 an immediate drop of the signal was recorded for 3-epi-
25(OH)D3 (Figure S-1). Product ion spectra displayed a mass shift for the m/z 383
product ion beyond the 5ppm mass window of the [25(OH)D3+H-H2O]+ from 3.68min
to 3.70min (Figures S-1 and S-2). An increase of the mass resolution settings from
17,500 to 35,000 separated two ions m/z 383.3314 [M+H-H2O]+ of 25(OH)D3 and m/z
383.3585 [M+H-2H2O]+ of D6-25(OH)D2 resulting from an in-source fragmentation
(Table S-1 and Figure S-3). With mass resolution setting 35,000 no signal drop could
be observed for 3-epi-25(OH)D3 (Figure S-3).
Specificity and matrix effects
The specificity of the method was investigated using qualifier ions (Table 1) in six
different patient samples including potential interferences from hemolysis, icterus and
lipemia. 25(OH)D2, 3-epi-25(OH)D2 were not present in the tested patient samples
above LoQ and 3-epi-25(OH)D3 was present below or close to LoQ. Therefore, these
analytes were evaluated only in spiked samples while 25(OH)D3 specificity was also
checked in unspiked samples. The ion ratios quantifier/qualifier correspond to those
by guest, on August 30, 2018
ww
w.jlr.org
Dow
nloaded from

Liebisch et. al 25-OH-vitamin D quantification by LC-MS/HRMS 10
of authentic standards with a maximum deviation of ±15% for all analytes (except for
one sample with a low concentration of 25(OH)D3 and the low spike of 25(OH)D2;
data not shown). Moreover, ion ratios are evaluated for all patient samples during
routine diagnostic with an acceptance criterion of ±20% as the maximum relative
deviation. We only observed a failure of the ion ratio criterion for concentrations close
to LoQ due to qualifier intensities at or below LoD (signal dropout of qualifier ions was
partly due to a mass shift outside of the 5ppm mass window).
Similarly, matrix effects were evaluated in patient samples with potential
interferences at low and high spike concentrations. For all patient samples the IS-
normalized matrix factor was within a window 100±15% (data not shown).
Calibration
D6-25(OH)D3 was used as IS for 25(OH)D3 and D6-25(OH)D2 was used for
25(OH)D2, 3-epi-25(OH)D3 and 3-epi-25(OH)D2. Linear calibration lines were found
for all analytes within the analyzed range (Table 1). Calibration lines were weighted
1/x and back calculated concentrations were found within ±15% of the nominal
values (Figures S-4 to S-7).
Limit of quantification (LoQ)
Determination of LoQ for LC-MS/MS usually involves calculation of signal to noise
ratios. Due to its high specificity we did not observe baseline noise in LC-MS/HR-MS
for 25(OH)D species. Therefore, LoQ was determined by functional testing with serial
dilutions of control and calibrator samples (Figure S-8). LoQ for all analytes were
found below 10nmol/l (Table 1). Typically, signals below the LoQ showed signal drop-
outs due to reduced mass precision and target masses outside the 5ppm mass
window as shown for 25(OH)D2 (Figure 1B).
by guest, on August 30, 2018
ww
w.jlr.org
Dow
nloaded from

Liebisch et. al 25-OH-vitamin D quantification by LC-MS/HRMS 11
Imprecision and trueness
Commercial serum controls traceable to NIST 972a reference material were used to
evaluate imprecision and trueness including a low level prepared by dilution with
physiological human albumin solution. For medium and high levels CVs were below
10% and trueness between 90 and 110% for all analytes (Table 2). Imprecision and
trueness of the low level control were significantly higher with up to 16% and between
85 and 115%, respectively. The low level of 3-epi-25(OH)D2 was below LoQ and
displayed a trueness of about 130%. A serum pool, used as a quality control during
routine analysis for 25(OH)D3 (mean 55.5 nmol/l) and 3-epi-25(OH)D3 (mean 3.33
nmol/l), showed an impressive between-run precision (n=10) of 3.9% and 3.8% CV,
respectively. Results obtained for 10 samples of the Vitamin D External Quality
Assessment Scheme (DEQAS) analyzed by NIST reference methods were in good
agreement with LC-MS/HR-MS concentrations (Table S-2).
Epimer fractions in patient samples
The fraction of 3-epi-25(OH)D3 related to total 25(OH)D was calculated in patient
samples submitted to routine diagnostics at the University Hospital Regensburg
(Figure 2). As expected children below 1 year displayed the highest fraction with a
median of 14% and a maximum over 30% (Figure 2A). An age-dependent decrease
was observed with a median of 4.3% in adult patients. 3-epi-25(OH)D3
concentrations above LoQ were detected in about 60% of the samples of adult
patients and more the 10% of these samples contained a 3-epi-25(OH)D3 fraction
above 10% of total 25(OH)D (Figure 2B).
by guest, on August 30, 2018
ww
w.jlr.org
Dow
nloaded from

Liebisch et. al 25-OH-vitamin D quantification by LC-MS/HRMS 12
Discussion
Here we present a fast and accurate method for the quantification of 25(OH)D
species using LC-MS/HR-MS. Two studies showed an increased analytical response
of 3-epi-25(OH)D3 compared to 25(OH)D3 (11;12). Consequently, only
chromatographic separation of these isobaric analytes avoids overestimation of
25(OH)D3 concentrations in samples with significant 3-epi-25(OH)D3 fractions. Our
method has a run-time of 5min which is acceptable for routine analysis and
comparable to the fastest published methods by van den Ouweland et al. with 6.5min
(20) and 5min (11). Moreover, since only a 1min-window of the LC-run was
introduced into the mass spectrometer, a multiplexing of LC-channels may increase
the throughput up to 5-fold.
The standard instruments for tandem mass spectrometric quantitation are triple-
quadrupole instruments which offer unit mass resolution. In this study, we used a
hybrid instrument quadrupole-Orbitrap which offers high mass resolution with up to
140,000 at m/z 200. Based on their high specificity these instruments have also been
applied in full scan or targeted selected ion monitoring (SIM) (15). We tested these
analysis modes together with MS/HR-MS (data not shown). However, despite high
mass resolution, SIM displayed base line noise and unspecific signals comparable to
the data by Bruce et al. (15). Therefore, we decided to used MS/HR-MS with a mass
resolution setting of 35,000 that permits separation of quasi-isobaric product ions at
m/z 383 generated from 25(OH)D3 and D6-25(OH)D2 (Figure S-3). Without high mass
resolution D6-25(OH)D2 may interfere with 25(OH)D3 isomers in case of a co-elution
(7). Consequently, analysis by low mass resolution instruments requires either an
alternative (potentially more expensive) IS for 25(OH)D2 like D3-25(OH)D2, other
fragment ions or has to avoid co-elution of D6-25(OH)D2 and 25(OH)D3 isomers. HR-
by guest, on August 30, 2018
ww
w.jlr.org
Dow
nloaded from
Liebisch et. al 25-OH-vitamin D quantification by LC-MS/HRMS 13
MS permits the use of [25(OH)D+H-H2O]+ fragment ions which are prominent and
therefore sensitive but generally considered as unspecific. However, in our
experiments the extracted ion chromatograms of MS/HR-MS spectra contain no
baseline noise which impressively demonstrates the specificity of the method. Thus,
LoQ has to be evaluated by functional testing but not by signal to noise measurement
(Figure S-8). LoQ for all analytes is below 10nmol/l and sufficient for testing of the
vitamin D status. Moreover, the presented LC-MS/HR-MS method exhibits LoQs for
25(OH)D comparable to that reported from triple quadrupole instruments in the lower
nmolar range (7;13).
The fraction of epimer detected in patients of the University Hospital Regensburg fits
very well to literature data (13;14). Previous studies observed a median of 3 to 6% of
the 3-epi-25(OH)D3-fraction in adult patients which is in good agreement to 4.3%
found in our patients (Figure 2B).
In conclusion, the presented method shows for the first time the feasibility of LC-
MS/HR-MS for small molecule quantification in laboratory routine testing. The high
specificity of this technique may be also useful for other analytes as for example
steroid hormone quantification.
Acknowledgement
We thank Simone Düchtel and Doreen Müller for expert technical assistance.
by guest, on August 30, 2018
ww
w.jlr.org
Dow
nloaded from

Liebisch et. al 25-OH-vitamin D quantification by LC-MS/HRMS 14
References
1. Pludowski, P., M. F. Holick, S. Pilz, C. L. Wagner, B. W. Hollis, W. B. Grant, Y.
Shoenfeld, E. Lerchbaum, D. J. Llewellyn, K. Kienreich, and M. Soni. 2013. Vitamin D effects on musculoskeletal health, immunity, autoimmunity, cardiovascular disease, cancer, fertility, pregnancy, dementia and mortality-a review of recent evidence. Autoimmun. Rev. 12: 976-989
2. Enko, D., L. Fridrich, E. Rezanka, R. Stolba, J. Ernst, I. Wendler, F. Daniel, S. Hauptlorenz, and G. Halwachs-Baumann. 2014. 25-hydroxy-Vitamin D status: limitations in comparison and clinical interpretation of serum-levels across different assay methods. Clin. Lab 60: 1541-1550
3. Su, Z., S. N. Narla, and Y. Zhu. 2014. 25-Hydroxyvitamin D: analysis and clinical application. Clin. Chim. Acta 433: 200-205
4. Cavalier, E., P. Lukas, Y. Crine, S. Peeters, A. Carlisi, G. C. Le, R. Gadisseur, P. Delanaye, and J. C. Souberbielle. 2014. Evaluation of automated immunoassays for 25(OH)-vitamin D determination in different critical populations before and after standardization of the assays. Clin. Chim. Acta 431: 60-65
5. Heijboer, A. C., M. A. Blankenstein, I. P. Kema, and M. M. Buijs. 2012. Accuracy of 6 routine 25-hydroxyvitamin D assays: influence of vitamin D binding protein concentration. Clin. Chem. 58: 543-548
6. Wallace, A. M., S. Gibson, H. A. de la, C. Lamberg-Allardt, and M. Ashwell. 2010. Measurement of 25-hydroxyvitamin D in the clinical laboratory: current procedures, performance characteristics and limitations. Steroids 75: 477-488
7. van den Ouweland, J. M., M. Vogeser, and S. Bacher. 2013. Vitamin D and metabolites measurement by tandem mass spectrometry. Rev. Endocr. Metab Disord. 14: 159-184
8. Tai, S. S., M. Bedner, and K. W. Phinney. 2010. Development of a candidate reference measurement procedure for the determination of 25-hydroxyvitamin D3 and 25-hydroxyvitamin D2 in human serum using isotope-dilution liquid chromatography-tandem mass spectrometry. Anal. Chem. 82: 1942-1948
9. Stepman, H. C., A. Vanderroost, U. K. Van, and L. M. Thienpont. 2011. Candidate reference measurement procedures for serum 25-hydroxyvitamin D3 and 25-hydroxyvitamin D2 by using isotope-dilution liquid chromatography-tandem mass spectrometry. Clin. Chem. 57: 441-448
10. Phinney, K. W., M. Bedner, S. S. Tai, V. V. Vamathevan, L. C. Sander, K. E. Sharpless, S. A. Wise, J. H. Yen, R. L. Schleicher, M. Chaudhary-Webb, C. M. Pfeiffer, J. M. Betz, P. M. Coates, and M. F. Picciano. 2012. Development and certification of a standard reference material for vitamin D metabolites in human serum. Anal. Chem. 84: 956-962
by guest, on August 30, 2018
ww
w.jlr.org
Dow
nloaded from
Liebisch et. al 25-OH-vitamin D quantification by LC-MS/HRMS 15
11. van den Ouweland, J. M., A. M. Beijers, and D. H. van. 2014. Overestimation of
25-hydroxyvitamin D3 by increased ionisation efficiency of 3-epi-25-hydroxyvitamin D3 in LC-MS/MS methods not separating both metabolites as determined by an LC-MS/MS method for separate quantification of 25-hydroxyvitamin D3, 3-epi-25-hydroxyvitamin D3 and 25-hydroxyvitamin D2 in human serum. J. Chromatogr. B Analyt. Technol. Biomed. Life Sci. 967: 195-202
12. Flynn, N., F. Lam, and A. Dawnay. 2014. Enhanced 3-epi-25-hydroxyvitamin D3 signal leads to overestimation of its concentration and amplifies interference in 25-hydroxyvitamin D LC-MS/MS assays. Ann. Clin. Biochem. 51: 352-359
13. Bailey, D., K. Veljkovic, M. Yazdanpanah, and K. Adeli. 2013. Analytical measurement and clinical relevance of vitamin D(3) C3-epimer. Clin. Biochem. 46: 190-196
14. Cashman, K. D., M. Kinsella, J. Walton, A. Flynn, A. Hayes, A. J. Lucey, K. M. Seamans, and M. Kiely. 2014. The 3 epimer of 25-hydroxycholecalciferol is present in the circulation of the majority of adults in a nationally representative sample and has endogenous origins. J. Nutr. 144: 1050-1057
15. Bruce, S. J., B. Rochat, A. Beguin, B. Pesse, I. Guessous, O. Boulat, and H. Henry. 2013. Analysis and quantification of vitamin D metabolites in serum by ultra-performance liquid chromatography coupled to tandem mass spectrometry and high-resolution mass spectrometry--a method comparison and validation. Rapid Commun. Mass Spectrom. 27: 200-206
16. Abdel-Khalik, J., P. J. Crick, G. D. Carter, H. L. Makin, Y. Wang, and W. J. Griffiths. 2014. Studies on the analysis of 25-hydroxyvitamin D(3) by isotope-dilution liquid chromatography-tandem mass spectrometry using enzyme-assisted derivatisation. Biochem. Biophys. Res. Commun. 446: 745-750
17. Midttun, O. and P. M. Ueland. 2011. Determination of vitamins A, D and E in a small volume of human plasma by a high-throughput method based on liquid chromatography/tandem mass spectrometry. Rapid Commun. Mass Spectrom. 25: 1942-1948
18. US FDA (2001) Guidance for Industry: Bioanalytical Method Validation.
19. European Medicines Agency - Committee for Medicinal Products for Human Use (CHMP) (2014) Guideline on bioanalytical method validation.
20. van den Ouweland, J. M., A. M. Beijers, and D. H. van. 2011. Fast separation of 25-hydroxyvitamin D3 from 3-epi-25-hydroxyvitamin D3 in human serum by liquid chromatography-tandem mass spectrometry: variable prevalence of 3-epi-25-hydroxyvitamin D3 in infants, children, and adults. Clin. Chem. 57: 1618-1619
by guest, on August 30, 2018
ww
w.jlr.org
Dow
nloaded from

Liebisch et. al 25-OH-vitamin D quantification by LC-MS/HRMS 16
Figure legends
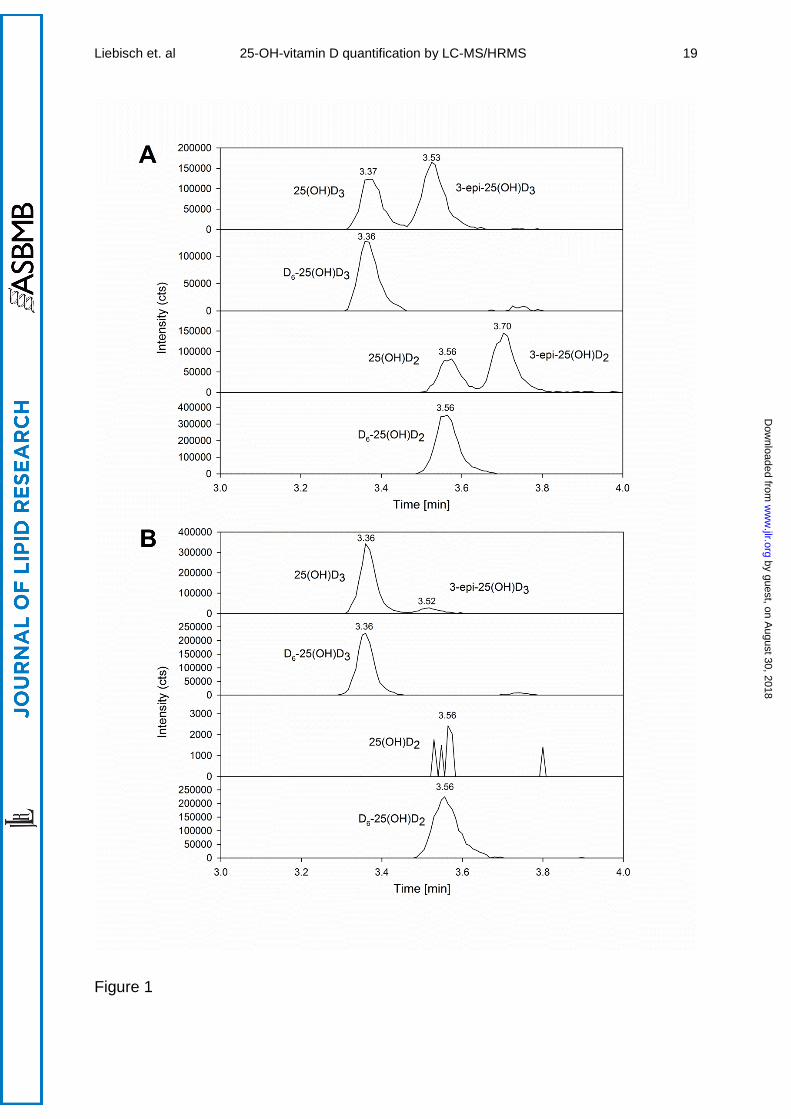
Figure 1: Chromatogram of 25-OH-vitamin D isomers
Extracted ion chromatograms (unsmoothed; quantifier ions as displayed in Table 1)
are shown for A) a quality control sample (medium level, see Table 2) and for B) a
typical patient sample (the following concentrations were calculated: 60.9nmol/l
25(OH)D3, 7.8nmo/l 3-epi-25(OH)D3 and 0.8nmol/l 25(OH)D2, which is below LoQ).
Figure 2: Fraction of 3-epi-25(OH)D3 in patient samples
The fraction of 3-epi-25(OH)D3 of 25(OH)D is calculated for 364 patient samples sent
for 25(OH)D analysis. A) Age-dependent fraction of 3-epi-25(OH)D3 in patients below
one year, from 1 to 5 years, older than 5 to 18 years and adult patients older 18
years. B) Fraction of adult patients with 3-epi-25(OH)D3 fraction below LoQ, up to
5%, 5 to 10%, 10 to 15% and above 15% of total 25(OH)D.
by guest, on August 30, 2018
ww
w.jlr.org
Dow
nloaded from
Liebisch et. al 25-OH-vitamin D quantification by LC-MS/HRMS 17
Analyt Mass transitions
Quantifier [m/z]
Mass transitions
qualifier [m/z]
IS Calibration
range [nmol/l]
LoQ
[nmol/l]
25(OH)D3 401.34 > 383.3314 401.34 > 365.3208 D6-25(OH)D3 5.6 - 420 5.6
25(OH)D2 413.34 > 395.3314 413.34 > 377.3208 D6-25(OH)D2 7.3 - 320 7.3
3-epi-25(OH)D3 401.34 > 383.3314 401.34 > 365.3208 D6-25(OH)D2 2.1 - 320 2.1
3-epi-25(OH)D2 413.34 > 395.3314 413.34 > 377.3208 D6-25(OH)D2 7.0 - 460 7.0
D6-25(OH)D3 407.38 > 389.3691 407.38 > 371.3585 - -
D6-25(OH)D2 419.38 > 401.3691 419.38 > 383.3585 - -
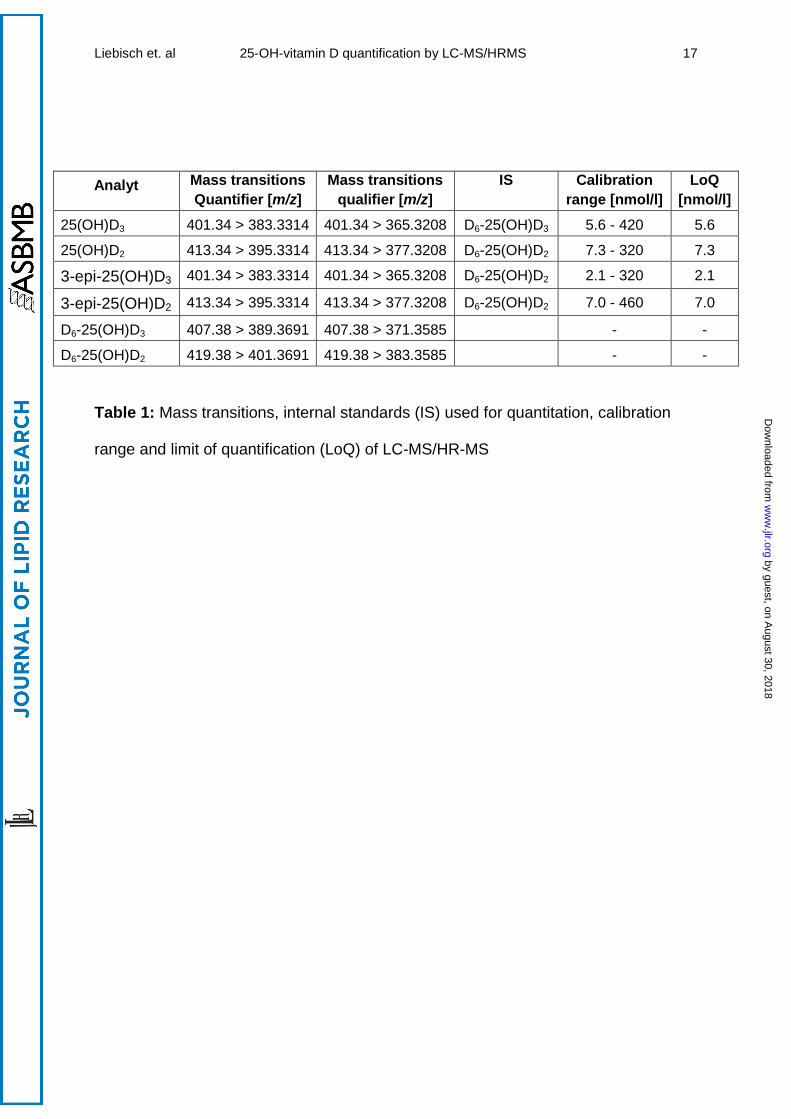
Table 1: Mass transitions, internal standards (IS) used for quantitation, calibration
range and limit of quantification (LoQ) of LC-MS/HR-MS
by guest, on August 30, 2018
ww
w.jlr.org
Dow
nloaded from
Liebisch et. al 25-OH-vitamin D quantification by LC-MS/HRMS 18
Analyt Level Target
[nmol/ml]
Within-run
trueness [%]
Within-run
CV [%]
Between-run
trueness [%]
Between-
run CV [%]
25(OH)D3 low 8.9 115.2 7.4 99.6 13.6
medium 44.5 107.4 3.9 101.0 2.3
high 112 105.8 2.8 102.6 5.2
25(OH)D2 low 8.02 107.2 9.7 85.7 16.0
medium 40.1 101.8 2.8 97.3 4.4
high 89.7 101.5 4.3 103.4 2.5
3-epi-25(OH)D3 low 6.86 100.5 7.8 106.1 11.1
medium 34.3 100.2 1.1 99.6 3.2
high 57.3 104.0 3.2 98.7 3.0
3-epi-25(OH)D2 low 6.16 132.6 8.5 133.7 11.7
medium 30.8 98.6 4.2 95.6 6.1
high 51.5 99.9 2.1 95.9 3.2
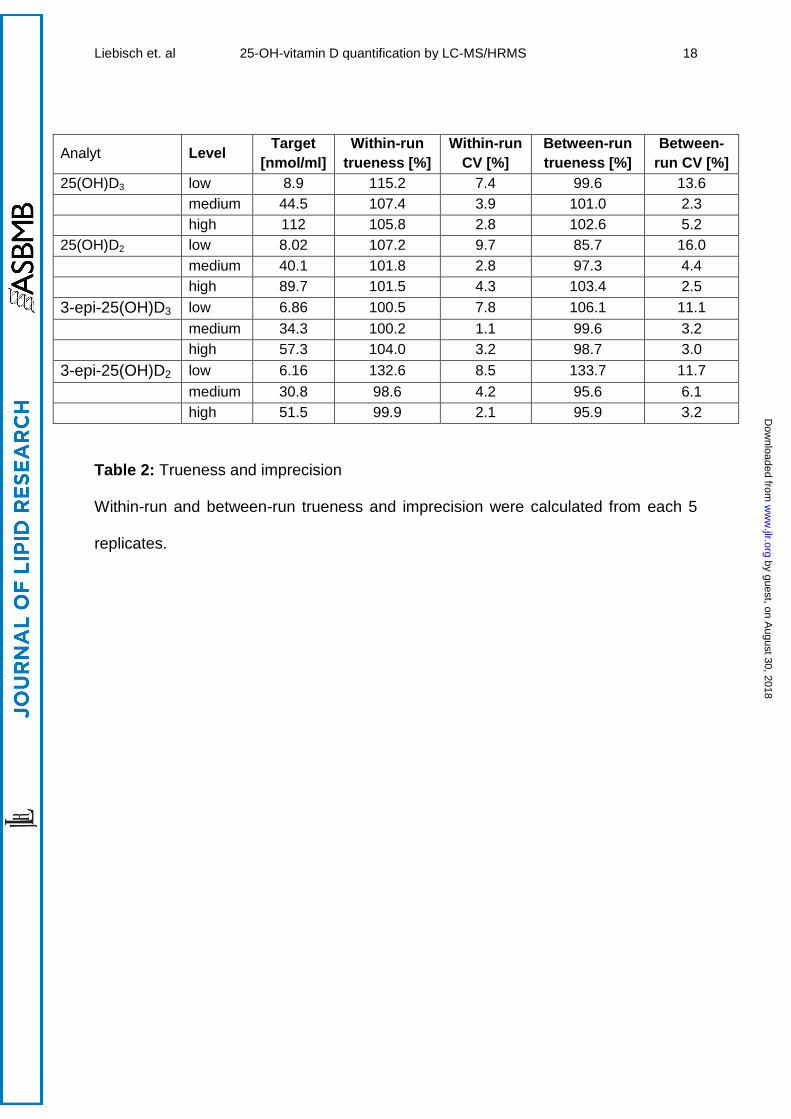
Table 2: Trueness and imprecision
Within-run and between-run trueness and imprecision were calculated from each 5
replicates.
by guest, on August 30, 2018
ww
w.jlr.org
Dow
nloaded from
Liebisch et. al 25-OH-vitamin D quantification by LC-MS/HRMS 19
Figure 1
by guest, on August 30, 2018
ww
w.jlr.org
Dow
nloaded from

Liebisch et. al 25-OH-vitamin D quantification by LC-MS/HRMS 20
Figure 2
by guest, on August 30, 2018
ww
w.jlr.org
Dow
nloaded from