Accurals quality and price synchronicity
104
Louisiana State University LSU Digital Commons LSU Doctoral Dissertations Graduate School 2009 Accurals quality and price synchronicity Joseph Atkins Johnston Louisiana State University and Agricultural and Mechanical College Follow this and additional works at: hps://digitalcommons.lsu.edu/gradschool_dissertations Part of the Accounting Commons is Dissertation is brought to you for free and open access by the Graduate School at LSU Digital Commons. It has been accepted for inclusion in LSU Doctoral Dissertations by an authorized graduate school editor of LSU Digital Commons. For more information, please contact[email protected]. Recommended Citation Johnston, Joseph Atkins, "Accurals quality and price synchronicity" (2009). LSU Doctoral Dissertations. 106. hps://digitalcommons.lsu.edu/gradschool_dissertations/106
Transcript of Accurals quality and price synchronicity

Louisiana State UniversityLSU Digital Commons
LSU Doctoral Dissertations Graduate School
2009
Accurals quality and price synchronicityJoseph Atkins JohnstonLouisiana State University and Agricultural and Mechanical College
Follow this and additional works at: https://digitalcommons.lsu.edu/gradschool_dissertations
Part of the Accounting Commons
This Dissertation is brought to you for free and open access by the Graduate School at LSU Digital Commons. It has been accepted for inclusion inLSU Doctoral Dissertations by an authorized graduate school editor of LSU Digital Commons. For more information, please [email protected].
Recommended CitationJohnston, Joseph Atkins, "Accurals quality and price synchronicity" (2009). LSU Doctoral Dissertations. 106.https://digitalcommons.lsu.edu/gradschool_dissertations/106

ACCRUALS QUALITY AND PRICE SYNCHRONICITY
A Dissertation
Submitted to the Graduate Faculty of the Louisiana State University and
Agricultural and Mechanical College in partial fulfillment of the
requirements for the degree of Doctor of Philosophy
in
The Department of Accounting
by
Joseph Atkins Johnston B.S., Louisiana Tech University, 2001
M.P.A., Louisiana Tech University, 2002
August 2009

ii
DEDICATION
I dedicate this dissertation to the three women who have influenced my life the most. First
is my late mother whose memory reminds me to smile every once and a while. Second I dedicate
this to my wonderful wife who supported me while going through the doctoral program. I would
have never made it through this without her. Lastly, I dedicate this to my daughter who was born
while writing this dissertation.

iii
ACKNOWLEDGMENTS
I would like to acknowledge the efforts of my dissertation committee, Dr. C.S. Agnes
Cheng, my chair, Dr. Joey Legoria, Dr. J.C. Lin, and Dr. Carter Hill. I especially appreciate the
guidance and wisdom I have gained from Dr. Cheng. She opened my eyes to a different level of
performing research and her efficiency in performing research is simply amazing.
I would also acknowledge the efforts of some of the professors I have had the honor to
work with but who are no longer at Louisiana State University. Dr. Jeff Boone encouraged me to
come to LSU and I learned a great deal from him. I had the pleasure of taking seminars under Dr.
Kenny Reynolds and Dr. Tim Louwers. Both of them encouraged me to aim high in my research
activities.
While they were not involved in my graduate studies, I would like to acknowledge the
support of Tucker Smathers, Dr. and Mrs. Cooksie, and other friends of my mother who help me
financially through my undergraduate program. Without their help, I would not have been able to
complete my bachelor’s degree, let alone my doctorate. I am eternally indebted to them.

iv
TABLE OF CONTENTS
DEDICATION ................................................................................................................................ ii
ACKNOWLEDGMENTS ............................................................................................................. iii
ABSTRACT ................................................................................................................................... vi
1. INTRODUCTION .................................................................................................................. 1
2. BACKGROUND AND LITERATURE REVIEW ................................................................ 9
2.1 The Theory of Price Synchronicity .................................................................................. 9 2.2 Accruals Quality ............................................................................................................. 11 2.3 Theory on the Market Consequences of Improved Earnings Quality ............................ 13
2.4 Empirical Findings on the Market Consequences of Improved Accruals Quality ......... 19
2.5 Empirical Findings Related To Price Synchronicity ...................................................... 21
2.6 Analyst Information ....................................................................................................... 24
3. HYPOTHESES ..................................................................................................................... 27 3.1 The Components of R2 ................................................................................................... 27
3.2 Accruals Quality and Price Synchronicity ..................................................................... 28 3.3 Innate and Discretionary Components of Accruals Quality and Price Synchronicity ... 31
3.4 Accruals Quality, Price Synchronicity and Analyst Following ..................................... 33
4. DATA MEASURES AND SAMPLE................................................................................... 35 4.1 Variable Measurement ................................................................................................... 35
4.1.1 Accruals Quality ........................................................................................................ 35 4.1.2 Price Synchronicity ................................................................................................... 36 4.1.3 Controls ..................................................................................................................... 37
4.2 Sample Description ........................................................................................................ 40
5. EMPIRICAL ANALYSIS .................................................................................................... 46 5.1 The Relation between Accruals Quality and Price Synchronicity ................................. 46
5.2 The Relation between the Components of Accruals Quality and Price Synchronicity .. 50
6. SENSITIVITY AND ADDITIONAL ANALYSIS .............................................................. 55
6.1 Alternative Measures of Accruals Quality ..................................................................... 55 6.1.1 Longer Horizon for Accruals Quality ....................................................................... 55 6.1.2 Abnormal Accruals as a Measure of Accruals Quality ............................................. 60
6.2 Endogeneity of Accruals Quality ................................................................................... 65 6.3 Synchronicity to Fama And French (1993) Three Factor Model ................................... 66
6.4 Regulation Fair Disclosure ............................................................................................. 69 6.5 Market Beta as a Control Variable ................................................................................. 79 6.6 Analyst Forecast Dispersion .......................................................................................... 82 6.7 Further Investigation of Analyst Following ................................................................... 83
7. SUMMARY AND CONCLUSION ..................................................................................... 87
REFERENCES ............................................................................................................................. 90

v
APPENDIX: VARIABLE DEFINITIONS .................................................................................. 96
VITA ............................................................................................................................................. 97
vi
ABSTRACT
This study examines the relation between accruals quality and price synchronicity, a
measure of the relative amount of firm-specific information reflected in price. Higher accruals
quality imply better quality earnings news, hence, more firm-specific information is incorporated
into price for firms with higher accruals quality. More firm-specific information reduces price
synchronicity, hence, we hypothesize a negative relation between accruals quality and price
synchronicity. On the other hand, literature shows that accruals quality reduces idiosyncratic
volatility which tends to be negatively correlated with price synchronicity. If the latter effects
dominate the relation between accruals quality and price synchronicity, we should observe a
positive relationship between accruals quality and price synchronicity. Controlling for
idiosyncratic volatility, we find a significant negative relation between accruals quality and price
synchronicity after controlling for idiosyncratic volatility. We investigate this further by
partitioning the sample by analyst following. If earnings information complements analysts’
information, we expect to find a stronger negative relation between accruals quality and price
synchronicity for firms that are followed by analysts. If, on the other hand, earnings information
and analysts’ information are substitutes, we expect to find a stronger negative relation between
accruals quality and price synchronicity for those firms that are not followed by analysts. We
find that accruals quality has a greater impact on price synchronicity for firms with an analyst
following compared to firm that do not have an analyst following. This is consistent with the
notion that earnings information complements analyst information.

1
1. INTRODUCTION
This dissertation investigates the association between accruals quality (a measure of
uncertainty contained in accruals in predicting future cash flows) and price synchronicity (a
measure of the relative amount of firm-specific information reflected in price). We propose that
high accruals quality reduces uncertainty contained in earnings in predicting future cash flows,
accordingly, price should reflect more firm-specific information for firms with higher accruals
quality. In an economy where firms have diverse firm-specific information, firms with relatively
more firm-specific information will have a lower correlation between firm returns and market or
industry returns (i.e. lower price synchronicity). Hence, this study predicts firms with higher
accruals quality will lead to less price synchronicity due to relatively more firm-specific
information being impounded into price.
Development of measuring accruals quality has come a long way. Earnings management
literature suggests that managers will manage accruals opportunistically. The managed accruals
(i.e. discretionary accruals) decrease earnings quality. Studies differ in measuring the
discretionary accruals (Dechow et al. 1995; Jones 1991; DeAngelo et al. 1994; Healy 1985).
Dechow and Dichev (2002, DD) suggest high quality accruals should reduce the uncertainty of
predicting cash flows and develop a measure reflecting variation of accruals that are not mapped
into cash flows. This measure has been used by many studies in investigating quality of
accounting information and market factors. An especially important study is Francis et al. (2004)
who find that DD’s accruals quality measure has the largest cost of equity capital effects relative
to other accounting and market based earnings attributes. Following Francis et al. (2004; 2005),
many studies use DD’s accruals quality measure. Accordingly, this study also focuses our results
using DD’s accruals quality measure.

2
The findings that high accruals quality reduces cost of capital may be viewed from the
effect of reduced information uncertainty and reduced information asymmetry1. Theoretical
studies (Coles et al. 1995; Easley and O'Hara 2004; Lambert et al. 2007, 2008), in general,
suggest that reduction of information uncertainty (i.e. improved precision) reduces estimation
risk, hence, reduces cost of capital. Some studies (Diamond and Verrecchia 1991; Easley and
O'Hara 2004) also suggest that better disclosure quality reduces information asymmetry which
decreases cost of capital. However, other studies argue that information asymmetry cannot be
priced in a rational expectations setting and the effect of information asymmetry can be
diversified away (Hughes et al. 2007; Lambert et al. 2008). In investigating the underlying
reason for the relation between accruals quality on cost of capital, Bhattacharya, Ecker, Olsson
and Schipper (2007) conclude that information precision drives this relationship. Their results
are consistent with theoretical results of Lambert et al. (2008) who show that the effect of
information on cost of equity capital is driven by the average information precision across
investors rather than information asymmetry per se.
Studies also look at the effect of information quality on idiosyncratic volatility (also
termed as idiosyncratic risk). From the perspective of average information quality, higher
information uncertainty increases idiosyncratic volatility (Pastor and Veronesi 2003), hence, it is
conceivable that higher accruals quality reduces a firm’s idiosyncratic risk. This is documented
by Cohen (2008) and Rajgopal and Venkatachalam (2008). Studies on private information
collection (e.g. Kim and Verrecchia 1991b, 1991a, 1994) show that idiosyncratic volatility may
increase when the precision of an information announcement is high. Accordingly, high accruals
quality will stimulate more trading, hence, increase idiosyncratic volatility. Empirical studies in
1 We refer to information asymmetry as the information asymmetry among investors instead of the information asymmetry between investors and managers. This is in the spirit of the theoretical literature we rely on. (e.g. Easley and O'Hara 2004; Lambert et al. 2008)
3
general find that accruals quality reduces idiosyncratic volatility, consistent with the argument
that high accruals quality increases information precision.
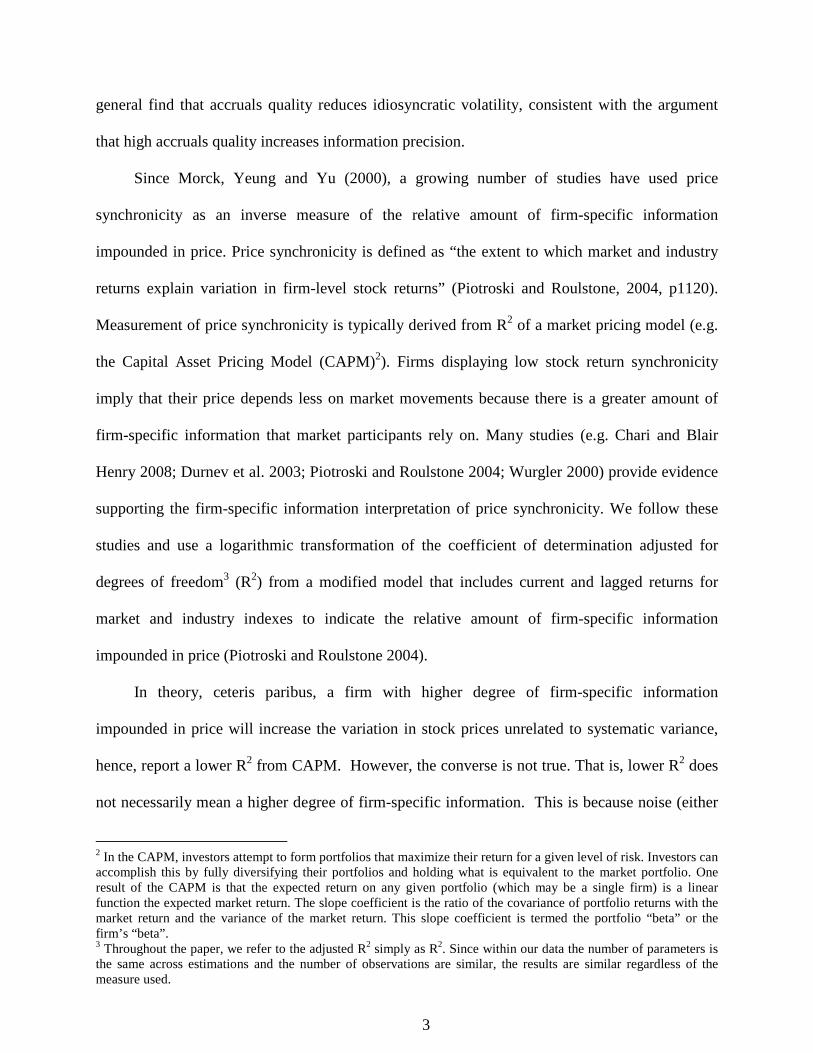
Since Morck, Yeung and Yu (2000), a growing number of studies have used price
synchronicity as an inverse measure of the relative amount of firm-specific information
impounded in price. Price synchronicity is defined as “the extent to which market and industry
returns explain variation in firm-level stock returns” (Piotroski and Roulstone, 2004, p1120).
Measurement of price synchronicity is typically derived from R2 of a market pricing model (e.g.
the Capital Asset Pricing Model (CAPM)2). Firms displaying low stock return synchronicity
imply that their price depends less on market movements because there is a greater amount of
firm-specific information that market participants rely on. Many studies (e.g. Chari and Blair
Henry 2008; Durnev et al. 2003; Piotroski and Roulstone 2004; Wurgler 2000) provide evidence
supporting the firm-specific information interpretation of price synchronicity. We follow these
studies and use a logarithmic transformation of the coefficient of determination adjusted for
degrees of freedom3 (R2) from a modified model that includes current and lagged returns for
market and industry indexes to indicate the relative amount of firm-specific information
impounded in price (Piotroski and Roulstone 2004).
In theory, ceteris paribus, a firm with higher degree of firm-specific information
impounded in price will increase the variation in stock prices unrelated to systematic variance,
hence, report a lower R2 from CAPM. However, the converse is not true. That is, lower R2 does
not necessarily mean a higher degree of firm-specific information. This is because noise (either
2 In the CAPM, investors attempt to form portfolios that maximize their return for a given level of risk. Investors can accomplish this by fully diversifying their portfolios and holding what is equivalent to the market portfolio. One result of the CAPM is that the expected return on any given portfolio (which may be a single firm) is a linear function the expected market return. The slope coefficient is the ratio of the covariance of portfolio returns with the market return and the variance of the market return. This slope coefficient is termed the portfolio “beta” or the firm’s “beta”. 3 Throughout the paper, we refer to the adjusted R2 simply as R2. Since within our data the number of parameters is the same across estimations and the number of observations are similar, the results are similar regardless of the measure used.
4
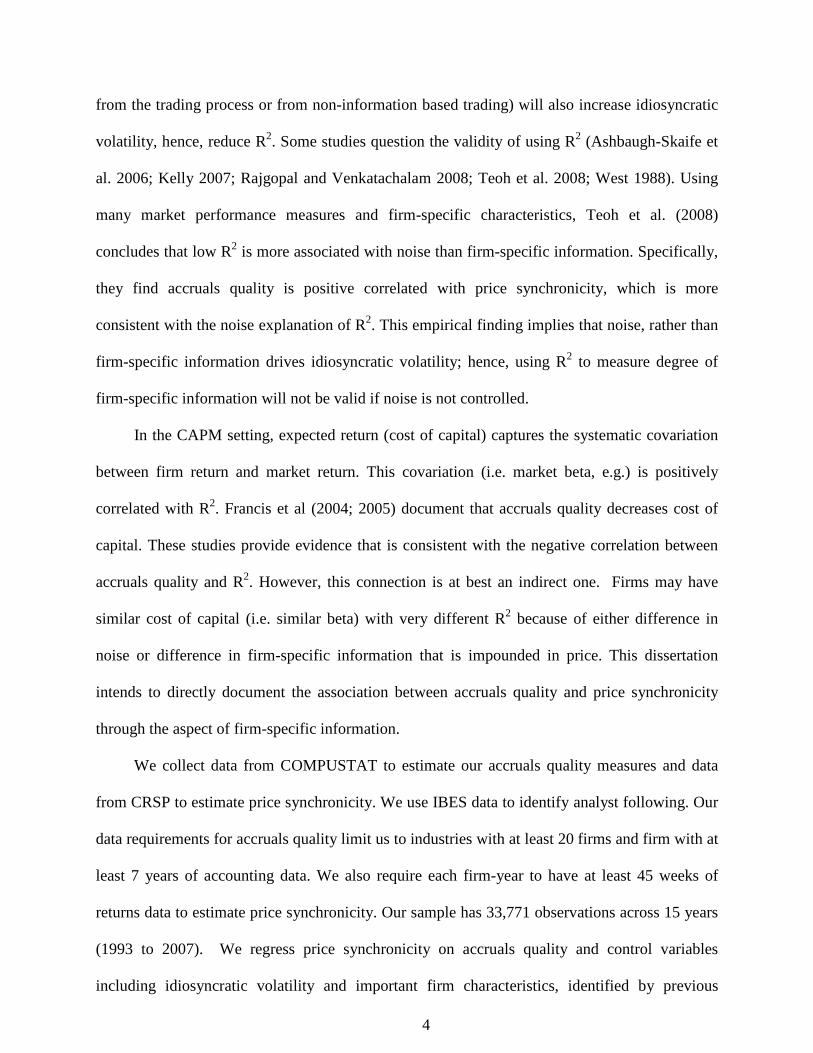
from the trading process or from non-information based trading) will also increase idiosyncratic
volatility, hence, reduce R2. Some studies question the validity of using R2 (Ashbaugh-Skaife et
al. 2006; Kelly 2007; Rajgopal and Venkatachalam 2008; Teoh et al. 2008; West 1988). Using
many market performance measures and firm-specific characteristics, Teoh et al. (2008)
concludes that low R2 is more associated with noise than firm-specific information. Specifically,
they find accruals quality is positive correlated with price synchronicity, which is more
consistent with the noise explanation of R2. This empirical finding implies that noise, rather than
firm-specific information drives idiosyncratic volatility; hence, using R2 to measure degree of
firm-specific information will not be valid if noise is not controlled.
In the CAPM setting, expected return (cost of capital) captures the systematic covariation
between firm return and market return. This covariation (i.e. market beta, e.g.) is positively
correlated with R2. Francis et al (2004; 2005) document that accruals quality decreases cost of
capital. These studies provide evidence that is consistent with the negative correlation between
accruals quality and R2. However, this connection is at best an indirect one. Firms may have
similar cost of capital (i.e. similar beta) with very different R2 because of either difference in
noise or difference in firm-specific information that is impounded in price. This dissertation
intends to directly document the association between accruals quality and price synchronicity
through the aspect of firm-specific information.
We collect data from COMPUSTAT to estimate our accruals quality measures and data
from CRSP to estimate price synchronicity. We use IBES data to identify analyst following. Our
data requirements for accruals quality limit us to industries with at least 20 firms and firm with at
least 7 years of accounting data. We also require each firm-year to have at least 45 weeks of
returns data to estimate price synchronicity. Our sample has 33,771 observations across 15 years
(1993 to 2007). We regress price synchronicity on accruals quality and control variables
including idiosyncratic volatility and important firm characteristics, identified by previous

5
literature, that affect price synchronicity. We find accruals quality is negatively correlated with
price synchronicity, consistent with our prediction that accruals quality increases information
precision which in turn increases firm-specific information. Our findings are robust to using
different accruals quality measures, taking into account the endogeneity of accruals quality
choice, and including the Fama French (1992, 1993) factors in our model to estimate price
synchronicity.
Following Francis et al. (2005) we also examine the association of the innate and
discretionary components of accruals quality with price synchronicity. The innate component
reflects the intrinsic features of a firm related to information uncertainty while the discretionary
component represents noise or firms’ opportunistic choices to either fool the market or to reveal
private information (Francis et al. 2005). Francis et al. (2005) find innate accruals quality largely
explains decreases in cost of capital, similarly, we find that innate accruals quality is consistently
negatively related to price synchronicity. We find little evidence of a negative relation between
the discretionary component of accruals quality and price synchronicity. If managers act
opportunistically and the market is efficient, then we should find no relation between price
synchronicity and discretionary accruals quality. If the market cannot or does not distinguish the
innate and discretionary components of accruals quality, then we should find a negative relation
between price synchronicity and the discretionary component of accruals quality. If managers
use discretionary accruals to convey information, then we should find a positive association
between price synchronicity and the discretionary component of accruals quality. Our results are
consistent with some managers acting opportunistically and others attempting to convey
information or that the market ignores the discretionary component.
We partition the sample into firm-years that have an analyst following at the time of the
earnings announcement and those that do not. If earnings information complements analysts’
information, then accruals quality should be more negatively related to price synchronicity when
6
firms have an analyst following. If earnings information and analysts’ information are
substitutes, then accruals quality should be more negatively related to price synchronicity for
firms that are not followed by analysts. We find that accruals quality is significantly negatively
related to price synchronicity for only the firms that are followed by analysts. When we examine
the innate component of accruals quality, we find that the relation between accruals quality and
price synchronicity is negative for both groups and is more negative for the firms that have an
analyst following. We find the discretionary accruals component tends not to be significantly
different from zero in both groups. Our results suggest that precision in earnings information
complements analysts’ information.
We also test if the relation between accruals quality and price synchronicity is sensitive to
the regulatory changes brought about by Regulation Fair Disclosure (Reg. FD). We find innate
component of accruals quality is more negatively related to price synchronicity in the pre-Reg.
FD period whereas the discretionary component of accruals quality is more negatively related to
price synchronicity in the post-Reg. FD period. The Reg. FD results are consistent with investors
getting firm-specific information that complements earnings information through private
communication with managers. When managers stopped disclosing information via private
communications, the discretionary component of accruals quality conveyed more firm-specific
information than before. Additionally, the Sarbanes-Oxley act (SOX) was past shortly after Reg.
FD. During this period, earnings management via discretionary accruals decreases. Therefore,
the discretionary component likely reflects relatively more firm-specific information in the post-
Reg. FD period.
This dissertation contributes to the growing literature in several aspects. First, we
document the importance of accruals (earnings) quality from the aspect of firm-specific
information. Previous literature has shown accruals quality reduces cost of capital and reduces
idiosyncratic risk. This is the first study (to our best knowledge) to show that higher accruals
7
quality leads to more firm-specific information impounded into price. We show that this is more
than just a manifestation of the the impact of accruals quality and the firm’s CAPM Beta.
Second, concurrent literature reports a positive relationship between accruals quality and R2;
hence, the literature suggests price synchronicity is not a good indicator of firm-specific
information. Conversely, we find lower price synchronicity is associated with higher accruals
quality implying that lower price synchronicity is likely to be a good indicator reflecting more
firm-specific information being impounded into price. We suggest continuing use of price
synchronicity to measure firm-specific information; however, noise should be controlled to get
stable results. Third, we document the difference in the relation between accruals quality and
price synchronicity for firms that are followed by analysts and firms that are not and find
evidence that earnings information is complementary to analysts’ information. This
complementary role implies that analysts can improve information quality especially when firms
improve their reporting quality. Some researchers or policy makers may argue that investors can
rely on intermediaries to improve on earnings information when earnings information is of poor
quality, our results contradicts this conjecture.
The results of this study should be interesting to both academics and regulators. We
provide some evidence consistent with price synchronicity being a measure of the relative
amount of firm-specific information reflected in price. The evidence in the present study adds to
the internal validity of studies using price synchronicity as a measure of firm-specific
information. These studies include investigation of the adoption of International Financial
Reporting Standards, which regulators in the U.S. are interested in, considering the eminent
convergence of U.S. GAAP and international standards.
The rest of the paper continues as follows. Section 2 provides the background and a review
of relevant literature. Section 3 develops our hypotheses. Section 4 describes the sample and

8
section 5 provides the empirical analysis. In Section 6 we provide some sensitivity analysis.
Section 7 provides concluding remarks.

9
2. BACKGROUND AND LITERATURE REVIEW
In this section we review the literature related to the study. We first describe the theory that
underlies price synchronicity. We then discuss the development of accruals quality. Next, we
outline the theory on the market consequence of improved earnings quality. Following that, we
discuss the empirical findings of the market consequences of improved accruals quality. We then
discuss the empirical findings related to price synchronicity and its current application in
accounting research. We end with a discussion of earnings quality and analysts information.
2.1 The Theory of Price Synchronicity
In this subsection we describe the theory that underlies price synchronicity developed in
prior literature. We first define price synchronicity. We then explain how price synchronicity
captures the relative degree of firm-specific information impounded in prices.
Consistent with Durnev et al. (2003), Piotroski and Roulstone (2004) define stock return
synchronicity4 as “the extent to which market and industry returns explain variation in firm-level
stock returns” (pg 1120). Morck et al. (2000) attributes the idea that the lack of explanatory
power indicates more firm-specific information to Roll (1988). They note: “as Roll (1988) makes
clear, the extent to which stocks move together depends on the relative amounts of firm-level and
market-level information capitalized into stock prices” (pg 216). We use Piotroski and
Roulstone’s definition and note that the explanatory power of market and industry indexes
captures the relative amount of market, industry and firm-specific information impounded into
prices.
While price synchronicity generally includes a market and an industry index, the logic
behind the use of price synchronicity as a measure of firm-specific information can be shown in
using the general case where firm returns are determined by multiple non-diversifiable factor and
4 We use the terms stock return synchronicity and price synchronicity interchangeably.

10
firm-specific characteristics. The firm’s risk premium5 (the firm return above the return on a risk
free asset) can be represented as6:
* *, , ,i t i t i i t i tr xβ λ γ ω= + + (1)
where *,i tr is firm i's risk premium, iβ is a vector of the firm's exposure to systematic risk factors,
*tλ is a vector of factor risk premiums, iγ is a vector of coefficients, ,i tx is a vector of firm-
specific characteristics7 and ,i tω is noise generated by the trading process. Under the CAPM,
there is only one risk factor, market risk, and0γ = . To the extent that a particular asset pricing
model8 is miss-specified, the error term from the estimation of the pricing model collects
everything that is not contained in the model (i.e. # #, , ,i t i t i i t i txε β λ γ ω= + + where # #
i tβ λ are the
risk factors and loadings that should be included in the model but are not and ,i tε is the error term
from the asset pricing model).
One argument for using R2 as a measure of firm-specific information is based on the
omitted variables ( ,i tx ). If we assume that all relevant economic risk factors are included in our
model but the firm lambda are not zero, the error term from the asset pricing model (,i tε )
contains unobservable firm-specific factors. As relatively more of the firm-specific factors are
incorporated into prices, the market beta is lower in magnitude and the lambda increase in
magnitude. The increase in lambda increases the variance of the pricing model error which
5 The theoretical literature on does not focus exclusively on firm risk premium per se, but uses related constructs such as current price or the cost of equity capital. While these construct differ, the implications for the effect of accruals quality on price synchronicity are similar. 6 Hughes et al. (2007) presents similar model as a generic empirical specification for firm risk premium. 7 The firm-specific characteristics could be public information (such as the firms reported earnings) or it could be private information (such as the results of the firm’s research and development activities). Public information can be observed by anyone, whereas private information is only revealed through prices. In this respect, private information will always be an omitted variable. 8 The asset pricing model could be the CAPM or it could be model that uses risk factors as explanatory variables. The particular pricing model commonly employed in the price synchronicity literature use a market index and an industry index.

11
decreases R2. Further, the decrease in the market beta decreases the variance of the predicted
value, which also decreased R2.
As Roll (1988) notes, one problem with interpreting R2 as a measure of firm-specific
information arises because there is no easy way to separate the omitted variables from the error
that is truly noise. While the omitted firm level variables can lead to deviations from the pricing
model prediction, higher noise also increases the observed error which leads to the interpretation
that lower R2 is more a measure of noise rather than firm-specific information. Later we will
discuss the empirical results that lend evidence to each interpretation.
2.2 Accruals Quality
In this subsection, we discuss the development of accruals quality. We begin with an
example of accruals error. We then describe the Dechow and Dichev (2002) measure of accruals
quality. We end with a description the innate and discretionary components of accruals quality.
When a firm makes a sale, the revenue is recorded in the year in which the merchandise is
sold. If the customer pays cash, the transaction is complete. If the firm extends the customer a
line of credit, the customer receives the merchandise now and pays when the invoice is due.
Because the accounting equation (assets equal liabilities plus equity) must always balance, the
firm opens an Accounts Receivable account (an asset) to offset the increase in Revenue (an
equity account). When the customer eventually pays for the merchandise, the Cash account is
increased and the Accounts Receivable account is decreased. If the customer pays the full
amount owed, there is no problem. The problem arises when the customer is not able to pay the
full amount. Firms often set up allowance accounts to reflect the fact that some customers will
not pay their accounts in full. In setting up these allowance accounts, managers estimate how
much customers will not pay in the future and this reduces the net income that is recorded for the
period as well as the net value of the Accounts Receivables account. The extent to which the
managers over/under estimate the allowance account represents the error in accruals.

12
Conceptually, accruals are used to adjust cash flows such that earnings reflect the
performance of the firm. Dechow and Dichev (2002) argue that the role of accruals is to “shift or
adjust the recognition of cash flows over time so that the adjusted numbers (earnings) better
measure firm performance.” (Page 35) When a firm makes a sale, there is no difference between
whether the firm gets cash at the time of the sale or the firm gets the cash in the future (adjusting
for time value) from a performance standpoint. However, there is uncertainty inherent when cash
is collected in the future because the exact amount of cash that will be collected is unknown.
This uncertainty creates noise in earnings and affords managers opportunities to manipulate
earnings opportunistically (Healy and Wahlen 1999; Watts and Zimmerman 1986; Dechow and
Dichev 2002).
Dechow and Dichev (2002) model the error in accruals and derive the measure of the
quality of accruals that we use. They assume that accruals that are created in one year reverse in
the next year. As a result, the accruals (or the change in non-cash working capital) for the current
period can be expressed as a linear function of current, lag, and lead cash flows. Specifically,
they show that their model is equivalent to:
, 1 , 1 2 , 3 , 1 ,i t i t i t i t i tWC OCF OCF OCFα β β β ε− +∆ = + + + + (2)
where,
∆WCi,t = changes in non-cash working capital for firm i in year t; OCFi,t = operating cash flows for firm i in year t. Dechow and Dichev (2002) show that as the estimation error in accruals increases, the
standard error in equation (2) increases. They refer to this standard deviation as the quality of
accruals9. In the discussion to Dechow and Dichev (2002), McNichols (2002) shows that adding
the change in revenue and the level of gross property, plant, and equipment to this estimation
9 The term “accruals quality” is used to describe this standard deviation by Ecker et al. (2006) and Francis et al. (2005) among others.

13
greatly improves the explanatory power of the model. We use the McNichols (2002)
modification to the Dechow and Dichev (2002) model to measure accruals quality.
Dechow and Dichev (2002) show that accruals quality is related to several factors that
make estimating accruals difficult. Francis et al. (2005) use Dechow and Dichev’s (2002) results
to decompose accruals quality into two components, innate and discretionary. The innate
component should capture the accruals quality that is inherent in making accruals estimations
whereas the discretionary component captures the uncertainty induced by manager’s uncertainty.
The innate accruals quality model we use is the one used by Francis et al. (2005):
, 0 1 , 2 3 4 , 5 , ,, ,
i t i t i t i t i ti t i t
OCF SALESAQ SIZE OC NEG
Assets Assetsα α α σ α σ α α ε = + + + + + +
(3)
The predicted value from equation (3) is the innate portion and the residual is the
discretionary component.
2.3 Theory on the Market Consequences of Improved Earnings Quality
This subsection presents the theory on the market consequences of better earnings quality.
The theoretical literature (see for example Easley and O'Hara 2004; Lambert et al. 2007, 2008)
on the impact of earnings quality on the cost of equity capital relies on three streams of
literature10. First is the estimation risk literature. Within this literature, investors must estimate
the parameters of the distribution of future cash flows and this estimation create greater
unconditional volatility in returns and therefore greater risk (Barry and Brown 1985; Brown
1979; Coles et al. 1995). The second stream is the rational expectations literature in which
theorists examine the effect of private information on price formation (Grossman and Stiglitz
1980; Verrecchia 1982a) and the effects of public information on the collection of private
10 A fourth stream of literature that is sometimes referenced is the incomplete information model of Merton (1987). In this model, investors under diversify because they are unaware of some firms in the market. While improving disclosure quality in general may have an indirect effect by making more investors aware of the firm, it is more difficult to argue that earnings quality alone make investors more aware of a firm’s existence.

14
information (Verrecchia 1982b, 1982a; Kim and Verrecchia 1991a). The last stream focuses on
the effects of disclosure on cost of capital through adverse selection costs (Kyle 1985; Diamond
and Verrecchia 1991).
In contrast to the traditional CAPM, the estimation risk literature examines the
consequences of allowing the parameters of the distribution of future returns to be unknown.
Brown (1979) relaxes the assumption of known parameters and shows that if investors have an
unbiased estimate of the parameters of the future returns distribution, then expected returns and
market betas are the same as they would be under the CAPM. In a similar setting, Barry and
Brown (1985) allow firms to have differential amounts of information by varying the age of the
firms. They show that a firm with a shorter time-series of information will have a higher market
beta than it would in an environment where all firms had the same amount of information. Using
a model base on future payoffs rather than returns, Coles et al. (1995) find that the results from
Barry and Brown (1985) hold for the more general case when the mean and covariance matrix
are unknown under a multi-period model. This literature suggests that firms that have more
information will have lower betas than firms with less information available. This provides a
foundation for future theory about earnings quality and market betas (see for example Easley and
O'Hara 2004; Lambert et al. 2007, 2008).
Researchers use a rational expectation setting to investigate how information is reflected in
price. Grossman and Stiglitz (1980) show that if prices fully reflect all information, then there is
no incentive to invest in costly private information. This proves to be a paradox because if there
is no incentive to collect private information, then no investor collects it and it cannot be
reflected into prices. Thus no information is reflected in prices. Verrecchia (1982a) solves this
problem by adding uncertainty to the supply of stock such that prices only partially reveal private
information which makes prices noisy. When prices are noisy, investors cannot infer perfectly all
the information in prices. Hence, investors will acquire private information. As the noise in

15
prices reduces, investors will invest less in private information when private information is costly
and observing price is costless. Verrecchia (1982b) extends this logic to show that increasing the
quality of public disclosure decreases private information collection. Along the same lines,
Diamond (1985) shows that public disclosures can be cost effective because investors abstain
from costly private information collection in the presence of public disclosure. Kim and
Verrecchia (1991b, 1991a) examine the market reaction to earnings announcements and find that
the variance of the change in price is increasing with the precision of the announcement but
decreasing with the precision of investors’ private information. Collectively, these studies
suggest that firms with better earnings quality will have less idiosyncratic volatility as less
private information is incorporated into price.
Using a rational expectations setting, studies have examined the effects of information
quality on the cost of equity capital. Easley and O’Hara (2004) provide a model in which there
are two groups of investors, uninformed, who only rely on public information, and informed,
who have both public and private information. They argue that better disclosure quality reduces
the information asymmetry between investors. Lambert et al. (2008) show that this effect is due
to disclosures increasing the average quality of information rather than information asymmetry,
per se. They argue that information asymmetry can only be priced in a setting similar to Kyle
(1985), not in a rational expectations setting because the effect of information asymmetry can be
diversified away. This suggests that information asymmetry alone will not affect systematic
volatility but may affect idiosyncratic volatility. Later we discuss the literature on earnings
quality in a Kyle (1985) type model.
Lambert et al. (2007) presents a model that captures the salient features of the models from
the rational expectations and estimation risk literatures within a rational expectations framework.
They present the expected firm risk premium as:
16
( ) [ ( | ) ]
( | ) [ ( , | )]
( | )
( | ) 1 [ ( , | ) ( , |
(
|
)]| )
j f M f j
M fj M
M
M fj j
k jM jk j
M
E R R E R R
E R RCov R R
Var R
E R RCov V V Cov V V
Var R P P
β
≠
Φ − = Φ −
Φ −= Φ
Φ
Φ −= Φ + Φ
Φ ∑
% %
%% %
%
%% % % %
%
(4)
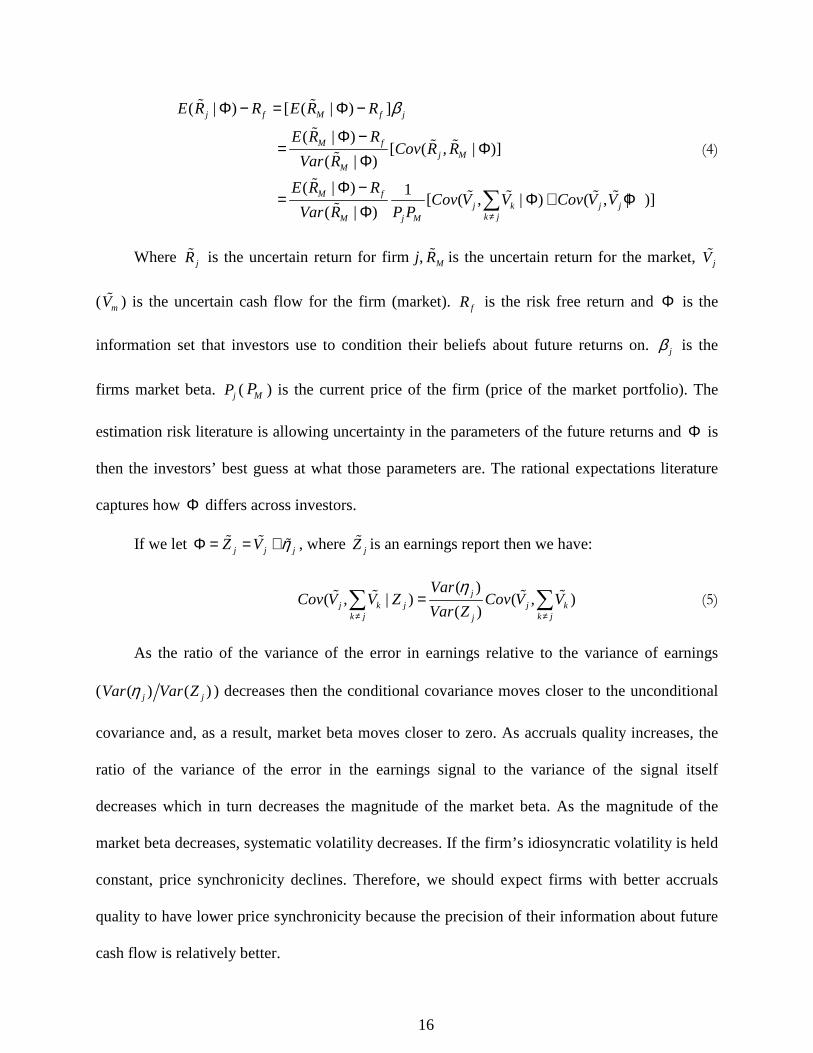
Where jR% is the uncertain return for firm j, MR% is the uncertain return for the market, jV%
( mV% ) is the uncertain cash flow for the firm (market). fR is the risk free return and Φ is the
information set that investors use to condition their beliefs about future returns on. jβ is the
firms market beta. jP ( MP ) is the current price of the firm (price of the market portfolio). The
estimation risk literature is allowing uncertainty in the parameters of the future returns and Φ is
then the investors’ best guess at what those parameters are. The rational expectations literature
captures how Φ differs across investors.
If we let j j jZ V ηΦ = = +% % % , where jZ% is an earnings report then we have:
( )
( , | ) ( , )( )
jj k j j k
k j k jj
VarCov V V Z Cov V V
Var Z
η≠ ≠
=∑ ∑% % % % (5)
As the ratio of the variance of the error in earnings relative to the variance of earnings
( ( ) ( )j jVar Var Zη ) decreases then the conditional covariance moves closer to the unconditional
covariance and, as a result, market beta moves closer to zero. As accruals quality increases, the
ratio of the variance of the error in the earnings signal to the variance of the signal itself
decreases which in turn decreases the magnitude of the market beta. As the magnitude of the
market beta decreases, systematic volatility decreases. If the firm’s idiosyncratic volatility is held
constant, price synchronicity declines. Therefore, we should expect firms with better accruals
quality to have lower price synchronicity because the precision of their information about future
cash flow is relatively better.

17
Theory also suggests that earnings quality affects factor risk premiums. Hughes et al.
(2007) argue that more information asymmetry increase the factor risk premiums, but has no
effect on the factor weights. If accruals quality decreases information asymmetry, then it is
conceivable that the market risk premium decreases as accruals quality increases. Yee (2006)
show that earnings quality can reduce the cost of equity capital within a consumption CAPM
setting because poor earnings quality magnifies fundamental risk. He shows that the market risk
premium has both an idiosyncratic portion, which is diversified away in large economies, and a
systematic portion that is non-diversifiable. Both Hughes et al. (2007) and Yee (2006) suggest
that the market risk premium decrease as earnings quality increases. Within our study, this
suggests that, across time, accruals quality may be related to systematic volatility through the
variation in market returns.
Kyle (1985) and Glosten and Milgrom (1985) stemmed a line of research that focuses on
liquidity and how earnings announcements affect information asymmetry. These models use a
secondary market setting where trade by both informed and uninformed investors is conducted
through a market maker. When investors are more informed, the market maker faces higher
adverse selection costs and increases the bid-ask spread in response. Higher bid-ask spreads
increase the firm’s cost of equity capital. Diamond and Verrecchia (1991) show that disclosure
reduces information asymmetry, in general. On the other hand, Kim and Verrecchia (1994) and
McNichols and Trueman (1994) argue that increased disclosure quality can increase information
asymmetry. Kim and Verrecchia (1994) show that if there are investors with superior ability to
interpret information, providing higher quality earnings increase information asymmetry.
McNichols and Trueman (1994) argue that investors will gather more private information in
anticipation of an earnings announcement, thus increasing information asymmetry. These studies
suggest that while better accruals quality decreases information asymmetry in general, better
accruals quality may increase information asymmetry, leading up to an earnings announcement.

18
As investors collect more information, idiosyncratic volatility increases. The effect of earnings
quality in Diamond and Verrecchia (1991) would suggest that greater accruals quality would
decrease idiosyncratic volatility because less private information is being collected. The results
from Kim and Verrecchia (1994) and McNichols and Trueman (1994) suggest that accruals
quality would increase idiosyncratic volatility because more private information is being
collected.
Pastor and Veronesi (2003) models a firm's market-to-book ratio and shows that
uncertainty in profitability increases the firms idiosyncratic volatility. In their model uncertainty
about market values induces volatility because investors disagree about what the true price is. As
uncertainty is resolved, prices converge to their underlying values. To the extent that accruals
quality captures uncertainty in profitability, higher accruals quality decreases idiosyncratic
volatility. This is contrary to the relation predicted by Kim and Verrecchia (1991b, 1991a, 1994).
The differences in the prediction of the relation between idiosyncratic volatility and
accruals quality can be reconciled as follows. From Pastor and Veronesi (2003), we conclude
that accruals quality should decrease idiosyncratic volatility. From Kim and Verrecchia (1991b,
1991a, 1994) we conclude that that better accruals quality increases idiosyncratic volatility.
Initially, when investors are uncertain the fundamental value of the firm, they have different
beliefs as to what the price should be. They trade because they hold different beliefs and this
trade increases idiosyncratic volatility. If earnings are more likely to reveal the fundamental
value of the firm, traders with low information collection costs will benefit by collecting private
information about firm in order to profit from the announcement. Thus, firms with high accruals
quality has may have higher or lower idiosyncratic volatility. Regardless of the relation between
accruals quality and idiosyncratic volatility, accruals quality and systematic volatility is always
predicted to have a non-positive relationship. Thus, we explicitly control for idiosyncratic
volatility.

19
2.4 Empirical Findings on the Market Consequences of Improved Accruals Quality
This subsection provides some of the empirical findings on the market consequences of
improved accruals quality. We first discuss evidence that accruals quality affects cost of equity
capital, both directly and through information asymmetry. We then talk constructing a risk factor
from accruals quality portfolios and whether it is a priced risk factor. We end by discussing
evidence that suggests that accruals quality only affects idiosyncratic volatility.
Empirical evidence supports the theory of Lambert et al. (2007, 2008) and Easley and
O’Hara (2004) that better quality earnings decrease a firm’s cost of capital. Francis et al. (2004)
examine the effects of different earnings attributes on the cost of equity capital. They find better
quality earnings reduce cost of equity capital in general. They also find that the accruals quality
measure of Dechow and Dichev (2002) has the greatest impact on cost of equity capital and they
argue that this is because “accruals quality captures variation in the mapping of earnings into
operating cash flows, a key element of the pay-off structure that is of interest to investors”
(Francis et al. 2004).
Empirical studies further investigate the relationship between the Dechow and Dichev
(2002) measure of accruals quality and cost of capital. Francis et al. (2005) decomposes accruals
quality into innate and discretionary components and find that the innate component has a larger
pricing effect. Bhattacharya et al. (2007a; 2007b) find that higher accruals quality reduces the
information asymmetry among investors, although the relationship between accruals quality and
cost of equity capital is primarily through information uncertainty rather than asymmetry
(Bhattacharya et al. 2007b). These studies motivate our use of accruals quality in assessing the
relative amount of firm-specific information impounded into prices.
In addition to examining the relation between the components of accruals quality and cost
of capital, Francis et al. (2005) construct a portfolio based on accruals quality and argue that this
accruals quality portfolio captures risk that is not related to other common risk factors such as
20
market beta, size, book-to-market, and momentum. They suggest that this accruals quality risk
factor capture information risk11 and show that the accruals quality risk factor explains firm
returns incremental to traditional risk factors such as market risk, size, and book-to-market.
Ecker et al.(2006) use portfolios based on accruals quality and they show that the loadings these
portfolio returns (e-loadings) are related to the firms information environment. Specifically,
these e-loadings are positively related to higher values of other earnings quality measure, lower
earnings response coefficients, greater dispersion in analysts’ earnings forecasts and less
accuracy in analysts’ earnings forecasts. They also find that e-loadings are lower and more stable
for older firms, where there is likely to be more information about the firm. They find these e-
loadings to be higher during years containing restatement announcements, lawsuit filings, or
bankruptcies, where earnings quality is likely to be poor. These studies establish accruals quality
as a priced risk factor.
A number of studies use the accruals risk factor to test hypotheses related to information
risk. Chen et al. (2007a) support the notion that accruals quality represents a separate priced risk
factor and provide evidence that the accruals quality is not related to cost of capital absent of
fundamental risk, as predicted by Yee (2006). Aboody et al. (2005) finds that the profitability of
insider trading higher for firms that have more exposure to the accruals quality risk factor. Chen
et al. (2007b) find that changes in dividend policies are related the accruals risk factor loadings,
consistent with an information risk interpretation. These studies support the notion that accruals
quality captures information risk.
The interpretation that the accruals quality factor represents a price risk factor is not
without controversy. Core et al. (2008) show that the tests in Francis et al (2005) are not well
specified tests of whether a risk factor is priced. Using a different method of testing for a priced
11 Francis et al. (2005) define information risk as “the likelihood that firm-specific information that is pertinent to investor pricing decisions is of poor quality”

21
risk factor, they fail to find evidence that the accruals quality factor constitutes a priced risk
factor12. Using same method that is used by Core et al. (2008), Gray et al. (2009), Kim and Qi
(2008) and Ogneva, (2008) find evidence consistent with accruals quality representing a priced
risk factor. Gray et al. (2009) use Australian data, Kim and Qi (2008) eliminate low priced firms,
and Ogneva (2008) explicitly controls for shocks in future cash flows. These studies suggest that
the degree to which accruals quality represents a priced risk factor depends on the specification
of the test of whether a risk factor is priced.
Some studies argue that information risk should not impact cost of equity capital at all.
Hughes et al. (2007) and Lambert et al. (2008) show that in large economies, the risks related to
the quality of information can be diversified away13. Consistent with this theory, Cohen (2008)
and Liu and Wysocki (2007) show that after controlling for firm-specific characteristics, accruals
quality is not related to systematic risk. Cohen (2008) controls for the determinants of disclosure
quality, arguing that the firm’s level of accruals quality is strategically chosen by management.
Liu and Wysocki (2007) argue that after controlling for the operating volatility of the firm,
accruals quality is not related to cost of capital. Further, they provide evidence that accruals
quality and operating volatility may not capture the same underling construct. These studies
suggest that improved accruals quality only reduces idiosyncratic volatility and is not related to
systematic volatility.
2.5 Empirical Findings Related To Price Synchronicity
The Capital Asset Pricing Model (CAPM) predicts that firm level returns should be
perfectly correlated with market returns. However, the R2 from the CAPM is on average around
12 While they fail to find evidence that the accruals quality factor is a priced risk factor, Core et al. (Core et al. 2008) do find that the accruals quality factor loadings are related to implied cost of capital. 13 Lambert et al. (2008) show that when cash flows are independent across firms, the effect of earnings quality on cost of capital can be diversified away. However, if the cash flows are correlated, better earnings quality can reduce cost of capital despite diversification. (see Lambert et al. (2007))
22
17% (Roll 1988). Arbitrage Pricing Theory14 (APT) does little better with an average R2 of about
25%. Roll (1988) argues that deviations from the CAPM are composed of random noise
generated by the trading process and a firm-specific component generated by news being
incorporated into the firm’s stock price. As more news is incorporated into stock prices,
deviations from the CAPM increase which lowers the R2.
Studies find evidence consistent with low levels of price synchronicity reflecting more
firm-specific information in price. Roll (1988) finds an improvement in the R2 when he removes
days that the firm is mentioned in the financial press. French and Roll (1986) investigate the
observation that return variances during normal trading periods are substantially higher than
return variances during non-trading periods. They conclude that the increase in volatility is due
to more firm-specific private information being impounded into price rather than excess noise
generated by the trading process. Durnev et al. (2003) examine the degree to which current
returns reflect future earning for low R2 firms. They assume that the private information that
investors collect is about the future earnings of the company. Consistent with this conjecture,
they find that the current returns for low R2 firms are more highly correlated with future
earnings. These studies provide evidence that low price synchronicity is related to relatively
more firm-specific information.
A number of studies use price synchronicity as a measure of the relative degree of firm-
specific information reflected in price. Studies find better capital allocation for firms with lower
price synchronicity (Durnev et al. 2004), firms in industries with low synchronicity (Durnev et
al. 2001) and for countries with low synchronicity (Wurgler 2000) consistent with the notion that
lower price synchronicity firms have more informative prices which increases market monitoring
(Holmstrom and Tirole 1993). Morck et al. (2000) shows that price synchronicity in emerging
14APT simply specifies that there are systematic factors that that affect firm returns but it does not specify what those factors are. The CAPM is equivalent to a single factor APT model.
23
markets is higher because of the lack of property protection rights which makes arbitrage and
information based trading less profitable. Jin and Myers (2006) show that countries with high
price synchronicity have less transparent financial systems15. Using a composite measure of
capital market governance, Daouk et al. (2006) find that countries with lower price synchronicity
have better capital market governance. Sami and Zhou (2008) find that price synchronicity
decreases around implementation of new auditing standard in China16. Studies on the adoption of
International Financial Reporting Standards (IFRS) find a decrease in price synchronicity
following IFRS adoption (Beuselinck et al. 2008; Kim and Shi 2007). They conclude that the
financial statements under IFRS are of better quality because prices reflect more firm-specific
information. Haggard et al. (2008) find that firms with higher disclosure quality scores have
lower price synchronicity. Using price synchronicity, Piotroski and Roulstone (2004) analyze the
relative amount of firm-specific information compounded into price from the actions of insiders,
institutional investors, and financial analysts and find that the trading activities of insiders and
institutional investors generally provide more firm-specific information to the market while
greater analyst revisions activities provide relatively more industry information. Using data from
emerging markets, Chan and Hameed (2006) find analyst following also increases price
synchronicity. These studies provide indirect support for the use of price synchronicity as a
measure of the relative amount of firm-specific information impounded into prices.
While much of the evidence is consistent with the interpretation of price synchronicity as a
measure of the relative amount of firm-specific information impounded into prices, there are a
few studies that argue that price synchronicity is capturing noise in the trading process rather
15 Jin and Myers (2006) use a number of measures of transparency including the Global Competitiveness Reports survey on disclosure quality, the number of professional auditors, an index of accounting standards develop by La Porta et al. (1998), a Global Opacity Index developed by PricewaterhouseCoopers, and the standard deviation of analyst forecasts. 16 Sami and Zhou (2008) also find an increase in trading volume and price volatility and a decrease in earnings management following the implementation of these new auditing standards.
24
than firm-specific information. West (1988) provides a theoretical model where returns volatility
is greater for firms that are priced base on less information. Kelly (2007) argues that R2 does not
capture informational attributes. Using market-microstructure measures of Easley et al. (1997),
he finds that firms with low R2 have fewer expected informed traders, higher information
asymmetry, and a lower probability of a private information event. Rajgopal and Venkatachalam
(2008) and Chen et al. (2008) find that the increasing trend in idiosyncratic returns volatility is
positively related to the increasing trend in earnings volatility and the decline in earnings quality
over the last forty years. Cohen (2008) finds that accruals quality decreases idiosyncratic
volatility. Ashbaugh-Skaife et al. (2006) provide some evidence that price synchronicity is not a
consistent measure of firm-specific information across countries. Teoh et al. (2008) find that
accounting based anomalies are greater for firms with low price synchronicity. Specifically,
Teoh et al. (2008) investigates the accruals anomaly (Sloan 1996), post-earnings announcement
drift (Bernard and Thomas 1989, 1990), the net operating assets anomaly (Hirshleifer et al.
2004), and the Value-to-price (V/P) anomaly (Frankel and Lee 1998). These studies suggest that
price synchronicity captures noise rather than firm-specific information.
Trying to reconcile the differences in the empirical findings of price synchronicity, Lee and
Liu (2007) provide a model of idiosyncratic volatility. They show that idiosyncratic volatility can
be decomposed into a noise component and an informational component. They further
decompose the informational component into an information-updating part and an uncertainty-
resolution part. The informativeness of price decreases with the noise component, but has a U-
shaped relation with the information component.
2.6 Analyst Information
Research investigates the impact of analysts’ information on price synchronicity. As
mentioned above, Piotroski and Roulstone (2004) and Chan and Hameed (2006) find that analyst
revision activity and analyst following increases with price synchronicity, which is consistent
25
with analyst providing more industry level information. Beuselinck et al. (2008) find that analyst
activity led to more price synchronicity around IFRS adoption and Kim and Shi (2007) find that
the reduction in price synchronicity around IFRS is attenuated for firms with high analyst
following. These studies suggest better disclosure quality allows analysts to provide better
industry information.
Studies have examined the relation between earnings quality and the properties of analysts’
information. Using the precision measures of Barron et al. (1998), Byard and Shaw (2003)
provide evidence that disclosure quality increases the precision of analyst common and private
information. Lang and Lundholm (1996) find firms with better disclosure quality have higher
analyst following, more accurate analyst earnings forecasts and lower forecast dispersion. On the
other hand, Lobo et al. (2006) find that accruals quality decreases analyst following, forecast
error and dispersion. While both of these studies agree that better quality disclosure improve
analysts’ forecasts, they differ on the relation between quality and analyst following. Lang and
Lundholm (1996) argue that better disclosure quality decreases the analysts’ information
collection costs. Lobo et al. (2006) argue that better accruals quality reduces the benefit that
analysts accrue from their information collection activities. This difference can be explained by
the difference in the proxies for quality. Lang and Lundholm (1996) use a disclosure quality
score that is based on analysts’ assessment of the disclosure quality whereas Lobo et al. (2006)
use a measure of earnings quality based on the properties of earnings themselves. Analysts are
likely to take into consideration both cost and benefit when determining disclosure quality.
Studies have also investigated the effect of analyst following on market liquidity and
asymmetry. Roulstone (2003) find that analyst following is positively related to liquidity and
forecast dispersion is negatively related to liquidity. Easley et al. (1998) find that the probability
of private information being reflected in trade is not related to analyst following. These studies

26
suggest that analyst increases liquidity and investor recognition, which may also explain the
positive relation between analyst following and price synchronicity.
We conclude this section with a short summary of the literature. Theory suggests that firms
with better earnings quality have less systematic volatility. Earnings quality can be related to
higher or lower levels of idiosyncratic volatility. The reduction in systematic volatility comes
from a reduction in market beta or a reduction in the expected market return. The higher
idiosyncratic volatility is due to more information being impounded into price as the marginal
benefit of collecting information increases. The lower idiosyncratic volatility is a result of less
divergence of opinion and a reduction in the learning about the future profitability. There is
empirical evidence to support both a reduction in systematic volatility and a reduction in
idiosyncratic volatility. The literature on price synchronicity examines whether decreased co-
movement in stock returns is associated with more firm-specific information being incorporated
into prices. There is some direct evidence that firms with low price synchronicity have more
informative prices. Consistent with this, studies also show that low price synchronicity is related
to better capital allocations, greater property protection rights, better capital market governance,
and higher quality disclosures. Studies have documented a negative relation between accruals
quality and idiosyncratic volatility, which would imply, ceteris paribus, a positive relation
between price synchronicity and accruals quality. Prior literature finds a positive relation
between analysts and price synchronicity. This is consistent with two interpretations, that
analysts provide industry level information or that analysts help provide liquidity to the market.

27
3. HYPOTHESES
3.1 The Components of R2
Price synchronicity is the degree to which market and/or industry information is
compounded into firm prices. It is commonly measured as the R2 from the regression of the
return of the firm on a market and industry index.17 We start by describing R2 of a simple
regression with only market returns as a predictor of firm returns. This is the Capital Asset
Pricing Model (CAPM). We then look at the theory on how accruals quality impacts the
components of R2 from the CAPM.
Under the CAPM, risk-averse investors maximize their utility by maximizing the return on
their portfolios for a certain level of the variance of their portfolio. As a result, the firm returns
can be expressed as the linear function of market returns:
* *, , , ,i t i i m t i tr rα β ε= + + (6)
where *,i tr is the risk premium for firm i in period t, *
,m tr is the risk premium for a market index in
period t, iα is the excess return for firm i, iβ is the “beta” for firm i and ,i tε is the idiosyncratic
return for firm i in period t. Under the CAPM, both the excess return and the idiosyncratic return
are expected to be zero.
The R2 is the ratio of the sample variance of the predicted value over the sample variance
of the independent variable from a regression. The population equivalent of R2 from the CAPM
can be expressed as:
2 22
2 2 2m
m
r
r
Rε
β σβ σ σ
=+
. (7)
17 Despite the problems of the use of R2 as a relative measure of goodness of fit across samples, R2 is still pervasive in both the finance and accounting literature. In the accounting literature, R2 from the regression of returns on book value and earnings is referred to as the value relevance of accounting information. Gu (2007) demonstrates some of the problems with using R2 as a measure of goodness of fit within the context of the value relevance of accounting information.

28
We are interested in understanding how accruals quality impacts R2. As we chow in section 2,
theory suggests that β , 2
mrσ and/or 2
εσ are functions of accruals quality.
2 2
2 2 22
m
m
r
rR
AQ AQε
β σβ σ σ
∂+∂ =
∂∂ (8)
( )
( )
2 2 2 2 22 2 2 2 2
22 2 2
m m
m m
m
r rr r
r
AQ AQ AQε
ε
ε
β σ β σ σβ σ σ β σ
β σ σ
∂ ∂ ∂+ − + ∂ ∂ ∂ =+
(9)
( ) ( )
2 2 22 2 22 2 2
2 2 2
2 22 2 2 2 2 22 2 2
1
1
1mm
mm
m m
m
rrr
r
r rr
AQ AQAQ AQεε
εε
ε εε
β σ σβ σ σσ β σ β σ σ
β σ σ β σ σβ σ σ
∂ ∂∂ ∂ −− ∂ ∂∂ ∂= =+ +
(10)
Since ( )22 2 22 2 2
10
m
m
rr
εε
β σ σβ σ σ
+ > , the sign of 2R AQ∂ ∂ is the same as the sign of the numerator.
Using the fact that the derivative of a function divided by that function is the same as the
derivative of the log of the function, the sign of 2R AQ∂ ∂ can be expressed as:
2 2 2 2
2 2 2 2
ln ln0
ln ln0
m
m
r
r
R
AQ AQ AQ
R
AQ AQ AQ
ε
ε
β σ σ
β σ σ
∂> ⇒ >
∂
∂ ∂∂ ∂ ∂
∂ ∂⇒
∂ ∂< <
∂
(11)
The relation between R2 and accruals quality depends on the relative effects of accruals
quality on the components of R2.
3.2 Accruals Quality and Price Synchronicity
Our first hypothesis is about the relation between accruals quality and price synchronicity.
Because accruals quality affects multiple aspects of the firm’s information environment,
(Bhattacharya et al. 2007b) and different informational aspects have different effects on price
29
synchronicity (Lee and Liu 2007), this relation could be positive or negative. We discuss the
rational for each prediction below.
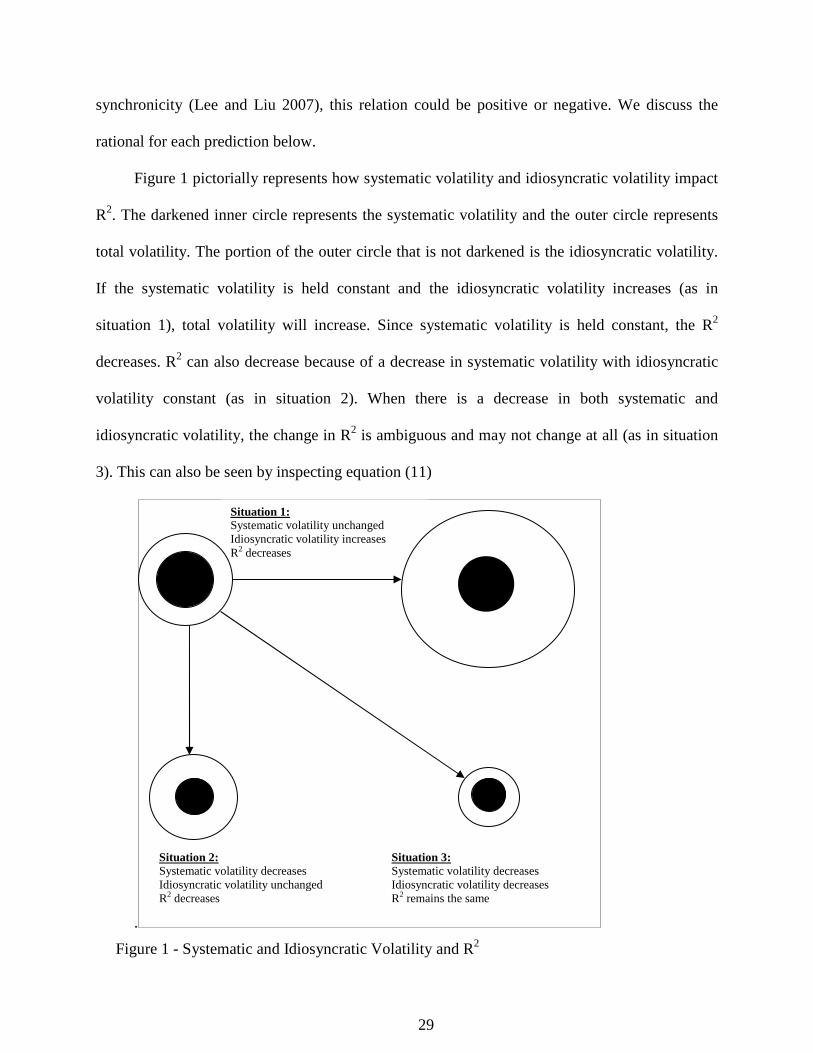
Figure 1 pictorially represents how systematic volatility and idiosyncratic volatility impact
R2. The darkened inner circle represents the systematic volatility and the outer circle represents
total volatility. The portion of the outer circle that is not darkened is the idiosyncratic volatility.
If the systematic volatility is held constant and the idiosyncratic volatility increases (as in
situation 1), total volatility will increase. Since systematic volatility is held constant, the R2
decreases. R2 can also decrease because of a decrease in systematic volatility with idiosyncratic
volatility constant (as in situation 2). When there is a decrease in both systematic and
idiosyncratic volatility, the change in R2 is ambiguous and may not change at all (as in situation
3). This can also be seen by inspecting equation (11)
.
Situation 1: Systematic volatility unchanged Idiosyncratic volatility increases R2 decreases
Situation 2: Systematic volatility decreases Idiosyncratic volatility unchanged R2 decreases
Situation 3: Systematic volatility decreases Idiosyncratic volatility decreases R2 remains the same
Figure 1 - Systematic and Idiosyncratic Volatility and R2
30
Accruals quality may decrease price synchronicity because of more firm-specific
information contributing to returns volatility. As accruals quality increases, firm-specific
information becomes more precise and the firm’s market beta decreases in magnitude (Lambert
et al. 2007). Holding market variance constant, this implies 2 2ln 0mr
AQβ σ∂ ∂ < . With a smaller
market beta, there is less co-movement between firm’s returns and the returns of the market,
cetera paribus, and firm return volatility reflect relatively more firm-specific information and less
market related information. Therefore, firms with higher accruals quality will have lower price
synchronicity via lower systematic volatility.
Accruals quality may be also increase price synchronicity. An increase in accruals quality
decreases information asymmetry and increases liquidity (Bhattacharya et al. 2007a). The
decrease in information asymmetry may decreases idiosyncratic volatility because there is less
divergence of opinion (Kim and Verrecchia 1994). This implies 2 0ln AQεσ∂ ∂ < . Additionally,
the increase in liquidity allows macro-economic information to be factored into prices more
quickly, increasing systematic volatility (Hou and Moskowitz 2005), which suggests
2 2ln 0mr
AQβ σ∂ ∂ > . Therefore there might be an increase in price synchronicity because of
decreased information asymmetry.
While accruals quality may affect price synchronicity through information precision and
information asymmetry, the effect of information precision will likely have a larger influence on
systematic volatility. Bhattacharya et al. (2007b) study the direct effect of accruals quality on
the cost of equity capital and the mediated effect accruals quality on the cost of equity capital
through information asymmetry. They find that the direct effect, which they attribute to
information precision, dominates the mediated effect on average. Therefore, we expect the
information precision effect will dominate in this situation as well and we will observe a
negative relation between accruals quality and price synchronicity. This suggests that

31
2 2 2ln lnmr
AQ AQεβ σ σ∂ ∂ ∂ ∂< . This in conjunction with equation (11) suggests that R2
decreases as accruals quality increases. Thus we present our first hypothesis, stated in the
alternative:
H1: Accruals quality is negatively related to price synchronicity.
We use the following empirical model:
, 0 1 , 2 , , ,3
J
i t i t i t j j i tjSync b b AQ b IDIORISK b Control
== + + +∑ (12)
where Sync is our measure of price synchronicity, AQ is Dechow and Dichev (2002)’s
measure of accruals quality, IDIORISK is idiosyncratic volatility and Controlj is the jth control
variable. A significantly positive coefficient of b1 would support our first hypothesis.
3.3 Innate and Discretionary Components of Accruals Quality and Price Synchronicity
Francis et al. (2005) decompose accruals quality into two components, innate and
discretionary. The innate accruals component is accruals quality that is determined by the
underlying economic factors of the firm. Increases in innate accruals quality decrease the
uncertainty of the information about future cash flows captured in earnings. This reduction of
uncertainty decreases price synchronicity. The innate accruals quality component is less likely to
have the off-setting information asymmetry effect compared to total accruals quality. This is
because the innate accruals component is the portion of accruals quality that can be explained by
the underlying economic condition of the firm. This leads to our second hypothesis, again stated
in the alternative:
H2: The innate accruals quality component is negatively related to price synchronicity.
As with the first hypothesis, we estimate the effect of innate accruals quality with the following
empirical model:
, 0 1 , 2 , , ,3
J
i t i t i t j j i tjSync b b InnateAQ b IDIORISK b Control
== + + +∑ (13)

32
Again Sync is our measure of price synchronicity. InnateAQ is Francis et al. (2005)’s measure
of innate accruals quality, IDIORISK is idiosyncratic volatility and Controlj is the jth control. A
negative and significant value of b1 would support our second hypothesis.
The discretionary component of the accruals quality is variation in accruals that is likely
caused by discretionary use of accruals. Managers may be exercising discretion over accruals to
act opportunistically or to convey information to investors through earnings (Francis et al. 2005).
If managers are acting opportunistically and the market recognizes this, increases in
discretionary accruals quality would be ignored and we expect no relation between accruals
quality and price synchronicity. If managers are acting opportunistically and investors are fooled
or if investors do not distinguish between the innate and discretionary components of accruals
quality, then the discretionary component will act in a manner similar to the innate accruals
quality component. In this case, we predict a negative relation between the discretionary
component of accruals quality and price synchronicity. If managers are using discretionary
accruals to convey information to the market, then large deviations would contain more
information. Therefore, low values of the discretionary component of accruals quality would be
related to more firm-specific information in prices and we would expect a positive relation
between the discretionary component of accruals quality and price synchronicity. Since the
relation between the discretionary accruals component could go either way, we make our third
hypothesis non-directional:
H3: The discretionary component of accruals quality is related to price synchronicity.
As with the first two hypotheses, we estimate the effect of discretionary accruals quality with the
following empirical model:
, 0 1 , 2 , , ,3
J
i t i t i t j j i tjSync b b DisAQ b IDIORISK b Control
== + + +∑ (14)
33
Again Sync is our measure of price synchronicity. DisAQ is Francis et al. (2005)’s measure of
discretionary accruals quality, IDIORISK is idiosyncratic volatility and Controlj is the jth control.
A negative and significant value of b1 would support the notion that investors either cannot or do
not distinguish the innate component of accruals quality from the discretionary component
accruals quality. A positive and significant b1 would suggest that managers are conveying
information through accruals. If b1 is not different from 0 then either the market does not take
into account discretionary accruals quality or there is a mixture of the above two effects.
3.4 Accruals Quality, Price Synchronicity and Analyst Following
Our last hypothesis concerns how the presence of an analyst affects the relation between
accruals quality and price synchronicity. Prior research shows that analyst activities are
positively related to price synchronicity, primarily due to industry level information. It is
conceivable, although highly unlikely, that analysts focus solely on industry information and the
correlation of earnings between firms within an industry. In this case, the relation between
accruals quality and price synchronicity would not differ between firms that are followed by
analysts and firms that are not. However, the information collection activities of analysts suggest
that they do gather firm-specific information (Schipper 1991).
The more interesting question is whether earnings information complements analysts
information or rather is a substitute for it. If earnings information complements analysts’
information, then increasing accruals quality will convey relatively more firm-specific
information when the firm has an analyst following. This would be consistent with earnings
quality decreasing the cost of information collection of analysts (Lang and Lundholm 1996). If
analyst information is a substitute for earnings information, then increasing accruals quality will
convey relatively more firm-specific information when the firm does not have an analyst
following. This would be consistent with earnings quality decreasing the benefit of information
34
by analysts (Lobo et al. 2006). Because we have no reason to expect one effect to dominate the
other, we present our final hypothesis as a non-directional hypothesis:
H4: If earnings information complements analysts information then accruals quality will be more negatively related to price synchronicity for firms that have an analyst following compared to those that do not. If earnings information is a substitute for analysts’ information, then accruals quality will be less negatively related to price synchronicity for firms that have an analyst following compared to those that do not.
For our fourth hypothesis, we separate our sample into firms that are followed by analysts and
those that are not and estimate the following equation for each of our accruals quality measures:
, 0 1 , 2 , , ,3
0 1 ,
2 , , ,3
( * )
( * ) ( * )
J
i t i t i t j j i tj
i t
J
i t j j i tj
Sync b b AQ b IDIORISK b Control
c Followd c Followd AQ
c Followd IDIORISK c Followd Control
=
=
= + + +
+ +
+ +
∑
∑
(15)
Sync is our measure of price synchronicity. AQ is either total accruals quality, innate accruals
quality or discretionary accruals quality, IDIORISK is idiosyncratic volatility and Controlj is the
jth control. Followd is a dummy variable equal to 1 if the firm has a following in the month of
their earnings announcement, zero otherwise. Our fourth hypothesis is looking for differences
between the two groups. A significantly positive value for c1 would indicate that accruals quality
is related to more price synchronicity when there is an analyst following. This would be
consistent with a substitution effect between earnings and analysts information. A negative and
significant c1 would indicate that higher accruals quality reflects more firm-specific information
for firms that are followed by analysts. This would support a complementary relation between
earnings information and analysts’ information.
While we frame our fourth hypothesis in terms of complements and substitutes, it may be
the case that the existence of analysts increase the visibility of the firm and increases the liquidity
of the firm. The increase in liquidity increases price synchronicity of the firm. If this is the case,
then it could be that as accruals quality increases, firms that are not followed by analysts have the
confounding effect of liquidity to contend with in addition to the information precision effect.
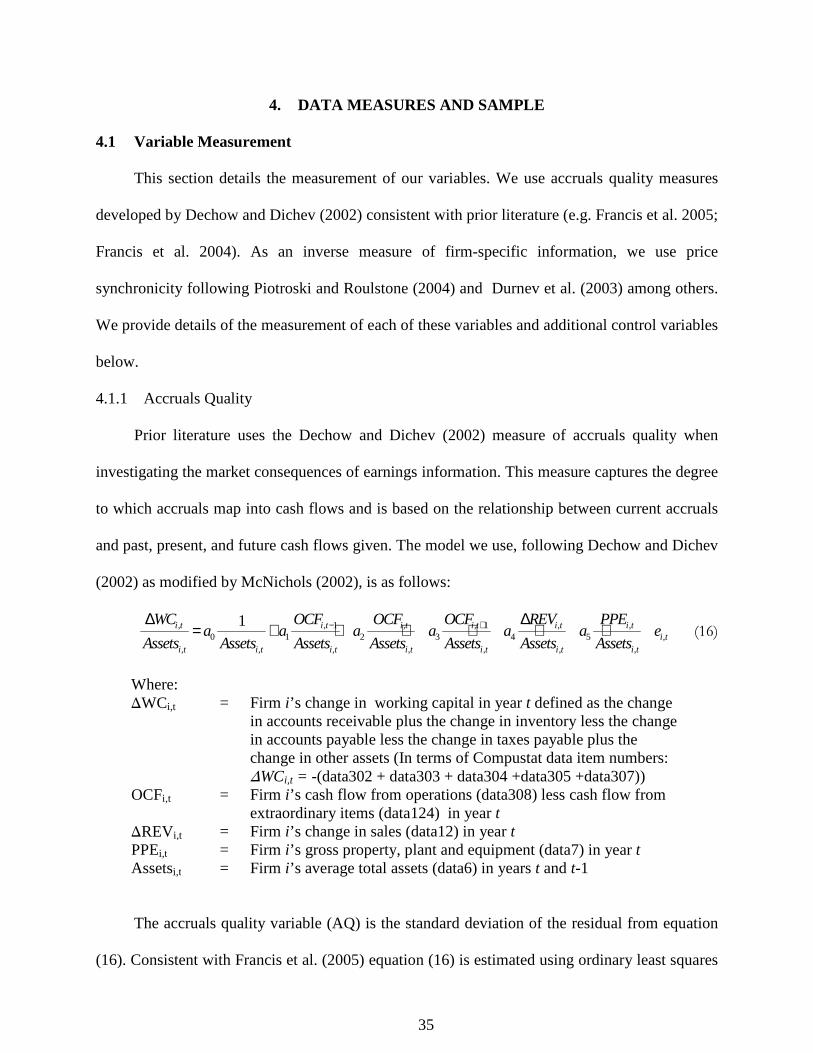
35
4. DATA MEASURES AND SAMPLE
4.1 Variable Measurement
This section details the measurement of our variables. We use accruals quality measures
developed by Dechow and Dichev (2002) consistent with prior literature (e.g. Francis et al. 2005;
Francis et al. 2004). As an inverse measure of firm-specific information, we use price
synchronicity following Piotroski and Roulstone (2004) and Durnev et al. (2003) among others.
We provide details of the measurement of each of these variables and additional control variables
below.
4.1.1 Accruals Quality
Prior literature uses the Dechow and Dichev (2002) measure of accruals quality when
investigating the market consequences of earnings information. This measure captures the degree
to which accruals map into cash flows and is based on the relationship between current accruals
and past, present, and future cash flows given. The model we use, following Dechow and Dichev
(2002) as modified by McNichols (2002), is as follows:
, , 1 , , 1 , ,0 1 2 3 4 5 ,
, , , , , , ,
1i t i t i t i t i t i ti t
i t i t i t i t i t i t i t
WC OCF OCF OCF REV PPEa a a a a a e
Assets Assets Assets Assets Assets Assets Assets− +∆ ∆
= + + + + + +
(16)
Where: DWCi,t = Firm i’s change in working capital in year t defined as the change
in accounts receivable plus the change in inventory less the change in accounts payable less the change in taxes payable plus the change in other assets (In terms of Compustat data item numbers: DWCi,t = -(data302 + data303 + data304 +data305 +data307))
OCFi,t = Firm i’s cash flow from operations (data308) less cash flow from extraordinary items (data124) in year t
DREVi,t = Firm i’s change in sales (data12) in year t PPEi,t = Firm i’s gross property, plant and equipment (data7) in year t Assetsi,t = Firm i’s average total assets (data6) in years t and t-1
The accruals quality variable (AQ) is the standard deviation of the residual from equation
(16). Consistent with Francis et al. (2005) equation (16) is estimated using ordinary least squares
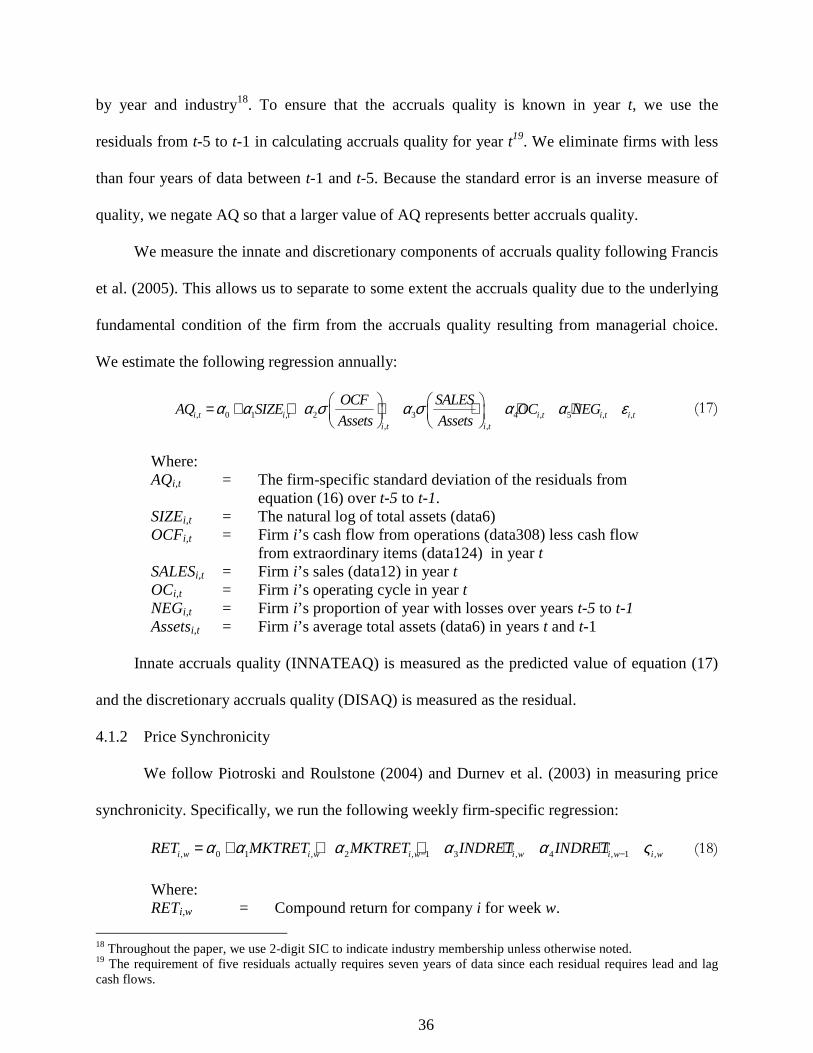
36
by year and industry18. To ensure that the accruals quality is known in year t, we use the
residuals from t-5 to t-1 in calculating accruals quality for year t19. We eliminate firms with less
than four years of data between t-1 and t-5. Because the standard error is an inverse measure of
quality, we negate AQ so that a larger value of AQ represents better accruals quality.
We measure the innate and discretionary components of accruals quality following Francis
et al. (2005). This allows us to separate to some extent the accruals quality due to the underlying
fundamental condition of the firm from the accruals quality resulting from managerial choice.
We estimate the following regression annually:
, 0 1 , 2 3 4 , 5 , ,
, ,i t i t i t i t i t
i t i t
OCF SALESAQ SIZE OC NEG
Assets Assetsα α α σ α σ α α ε = + + + + + +
(17)
Where: AQi,t = The firm-specific standard deviation of the residuals from
equation (16) over t-5 to t-1. SIZEi,t = The natural log of total assets (data6) OCFi,t = Firm i’s cash flow from operations (data308) less cash flow
from extraordinary items (data124) in year t SALESi,t = Firm i’s sales (data12) in year t OCi,t = Firm i’s operating cycle in year t NEGi,t = Firm i’s proportion of year with losses over years t-5 to t-1 Assetsi,t = Firm i’s average total assets (data6) in years t and t-1
Innate accruals quality (INNATEAQ) is measured as the predicted value of equation (17)
and the discretionary accruals quality (DISAQ) is measured as the residual.
4.1.2 Price Synchronicity
We follow Piotroski and Roulstone (2004) and Durnev et al. (2003) in measuring price
synchronicity. Specifically, we run the following weekly firm-specific regression:
, 0 1 , 2 , 1 3 , 4 , 1 ,i w i w i w i w i w i wRET MKTRET MKTRET INDRET INDRETα α α α α ς− −= + + + + + (18)
Where: RETi,w = Compound return for company i for week w.
18 Throughout the paper, we use 2-digit SIC to indicate industry membership unless otherwise noted. 19 The requirement of five residuals actually requires seven years of data since each residual requires lead and lag cash flows.

37
MKTRETi,w = Compound weekly return for value weighted market index from CRSP excluding firm i for week w.
INDRETi,w = Compound weekly return for value weighted industry index from CRSP excluding firm i for week w.
We estimate equation (18) for the 12 month period ending in the month of the earnings
announcement. The R2 from this equation serves as a measure of price synchronicity. To
calculate the industry index, we use 2-digit SIC industry and require at least 3 firms within an
industry in a particular week. We also require firms to have 45 weeks of observations to estimate
the regression. Consistent with Piotroski and Roulstone (2004) and Morck et al. (2000), we use a
logarithmic transformation of the R2 to define our price synchronicity variable (SYNC):
2,
, 2,
log1
i ti t
i t
RSYNC
R
= −
(19)
This logarithmic transformation takes the R2, which is bounded between 0 and 1, and
transforms it to an unbounded continuous variable20 (Piotroski and Roulstone 2004). As more
firm-specific information is contained in prices, firm returns are less likely to be correlated with
the market and industry returns and SYNC decreases.
4.1.3 Controls
Following Piotroski and Roulstone (2004) 21, we use several controls that prior literature
has identified as related to price synchronicity. We include controls for size, industry
concentration, firm diversification, the correlation in cash flows, institutional ownership,
regulated industries, and analyst following. We also include a control for idiosyncratic risk.
We explicitly control for idiosyncratic risk. Accruals quality increases with the uncertainty
of the profitability of the firm and decrease information asymmetry. Increasing the uncertainty of
20 Using the adjusted R2 instead of our SYNC variable yields qualitatively similar results. 21 Piotroski and Roulstone (2004) also include a control for the standard deviation of the firm’s return on assets (ROA). We exclude this control because it is highly correlated with the factors used to estimate the innate component of accruals quality.

38
profitability and/or information asymmetry increases idiosyncratic risk (Pastor and Veronesi
2003). The empirical observations of Rajgopal and Venkatachalam (2008), Teoh et al. (2008),
and Cohen (2008) support the negative relation between idiosyncratic risk and accruals quality.
Since idiosyncratic risk and price synchronicity are negatively related, we add the sum of
squared residuals from the price synchronicity model to capture the idiosyncratic risk of the
firm’s return (IDIORISK). We expect idiosyncratic risk to be negatively related to price
synchronicity.
We include size as a control to capture potential firm-specific informational characteristics
that are unrelated to earnings uncertainty. We measure size (MV) as the log of the market value
of equity at the end of the fiscal year as reported by COMPUSTAT. As the size of the firm
increases, there is likely to be more information about that firm available to investors. Therefore
price synchronicity should decrease with size. On the other hand, large firms are more likely to
lead small firms in reporting the results of macro-economic events. Therefore, larger firms with
have greater synchronicity. While size can have opposing effect on price synchronicity, Piotroski
and Roulstone (2004) find a positive relation. Therefore, we expect a positive the relation
between size and price synchronicity.
Consistent with Piotroski and Roulstone (2004), we include a control for industry
concentration. We measure industry concentration as a sales based Herfendhal index of
concentration within a 2-digit SIC industry using segment sales from COMPUSTAT. To make
this a firm-specific measure, we take the weighted-average of the industry Herfendhal indexes
(LOGHHIF) for the segments that the firm operates, where segment sales in the industry are used
as the weight22. As the industry concentration increases there is more likely to be a leader in the
industry that conveys macro-economic news about the industry. Because all firms in the industry
22 We deviate slightly from Piotroski and Roulstone (2004) in this respect. Piotroski and Roulstone (2004) use the Herfindhal index for the firms primary 2-digit SIC industry.
39
respond similarly to the news of one firm, price synchronicity increases. Additionally, industries
that have a higher concentration are likely to have a higher degree of dependence in their
performance. We expect the relation between LOGHHIF and SYNC to be positive.
We also control for the degree to which a firm diversifies across many industries. As the
firm diversifies its operations, it is less likely to be affected by shocks in its primary industry
(Piotroski and Roulstone 2004) which would lead to lower price synchronicity. On the other
hand, well diversified firms may have more price synchronicity because they act like diversified
portfolios and reflect more market information in aggregate (Roll 1988). Consistent with
Piotroski and Roulstone (2004), we measure diversification in terms of concentration.
Specifically, diversification (DIVERS) is a firm-specific Herfendhal ratio of concentration across
2-digit industries using segment sales for the firm. We make no expectation about the relation
between DIVERS and price synchronicity.
We control for the fundamental correlation between earnings within the industries.
Piotroski and Roulstone (2004) argue that as the earnings within an industry as more correlated,
the prices of firms within the industries are more likely to be correlated and therefore will have
more price synchronicity with respect to the industry index. We measure fundamental correlation
(FUNDCORR) as the R2 from the regress of firm ROA on an industry ROA index using
quarterly data from COMPUSTAT for the last three years. ROA is defined as income before
extraordinary items per share divided by average total assets per share. We require at least 10
quarterly observations for each regression. We expect FUNDCORR to be positively related to
price synchronicity.
We include controls for institutional ownership. Piotroski and Roulstone (2004) find the
trading activities of institutions affects price synchronicity. Institutions with large holdings may
use their large stake in the company to gain firm-specific information about the firm and may
also provide monitoring over managers reports. Alternatively, institutions may trade based on

40
broad indexes (Piotroski and Roulstone 2004). We measure institutional ownership (LOGIO) as
the log of one plus the percent of institutional owners as reported by Thompson Financial’s
CDA/Spectrum database in the quarter of the earnings announcement. Piotroski and Roulstone
(2004) find a positive relation between the level of institutional holdings and price synchronicity,
therefore we expect a positive relation between LOGIO and SYNC.
Firms in regulated industries are constrained in their financial reporting and economic
activities. These firms are likely to have greater co-movements in prices (Piotroski and
Roulstone 2004). We include a dummy variable (REG) equal to one if the firm’s primary two-
digit SIC code is 62 or 49. We expect regulated industries to have higher price synchronicity.
Piotroski and Roulstone (2004) and Chan and Hameed (2006) find a positive relation
between analyst forecast revision activities and price synchronicity. They argue that analyst
provide relatively more industry information in their earnings forecast. We include a control for
analyst activity (NFOLLOW). We measure NFOLLOW as the number of analysts giving
forecasts for the firm in the month of the earnings announcement in the IBES database.
Consistent with Piotroski and Roulstone (2004), we expect analyst following to be positively
related to price synchronicity.
We include controls for industry effects. First, we include the average number of firms
within the industry (LOGNIND) used to calculate the weekly industry index to control for
differences in SYNC arising from differences in sample size (Durnev et al. 2003; Piotroski and
Roulstone 2004). We also include industry dummy variables based on 1-digit SIC code
following Piotroski and Roulstone (2004). We do not report the coefficients on the industry
dummy variables in any of our tables.
4.2 Sample Description
Accounting data come for the COMPUSTAT database. Data used to measure price
synchronicity come from CRSP. We use I/B/E/S forecast data to determine analyst following.
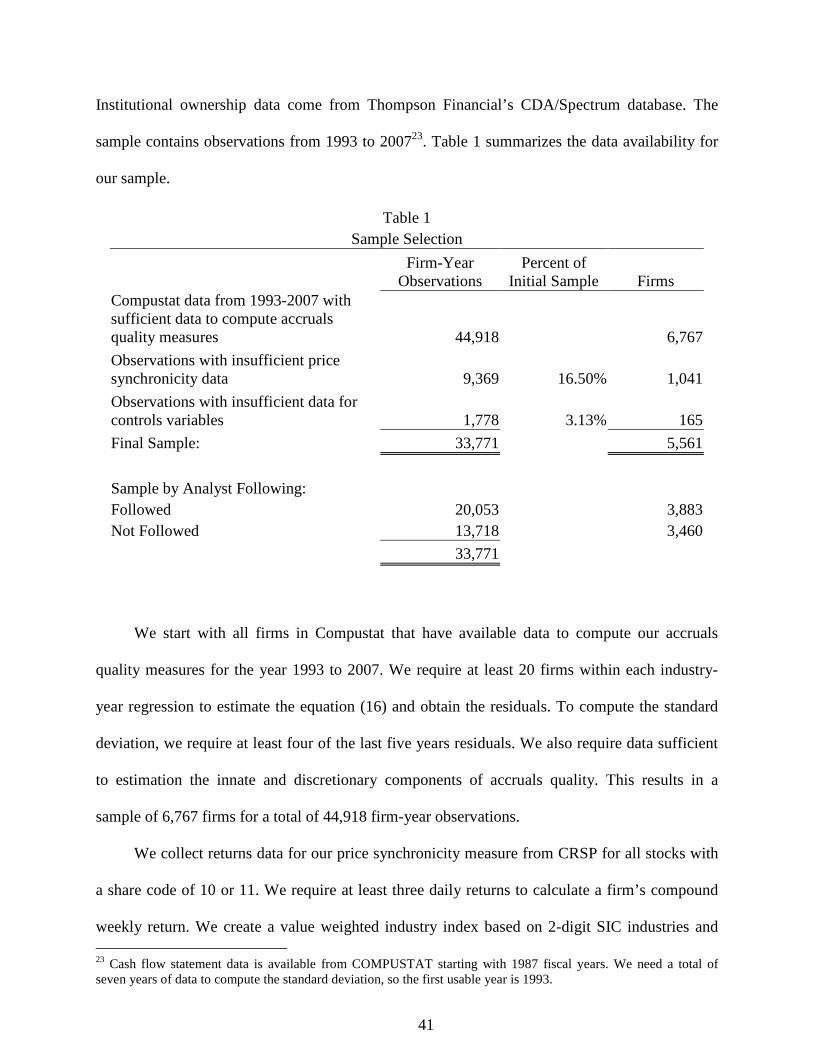
41
Institutional ownership data come from Thompson Financial’s CDA/Spectrum database. The
sample contains observations from 1993 to 200723. Table 1 summarizes the data availability for
our sample.
Table 1 Sample Selection
Firm-Year Observations
Percent of Initial Sample Firms
Compustat data from 1993-2007 with sufficient data to compute accruals quality measures 44,918 6,767
Observations with insufficient price synchronicity data 9,369 16.50% 1,041
Observations with insufficient data for controls variables 1,778 3.13% 165
Final Sample: 33,771 5,561
Sample by Analyst Following: Followed 20,053 3,883 Not Followed 13,718 3,460
33,771
We start with all firms in Compustat that have available data to compute our accruals
quality measures for the year 1993 to 2007. We require at least 20 firms within each industry-
year regression to estimate the equation (16) and obtain the residuals. To compute the standard
deviation, we require at least four of the last five years residuals. We also require data sufficient
to estimation the innate and discretionary components of accruals quality. This results in a
sample of 6,767 firms for a total of 44,918 firm-year observations.
We collect returns data for our price synchronicity measure from CRSP for all stocks with
a share code of 10 or 11. We require at least three daily returns to calculate a firm’s compound
weekly return. We create a value weighted industry index based on 2-digit SIC industries and 23 Cash flow statement data is available from COMPUSTAT starting with 1987 fiscal years. We need a total of seven years of data to compute the standard deviation, so the first usable year is 1993.
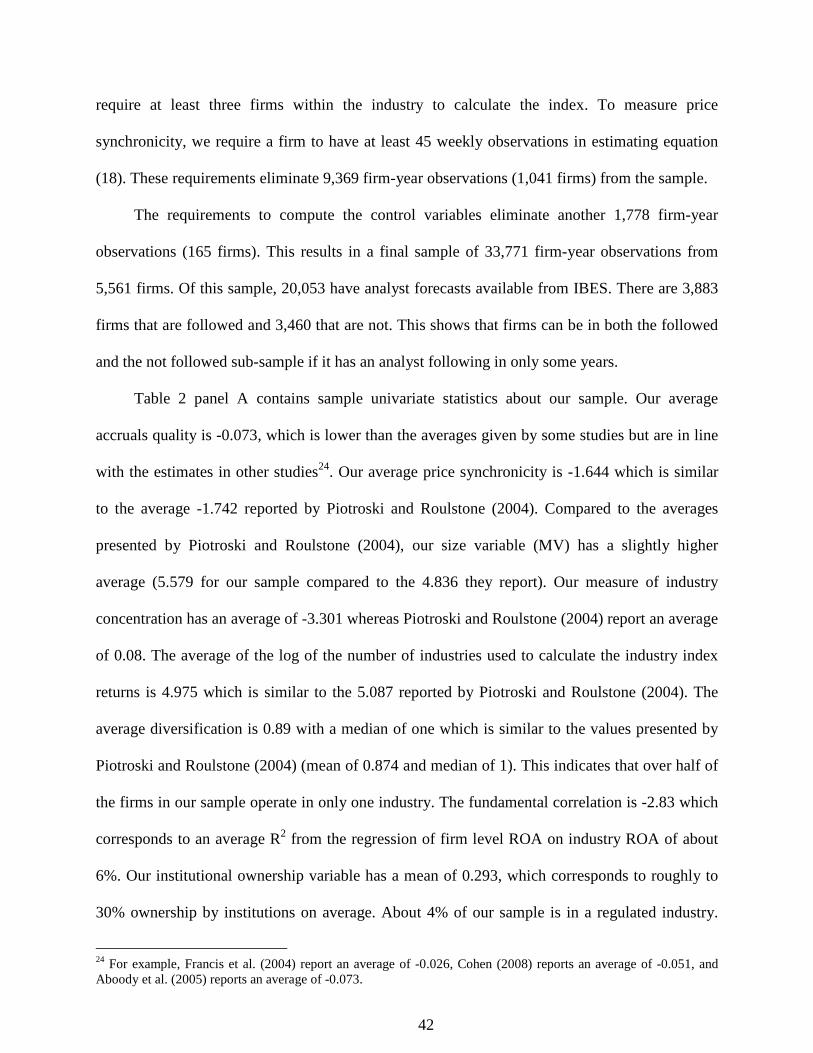
42
require at least three firms within the industry to calculate the index. To measure price
synchronicity, we require a firm to have at least 45 weekly observations in estimating equation
(18). These requirements eliminate 9,369 firm-year observations (1,041 firms) from the sample.
The requirements to compute the control variables eliminate another 1,778 firm-year
observations (165 firms). This results in a final sample of 33,771 firm-year observations from
5,561 firms. Of this sample, 20,053 have analyst forecasts available from IBES. There are 3,883
firms that are followed and 3,460 that are not. This shows that firms can be in both the followed
and the not followed sub-sample if it has an analyst following in only some years.
Table 2 panel A contains sample univariate statistics about our sample. Our average
accruals quality is -0.073, which is lower than the averages given by some studies but are in line
with the estimates in other studies24. Our average price synchronicity is -1.644 which is similar
to the average -1.742 reported by Piotroski and Roulstone (2004). Compared to the averages
presented by Piotroski and Roulstone (2004), our size variable (MV) has a slightly higher
average (5.579 for our sample compared to the 4.836 they report). Our measure of industry
concentration has an average of -3.301 whereas Piotroski and Roulstone (2004) report an average
of 0.08. The average of the log of the number of industries used to calculate the industry index
returns is 4.975 which is similar to the 5.087 reported by Piotroski and Roulstone (2004). The
average diversification is 0.89 with a median of one which is similar to the values presented by
Piotroski and Roulstone (2004) (mean of 0.874 and median of 1). This indicates that over half of
the firms in our sample operate in only one industry. The fundamental correlation is -2.83 which
corresponds to an average R2 from the regression of firm level ROA on industry ROA of about
6%. Our institutional ownership variable has a mean of 0.293, which corresponds to roughly to
30% ownership by institutions on average. About 4% of our sample is in a regulated industry.
24 For example, Francis et al. (2004) report an average of -0.026, Cohen (2008) reports an average of -0.051, and Aboody et al. (2005) reports an average of -0.073.
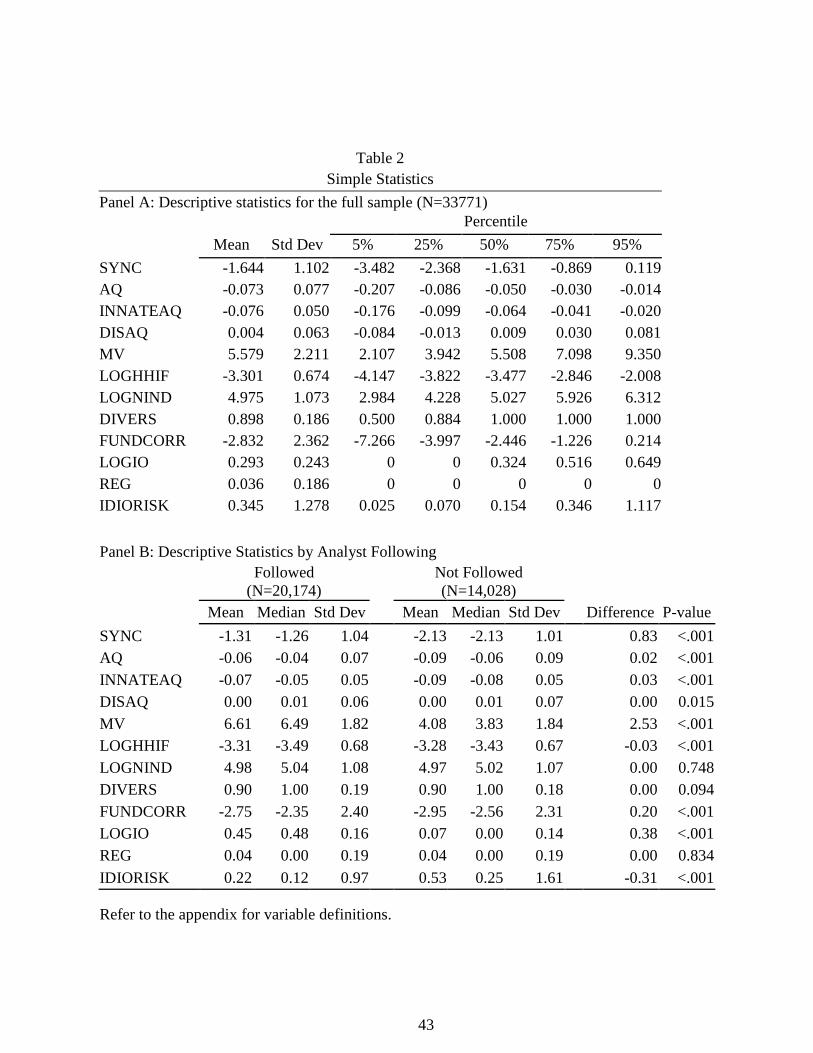
43
Table 2 Simple Statistics
Panel A: Descriptive statistics for the full sample (N=33771) Percentile
Mean Std Dev 5% 25% 50% 75% 95%
SYNC -1.644 1.102 -3.482 -2.368 -1.631 -0.869 0.119 AQ -0.073 0.077 -0.207 -0.086 -0.050 -0.030 -0.014 INNATEAQ -0.076 0.050 -0.176 -0.099 -0.064 -0.041 -0.020 DISAQ 0.004 0.063 -0.084 -0.013 0.009 0.030 0.081 MV 5.579 2.211 2.107 3.942 5.508 7.098 9.350 LOGHHIF -3.301 0.674 -4.147 -3.822 -3.477 -2.846 -2.008 LOGNIND 4.975 1.073 2.984 4.228 5.027 5.926 6.312 DIVERS 0.898 0.186 0.500 0.884 1.000 1.000 1.000 FUNDCORR -2.832 2.362 -7.266 -3.997 -2.446 -1.226 0.214 LOGIO 0.293 0.243 0 0 0.324 0.516 0.649 REG 0.036 0.186 0 0 0 0 0 IDIORISK 0.345 1.278 0.025 0.070 0.154 0.346 1.117
Panel B: Descriptive Statistics by Analyst Following
Followed (N=20,174)
Not Followed (N=14,028)
Mean Median Std Dev
Mean Median Std Dev
Difference P-value
SYNC -1.31 -1.26 1.04
-2.13 -2.13 1.01
0.83 <.001 AQ -0.06 -0.04 0.07
-0.09 -0.06 0.09
0.02 <.001
INNATEAQ -0.07 -0.05 0.05
-0.09 -0.08 0.05
0.03 <.001 DISAQ 0.00 0.01 0.06
0.00 0.01 0.07
0.00 0.015
MV 6.61 6.49 1.82
4.08 3.83 1.84
2.53 <.001 LOGHHIF -3.31 -3.49 0.68
-3.28 -3.43 0.67
-0.03 <.001
LOGNIND 4.98 5.04 1.08
4.97 5.02 1.07
0.00 0.748 DIVERS 0.90 1.00 0.19
0.90 1.00 0.18
0.00 0.094
FUNDCORR -2.75 -2.35 2.40
-2.95 -2.56 2.31
0.20 <.001 LOGIO 0.45 0.48 0.16
0.07 0.00 0.14
0.38 <.001
REG 0.04 0.00 0.19
0.04 0.00 0.19
0.00 0.834
IDIORISK 0.22 0.12 0.97
0.53 0.25 1.61
-0.31 <.001
Refer to the appendix for variable definitions.
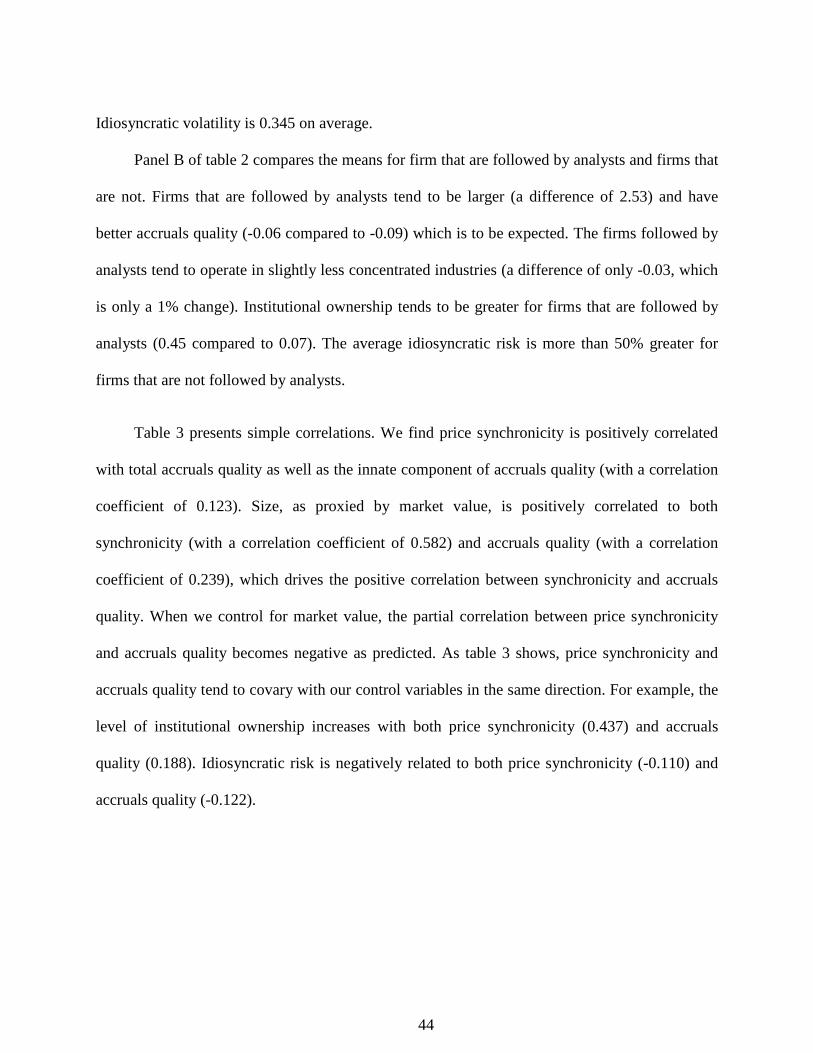
44
Idiosyncratic volatility is 0.345 on average.
Panel B of table 2 compares the means for firm that are followed by analysts and firms that
are not. Firms that are followed by analysts tend to be larger (a difference of 2.53) and have
better accruals quality (-0.06 compared to -0.09) which is to be expected. The firms followed by
analysts tend to operate in slightly less concentrated industries (a difference of only -0.03, which
is only a 1% change). Institutional ownership tends to be greater for firms that are followed by
analysts (0.45 compared to 0.07). The average idiosyncratic risk is more than 50% greater for
firms that are not followed by analysts.
Table 3 presents simple correlations. We find price synchronicity is positively correlated
with total accruals quality as well as the innate component of accruals quality (with a correlation
coefficient of 0.123). Size, as proxied by market value, is positively correlated to both
synchronicity (with a correlation coefficient of 0.582) and accruals quality (with a correlation
coefficient of 0.239), which drives the positive correlation between synchronicity and accruals
quality. When we control for market value, the partial correlation between price synchronicity
and accruals quality becomes negative as predicted. As table 3 shows, price synchronicity and
accruals quality tend to covary with our control variables in the same direction. For example, the
level of institutional ownership increases with both price synchronicity (0.437) and accruals
quality (0.188). Idiosyncratic risk is negatively related to both price synchronicity (-0.110) and
accruals quality (-0.122).
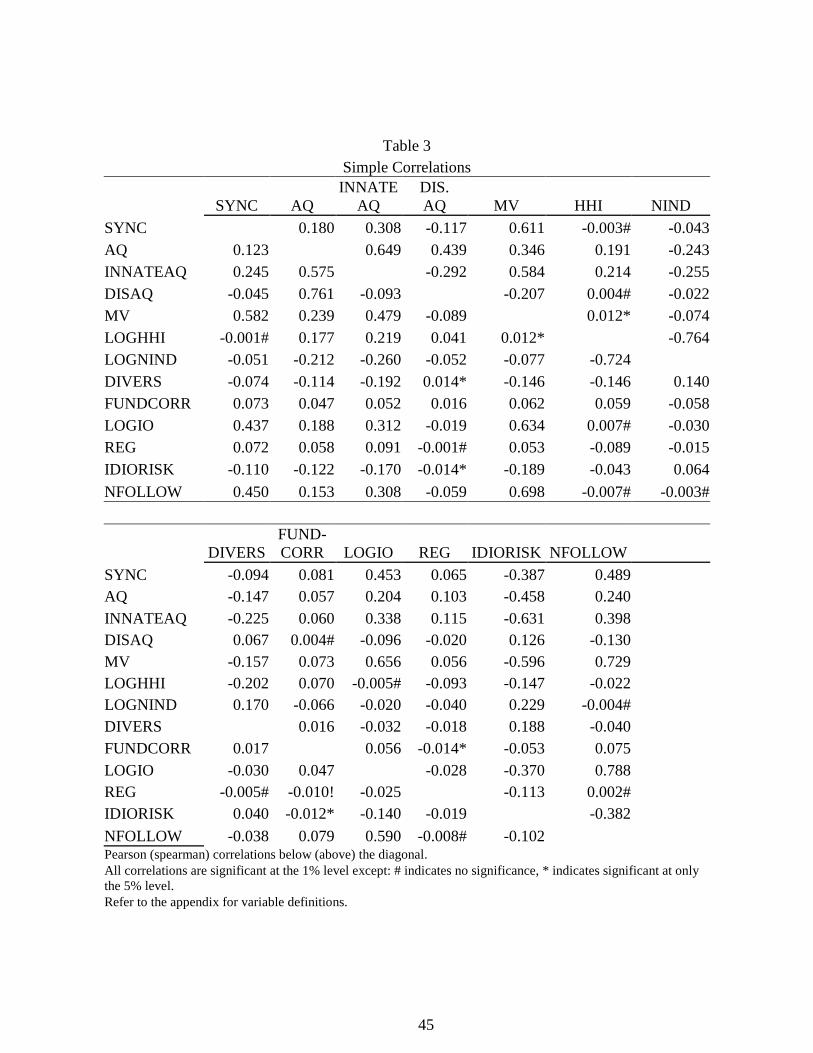
45
Table 3 Simple Correlations
SYNC AQ INNATE
AQ DIS. AQ MV HHI NIND
SYNC 0.180 0.308 -0.117 0.611 -0.003# -0.043 AQ 0.123 0.649 0.439 0.346 0.191 -0.243 INNATEAQ 0.245 0.575 -0.292 0.584 0.214 -0.255 DISAQ -0.045 0.761 -0.093 -0.207 0.004# -0.022 MV 0.582 0.239 0.479 -0.089 0.012* -0.074 LOGHHI -0.001# 0.177 0.219 0.041 0.012* -0.764 LOGNIND -0.051 -0.212 -0.260 -0.052 -0.077 -0.724 DIVERS -0.074 -0.114 -0.192 0.014* -0.146 -0.146 0.140 FUNDCORR 0.073 0.047 0.052 0.016 0.062 0.059 -0.058 LOGIO 0.437 0.188 0.312 -0.019 0.634 0.007# -0.030 REG 0.072 0.058 0.091 -0.001# 0.053 -0.089 -0.015 IDIORISK -0.110 -0.122 -0.170 -0.014* -0.189 -0.043 0.064
NFOLLOW 0.450 0.153 0.308 -0.059 0.698 -0.007# -0.003#
DIVERS FUND- CORR LOGIO REG IDIORISK NFOLLOW
SYNC -0.094 0.081 0.453 0.065 -0.387 0.489
AQ -0.147 0.057 0.204 0.103 -0.458 0.240
INNATEAQ -0.225 0.060 0.338 0.115 -0.631 0.398
DISAQ 0.067 0.004# -0.096 -0.020 0.126 -0.130
MV -0.157 0.073 0.656 0.056 -0.596 0.729
LOGHHI -0.202 0.070 -0.005# -0.093 -0.147 -0.022
LOGNIND 0.170 -0.066 -0.020 -0.040 0.229 -0.004#
DIVERS 0.016 -0.032 -0.018 0.188 -0.040
FUNDCORR 0.017 0.056 -0.014* -0.053 0.075
LOGIO -0.030 0.047 -0.028 -0.370 0.788
REG -0.005# -0.010! -0.025 -0.113 0.002#
IDIORISK 0.040 -0.012* -0.140 -0.019 -0.382
NFOLLOW -0.038 0.079 0.590 -0.008# -0.102 Pearson (spearman) correlations below (above) the diagonal. All correlations are significant at the 1% level except: # indicates no significance, * indicates significant at only the 5% level. Refer to the appendix for variable definitions.

46
5. EMPIRICAL ANALYSIS
This section discusses the results from the tests of our hypotheses presented in section 3.
We first present the results on the relation between accruals quality and price synchronicity. We
then discuss the differences in the association of accruals quality and price synchronicity
between firms that are followed by analysts and firms that are not. Next, we present results
related to the innate and discretionary components of accruals quality.
5.1 The Relation between Accruals Quality and Price Synchronicity
To investigate the relation between accruals quality and price synchronicity, we follow the
model presented in Piotroski and Roulstone (2004). Specifically, we estimate the following
regression:
, 0 1 , 2 , 3 , 4 , 5 ,
6 , 7 , 8 , 9 ,
8
10 , , ,1
i t i t i t i t i t i t
i t i t i t i t
ji t j i t i t
j
SYNCH AQ MV LOGHHIF LOGNIND DIVERS
FUNDCORR LOGIO REG IDIORISK
NFOLLOW IND
β β β β β ββ β β β
β δ ε=
= + + + + ++ + + +
+ + +∑
(20)
SYNCHi,t = Price synchronicity for firm i in year t; AQi,t = Accruals quality for firm i in year t; MV i,t = Market value for firm i in year t; LOGHHIFi,t = Log of the Herfindahl index for firm i in year t; LOGNINDi,t = Log of the average number of firms used to create the industry
index in equation (18) for firm i in year t; DIVERSi,t = Diversification index for firm i in year t; FUNDCORRi,t = Fundamental correlation of firm i’s quarterly earnings with an
industry earnings index in years t-2 to t;
LOGIO,t = Log of one plus the percent of institutional ownership for firm i in year t;
REGi,t = Dummy variable equal to one if firm i’s primary 2-digit SIC code is 62 or 49 in year t, zero otherwise;
IDIORISKi,t = Idiosyncratic risk for firm i in year t; NFOLLOWi,t = Number of analyst forecasts made in the month of firm i’s
earnings announcement for year t;
IND ji,t = Industry dummy variables based on 1-digit SIC codes.
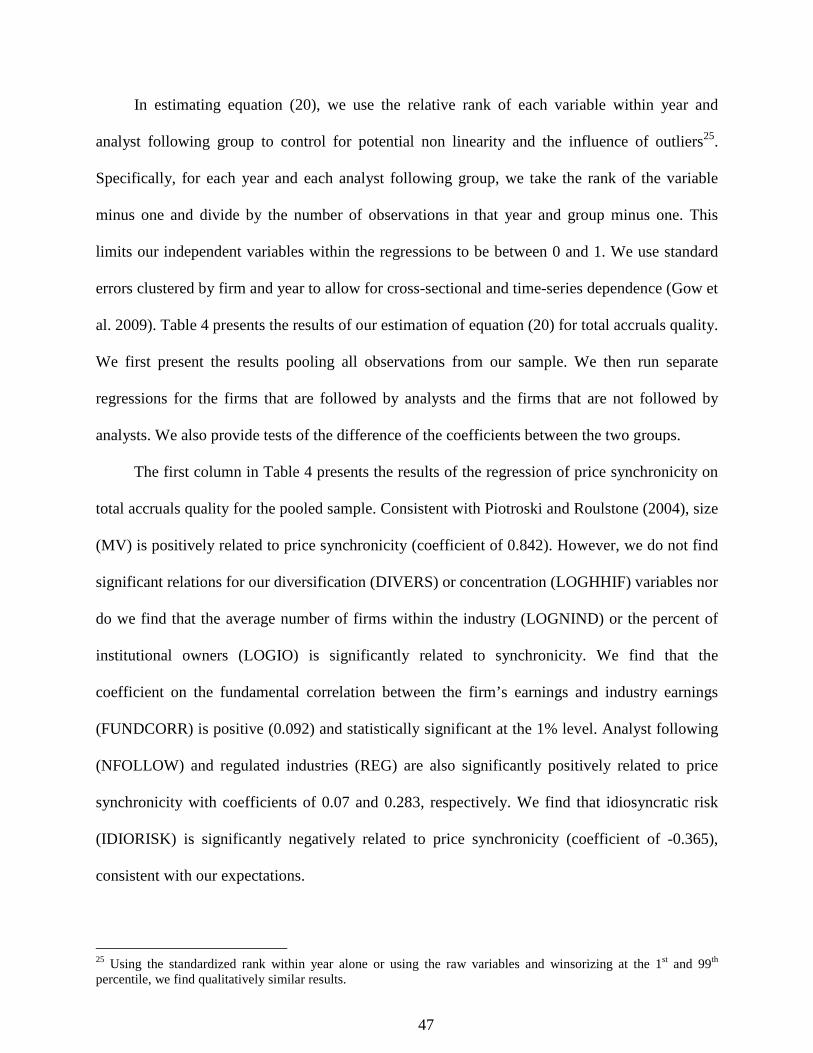
47
In estimating equation (20), we use the relative rank of each variable within year and
analyst following group to control for potential non linearity and the influence of outliers25.
Specifically, for each year and each analyst following group, we take the rank of the variable
minus one and divide by the number of observations in that year and group minus one. This
limits our independent variables within the regressions to be between 0 and 1. We use standard
errors clustered by firm and year to allow for cross-sectional and time-series dependence (Gow et
al. 2009). Table 4 presents the results of our estimation of equation (20) for total accruals quality.
We first present the results pooling all observations from our sample. We then run separate
regressions for the firms that are followed by analysts and the firms that are not followed by
analysts. We also provide tests of the difference of the coefficients between the two groups.
The first column in Table 4 presents the results of the regression of price synchronicity on
total accruals quality for the pooled sample. Consistent with Piotroski and Roulstone (2004), size
(MV) is positively related to price synchronicity (coefficient of 0.842). However, we do not find
significant relations for our diversification (DIVERS) or concentration (LOGHHIF) variables nor
do we find that the average number of firms within the industry (LOGNIND) or the percent of
institutional owners (LOGIO) is significantly related to synchronicity. We find that the
coefficient on the fundamental correlation between the firm’s earnings and industry earnings
(FUNDCORR) is positive (0.092) and statistically significant at the 1% level. Analyst following
(NFOLLOW) and regulated industries (REG) are also significantly positively related to price
synchronicity with coefficients of 0.07 and 0.283, respectively. We find that idiosyncratic risk
(IDIORISK) is significantly negatively related to price synchronicity (coefficient of -0.365),
consistent with our expectations.
25 Using the standardized rank within year alone or using the raw variables and winsorizing at the 1st and 99th percentile, we find qualitatively similar results.
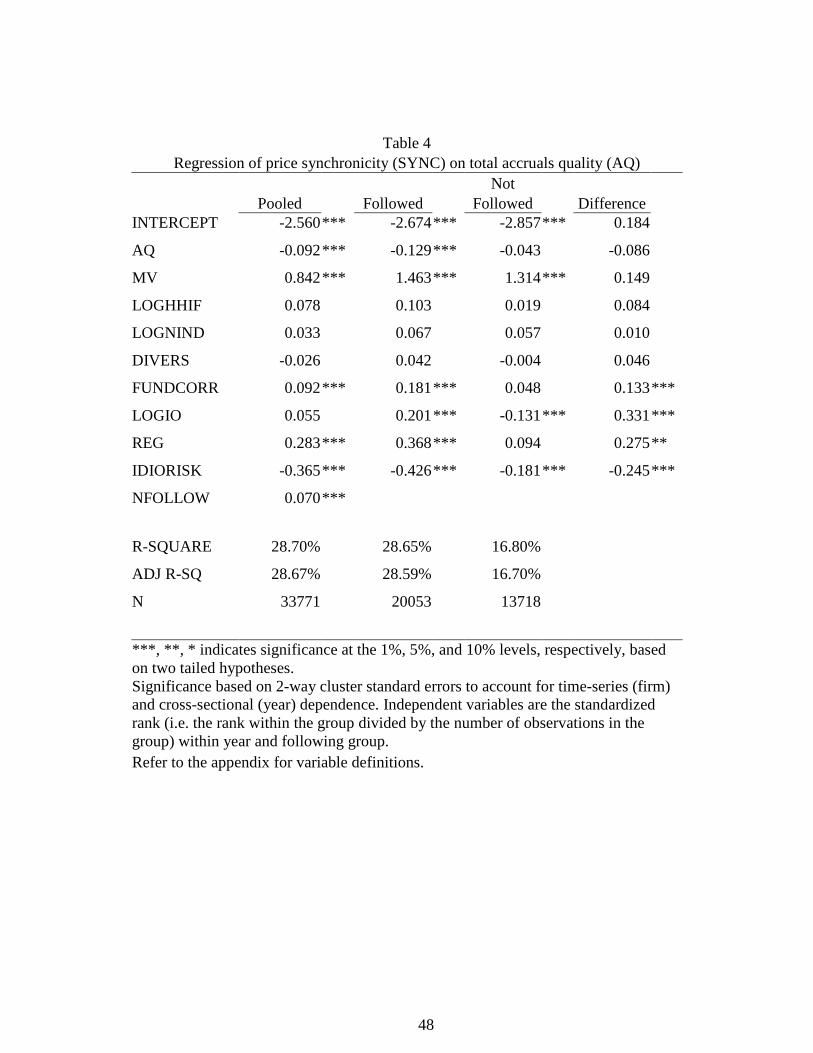
48
Table 4 Regression of price synchronicity (SYNC) on total accruals quality (AQ)
Not Pooled Followed Followed Difference
INTERCEPT -2.560 *** -2.674 *** -2.857 *** 0.184
AQ -0.092 *** -0.129 *** -0.043 -0.086
MV 0.842 *** 1.463 *** 1.314 *** 0.149
LOGHHIF 0.078 0.103 0.019 0.084
LOGNIND 0.033 0.067 0.057 0.010
DIVERS -0.026 0.042 -0.004 0.046
FUNDCORR 0.092 *** 0.181 *** 0.048 0.133 ***
LOGIO 0.055 0.201 *** -0.131 *** 0.331 ***
REG 0.283 *** 0.368 *** 0.094 0.275 **
IDIORISK -0.365 *** -0.426 *** -0.181 *** -0.245 ***
NFOLLOW 0.070 ***
R-SQUARE 28.70% 28.65% 16.80%
ADJ R-SQ 28.67% 28.59% 16.70%
N 33771 20053 13718
***, **, * indicates significance at the 1%, 5%, and 10% levels, respectively, based on two tailed hypotheses. Significance based on 2-way cluster standard errors to account for time-series (firm) and cross-sectional (year) dependence. Independent variables are the standardized rank (i.e. the rank within the group divided by the number of observations in the group) within year and following group. Refer to the appendix for variable definitions.
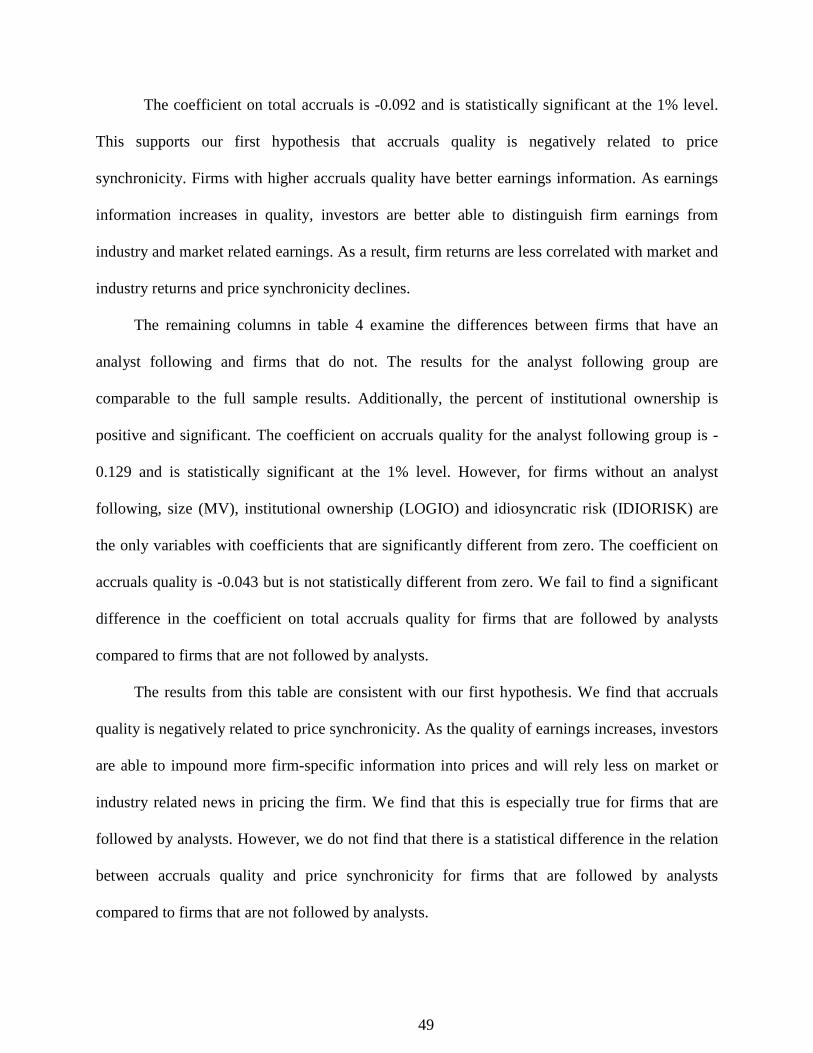
49
The coefficient on total accruals is -0.092 and is statistically significant at the 1% level.
This supports our first hypothesis that accruals quality is negatively related to price
synchronicity. Firms with higher accruals quality have better earnings information. As earnings
information increases in quality, investors are better able to distinguish firm earnings from
industry and market related earnings. As a result, firm returns are less correlated with market and
industry returns and price synchronicity declines.
The remaining columns in table 4 examine the differences between firms that have an
analyst following and firms that do not. The results for the analyst following group are
comparable to the full sample results. Additionally, the percent of institutional ownership is
positive and significant. The coefficient on accruals quality for the analyst following group is -
0.129 and is statistically significant at the 1% level. However, for firms without an analyst
following, size (MV), institutional ownership (LOGIO) and idiosyncratic risk (IDIORISK) are
the only variables with coefficients that are significantly different from zero. The coefficient on
accruals quality is -0.043 but is not statistically different from zero. We fail to find a significant
difference in the coefficient on total accruals quality for firms that are followed by analysts
compared to firms that are not followed by analysts.
The results from this table are consistent with our first hypothesis. We find that accruals
quality is negatively related to price synchronicity. As the quality of earnings increases, investors
are able to impound more firm-specific information into prices and will rely less on market or
industry related news in pricing the firm. We find that this is especially true for firms that are
followed by analysts. However, we do not find that there is a statistical difference in the relation
between accruals quality and price synchronicity for firms that are followed by analysts
compared to firms that are not followed by analysts.

50
5.2 The Relation between the Components of Accruals Quality and Price Synchronicity
Table 5 presents our results on the relation between the innate component of accruals
quality and price synchronicity. For the pooled model, the coefficient on the innate component of
accruals quality is -0.252 and is significant at the 1% level. Firms that are followed by analysts
have a coefficient of -0.340 (with a significance level of 1%) whereas firms that do not have an
analyst following only have a coefficient of -0.100, and is only significantly different from zero
at the 10% level of significance. The difference in the coefficients on the innate component of
accruals quality is -0.240 and is significantly different than zero at the 1% level. These results are
consistent with our second hypothesis of a negative relation between the innate component of
accruals quality and price synchronicity.
Table 6 presents the results from the regression of price synchronicity on the discretionary
component of accruals quality. The coefficient on the discretionary component of accruals
quality for the pooled model is -0.004. For the firms that are (not) followed by analysts, the
coefficient on the discretionary component of accruals quality is -0.012 (-0.028). The coefficient
is not statistically different than zero in any of the models. This may be a result of the mixture of
uses managers employ with their discretion. Some managers may be trying to reveal information
to investors through discretionary accruals; others may be acting opportunistically and managing
earnings for personal gain.
We include both the innate and the discretionary components in the models in table 7. Both
components are negative and significantly related to price synchronicity for the pooled model.
The coefficient on the innate component of accruals quality is -0.266 (significant at the 1% level)
and the coefficient on the discretionary component of accruals quality is -0.046 (significant at the
5% level. When we divide the sample by analyst following, we find the coefficient on the innate
component of accruals quality decreases to -0.367 and the coefficient on the discretionary
component deceases to -0.074. For the firms that do not have an analyst following, the
51
Table 5 Regression of price synchronicity (SYNC) on the innate component of accruals
quality (INNATEAQ) Not
Pooled Followed Followed Difference INTERCEPT -2.625 *** -2.769 *** -2.878 *** 0.109
INNATEAQ -0.252 *** -0.340 *** -0.100 * -0.240 ***
MV 0.904 *** 1.566 *** 1.333 *** 0.233
LOGHHIF 0.088 0.119 0.022 0.098
LOGNIND 0.017 0.048 0.050 -0.002
DIVERS -0.042 0.024 -0.011 0.035
FUNDCORR 0.091 *** 0.181 *** 0.048 0.132 ***
LOGIO 0.055 0.196 *** -0.128 *** 0.324 ***
REG 0.299 *** 0.393 *** 0.098 0.294 **
IDIORISK -0.447 *** -0.532 *** -0.212 *** -0.320 ***
NFOLLOW 0.070 ***
R-SQUARE 28.87% 28.94% 16.84%
ADJ R-SQ 28.83% 28.88% 16.73%
N 33771 20053 13718
***, **, * indicates significance at the 1%, 5%, and 10% levels, respectively, based on two tailed hypotheses. Significance based on 2-way cluster standard errors to account for time-series (firm) and cross-sectional (year) dependence. Independent variables are the standardized rank (i.e. the rank within the group divided by the number of observations in the group) within year and following group. Refer to the appendix for variable definitions.
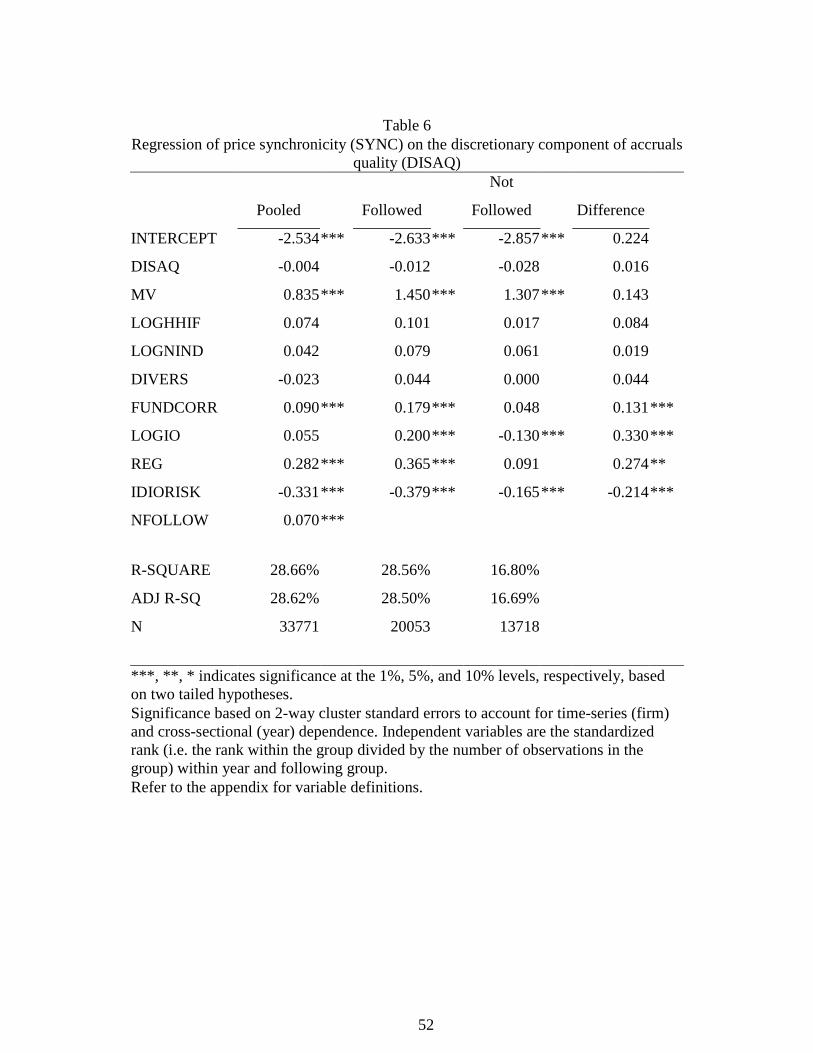
52
Table 6
Regression of price synchronicity (SYNC) on the discretionary component of accruals quality (DISAQ)
Not
Pooled Followed Followed Difference
INTERCEPT -2.534 *** -2.633 *** -2.857 *** 0.224
DISAQ -0.004 -0.012 -0.028 0.016
MV 0.835 *** 1.450 *** 1.307 *** 0.143
LOGHHIF 0.074 0.101 0.017 0.084
LOGNIND 0.042 0.079 0.061 0.019
DIVERS -0.023 0.044 0.000 0.044
FUNDCORR 0.090 *** 0.179 *** 0.048 0.131 ***
LOGIO 0.055 0.200 *** -0.130 *** 0.330 ***
REG 0.282 *** 0.365 *** 0.091 0.274 **
IDIORISK -0.331 *** -0.379 *** -0.165 *** -0.214 ***
NFOLLOW 0.070 ***
R-SQUARE 28.66% 28.56% 16.80%
ADJ R-SQ 28.62% 28.50% 16.69%
N 33771 20053 13718
***, **, * indicates significance at the 1%, 5%, and 10% levels, respectively, based on two tailed hypotheses. Significance based on 2-way cluster standard errors to account for time-series (firm) and cross-sectional (year) dependence. Independent variables are the standardized rank (i.e. the rank within the group divided by the number of observations in the group) within year and following group. Refer to the appendix for variable definitions.

53
coefficient on the innate component of accruals quality is -0.111 and only moderately significant
at the 10% level. The coefficient on the discretionary component of accruals quality is -0.043 but
is not significantly different from zero. The difference in the coefficient of the innate component
of accruals quality between the analyst following groups is -0.256 and is significant at the 1%
level.
The results from this section are consistent with our second hypothesis of a negative
relation between price synchronicity and the innate component of accruals quality. However, we
only find moderate support for our third hypothesis that there is a negative relation between price
synchronicity and the discretionary component of accruals quality. Our finding of a consistently
negative relation between only between the innate component of accruals quality and price
synchronicity is consistent with the notion that the discretionary accruals component captures a
mixture of information and opportunism. We also find that the relation between the innate
component of accruals quality and price synchronicity is more negative for firms that are
followed by analysts. This provides evidence in favor of a complementary relation between
earnings information and analysts’ information.
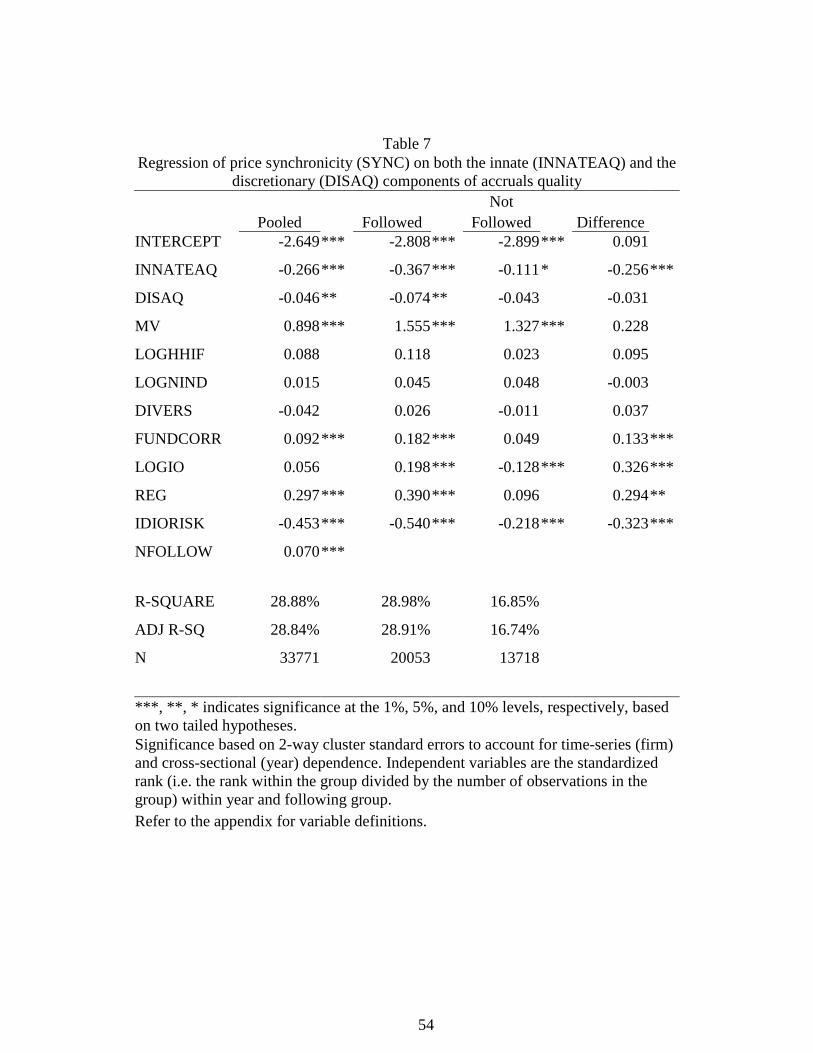
54
Table 7 Regression of price synchronicity (SYNC) on both the innate (INNATEAQ) and the
discretionary (DISAQ) components of accruals quality Not
Pooled Followed Followed Difference INTERCEPT -2.649 *** -2.808 *** -2.899 *** 0.091
INNATEAQ -0.266 *** -0.367 *** -0.111 * -0.256 ***
DISAQ -0.046 ** -0.074 ** -0.043 -0.031
MV 0.898 *** 1.555 *** 1.327 *** 0.228
LOGHHIF 0.088 0.118 0.023 0.095
LOGNIND 0.015 0.045 0.048 -0.003
DIVERS -0.042 0.026 -0.011 0.037
FUNDCORR 0.092 *** 0.182 *** 0.049 0.133 ***
LOGIO 0.056 0.198 *** -0.128 *** 0.326 ***
REG 0.297 *** 0.390 *** 0.096 0.294 **
IDIORISK -0.453 *** -0.540 *** -0.218 *** -0.323 ***
NFOLLOW 0.070 ***
R-SQUARE 28.88% 28.98% 16.85%
ADJ R-SQ 28.84% 28.91% 16.74%
N 33771 20053 13718
***, **, * indicates significance at the 1%, 5%, and 10% levels, respectively, based on two tailed hypotheses. Significance based on 2-way cluster standard errors to account for time-series (firm) and cross-sectional (year) dependence. Independent variables are the standardized rank (i.e. the rank within the group divided by the number of observations in the group) within year and following group. Refer to the appendix for variable definitions.

55
6. SENSITIVITY AND ADDITIONAL ANALYSIS
6.1 Alternative Measures of Accruals Quality
6.1.1 Longer Horizon for Accruals Quality
Our primary measure of accruals quality uses the standard deviation of the residual from
equation (16) over the last five years. We use the standard deviation over the last ten years of the
residual from equation (16) as an alternative measure of accruals quality. Tables 8, 9, 10, and 11
reproduce tables 4, 5, 6 and 7 using this alternative measure of accruals quality.
In table 8, we observe a coefficient of -0.091 between total accruals quality and price
synchronicity in the pooled sample. For firms that have an analyst following, the coefficient on
the longer horizon accruals quality is -0.124 and is statistically significant at the 1% level. Unlike
our main analysis, the longer horizon accruals quality and price synchronicity are also negatively
related for firms that do not have an analyst following (coefficient of -0.091). The difference in
the coefficients between the two groups is not significantly different from zero. These results are
consistent with the results in table 4 and support our first hypothesis.
The results in table 9 are similar to those in table 5. The coefficient on the innate
component of accruals quality over the longer horizon is -0.248 and is significant at the 1% level.
The coefficient is -0.337 for the analyst following group and -0.108 for the group without an
analyst following. The difference of -0.229 in the coefficients is significant at the 1% level.
These results support our analysis presented in table 5.
In tables 10, the coefficient on the discretionary component of accruals quality over a
longer window continues to be not significantly different for the pooled model and the analyst
following group. For firms that do not have an analyst following, the coefficient is -0.081 and is
significantly related to price synchronicity at the 5% level. Further, the difference between the
coefficient for the followed and not followed groups (0.094) is significantly different from zero
at the 1% level.
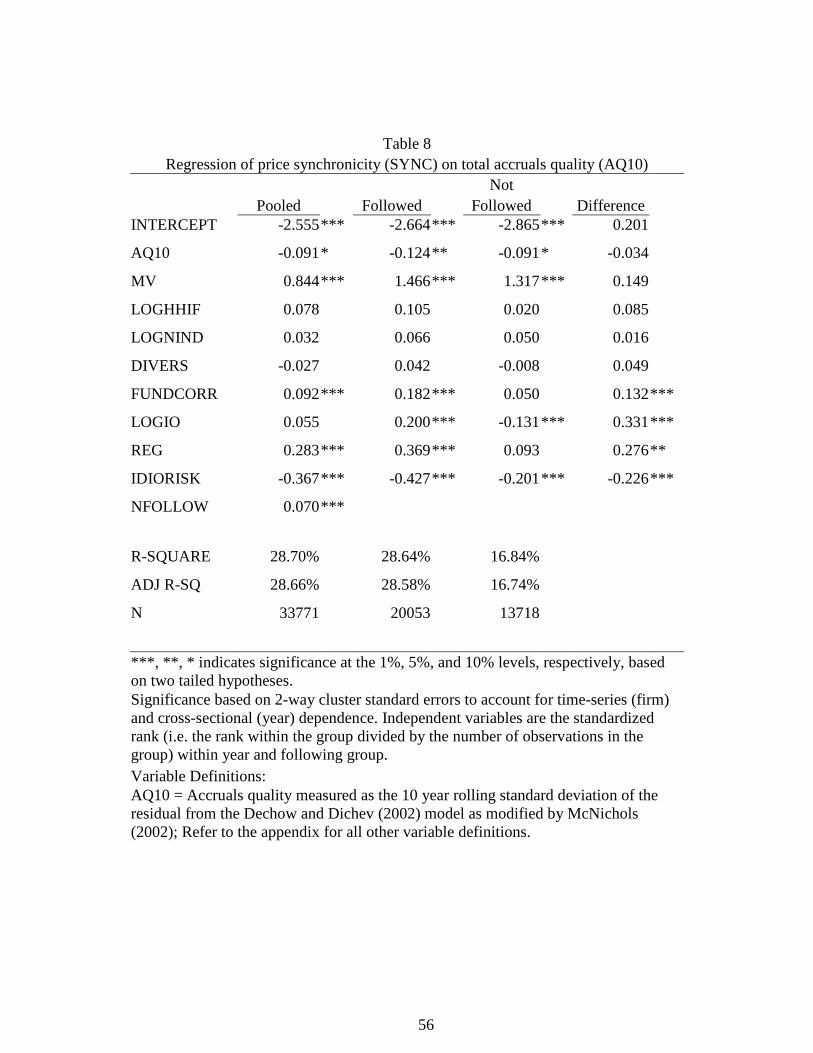
56
Table 8 Regression of price synchronicity (SYNC) on total accruals quality (AQ10)
Not Pooled Followed Followed Difference
INTERCEPT -2.555 *** -2.664 *** -2.865 *** 0.201
AQ10 -0.091 * -0.124 ** -0.091 * -0.034
MV 0.844 *** 1.466 *** 1.317 *** 0.149
LOGHHIF 0.078 0.105 0.020 0.085
LOGNIND 0.032 0.066 0.050 0.016
DIVERS -0.027 0.042 -0.008 0.049
FUNDCORR 0.092 *** 0.182 *** 0.050 0.132 ***
LOGIO 0.055 0.200 *** -0.131 *** 0.331 ***
REG 0.283 *** 0.369 *** 0.093 0.276 **
IDIORISK -0.367 *** -0.427 *** -0.201 *** -0.226 ***
NFOLLOW 0.070 ***
R-SQUARE 28.70% 28.64% 16.84%
ADJ R-SQ 28.66% 28.58% 16.74%
N 33771 20053 13718
***, **, * indicates significance at the 1%, 5%, and 10% levels, respectively, based on two tailed hypotheses. Significance based on 2-way cluster standard errors to account for time-series (firm) and cross-sectional (year) dependence. Independent variables are the standardized rank (i.e. the rank within the group divided by the number of observations in the group) within year and following group. Variable Definitions: AQ10 = Accruals quality measured as the 10 year rolling standard deviation of the residual from the Dechow and Dichev (2002) model as modified by McNichols (2002); Refer to the appendix for all other variable definitions.
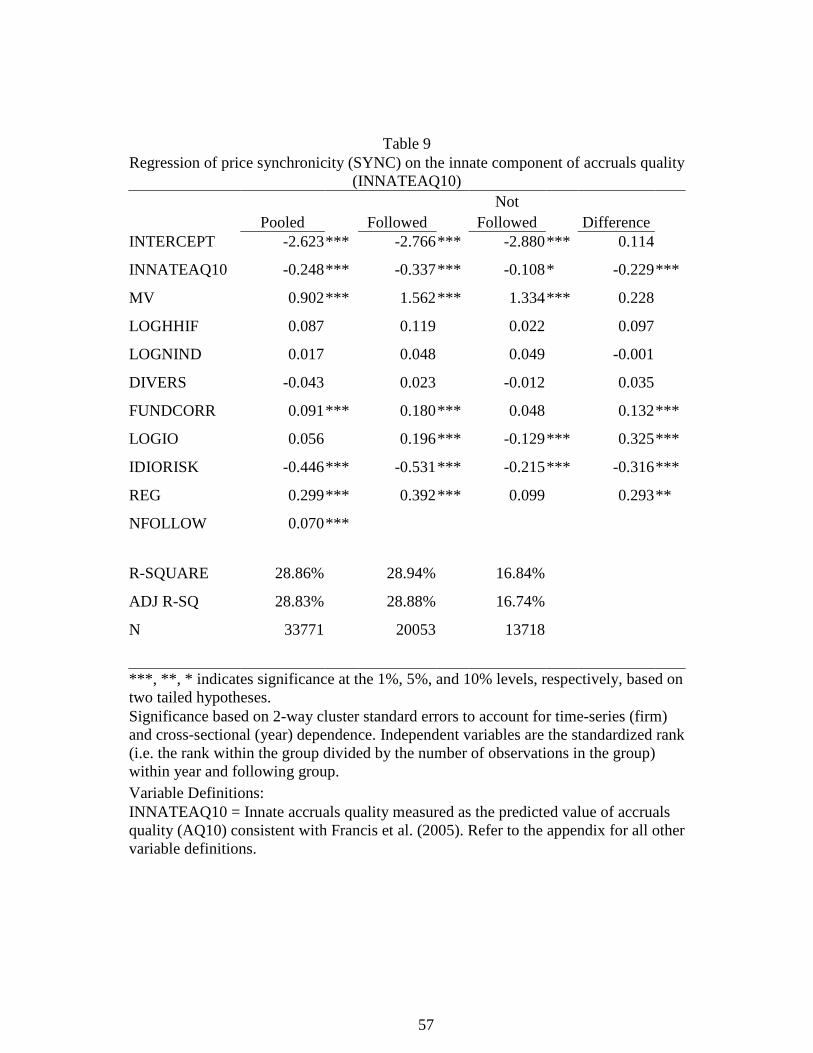
57
Table 9 Regression of price synchronicity (SYNC) on the innate component of accruals quality
(INNATEAQ10) Not
Pooled Followed Followed Difference INTERCEPT -2.623 *** -2.766 *** -2.880 *** 0.114
INNATEAQ10 -0.248 *** -0.337 *** -0.108 * -0.229 ***
MV 0.902 *** 1.562 *** 1.334 *** 0.228
LOGHHIF 0.087 0.119 0.022 0.097
LOGNIND 0.017 0.048 0.049 -0.001
DIVERS -0.043 0.023 -0.012 0.035
FUNDCORR 0.091 *** 0.180 *** 0.048 0.132 ***
LOGIO 0.056 0.196 *** -0.129 *** 0.325 ***
IDIORISK -0.446 *** -0.531 *** -0.215 *** -0.316 ***
REG 0.299 *** 0.392 *** 0.099 0.293 **
NFOLLOW 0.070 ***
R-SQUARE 28.86% 28.94% 16.84%
ADJ R-SQ 28.83% 28.88% 16.74%
N 33771 20053 13718
***, **, * indicates significance at the 1%, 5%, and 10% levels, respectively, based on two tailed hypotheses. Significance based on 2-way cluster standard errors to account for time-series (firm) and cross-sectional (year) dependence. Independent variables are the standardized rank (i.e. the rank within the group divided by the number of observations in the group) within year and following group. Variable Definitions: INNATEAQ10 = Innate accruals quality measured as the predicted value of accruals quality (AQ10) consistent with Francis et al. (2005). Refer to the appendix for all other variable definitions.
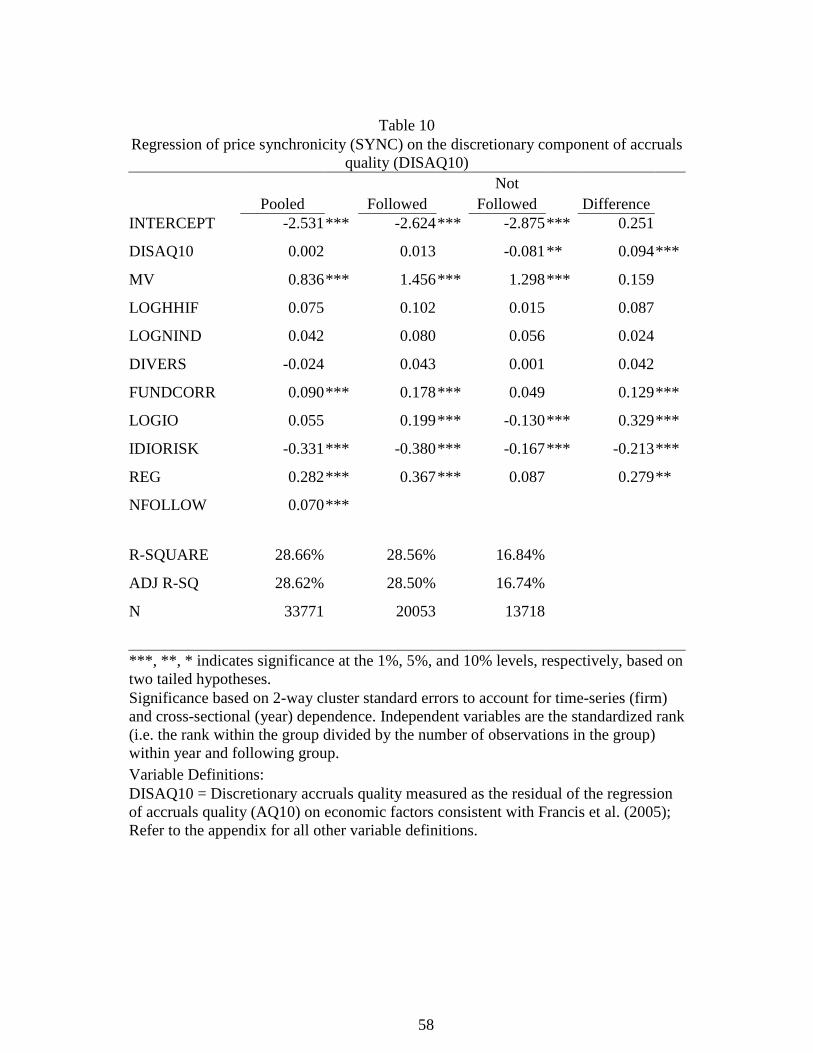
58
Table 10
Regression of price synchronicity (SYNC) on the discretionary component of accruals quality (DISAQ10)
Not Pooled Followed Followed Difference
INTERCEPT -2.531 *** -2.624 *** -2.875 *** 0.251
DISAQ10 0.002 0.013 -0.081 ** 0.094 ***
MV 0.836 *** 1.456 *** 1.298 *** 0.159
LOGHHIF 0.075 0.102 0.015 0.087
LOGNIND 0.042 0.080 0.056 0.024
DIVERS -0.024 0.043 0.001 0.042
FUNDCORR 0.090 *** 0.178 *** 0.049 0.129 ***
LOGIO 0.055 0.199 *** -0.130 *** 0.329 ***
IDIORISK -0.331 *** -0.380 *** -0.167 *** -0.213 ***
REG 0.282 *** 0.367 *** 0.087 0.279 **
NFOLLOW 0.070 ***
R-SQUARE 28.66% 28.56% 16.84%
ADJ R-SQ 28.62% 28.50% 16.74%
N 33771 20053 13718
***, **, * indicates significance at the 1%, 5%, and 10% levels, respectively, based on two tailed hypotheses. Significance based on 2-way cluster standard errors to account for time-series (firm) and cross-sectional (year) dependence. Independent variables are the standardized rank (i.e. the rank within the group divided by the number of observations in the group) within year and following group. Variable Definitions: DISAQ10 = Discretionary accruals quality measured as the residual of the regression of accruals quality (AQ10) on economic factors consistent with Francis et al. (2005); Refer to the appendix for all other variable definitions.
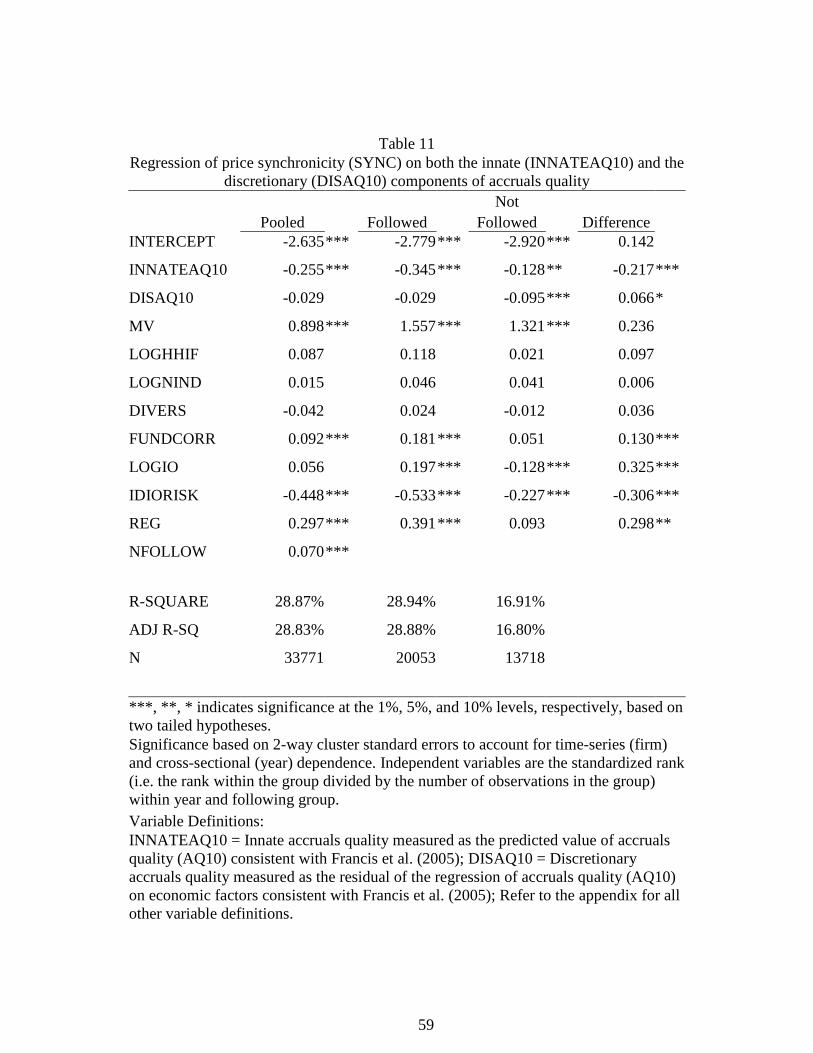
59
Table 11 Regression of price synchronicity (SYNC) on both the innate (INNATEAQ10) and the
discretionary (DISAQ10) components of accruals quality Not
Pooled Followed Followed Difference INTERCEPT -2.635 *** -2.779 *** -2.920 *** 0.142
INNATEAQ10 -0.255 *** -0.345 *** -0.128 ** -0.217 ***
DISAQ10 -0.029 -0.029 -0.095 *** 0.066 *
MV 0.898 *** 1.557 *** 1.321 *** 0.236
LOGHHIF 0.087 0.118 0.021 0.097
LOGNIND 0.015 0.046 0.041 0.006
DIVERS -0.042 0.024 -0.012 0.036
FUNDCORR 0.092 *** 0.181 *** 0.051 0.130 ***
LOGIO 0.056 0.197 *** -0.128 *** 0.325 ***
IDIORISK -0.448 *** -0.533 *** -0.227 *** -0.306 ***
REG 0.297 *** 0.391 *** 0.093 0.298 **
NFOLLOW 0.070 ***
R-SQUARE 28.87% 28.94% 16.91%
ADJ R-SQ 28.83% 28.88% 16.80%
N 33771 20053 13718
***, **, * indicates significance at the 1%, 5%, and 10% levels, respectively, based on two tailed hypotheses. Significance based on 2-way cluster standard errors to account for time-series (firm) and cross-sectional (year) dependence. Independent variables are the standardized rank (i.e. the rank within the group divided by the number of observations in the group) within year and following group. Variable Definitions: INNATEAQ10 = Innate accruals quality measured as the predicted value of accruals quality (AQ10) consistent with Francis et al. (2005); DISAQ10 = Discretionary accruals quality measured as the residual of the regression of accruals quality (AQ10) on economic factors consistent with Francis et al. (2005); Refer to the appendix for all other variable definitions.

60
Table 11 presents the model that includes both the innate and discretionary components of
accruals quality estimated over the longer horizon. As with table 9, the coefficient on the innate
component of accruals quality is negatively related to price synchronicity for the pooled model
as well as both of the subsamples. The coefficient for the analyst following group continues to be
more negative than the coefficient for the group that is not followed. This suggests that, over
long horizon, the discretionary accruals plays more of a role in providing firm-specific
information to the market for firms that are not followed by financial analysts compared to firms
that are followed by financial analysts.
6.1.2 Abnormal Accruals as a Measure of Accruals Quality
The use of abnormal accruals for the Jones (1991) model as a measure of accruals quality
is common in the literature (e.g. Francis et al. 2005). We use the modified-Jones model abnormal
accruals computed as follows. We estimate the following regression equation by year and 2-digit
SIC industry:
, , ,0 1 2 ,
, , , ,
1i t i t i ti t
i t i t i t i t
TA REV PPE
Assets Assets Assets Assetsα α α ε
∆= + + + (21)
Where: TAj,t = Total accruals, defined as the difference between net income before extraordinary
items (Compustat quarterly data item 8) and cash flow from operations (data308) less cash flow from extraordinary items (data124) in year t.
Assetsi,t = Firm i’s average total assets (data6) in years t and t-1 DREVi,t = Firm i’s change in sales (data12) in year t
PPEi,t = Firm i’s gross property, plant and equipment (data7) in year t
Abnormal accruals is defined as the difference between the observed level of total
accruals and the fitted value of total accruals using change in revenue less change in receivables
instead of just change in revenue. Specifically, abnormal accruals are defined as:
, , , ,, 0 1 2
, , , ,
1ˆ ˆ ˆ( )i t i t i t i t
i ti t i t i t i t
TA REV REC PPEAAMJ
Assets Assets Assets Assetsα α α
∆ − ∆= − + + (22)

61
Where DREC is the change in current receivables (data2), α̂ are the estimates from
equation (6) and the other variables are as previously defined. We use the absolute value of
AAMJ as an alternative measure of accruals quality (ABSAAMJ). The expected value of
absolute value of AAMJ is an increasing function of the variance of the error term in equation
(21). As such, the ABSAAMJ is sometimes interpreted as accruals quality.
Table 12 presents are results using ABSAAMJ as our measure of accruals quality. We find
that, for the pooled sample, the coefficient on ABSAAMJ is -0.068 and is significant at the 1%
level. We also find a negative and significant coefficient on ABSAAMJ for the analyst following
group (-0.096). We fail to find a significant relation between accruals quality and price
synchronicity. We also fail to find a significant difference between the followed and not
followed groups. These results are similar to that of table 4 where we used total accruals quality.
We also consider abnormal accruals based on the modified-Jones model controlling for firm
level performance. Kothari et al. (2005) suggest that abnormal accruals are correlated with firm
performance. We measure abnormal accruals based on the modified Jones model controlling for
firm level performance in a similar manner as ABSAAMJ, but we add a net income before
extraordinary items as a control for firm performance in our estimation equation. Specifically we
use the following equations to define our second measure of abnormal accruals:
, , , ,0 1 2 3 ,
, , , , ,
1i t i t i t i ti t
i t i t i t i t i t
TA REV PPE NIBE
Assets Assets Assets Assets Assetsα α α α ε
∆= + + + + (23)
, , , , ,, 0 1 2 3
, , , , ,
1ˆ ˆ ˆ ˆ( )i t i t i t i t i t
i ti t i t i t i t i t
TA REV REC PPE NIBEAAMK
Assets Assets Assets Assets Assetsα α α α
∆ − ∆= − + + + (24)
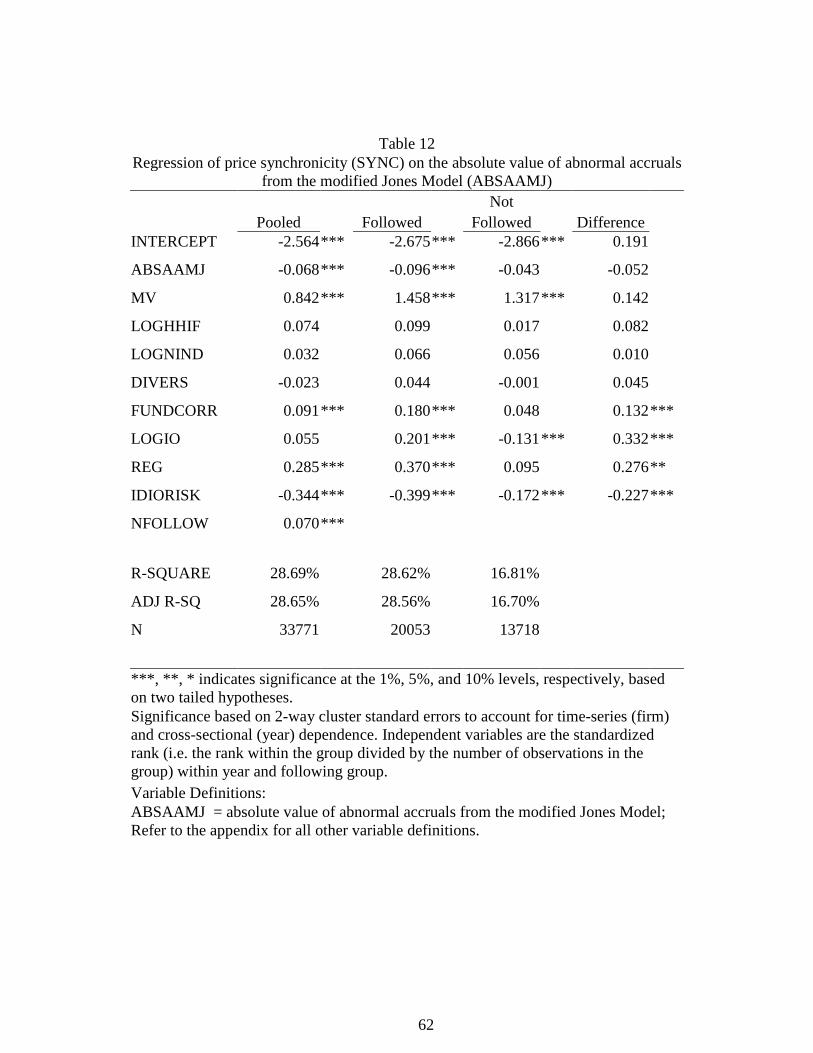
62
Table 12 Regression of price synchronicity (SYNC) on the absolute value of abnormal accruals
from the modified Jones Model (ABSAAMJ) Not
Pooled Followed Followed Difference INTERCEPT -2.564 *** -2.675 *** -2.866 *** 0.191
ABSAAMJ -0.068 *** -0.096 *** -0.043 -0.052
MV 0.842 *** 1.458 *** 1.317 *** 0.142
LOGHHIF 0.074 0.099 0.017 0.082
LOGNIND 0.032 0.066 0.056 0.010
DIVERS -0.023 0.044 -0.001 0.045
FUNDCORR 0.091 *** 0.180 *** 0.048 0.132 ***
LOGIO 0.055 0.201 *** -0.131 *** 0.332 ***
REG 0.285 *** 0.370 *** 0.095 0.276 **
IDIORISK -0.344 *** -0.399 *** -0.172 *** -0.227 ***
NFOLLOW 0.070 ***
R-SQUARE 28.69% 28.62% 16.81%
ADJ R-SQ 28.65% 28.56% 16.70%
N 33771 20053 13718
***, **, * indicates significance at the 1%, 5%, and 10% levels, respectively, based on two tailed hypotheses. Significance based on 2-way cluster standard errors to account for time-series (firm) and cross-sectional (year) dependence. Independent variables are the standardized rank (i.e. the rank within the group divided by the number of observations in the group) within year and following group. Variable Definitions: ABSAAMJ = absolute value of abnormal accruals from the modified Jones Model; Refer to the appendix for all other variable definitions.

63
Where: TAj,t = Total accruals, defined as the difference between net income before extraordinary
items (data18) and cash flow from operations (data308) less cash flow from extraordinary items (data124) in year t.
Assetsi,t = Firm i’s average total assets (data6) in years t and t-1 DREVi,t = Firm i’s change in sales (data12) in year t
PPEi,t = Firm i’s gross property, plant and equipment (data7) in year t
DRECi,t = Firm i’s change in receivables (data2) in year t
NIBEi,t = Firm i’s net income before extraordinary items (data18) in year t
Table 13 presents results using the absolute value of abnormal accruals based on the
modified Jones model controlling for firm level performance (ABSAAMK) as a measure of
accruals quality. As with table 4 and table 12, we find that the coefficient is negative and
significant for the pooled model (-0.049) and for the analyst following group (-0.074). Again,
we fail to find a significant relation between ABSAAMK and price synchronicity for the non-
analyst following group and we do not find a significant difference in the coefficient on
ABSAAMK between the two groups.
Using various different measures of accruals quality, we find results that are consistent
with our main results. When we extend the number of years included in our accruals quality
measures, we find total and innate accruals quality has a negative relation with price
synchronicity, and this negative relation is greater for firms that have an analyst following. A
result that is not present in our main result is a significantly negative relation between the
discretionary accruals quality component and price synchronicity for firms that are not followed
by analysts. This could suggest that the discretionary component of accruals quality may convey
information to investors that is already present in analyst information. For our abnormal accruals
measures (ABSAAMJ and ABSAAMK), we find results that are qualitatively similar to our main
results using total accruals quality (table 4). Specifically, we find that the absolute value of
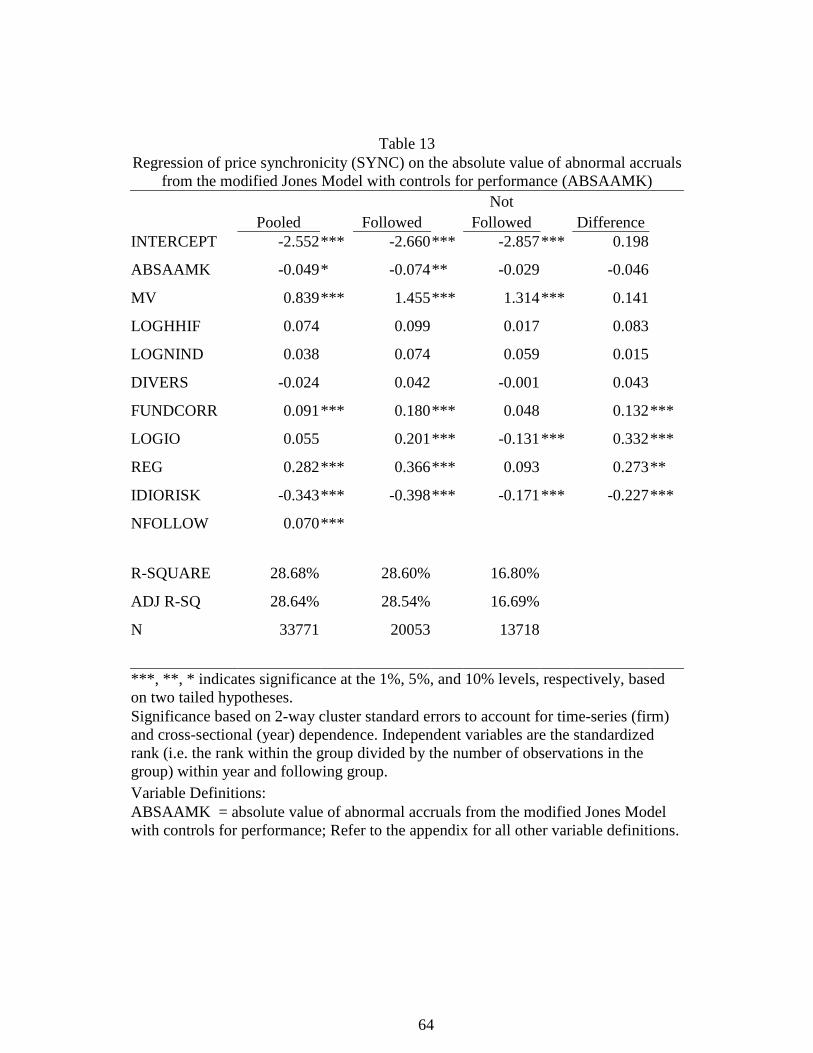
64
Table 13 Regression of price synchronicity (SYNC) on the absolute value of abnormal accruals
from the modified Jones Model with controls for performance (ABSAAMK) Not
Pooled Followed Followed Difference INTERCEPT -2.552 *** -2.660 *** -2.857 *** 0.198
ABSAAMK -0.049 * -0.074 ** -0.029 -0.046
MV 0.839 *** 1.455 *** 1.314 *** 0.141
LOGHHIF 0.074 0.099 0.017 0.083
LOGNIND 0.038 0.074 0.059 0.015
DIVERS -0.024 0.042 -0.001 0.043
FUNDCORR 0.091 *** 0.180 *** 0.048 0.132 ***
LOGIO 0.055 0.201 *** -0.131 *** 0.332 ***
REG 0.282 *** 0.366 *** 0.093 0.273 **
IDIORISK -0.343 *** -0.398 *** -0.171 *** -0.227 ***
NFOLLOW 0.070 ***
R-SQUARE 28.68% 28.60% 16.80%
ADJ R-SQ 28.64% 28.54% 16.69%
N 33771 20053 13718
***, **, * indicates significance at the 1%, 5%, and 10% levels, respectively, based on two tailed hypotheses. Significance based on 2-way cluster standard errors to account for time-series (firm) and cross-sectional (year) dependence. Independent variables are the standardized rank (i.e. the rank within the group divided by the number of observations in the group) within year and following group. Variable Definitions: ABSAAMK = absolute value of abnormal accruals from the modified Jones Model with controls for performance; Refer to the appendix for all other variable definitions.

65
abnormal accruals is negatively related to price synchronicity on average and is mainly due to
the firms that are followed by analysts. The results from this section show that are main results
are generally robust to alternative measures of accruals quality.
6.2 Endogeneity of Accruals Quality
We present the argument that higher accruals quality allows investors to distinguish firm-
specific earnings from market and industry earnings, thereby reducing price synchronicity. An
alternative view is that low price synchronicity increases the monitoring done by the market and
is jointly determined along with other monitoring mechanisms and accruals quality. Thus
accruals quality is endogenously determined. We use a two-stage regression technique similar to
the one used by Cohen (2008) and Brown and Hillegeist (2007). Following Cohen (2008), we
estimate the following first stage regression:
, 0 1 , 2 , 2 , 3 , 4 , 5 ,
6 , 7 , 8 , 9 , ,
i t i t i t i t i t i t i t
i t i t i t i t i t
AQ OWNER GROWTH LIT LEV OC AGE
HHIF NSEG ASSETS PUBLICISSUE
α α α α α α αα α α α ε
= + + + + + +
+ + + + + (25)
Where: AQi,t = Accruals quality for firm i in year t; OWNERi,t = Natural log of the number of shareholders of firm i in year t (data100)
minus natural log of the mean number of shareholders (in thousands) in the firm’s size decile;
GROWTHi,t = Growth in firm i’s sales (data6) over year t, LIT i,t = Dummy variable equal to one if firm i is in a “high-litigation” industry in
year t, zero otherwise; LEV i,t = Leverage for firm i in year t, calculated as long-term debt (data9) plus
debt in current liabilities (data34) divided by firm value (data199 times data25);
OCi,t = Operating cycle for firm i at time t, measured in days as, where AR is the firm’s accounts receivable, INV is the firm’s inventory, and COGS is the firm’s cost of goods sold;
AGEi,t = Firm i’s age, natural logarithm of number of months the company has been listed on CRSP;
HHIFi,t = Weighted average Herfindahl index of industry level concentration based on segment sales within 2-digit SIC industry.
NSEGi,t = Number of two-digit SIC code industries that firm i is engaged in year t; ASSETSi,t = Natural log of total assets for firm i in year t; PUBLICISSUEi,t = Dummy variable equal to one if firm i issued debt or equity during the
years t to t+2, and zero otherwise;

66
Equation (25) is estimated by year and 2-digit SIC industry. Our second stage uses the predicted
value from equation (25) in place of our accruals quality. Table 14 presents the results from this
instrumental variable regression. The coefficient on accruals quality is -0.165 and is significant
at the 5% level for the pooled model. For the analysts following group, we find a significantly
negative (at the 5% level) coefficient of -0.208. The coefficient on accruals quality for firms that
do not have an analysts following is -0.106, but this is not statistically different from zero.
Additionally, the difference between the coefficients for the analyst following groups is not
significantly different from zero. These results are similar to the results for total accruals quality
presented in table 4. This suggests that our results are robust to the endogenous nature of
accruals quality choice.
6.3 Synchronicity to Fama And French (1993) Three Factor Model
Price synchronicity is typically measured based on a market and industry index. Generally
small, high growth firms have low accruals quality. If prices are responding to size and growth
factor rather than market or industry factors, accruals quality could be capturing this effect rather
than responses to firm-specific information. To investigate the possibility, we include size and
book-to-market factors26 to explain firm returns. Specifically, we run the following weekly firm-
specific regression:
, 0 1 , 2 , 1 3 , 4 , 1
5 , 6 , 1 7 , 8 , 1 ,
i w i w i w i w i w
i w i w i w i w i w
RET MKTRET MKTRET INDRET INDRET
SMB SMB HML HML
α α α α αα α α α ε
− −
− −
= + + + +
+ + + + + (26)
Where: RETi,w = Compound return for company i for week w. MKTRETi,w = Compound weekly return for value weighted market index from CRSP
excluding firm i for week w. INDRETi,w = Compound weekly return for value weighted industry index from CRSP
excluding firm i for week w. SMBi,w = Compound weekly return on a size portfolio based on market value of equity. HMLi,w = Compound weekly return on a growth portfolio based on market-to-book value. 26 We use the weekly size and growth index returns from Kenneth French’s web site: (http://mba.tuck.dartmouth.edu/pages/faculty/ken.french/Data_Library/f-f_factors.html)
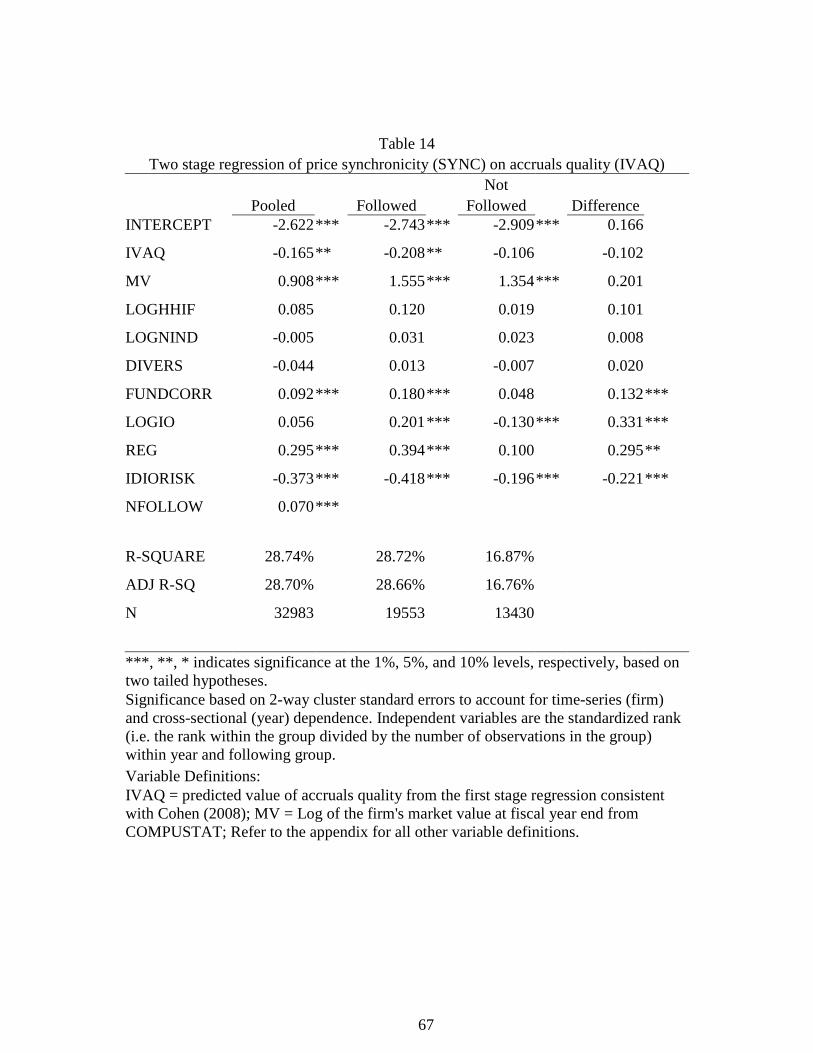
67
Table 14 Two stage regression of price synchronicity (SYNC) on accruals quality (IVAQ)
Not Pooled Followed Followed Difference
INTERCEPT -2.622 *** -2.743 *** -2.909 *** 0.166
IVAQ -0.165 ** -0.208 ** -0.106 -0.102
MV 0.908 *** 1.555 *** 1.354 *** 0.201
LOGHHIF 0.085 0.120 0.019 0.101
LOGNIND -0.005 0.031 0.023 0.008
DIVERS -0.044 0.013 -0.007 0.020
FUNDCORR 0.092 *** 0.180 *** 0.048 0.132 ***
LOGIO 0.056 0.201 *** -0.130 *** 0.331 ***
REG 0.295 *** 0.394 *** 0.100 0.295 **
IDIORISK -0.373 *** -0.418 *** -0.196 *** -0.221 ***
NFOLLOW 0.070 ***
R-SQUARE 28.74% 28.72% 16.87%
ADJ R-SQ 28.70% 28.66% 16.76%
N 32983 19553 13430
***, **, * indicates significance at the 1%, 5%, and 10% levels, respectively, based on two tailed hypotheses. Significance based on 2-way cluster standard errors to account for time-series (firm) and cross-sectional (year) dependence. Independent variables are the standardized rank (i.e. the rank within the group divided by the number of observations in the group) within year and following group. Variable Definitions: IVAQ = predicted value of accruals quality from the first stage regression consistent with Cohen (2008); MV = Log of the firm's market value at fiscal year end from COMPUSTAT; Refer to the appendix for all other variable definitions.

68
In table 15, we present results using price synchronicity from equation (26) which parallels
table 4. We find a significantly negative relation between total accruals quality and price
synchronicity for the pooled model (coefficient of -0.060) and the analyst following subsample
(coefficient of -0.074). As with table 4, we fail to find a significant relation between total
accruals quality and price synchronicity. The difference in the coefficient on total accruals
quality between the followed and not followed groups is also not significant.
Table 16 presents the results for the innate component of accruals quality using the Fama-
French model. The coefficient on the innate component of accruals quality is -0.166 and is
significant at the 1% level for the pooled sample. For the analyst following group, we find also
find a negative and significant relation between the innate component of accruals quality and
price synchronicity (coefficient of -0.224). We find no significant relation for the not followed
group. The relation for the followed group is significantly more negative than the not followed
group (a difference of -0.165). These results are consistent with table 5.
Table 17 presents the result for the discretionary component of accruals quality. We fail to
find any significant relation between the discretionary component of accruals quality and price
synchronicity. The results are consistent with the results presented in table 6.
When we include both the innate and discretionary components in the model (Table 18),
we find a negative and significant relation between both the innate and discretionary components
of accruals quality and price synchronicity for the pooled model (coefficients of -0.178 and -
0.037, respectively). For the analyst following group, we find a coefficient of -0.242 on the
innate component of accruals quality and a coefficient of -0.050 for the discretionary component
of accruals quality. For the not followed group, we find that the innate component of accruals
quality is not significantly related to price synchronicity (coefficient of -0.070). However, the
discretionary component of accruals quality is significantly negative with a coefficient of -0.070
at the 5% level. The difference in the coefficients between the followed and not followed is
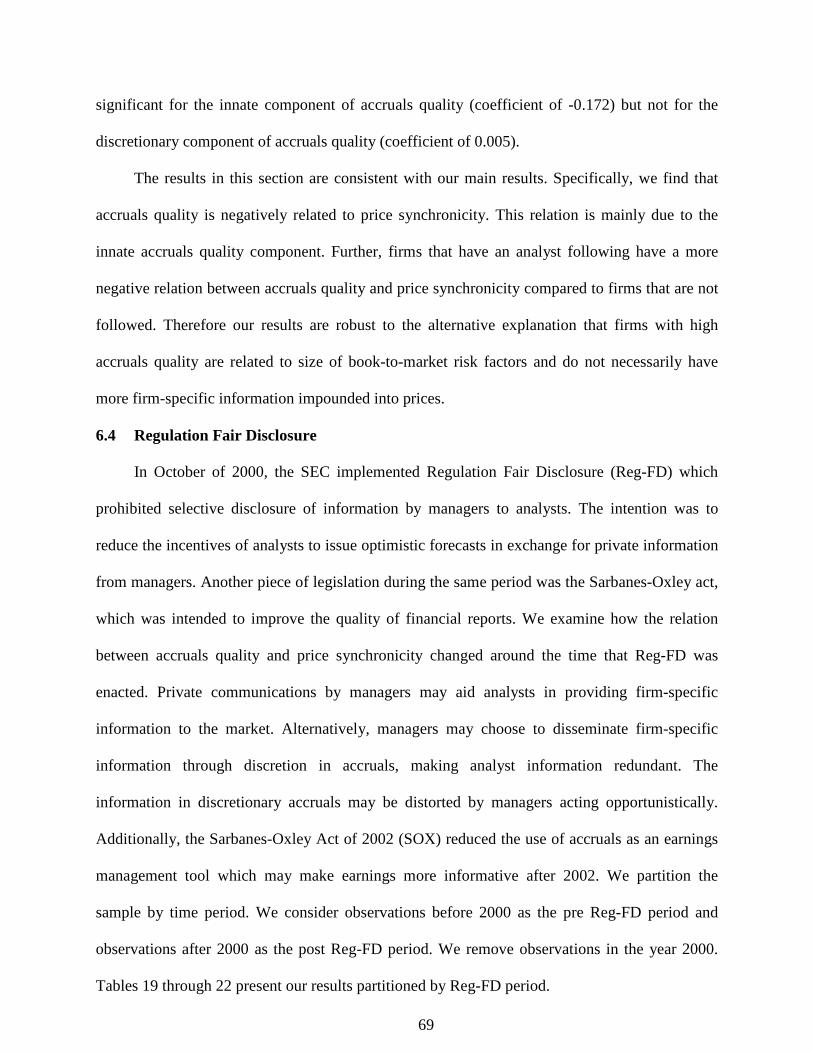
69
significant for the innate component of accruals quality (coefficient of -0.172) but not for the
discretionary component of accruals quality (coefficient of 0.005).
The results in this section are consistent with our main results. Specifically, we find that
accruals quality is negatively related to price synchronicity. This relation is mainly due to the
innate accruals quality component. Further, firms that have an analyst following have a more
negative relation between accruals quality and price synchronicity compared to firms that are not
followed. Therefore our results are robust to the alternative explanation that firms with high
accruals quality are related to size of book-to-market risk factors and do not necessarily have
more firm-specific information impounded into prices.
6.4 Regulation Fair Disclosure
In October of 2000, the SEC implemented Regulation Fair Disclosure (Reg-FD) which
prohibited selective disclosure of information by managers to analysts. The intention was to
reduce the incentives of analysts to issue optimistic forecasts in exchange for private information
from managers. Another piece of legislation during the same period was the Sarbanes-Oxley act,
which was intended to improve the quality of financial reports. We examine how the relation
between accruals quality and price synchronicity changed around the time that Reg-FD was
enacted. Private communications by managers may aid analysts in providing firm-specific
information to the market. Alternatively, managers may choose to disseminate firm-specific
information through discretion in accruals, making analyst information redundant. The
information in discretionary accruals may be distorted by managers acting opportunistically.
Additionally, the Sarbanes-Oxley Act of 2002 (SOX) reduced the use of accruals as an earnings
management tool which may make earnings more informative after 2002. We partition the
sample by time period. We consider observations before 2000 as the pre Reg-FD period and
observations after 2000 as the post Reg-FD period. We remove observations in the year 2000.
Tables 19 through 22 present our results partitioned by Reg-FD period.
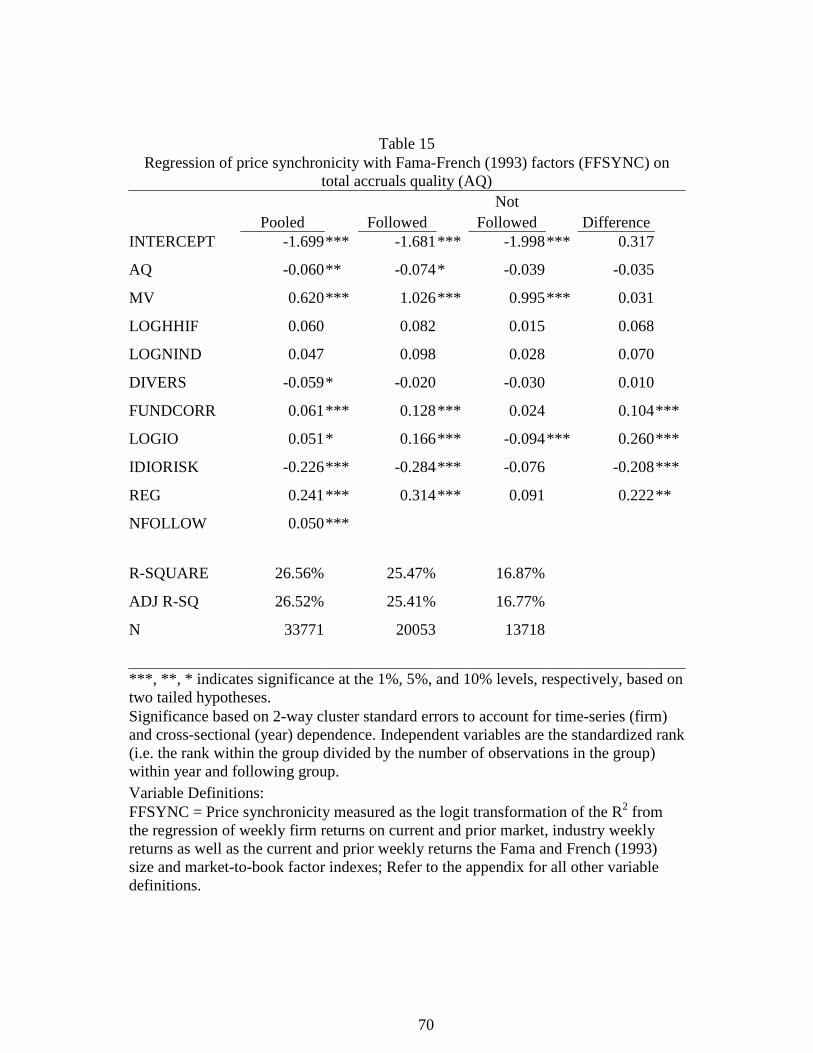
70
Table 15 Regression of price synchronicity with Fama-French (1993) factors (FFSYNC) on
total accruals quality (AQ) Not
Pooled Followed Followed Difference INTERCEPT -1.699 *** -1.681 *** -1.998 *** 0.317
AQ -0.060 ** -0.074 * -0.039 -0.035
MV 0.620 *** 1.026 *** 0.995 *** 0.031
LOGHHIF 0.060 0.082 0.015 0.068
LOGNIND 0.047 0.098 0.028 0.070
DIVERS -0.059 * -0.020 -0.030 0.010
FUNDCORR 0.061 *** 0.128 *** 0.024 0.104 ***
LOGIO 0.051 * 0.166 *** -0.094 *** 0.260 ***
IDIORISK -0.226 *** -0.284 *** -0.076 -0.208 ***
REG 0.241 *** 0.314 *** 0.091 0.222 **
NFOLLOW 0.050 ***
R-SQUARE 26.56% 25.47% 16.87%
ADJ R-SQ 26.52% 25.41% 16.77%
N 33771 20053 13718
***, **, * indicates significance at the 1%, 5%, and 10% levels, respectively, based on two tailed hypotheses. Significance based on 2-way cluster standard errors to account for time-series (firm) and cross-sectional (year) dependence. Independent variables are the standardized rank (i.e. the rank within the group divided by the number of observations in the group) within year and following group. Variable Definitions: FFSYNC = Price synchronicity measured as the logit transformation of the R2 from the regression of weekly firm returns on current and prior market, industry weekly returns as well as the current and prior weekly returns the Fama and French (1993) size and market-to-book factor indexes; Refer to the appendix for all other variable definitions.
71
Table 16 Regression of price synchronicity with Fama-French (1993) factors (FFSYNC) on
the innate component of accruals quality (INNATEAQ) Not
Pooled Followed Followed Difference INTERCEPT -1.742 *** -1.748 *** -2.006 *** 0.259
INNATEAQ -0.166 *** -0.224 *** -0.059 -0.165 ***
MV 0.661 *** 1.095 *** 1.005 *** 0.090
LOGHHIF 0.067 0.093 * 0.016 0.078
LOGNIND 0.036 0.085 0.025 0.060
DIVERS -0.069 ** -0.032 -0.033 0.001
FUNDCORR 0.061 *** 0.128 *** 0.024 0.104 ***
LOGIO 0.051 * 0.163 *** -0.093 *** 0.255 ***
IDIORISK -0.281 *** -0.358 *** -0.089 * -0.269 ***
REG 0.251 *** 0.330 *** 0.094 0.236 ***
NFOLLOW 0.050 ***
R-SQUARE 26.69% 25.70% 16.88%
ADJ R-SQ 26.65% 25.64% 16.78%
N 33771 20053 13718
***, **, * indicates significance at the 1%, 5%, and 10% levels, respectively, based on two tailed hypotheses. Significance based on 2-way cluster standard errors to account for time-series (firm) and cross-sectional (year) dependence. Independent variables are the standardized rank (i.e. the rank within the group divided by the number of observations in the group) within year and following group. Variable Definitions: FFSYNC = Price synchronicity measured as the logit transformation of the R2 from the regression of weekly firm returns on current and prior market, industry weekly returns as well as the current and prior weekly returns the Fama and French (1993) size and market-to-book factor indexes; Refer to the appendix for all other variable definitions.
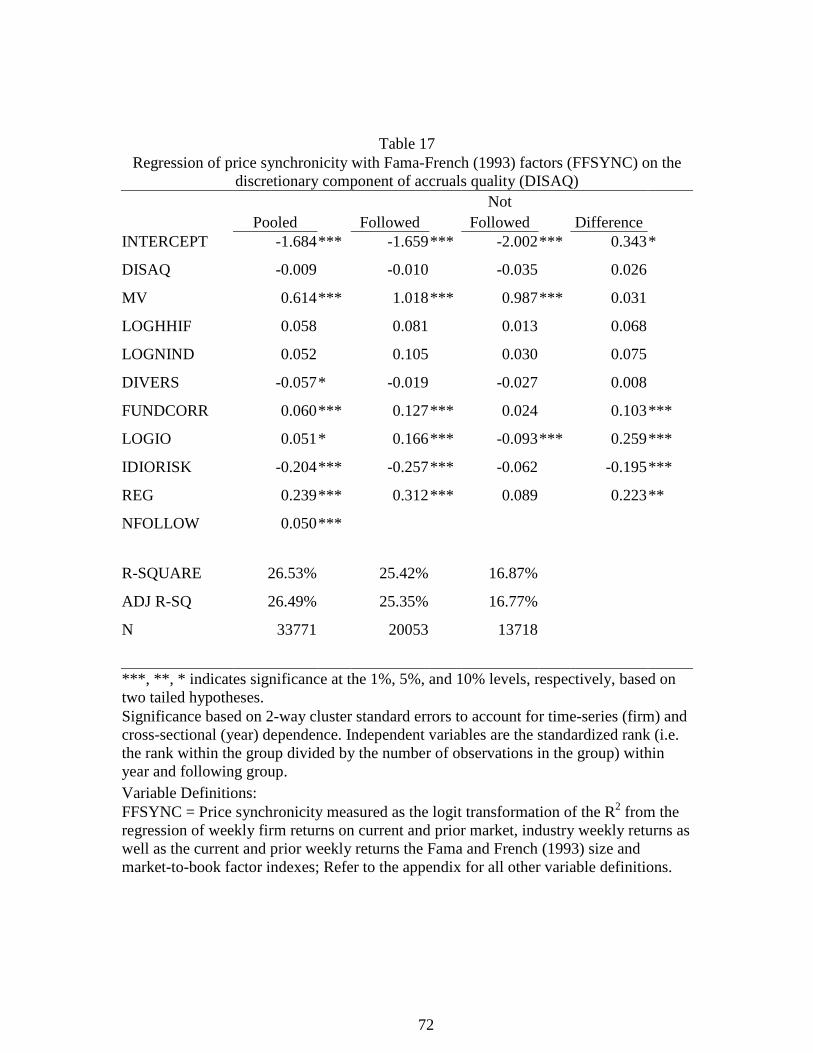
72
Table 17 Regression of price synchronicity with Fama-French (1993) factors (FFSYNC) on the
discretionary component of accruals quality (DISAQ) Not
Pooled Followed Followed Difference INTERCEPT -1.684 *** -1.659 *** -2.002 *** 0.343 *
DISAQ -0.009 -0.010 -0.035 0.026
MV 0.614 *** 1.018 *** 0.987 *** 0.031
LOGHHIF 0.058 0.081 0.013 0.068
LOGNIND 0.052 0.105 0.030 0.075
DIVERS -0.057 * -0.019 -0.027 0.008
FUNDCORR 0.060 *** 0.127 *** 0.024 0.103 ***
LOGIO 0.051 * 0.166 *** -0.093 *** 0.259 ***
IDIORISK -0.204 *** -0.257 *** -0.062 -0.195 ***
REG 0.239 *** 0.312 *** 0.089 0.223 **
NFOLLOW 0.050 ***
R-SQUARE 26.53% 25.42% 16.87%
ADJ R-SQ 26.49% 25.35% 16.77%
N 33771 20053 13718
***, **, * indicates significance at the 1%, 5%, and 10% levels, respectively, based on two tailed hypotheses. Significance based on 2-way cluster standard errors to account for time-series (firm) and cross-sectional (year) dependence. Independent variables are the standardized rank (i.e. the rank within the group divided by the number of observations in the group) within year and following group. Variable Definitions: FFSYNC = Price synchronicity measured as the logit transformation of the R2 from the regression of weekly firm returns on current and prior market, industry weekly returns as well as the current and prior weekly returns the Fama and French (1993) size and market-to-book factor indexes; Refer to the appendix for all other variable definitions.
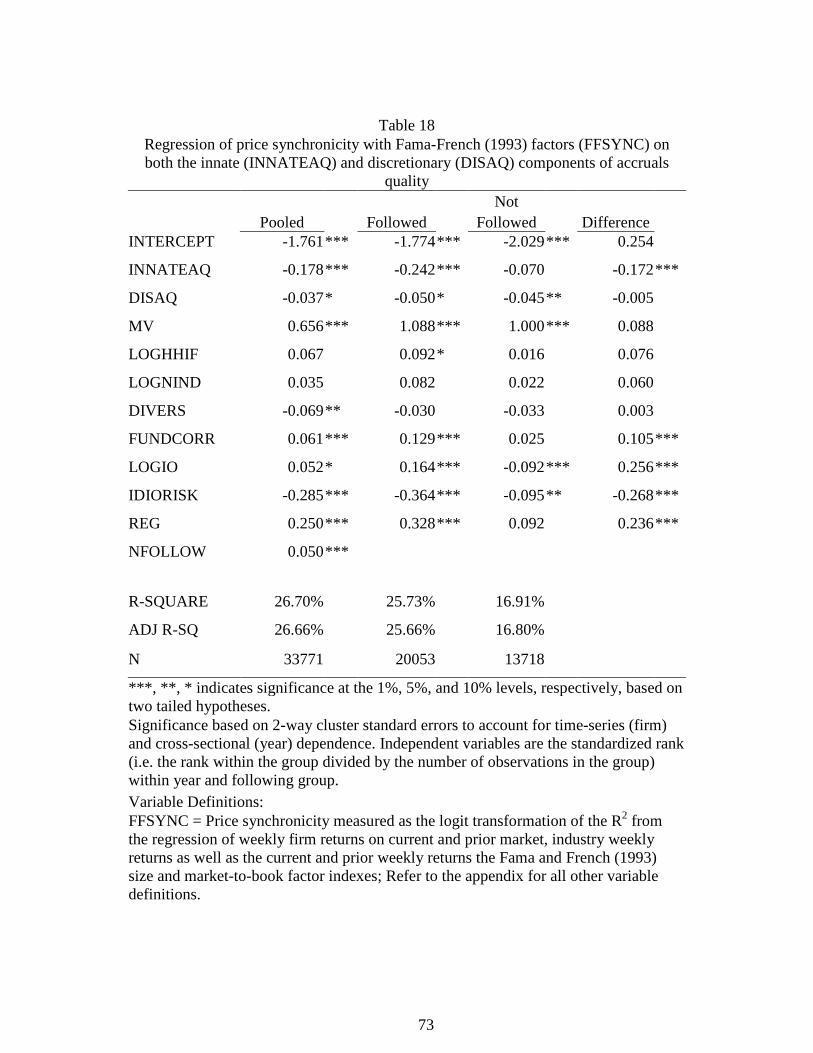
73
Table 18
Regression of price synchronicity with Fama-French (1993) factors (FFSYNC) on both the innate (INNATEAQ) and discretionary (DISAQ) components of accruals
quality Not
Pooled Followed Followed Difference INTERCEPT -1.761 *** -1.774 *** -2.029 *** 0.254
INNATEAQ -0.178 *** -0.242 *** -0.070 -0.172 ***
DISAQ -0.037 * -0.050 * -0.045 ** -0.005
MV 0.656 *** 1.088 *** 1.000 *** 0.088
LOGHHIF 0.067 0.092 * 0.016 0.076
LOGNIND 0.035 0.082 0.022 0.060
DIVERS -0.069 ** -0.030 -0.033 0.003
FUNDCORR 0.061 *** 0.129 *** 0.025 0.105 ***
LOGIO 0.052 * 0.164 *** -0.092 *** 0.256 ***
IDIORISK -0.285 *** -0.364 *** -0.095 ** -0.268 ***
REG 0.250 *** 0.328 *** 0.092 0.236 ***
NFOLLOW 0.050 ***
R-SQUARE 26.70% 25.73% 16.91%
ADJ R-SQ 26.66% 25.66% 16.80%
N 33771 20053 13718
***, **, * indicates significance at the 1%, 5%, and 10% levels, respectively, based on two tailed hypotheses. Significance based on 2-way cluster standard errors to account for time-series (firm) and cross-sectional (year) dependence. Independent variables are the standardized rank (i.e. the rank within the group divided by the number of observations in the group) within year and following group. Variable Definitions: FFSYNC = Price synchronicity measured as the logit transformation of the R2 from the regression of weekly firm returns on current and prior market, industry weekly returns as well as the current and prior weekly returns the Fama and French (1993) size and market-to-book factor indexes; Refer to the appendix for all other variable definitions.
74
Table 19 presents the regression of price synchronicity on total accruals quality partitioned
by time period. For the post Reg-FD period, the coefficient on total accruals quality is -0.068 and
is significant at the 10% level. For the pre Reg-FD period, the coefficient on total accruals
quality is -0.090 and is significant at the 1% level. Although not significant, we do find that
accruals quality is more negative in the pre Reg-FD period.
Table 20 presents the results for the innate accruals quality. We do not find a significant
relation in the post Reg-FD period. However, we find that in the pre Reg-FD period, innate
accruals quality is significantly negatively related to price synchronicity with a coefficient of -
0.313. The difference in the coefficients (0.217) is significant at the 1% level. This is consistent
with the argument that private conversations allow investors to better interpret accruals quality
related to fundamental uncertainty.
Table 21 presents the results for the discretionary component. The coefficient on the
discretionary component of accruals quality is -0.05 in the post Reg-FD period and 0.038 in the
pre Reg-FD period. While we fail to find coefficients that are significantly different from zero in
either period, we do find that difference of -0.087 in the relation between discretionary accruals
quality and price synchronicity is significant at the 5% level. This suggests that the discretionary
component of accruals quality is more negatively related to price synchronicity in the post Reg-
FD period compared to the pre Reg-FD period. This is consistent with the literature that shows
that discretionary accruals are less likely to contain opportunistic manipulation by managers in
the post-SOX period (see, for example, Cohen et al. 2008).
In Table 22, we include both innate and discretionary accruals components in the model.
We find that both the innate and the discretionary components are significantly negatively
related to price synchronicity in the post Reg-FD period (coefficients of -0.122 and -0.071
respectively). However, only innate accruals quality component is significantly related to price
synchronicity in the pre Reg-FD period (coefficient of -0.313). We find that the innate
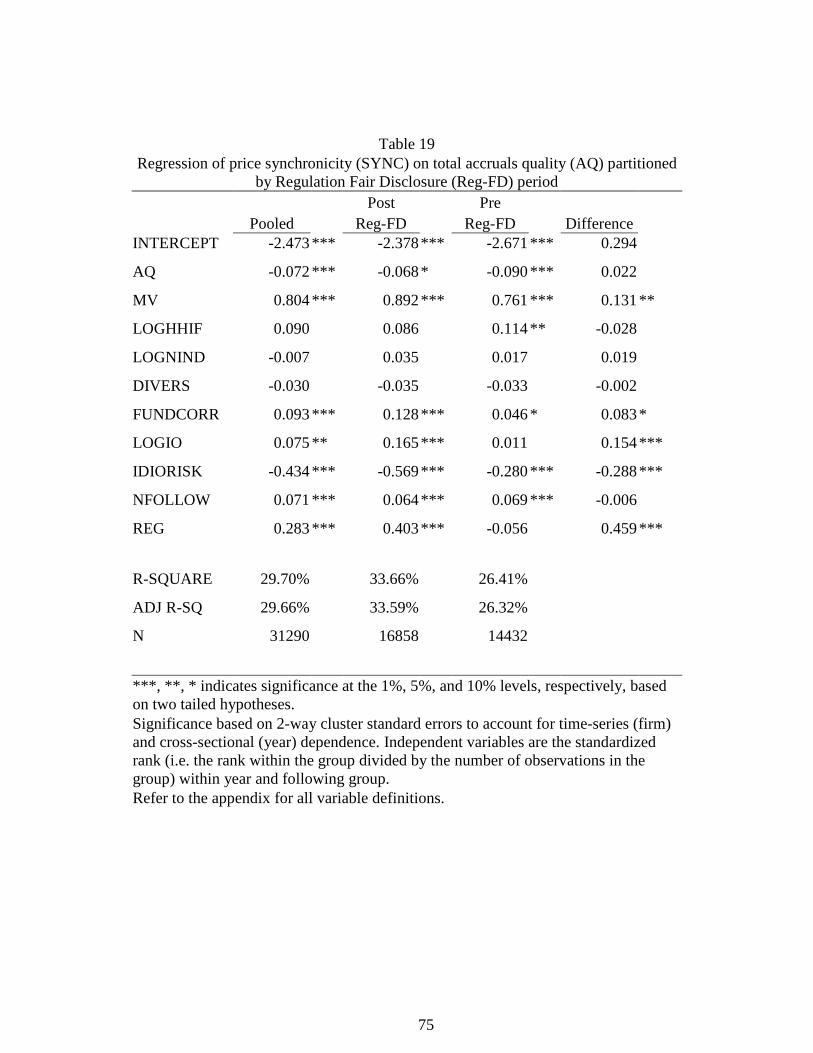
75
Table 19 Regression of price synchronicity (SYNC) on total accruals quality (AQ) partitioned
by Regulation Fair Disclosure (Reg-FD) period Post Pre
Pooled Reg-FD Reg-FD Difference INTERCEPT -2.473 *** -2.378 *** -2.671 *** 0.294
AQ -0.072 *** -0.068 * -0.090 *** 0.022
MV 0.804 *** 0.892 *** 0.761 *** 0.131 **
LOGHHIF 0.090 0.086 0.114 ** -0.028
LOGNIND -0.007 0.035 0.017 0.019
DIVERS -0.030 -0.035 -0.033 -0.002
FUNDCORR 0.093 *** 0.128 *** 0.046 * 0.083 *
LOGIO 0.075 ** 0.165 *** 0.011 0.154 ***
IDIORISK -0.434 *** -0.569 *** -0.280 *** -0.288 ***
NFOLLOW 0.071 *** 0.064 *** 0.069 *** -0.006
REG 0.283 *** 0.403 *** -0.056 0.459 ***
R-SQUARE 29.70% 33.66% 26.41%
ADJ R-SQ 29.66% 33.59% 26.32%
N 31290 16858 14432
***, **, * indicates significance at the 1%, 5%, and 10% levels, respectively, based on two tailed hypotheses. Significance based on 2-way cluster standard errors to account for time-series (firm) and cross-sectional (year) dependence. Independent variables are the standardized rank (i.e. the rank within the group divided by the number of observations in the group) within year and following group. Refer to the appendix for all variable definitions.

76
Table 20 Regression of price synchronicity (SYNC) on the innate component of accruals
quality (INNATEAQ) partitioned by Regulation Fair Disclosure (Reg-FD) period Post Pre
Pooled Reg-FD Reg-FD Difference INTERCEPT -2.524 *** -2.389 *** -2.771 *** 0.382 *
INNATEAQ -0.200 *** -0.096 -0.313 *** 0.217 ***
MV 0.854 *** 0.913 *** 0.838 *** 0.075
LOGHHIF 0.098 0.092 0.120 ** -0.029
LOGNIND -0.019 0.034 -0.001 0.035
DIVERS -0.043 -0.041 -0.049 0.009
FUNDCORR 0.093 *** 0.128 *** 0.045 * 0.083 *
LOGIO 0.075 ** 0.162 *** 0.018 0.144 ***
IDIORISK -0.500 *** -0.588 *** -0.393 *** -0.195 ***
NFOLLOW 0.071 *** 0.063 *** 0.070 *** -0.007
REG 0.297 *** 0.407 *** -0.034 0.441 ***
R-SQUARE 29.80% 33.67% 26.73%
ADJ R-SQ 29.76% 33.59% 26.64%
N 31290 16858 14432
***, **, * indicates significance at the 1%, 5%, and 10% levels, respectively, based on two tailed hypotheses. Significance based on 2-way cluster standard errors to account for time-series (firm) and cross-sectional (year) dependence. Independent variables are the standardized rank (i.e. the rank within the group divided by the number of observations in the group) within year and following group. Refer to the appendix for all variable definitions.
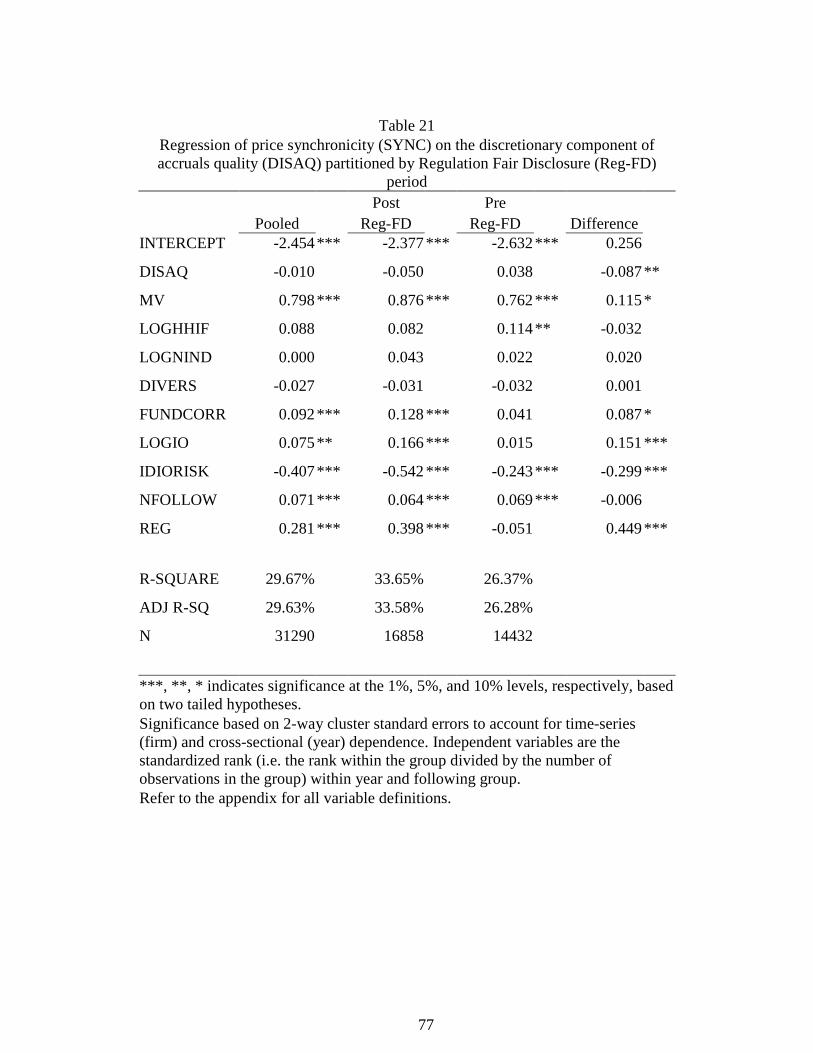
77
Table 21
Regression of price synchronicity (SYNC) on the discretionary component of accruals quality (DISAQ) partitioned by Regulation Fair Disclosure (Reg-FD)
period Post Pre
Pooled Reg-FD Reg-FD Difference INTERCEPT -2.454 *** -2.377 *** -2.632 *** 0.256
DISAQ -0.010 -0.050 0.038 -0.087 **
MV 0.798 *** 0.876 *** 0.762 *** 0.115 *
LOGHHIF 0.088 0.082 0.114 ** -0.032
LOGNIND 0.000 0.043 0.022 0.020
DIVERS -0.027 -0.031 -0.032 0.001
FUNDCORR 0.092 *** 0.128 *** 0.041 0.087 *
LOGIO 0.075 ** 0.166 *** 0.015 0.151 ***
IDIORISK -0.407 *** -0.542 *** -0.243 *** -0.299 ***
NFOLLOW 0.071 *** 0.064 *** 0.069 *** -0.006
REG 0.281 *** 0.398 *** -0.051 0.449 ***
R-SQUARE 29.67% 33.65% 26.37%
ADJ R-SQ 29.63% 33.58% 26.28%
N 31290 16858 14432
***, **, * indicates significance at the 1%, 5%, and 10% levels, respectively, based on two tailed hypotheses. Significance based on 2-way cluster standard errors to account for time-series (firm) and cross-sectional (year) dependence. Independent variables are the standardized rank (i.e. the rank within the group divided by the number of observations in the group) within year and following group. Refer to the appendix for all variable definitions.
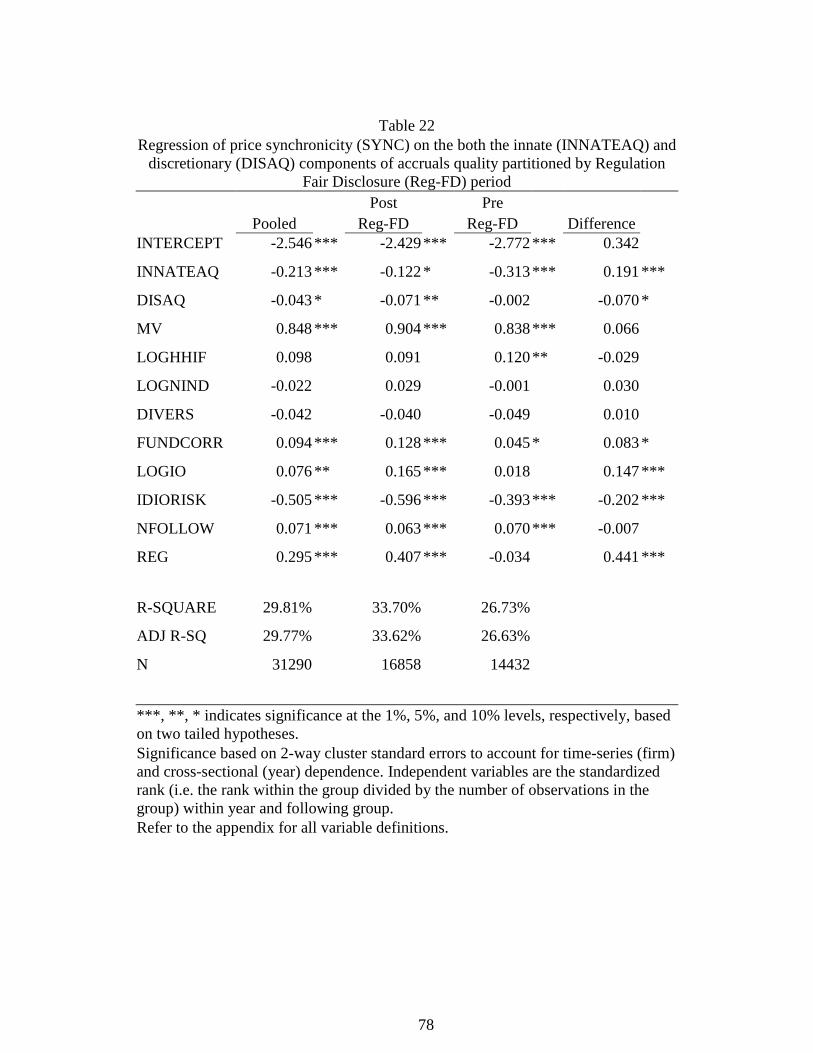
78
Table 22
Regression of price synchronicity (SYNC) on the both the innate (INNATEAQ) and discretionary (DISAQ) components of accruals quality partitioned by Regulation
Fair Disclosure (Reg-FD) period Post Pre
Pooled Reg-FD Reg-FD Difference INTERCEPT -2.546 *** -2.429 *** -2.772 *** 0.342
INNATEAQ -0.213 *** -0.122 * -0.313 *** 0.191 ***
DISAQ -0.043 * -0.071 ** -0.002 -0.070 *
MV 0.848 *** 0.904 *** 0.838 *** 0.066
LOGHHIF 0.098 0.091 0.120 ** -0.029
LOGNIND -0.022 0.029 -0.001 0.030
DIVERS -0.042 -0.040 -0.049 0.010
FUNDCORR 0.094 *** 0.128 *** 0.045 * 0.083 *
LOGIO 0.076 ** 0.165 *** 0.018 0.147 ***
IDIORISK -0.505 *** -0.596 *** -0.393 *** -0.202 ***
NFOLLOW 0.071 *** 0.063 *** 0.070 *** -0.007
REG 0.295 *** 0.407 *** -0.034 0.441 ***
R-SQUARE 29.81% 33.70% 26.73%
ADJ R-SQ 29.77% 33.62% 26.63%
N 31290 16858 14432
***, **, * indicates significance at the 1%, 5%, and 10% levels, respectively, based on two tailed hypotheses. Significance based on 2-way cluster standard errors to account for time-series (firm) and cross-sectional (year) dependence. Independent variables are the standardized rank (i.e. the rank within the group divided by the number of observations in the group) within year and following group. Refer to the appendix for all variable definitions.
79
component of accruals quality is more negatively related to price synchronicity in the pre Reg-
FD period compared to the post Reg-FD period, whereas the discretionary component is more
negatively related to price synchronicity in the post Reg-Fd period compared to the pre Reg-FD
period. This consistent with the argument that, in the pre Reg-FD period, managers disclosed
information to investors that allowed them to incorporate more firm-specific information into
prices. After Reg-FD, the innate accruals quality component provided relatively less firm-
specific information because it was more difficult for investors to interpret them without the
guidance of managers. The discretionary component of accruals quality has a more negative
impact in the post Reg-FD period, which may reflect managers conveying more firm-specific
information through earnings. The more negative relation of discretionary accruals quality
component may also reflect the decrease in the use of accruals as an earnings management
technique following the passage of the Sarbanes-Oxley act.
6.5 Market Beta as a Control Variable
We show in our hypothesis development that accruals quality is related to price
synchronicity through the magnitude of the coefficients of the pricing model. Lambert et al.
(2007) suggest that accruals quality affects cost of capital through market beta. Our results may
be simply a manifestation of the relation between accruals quality and market beta. To test this
alternative hypothesis, we include the firm’s CAPM beta as an additional control variable. We
estimate the firm’s CAPM beta using weekly returns over the same period we use to estimate
price synchronicity. We use beta squared because price synchronicity increases with magnitude
of beta. As with our other independent variables, we use the relative rank of the squared CAPM
beta27.
27 Using the raw, squared beta or the unsquared ranked or raw beta produces qualitatively similar results.
80
Table 23 presents results similar to the ones from table 7 controlling for the market beta.
The coefficient on the innate accruals quality is -0.091 and significant at the 10% level for the
pooled sample. This is about one-thirds of the magnitude of the coefficient in table 7 (-0.266),
which indicates that the market beta does play a large role in the relation between accruals
quality and price synchronicity. However, innate accruals quality still has explanatory power
after controlling for market beta. This is due to the reduction in the co-movement between the
firm’s return and the industry return. As with our main results, we find that the negative relation
between innate accruals quality and price synchronicity is more negative in the analyst following
group (a difference of -0.085). We also find that the discretionary accruals component is
significantly negatively related to price synchronicity for firms with an analyst following (a
coefficient of -0.033).
6.6 Analyst Forecast Dispersion
Bryan and Tiras (2007) find that when analyst forecast dispersion is high, accounting
numbers better explain market prices and analysts rely less on accounting information in
providing their estimates. This indicates that the degree to which earnings reflect more firm
specific information may depend on analyst forecast dispersion Therefore the relation between
accruals quality and price synchronicity may be conditional on analyst forecast dispersion. We
investigate this possibility by separating our sample by forecast dispersion. We require that a
firm have at least three analysts’ estimates in the month of the announcement and that the
dispersion be greater than zero for this analysis. This results in 13,484 observations. We divide
this subsample into two groups based on whether they are above (high dispersion) or below (low
dispersion) the median forecast dispersion by year.
Table 24 presents are results partitioned by analysts forecast dispersion. We find that for
both high and low dispersion groups, the innate component of accruals quality is negatively
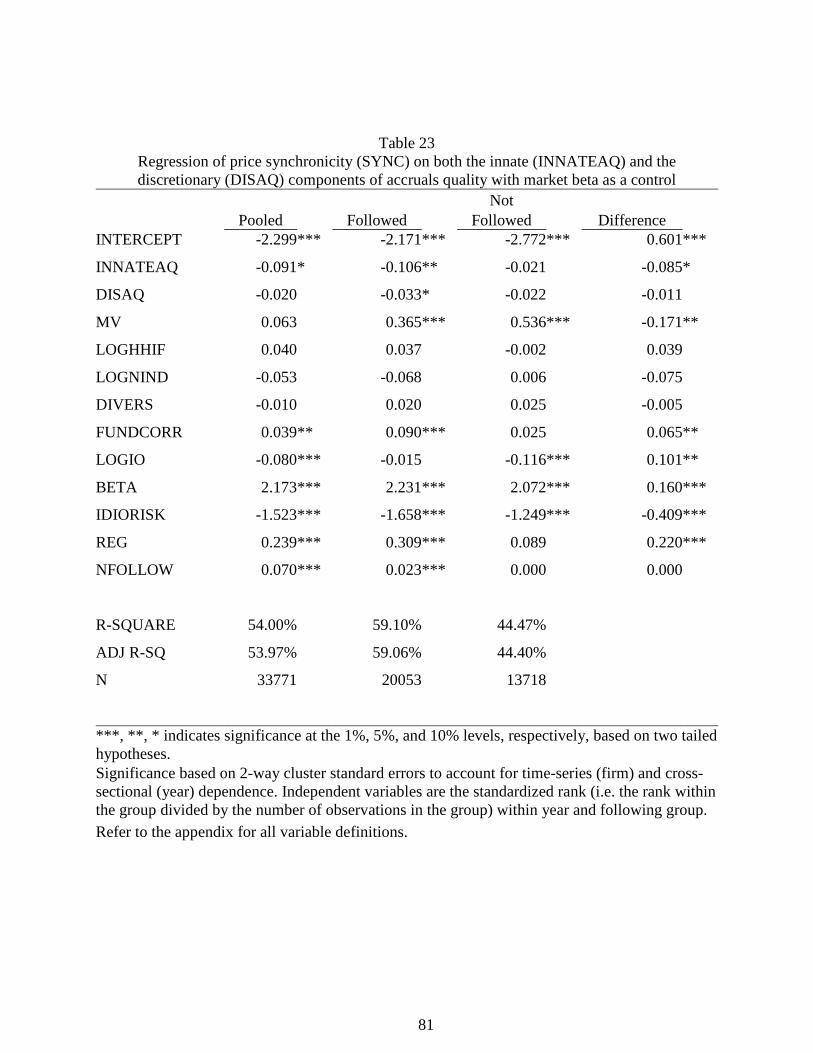
81
Table 23 Regression of price synchronicity (SYNC) on both the innate (INNATEAQ) and the discretionary (DISAQ) components of accruals quality with market beta as a control
Not Pooled Followed Followed Difference
INTERCEPT -2.299 *** -2.171 *** -2.772*** 0.601***
INNATEAQ -0.091 * -0.106 ** -0.021 -0.085*
DISAQ -0.020 -0.033 * -0.022 -0.011
MV 0.063 0.365 *** 0.536*** -0.171**
LOGHHIF 0.040 0.037 -0.002 0.039
LOGNIND -0.053 -0.068 0.006 -0.075
DIVERS -0.010 0.020 0.025 -0.005
FUNDCORR 0.039 ** 0.090 *** 0.025 0.065**
LOGIO -0.080 *** -0.015 -0.116*** 0.101**
BETA 2.173 *** 2.231 *** 2.072*** 0.160***
IDIORISK -1.523 *** -1.658 *** -1.249*** -0.409***
REG 0.239 *** 0.309 *** 0.089 0.220***
NFOLLOW 0.070 *** 0.023 *** 0.000 0.000
R-SQUARE 54.00% 59.10% 44.47%
ADJ R-SQ 53.97% 59.06% 44.40%
N 33771 20053 13718
***, **, * indicates significance at the 1%, 5%, and 10% levels, respectively, based on two tailed hypotheses. Significance based on 2-way cluster standard errors to account for time-series (firm) and cross-sectional (year) dependence. Independent variables are the standardized rank (i.e. the rank within the group divided by the number of observations in the group) within year and following group. Refer to the appendix for all variable definitions.
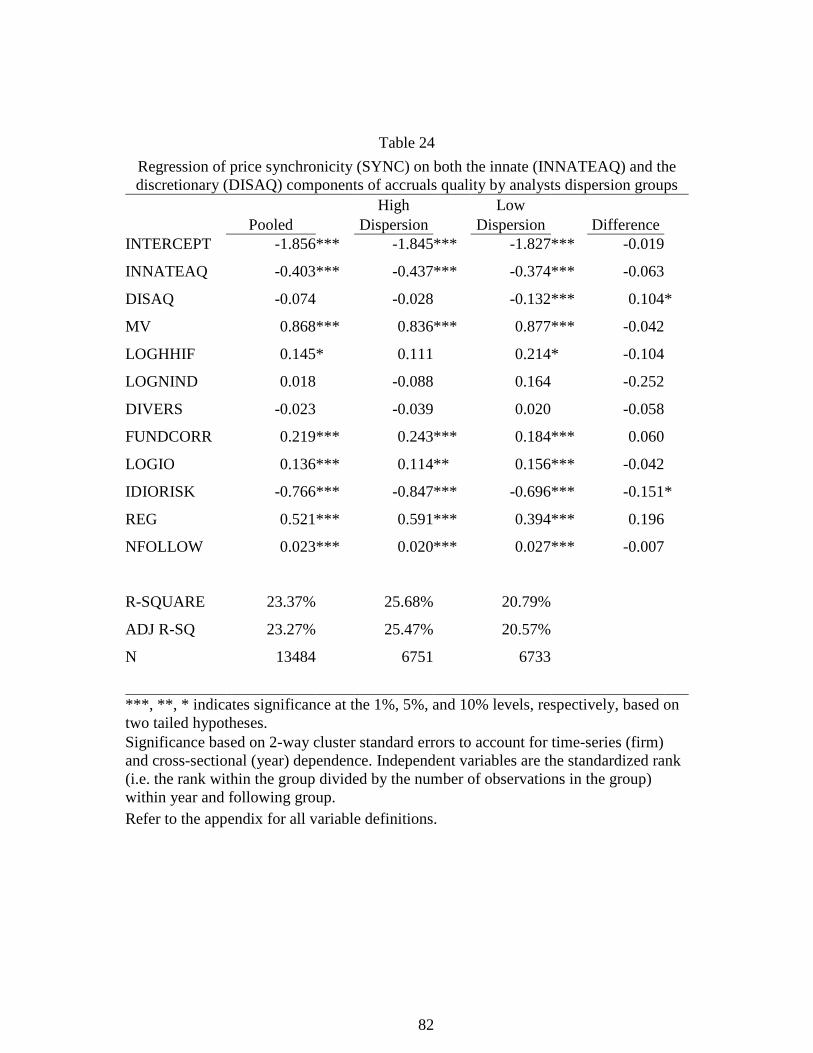
82
Table 24
Regression of price synchronicity (SYNC) on both the innate (INNATEAQ) and the discretionary (DISAQ) components of accruals quality by analysts dispersion groups
High Low Pooled Dispersion Dispersion Difference
INTERCEPT -1.856*** -1.845*** -1.827*** -0.019
INNATEAQ -0.403*** -0.437*** -0.374*** -0.063
DISAQ -0.074 -0.028 -0.132*** 0.104*
MV 0.868*** 0.836*** 0.877*** -0.042
LOGHHIF 0.145* 0.111 0.214* -0.104
LOGNIND 0.018 -0.088 0.164 -0.252
DIVERS -0.023 -0.039 0.020 -0.058
FUNDCORR 0.219*** 0.243*** 0.184*** 0.060
LOGIO 0.136*** 0.114** 0.156*** -0.042
IDIORISK -0.766*** -0.847*** -0.696*** -0.151*
REG 0.521*** 0.591*** 0.394*** 0.196
NFOLLOW 0.023*** 0.020*** 0.027*** -0.007
R-SQUARE 23.37% 25.68% 20.79%
ADJ R-SQ 23.27% 25.47% 20.57%
N 13484 6751 6733
***, **, * indicates significance at the 1%, 5%, and 10% levels, respectively, based on two tailed hypotheses. Significance based on 2-way cluster standard errors to account for time-series (firm) and cross-sectional (year) dependence. Independent variables are the standardized rank (i.e. the rank within the group divided by the number of observations in the group) within year and following group. Refer to the appendix for all variable definitions.
83
related to price synchronicity (coefficients of -0.437 and -0.374, respectively). There difference
between the two groups is not significant. We find that the discretionary component of accruals
quality is negative only for the low dispersion group (-0.132). This is consistent with managers
manipulating earnings in both the low and high forecast dispersion groups, but in the high
dispersion group, managers attempt to convey information through discretionary accruals.
6.7 Further Investigation of Analyst Following
Our main analysis investigates the relation between accruals quality and price
synchronicity for firms that are followed by analysts and firms that are not. We extend this
analysis by investigating how the level of analyst following affects the relation between accruals
quality and price synchronicity. We first group firms by analysts following and look at the
differences between the two groups. We then look at the impact of the interaction between
accruals quality and analyst following on price synchronicity. From our analyst following
group, we divide firms into quartile each year and compare the highest quartile to the lowest
quartile. Table 25 presents our results for these extremes. We firms with the highest analysts
following have innate accruals quality is more negatively related to price synchronicity than
firms with the lowest analysts following (-0.583 compared to -0.219). This difference (-0.364) is
significant at the 5% level. This is consistent with our main result that firms with better innate
accruals quality have more firm specific information impounded into prices when analysts are
present. We also find that firms with the lowest following have a negative relation between the
discretionary component of accruals quality and price synchronicity. This is consistent with more
earnings management when analyst following is low. And when analyst forecast dispersion is
high, managers are more likely to convey information through discretionary accruals.
We further investigate the role of the level of analyst following by looking at the impact of
the interaction between accruals quality and the number of analyst following on price
synchronicity. Specifically we estimate the following regression:
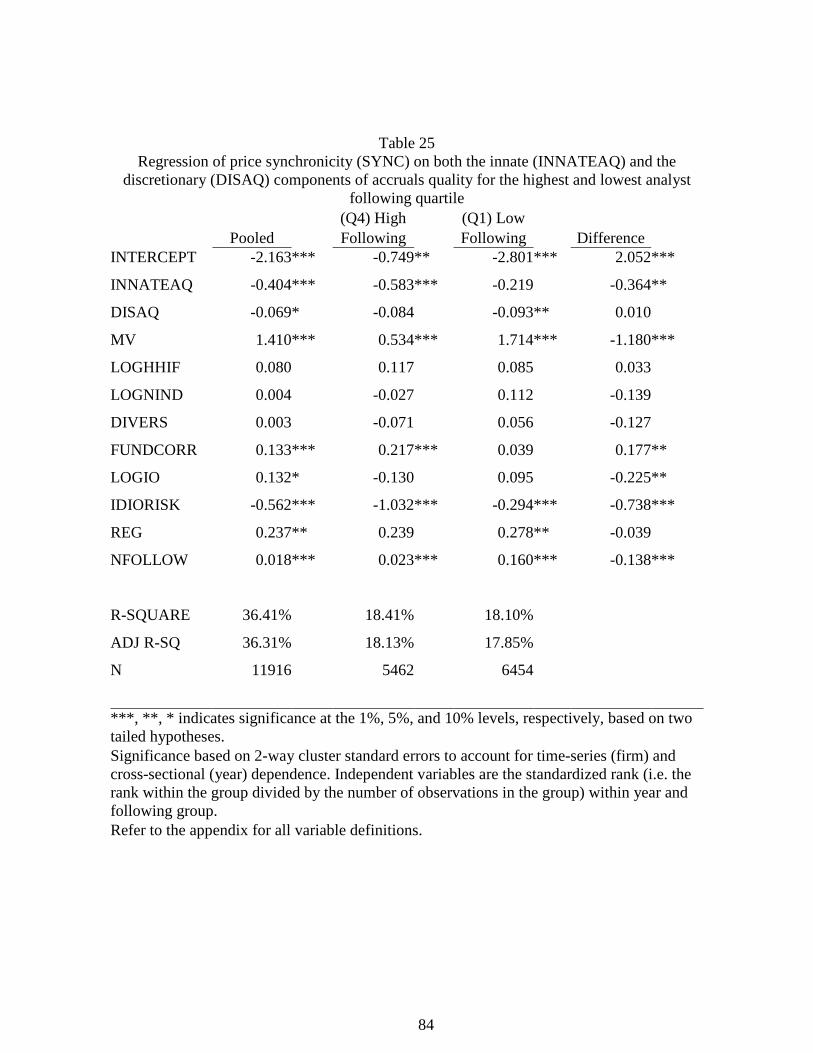
84
Table 25 Regression of price synchronicity (SYNC) on both the innate (INNATEAQ) and the
discretionary (DISAQ) components of accruals quality for the highest and lowest analyst following quartile
(Q4) High (Q1) Low Pooled Following Following Difference
INTERCEPT -2.163*** -0.749** -2.801*** 2.052***
INNATEAQ -0.404*** -0.583*** -0.219 -0.364**
DISAQ -0.069* -0.084 -0.093** 0.010
MV 1.410*** 0.534*** 1.714*** -1.180***
LOGHHIF 0.080 0.117 0.085 0.033
LOGNIND 0.004 -0.027 0.112 -0.139
DIVERS 0.003 -0.071 0.056 -0.127
FUNDCORR 0.133*** 0.217*** 0.039 0.177**
LOGIO 0.132* -0.130 0.095 -0.225**
IDIORISK -0.562*** -1.032*** -0.294*** -0.738***
REG 0.237** 0.239 0.278** -0.039
NFOLLOW 0.018*** 0.023*** 0.160*** -0.138***
R-SQUARE 36.41% 18.41% 18.10%
ADJ R-SQ 36.31% 18.13% 17.85%
N 11916 5462 6454
***, **, * indicates significance at the 1%, 5%, and 10% levels, respectively, based on two tailed hypotheses. Significance based on 2-way cluster standard errors to account for time-series (firm) and cross-sectional (year) dependence. Independent variables are the standardized rank (i.e. the rank within the group divided by the number of observations in the group) within year and following group. Refer to the appendix for all variable definitions.
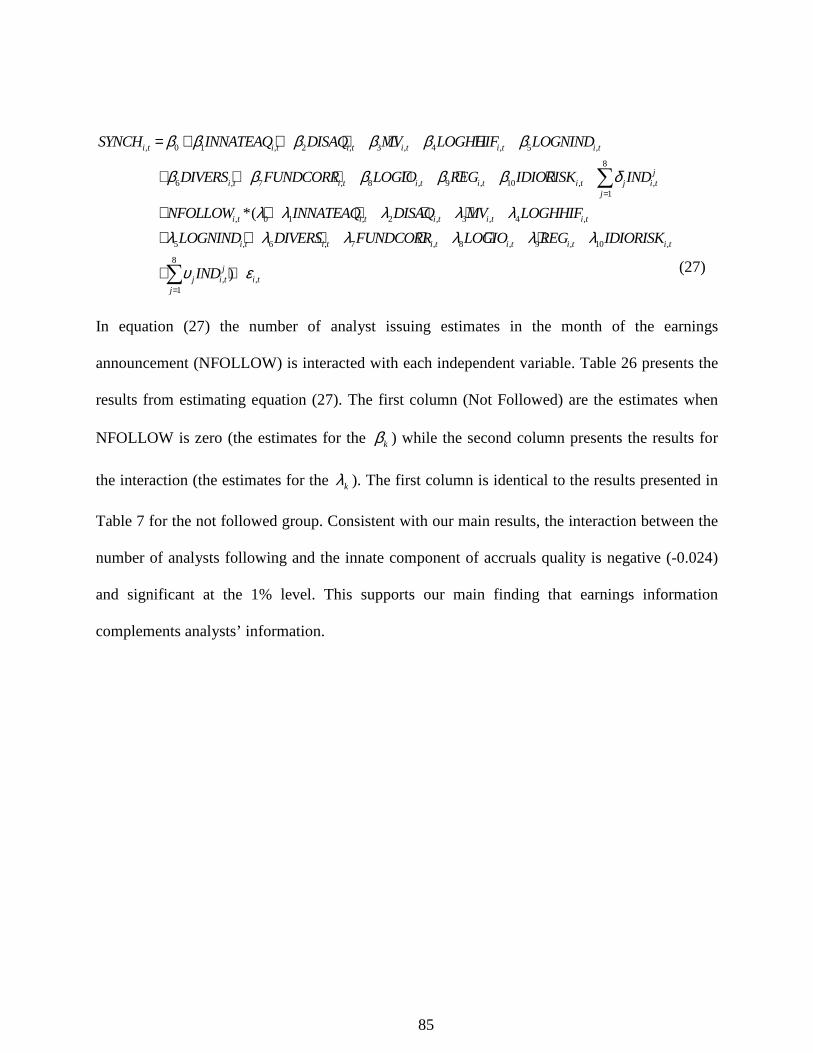
85
, 0 1 , 2 , 3 , 4 , 5 ,
8
6 , 7 , 8 , 9 , 10 , ,1
, 0 1 , 2 , 3 , 4*(
i t i t i t i t i t i t
ji t i t i t i t i t j i t
j
i t i t i t i t
SYNCH INNATEAQ DISAQ MV LOGHHIF LOGNIND
DIVERS FUNDCORR LOGIO REG IDIORISK IND
NFOLLOW INNATEAQ DISAQ MV LOG
β β β β β β
β β β β β δ
λ λ λ λ λ=
= + + + + +
+ + + + + +
+ + + + +
∑
,
5 , 6 , 7 , 8 , 9 , 10 ,
8
, ,1
)
i t
i t i t i t i t i t i t
jj i t i t
j
HHIF
LOGNIND DIVERS FUNDCORR LOGIO REG IDIORISK
IND
λ λ λ λ λ λ
υ ε=
+ + + + + +
+ +∑ (27)
In equation (27) the number of analyst issuing estimates in the month of the earnings
announcement (NFOLLOW) is interacted with each independent variable. Table 26 presents the
results from estimating equation (27). The first column (Not Followed) are the estimates when
NFOLLOW is zero (the estimates for the kβ ) while the second column presents the results for
the interaction (the estimates for the kλ ). The first column is identical to the results presented in
Table 7 for the not followed group. Consistent with our main results, the interaction between the
number of analysts following and the innate component of accruals quality is negative (-0.024)
and significant at the 1% level. This supports our main finding that earnings information
complements analysts’ information.
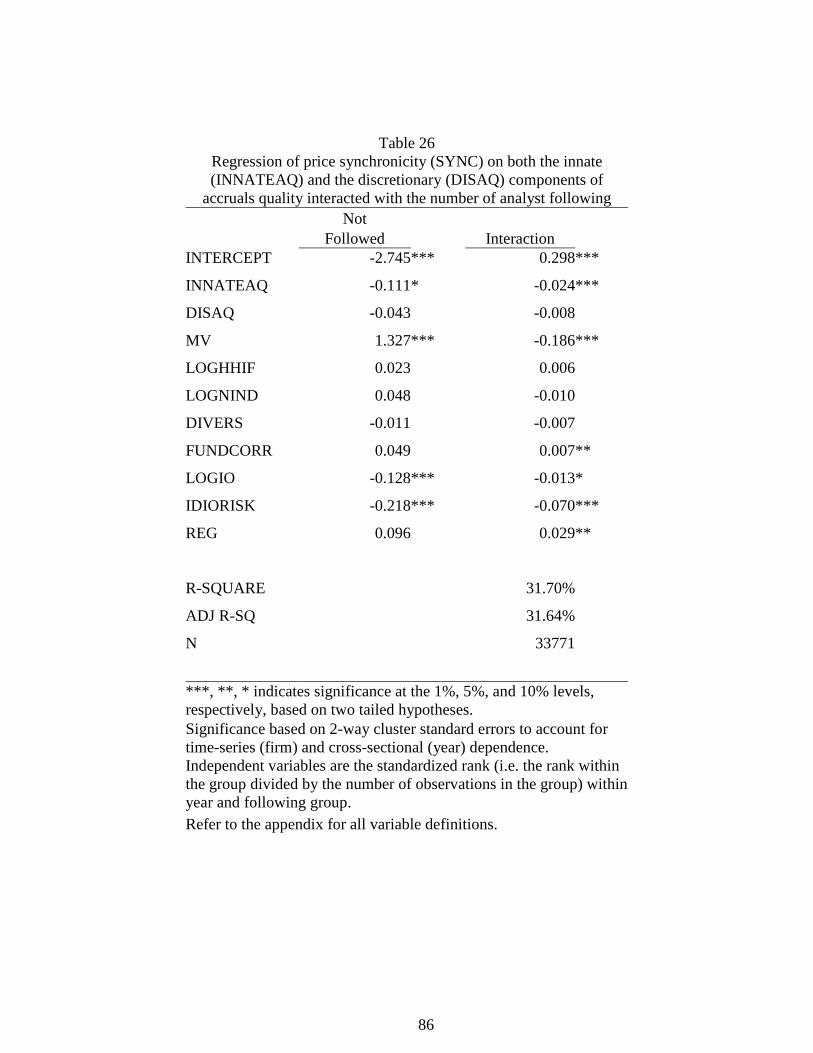
86
Table 26 Regression of price synchronicity (SYNC) on both the innate (INNATEAQ) and the discretionary (DISAQ) components of
accruals quality interacted with the number of analyst following Not
Followed Interaction INTERCEPT -2.745*** 0.298***
INNATEAQ -0.111* -0.024***
DISAQ -0.043 -0.008
MV 1.327*** -0.186***
LOGHHIF 0.023 0.006
LOGNIND 0.048 -0.010
DIVERS -0.011 -0.007
FUNDCORR 0.049 0.007**
LOGIO -0.128*** -0.013*
IDIORISK -0.218*** -0.070***
REG 0.096 0.029**
R-SQUARE 31.70%
ADJ R-SQ 31.64%
N 33771
***, **, * indicates significance at the 1%, 5%, and 10% levels, respectively, based on two tailed hypotheses. Significance based on 2-way cluster standard errors to account for time-series (firm) and cross-sectional (year) dependence. Independent variables are the standardized rank (i.e. the rank within the group divided by the number of observations in the group) within year and following group. Refer to the appendix for all variable definitions.
87
7. SUMMARY AND CONCLUSION
This study examines the relation between accruals quality and price synchronicity. Studies
find a negative relation between accruals quality and idiosyncratic risk (Cohen 2008; Rajgopal
and Venkatachalam 2008) and conclude that price synchronicity should increase with accruals
quality (Ashbaugh-Skaife et al. 2006). Because accruals quality could affect price synchronicity
absent idiosyncratic risk, we examine the relation between price synchronicity and accruals
quality after controlling for idiosyncratic volatility. We find a negative relation between accruals
quality and price synchronicity.
Accruals adjust cash flows to earnings such that earnings better reflect the performance of
the firm. As such the underlying value of the firm can be more easily inferred from earnings as
accruals quality increases. If investors rely more on earnings and other related firm-specific
information, the correlation between firm returns and market returns declines. Therefore, we
hypothesize and find a negative relation between accruals quality and price synchronicity. We
find that this negative relation is robust to different measures of accruals quality, the
endogeneous choice of the quality of accruals, and alternative measures of price synchronicity.
We decompose accruals quality into its innate and discretionary components following
Francis et al. (2005). We find a consistently negative relation between the innate component of
accruals quality and price synchronicity. However, we find only weak evidence of a negative
relation between the discretionary component of accruals quality and price synchronicity. This is
consistent with Francis et al. (2005) who find that the innate component of accruals quality has a
larger pricing effect. As they make clear, the discretionary component has elements of both
managers acting opportunistically for personal gain and managers trying to convey information
to the market through accruals.
This study also examines the effect of analysts following on the relation between accruals
quality and price synchronicity. If earnings information complements information provided by
88
analysts, then the relation between accruals quality and price synchronicity should be
strengthened by the presence of analysts. Alternatively, if analysts provide information that
substitutes for earnings information, then the relation between accruals quality and price
synchronicity should be weaken by the presence of financial analysts. We find evidence
consistent with the theory that earnings complement analysts’ information.
As with all studies, there are a number of caveats to consider. While we find evidence
consistent with the notion that price synchronicity captures the relative level of firm-specific
information incorporated in price, we explicitly control for idiosyncratic volatility. We argue that
idiosyncratic volatility captures the noise affecting price synchronicity. We cannot fully separate
out the noise that occurs naturally form the noise caused by institutional or even firm-specific
factors. Therefore, our results should be interpreted with care.
Our sensitivity analysis related to Regulation FD suggests some extensions to the present
study. We find that innate accruals quality provides more firm-specific information in the pre-
Reg FD period whereas discretionary accruals quality provides more firm-specific information in
the post-Reg FD period. Extensions our study could investigate to what extent this result is
related to the change in the type of firms analysts follow. Studies could also explore whether
managers are using discretionary accruals to convey information that they previously conveyed
privately to analysts or whether the discretionary accruals quality convey more firm-specific
information because of a reduction in earnings management.
Future research can examine the inclusion of the accruals risk factor in price synchronicity.
We use price synchronicity from a modified market model with current and lagged market and
industry indexes. We provide sensitivity analysis that incorporates the Fama-French three factor
model with little difference to our main result. Ecker et al. (2006) show that factor loadings on an
accruals quality risk factor are related to firm-specific factors that represent the firm’s
information environment. Future research can incorporate this accruals quality risk factor in a
89
price synchronicity setting. If low synchronicity is related to more firm-specific information,
then the addition of an information factor such as the accruals quality factor should capture the
informational portion while the idiosyncratic portion should capture more of the noise
component of returns variation.
This study should be relevant to regulators considering the convergence of U.S. GAAP and
International Financial Reporting Standard. Studies find that price synchronicity decreases
around the adoption of the international standards and conclude that these standards help more
firm-specific information to be incorporated into prices. Some studies question the use of price
synchronicity as a measure of firm-specific information. We provide evidence that better
earnings quality is positively related to price synchronicity, adding credence to studies that
adoption of the international standards increase the amount of firm-specific information in
prices. We also show that financial analysts’ information is complementary to earnings
information rather than a substitute for it. From a regulatory standpoint, this suggests that, while
market participants may look for firm-specific information, this information does not substitute
for firm-specific information that is provided by managers via financial statements.

90
REFERENCES
Aboody, D., J. Hughes, and J. Liu. 2005. Earnings Quality, Insider Trading, and Cost of Capital. Journal of Accounting Research 43 (5):651-615.
Ashbaugh-Skaife, H., J. Gassen, and R. LaFond. 2006. Does Stock Price Synchronicity Represent Firm-Specific Information? The International Evidence. Working Paper. SSRN
Barron, O. E., O. Kim, S. C. Lim, and D. E. Stevens. 1998. Using analysts' forecasts to measure properties of analysts' information environment. Accounting Review 73 (4):421.
Barry, C. B., and S. J. Brown. 1985. Differential Information and Security Market Equilibrium. Journal of Financial & Quantitative Analysis 20 (4):407.
Bernard, V. L., and J. K. Thomas. 1989. Post-Earnings-Announcement Drift: Delayed Price Response or Risk Premium? Journal of Accounting Research 27 (3):1-36.
———. 1990. Evidence That Stock Prices Do Not Fully Reflect the Implications Of Current Earnings For Future Earnings. Journal of Accounting & Economics 13 (4):305-340.
Beuselinck, C., P. Joos, I. Khurana, and S. Van der Meulen. 2008. Mandatory Adoption of IFRS and Stock Price Informativeness. Working Paper. Tilburg University, CentER and the University of Missouri at Columbia
Bhattacharya, N., H. Desai, and K. Venkataraman. 2007a. Earnings Quality and Information Asymmetry: Evidence from Trading Costs. Working Paper. Southern Methodist University
Bhattacharya, N., F. Ecker, P. Olsson, and K. Schipper. 2007b. Direct and Mediated Associations among Earnings Quality, Information Asymmetry and the Cost of Equity. Working Paper. Southern Methodist University and Duke University
Brown, S. 1979. The Effect of Estimation Risk on Capital Market Equilibrium. Journal of Financial & Quantitative Analysis 14 (2).
Brown, S., and S. Hillegeist. 2007. How disclosure quality affects the level of information asymmetry. Review of Accounting Studies 12 (2/3):443-477.
Bryan, D. M., and S. L. Tiras. 2007. The Influence of Forecast Dispersion on the Incremental Explanatory Power of Earnings, Book Value, and Analyst Forecasts on Market Prices. Accounting Review 82 (3):651-677.
Byard, D., and K. W. Shaw. 2003. Corporate Disclosure Quality and Properties of Analysts' Information Environment. Journal of Accounting, Auditing & Finance 18 (3):355-378.
Chan, K., and A. Hameed. 2006. Stock price synchronicity and analyst coverage in emerging markets. Journal of Financial Economics 80 (1):115-147.
Chari, A., and P. Blair Henry. 2008. Firm-specific information and the efficiency of investment. Journal of Financial Economics 87 (3):636-655.

91
Chen, C., A. Huang, and R. Jha. 2008. Trends in Earnings Volatility, Earnings Quality and Idiosyncratic Return Volatility: Managerial Opportunism or Economic Activity. Working Paper. SSRN
Chen, L. H., D. S. Dhaliwal, and M. A. Trombley. 2007a. The Effect of Fundamental Risk on the Market Pricing of Accruals Quality. Working Paper. University of Arizona
Chen, S., T. Shevlin, and Y. H. Tong. 2007b. Does the Pricing of Financial Reporting Quality Change Around Dividend Changes? Journal of Accounting Research 45 (1):1-40.
Cohen, D. A. 2008. Does Information Risk Really Matter? An Analysis of the Determinants and Economic Consequences of Financial Reporting Quality. Asia-Pacific Journal of Accounting and Economics 15 (2).
Cohen, D. A., A. Dey, and T. Z. Lys. 2008. Real and Accrual-Based Earnings Management in the Pre- and Post-Sarbanes-Oxley Periods. Accounting Review 83 (3):757-787.
Coles, J. L., U. Loewenstein, and J. Suay. 1995. On equilibrium pricing under parameter uncertainty. Journal of Financial & Quantitative Analysis 30 (3):347.
Core, J. E., W. R. Guay, and R. Verdi. 2008. Is accruals quality a priced risk factor? Journal of Accounting and Economics 46 (1):2-22.
Daouk, H., C. M. C. Lee, and D. Ng. 2006. Capital market governance: How do security laws affect market performance? Journal of Corporate Finance 12 (3):560-593.
Dechow, P. M., and I. D. Dichev. 2002. The Quality of Accruals and Earnings: The Role of Accrual Estimation Errors. Accounting Review 77 (4):35.
Diamond, D. W. 1985. Optimal Release of Information By Firms. Journal of Finance 40 (4):1071-1094.
Diamond, D. W., and R. E. Verrecchia. 1991. Disclosure, Liquidity, and the Cost of Capital. Journal of Finance 46 (4):1325-1359.
Durnev, A., R. Morck, B. Yeung, and P. Zarowin. 2003. Does Greater Firm-Specific Return Variation Mean More or Less Informed Stock Pricing? Journal of Accounting Research 41 (5):797-836.
Durnev, A., R. Morck, and B. Y. Yeung. 2001. Does Firm-specific Information in Stock Prices Guide Capital Allocation? Working Paper. SSRN
Durnev, A. R. T., R. Morck, and B. Yeung. 2004. Value-Enhancing Capital Budgeting and Firm-specific Stock Return Variation. Journal of Finance 59 (1):65-105.
Easley, D., N. M. Kiefer, and M. O'Hara. 1997. One day in the life of a very common stock. Review of Financial Studies 10 (3).
Easley, D., and M. O'Hara. 2004. Information and the Cost of Capital. Journal of Finance 59 (4):1553-1583.

92
Easley, D., M. O'Hara, and J. Paperman. 1998. Financial analysts and information-based trade. Journal of Financial Markets 1 (2):175-201.
Ecker, F., J. Francis, I. Kim, P. M. Olsson, and K. Schipper. 2006. A Returns-Based Representation of Earnings Quality. Accounting Review 81 (4):749-780.
Fama, E. F., and K. R. French. 1993. Common risk factors in the returns on stocks and bonds. Journal of Financial Economics 33 (1):3-56.
Francis, J., R. LaFond, P. M. Olsson, and K. Schipper. 2004. Costs of Equity and Earnings Attributes. Accounting Review 79 (4):967-1010.
———. 2005. The market pricing of accruals quality. Journal of Accounting & Economics 39 (2):295-327.
Frankel, R., and C. M. C. Lee. 1998. Accounting valuation, market expectation, and cross-sectional stock returns. Journal of Accounting & Economics 25 (3):283-319.
French, K. R., and R. Roll. 1986. Stock Return Variances: The Arrival of Information and the Reaction of Traders. Journal of Financial Economics 17 (1):5-26.
Glosten, L. R., and P. R. Milgrom. 1985. Bid, Ask and Transaction Prices in a Specialist Market with Heterogeneously Informed Traders. Journal of Financial Economics 14 (1):71-100.
Gow, I. D., G. Ormazabal, and D. Taylor. 2009. Correcting for Cross-Sectional and Time-Series Dependence in Accounting Research. Working Paper. Stanford University
Gray, P., P.-S. Koh, and Y. H. Tong. 2009. Accruals Quality, Information Risk and Cost of Capital: Evidence from Australia. Journal of Business Finance & Accounting 36 (1-2):51-72.
Grossman, S. J., and J. E. Stiglitz. 1980. On the Impossibility of Informationally Efficient Markets. American Economic Review 70 (3):393.
Gu, Z. 2007. Across-sample Incomparability of R2s and Additional Evidence on Value Relevance Changes Over Time. Journal of Business Finance & Accounting 34 (7/8):1073-1098.
Haggard, K. S., X. Martin, and R. Pereira. 2008. Does Voluntary Disclosure Improve Stock Price Informativeness? Financial Management (Blackwell Publishing Limited) 37 (4):747-768.
Healy, P. M., and J. M. Wahlen. 1999. A Review of the Earnings Management Literature and Its Implications for Standard Setting. Accounting Horizons 13 (4):365-383.
Hirshleifer, D., K. Hou, S. H. Teoh, and Y. Zhang. 2004. Do investors overvalue firms with bloated balance sheets? Journal of Accounting & Economics 38 (1-3):297-331.
Holmstrom, B., and J. Tirole. 1993. Market liquidity and performance monitoring. Journal of Political Economy 101 (4):678.

93
Hou, K., and T. J. Moskowitz. 2005. Market Frictions, Price Delay, and the Cross-Section of Expected Returns. Review of Financial Studies 18 (3):981-1020.
Hughes, J. S., L. Jing, and J. Liu. 2007. Information Asymmetry, Diversification, and Cost of Capital. Accounting Review 82 (3):705-729.
Jin, L., and S. C. Myers. 2006. R2 around the world: New theory and new tests. Journal of Financial Economics 79 (2):257-292.
Jones, J. J. 1991. Earnings Management During Import Relief Investigations. Journal of Accounting Research 29 (2):193-228.
Kelly, P. J. 2007. Information Efficiency and Firm-Specific Return Variation. Working Paper. University of South Florida
Kim, D., and Y. Qi. 2008. Accruals Quality, Stock Returns, and Macroeconomic Conditions: SSRN.
Kim, J.-B. V., and S. Shi. 2007. Enhanced Disclosures Via IFRS and Stock Price Synchronicity Around the World: Do Analyst Following and Institutional Infrastructure Matter? Working Paper. SSRN
Kim, O., and R. E. Verrecchia. 1991a. Market reaction to anticipated announcements. Journal of Financial Economics 30 (2):273-309.
———. 1991b. Trading Volume and Price Reactions to Public Announcements. Journal of Accounting Research 29 (2):302-321.
———. 1994. Market liquidity and volume around earnings announcements. Journal of Accounting & Economics 17 (1/2):41-67.
Kothari, S. P., A. Leone, and C. Wasley. 2005. Performance matched discretionary accrual measures. Journal of Accounting and Economics 39:163–197.
Kyle, A. S. 1985. Continuous Auction and Insider Trading. Econometrica 53 (6):1315-1335.
La Porta, R., F. Lopez-de-Silanes, A. Shleifer, and R. W. Vishny. 1998. Law and finance. Journal of Political Economy 106 (6):1113.
Lambert, R., C. Leuz, and R. E. Verrecchia. 2007. Accounting Information, Disclosure, and the Cost of Capital. Journal of Accounting Research 45 (2):385-420.
———. 2008. Information Asymmetry, Information Precision, and the Cost of Capital. Working Paper. University of Pennsylvania
Lang, M. H., and R. J. Lundholm. 1996. Corporate Disclosure Policy and Analyst Behavior. Accounting Review 71 (4):467-492.
Lee, D. W., and M. H. Liu. 2007. Does More Information in Stock Price Lead to Greater or Smaller Idiosyncratic Return Volatility? Working Paper. SSRN

94
Lobo, G. J., M. Song, and M. Stanford. 2006. Accruals Quality and Analyst Coverage. Working Paper. University of Houston
McNichols, M., and B. Trueman. 1994. Public disclosure, private information collection, and short-term trading. Journal of Accounting & Economics 17 (1/2):69-94.
McNichols, M. F. 2002. Discussion of The Quality of Accruals and Earnings: The Role of Accrual Estimation Errors. Accounting Review 77 (4):61.
Merton, R. C. 1987. A Simple Model of Capital Market Equilibrium with Incomplete Information. Journal of Finance 42 (3):483-510.
Morck, R., B. Yeung, and W. Yu. 2000. The information content of stock markets: why do emerging markets have synchronous stock price movement? Journal of Financial Economics 58 (1/2):215-260.
Ogneva, M. 2008. Accrual Quality and Expected Returns: The Importance of Controlling for Cash Flow Shocks: SSRN.
Pastor, L., and P. Veronesi. 2003. Stock Valuation and Learning about Profitability. Journal of Finance 58 (5):1749-1790.
Piotroski, J., and D. Roulstone. 2004. The influence of analysts, institutional investors, and insiders on the incorporation of market, industry, and firm-specific information into stock prices. Accounting Review 79:1119-1151.
Rajgopal, S., and M. Venkatachalam. 2008. Financial Reporting Quality and Idiosyncratic Return Volatility over the Last Four Decades. Working Paper. University of Washington and Duke University
Roll, R. 1988. R2. Journal of Finance 43:541-566.
Roulstone, D. T. 2003. Analyst Following and Market Liquidity. Contemporary Accounting Research 20 (3):551-578.
Sami, H., and H. Zhou. 2008. Do auditing standards improve the accounting disclosure and information environment of public companies? Evidence from the emerging markets in China. International Journal of Accounting 43 (2):139-169.
Schipper, K. 1991. Analysts' Forecasts. Accounting Horizons:105-121.
Sloan, R. G. 1996. Do Stock Prices Fully Reflect Information in Accruals and Cash Flows About Future Earnings? Accounting Review 71 (3):289-315.
Teoh, S. H., Y. G. Yang, and Y. Zhang. 2008. R-Square: Noise or Firm-Specific Information? Working Paper. University of Califonia, Irvine and Chinese University of Hong Kong
Verrecchia, R. E. 1982a. Information Acquisition in a Noisy Rational Expectations Economy. Econometrica 50 (6):1415-1430.

95
———. 1982b. The Use of Mathematical Models in Financial Accounting. Journal of Accounting Research 20:1-42.
Watts, R. L., and J. L. Zimmerman. 1986. Positive Accounting Theory. Edited by A. Rappaport. Englewood Cliffs, NJ: Prentice-Hall Inc.
West, K. D. 1988. Dividend Innovations and Stock Price Volatility. Econometrica 56 (1):37-61.
Wurgler, J. 2000. Financial markets and the allocation of capital. Journal of Financial Economics 58 (1/2):187-214.
Yee, K. K. 2006. Earnings Quality and the Equity Risk Premium: A Benchmark Model. Contemporary Accounting Research 23 (3):833-877.

96
APPENDIX
VARIABLE DEFINITIONS
SYNC = Price synchronicity measured as the logit transformation of the R2 from the regression of weekly returns on the market index and an industry index;
AQ = Accruals quality measured as the 5 year rolling standard deviation of the residual from the Dechow and Dichev (2002) model as modified by McNichols (2002) multiplied by negative one;
INNATEAQ = Innate accruals quality measured as the predicted value of accruals quality consistent with Francis et al. (2005);
DISAQ = Discretionary accruals quality measured as the residual of the regression of accruals quality on economic factors consistent with Francis et al. (2005);
MV = Log of the firm's market value at fiscal year end from COMPUSTAT;
LOGHHIF = Log of the weighted average Herfindahl index of industry level concentration;
LOGNIND = Log of average number of firms used to calculate the weekly industry returns;
DIVERS = Diversification measured as a Herfindahl index of firm diversification across 2-digit SIC industries using sales;
FUNDCORR = fundamental correlation measured as the logit transformation of the R2 from the regression of firm ROA on a value weighted industry index of ROA;
LOGIO = The natural log of one plus the percent of shares outstanding held by institutional investors;
REG = Dummy variables equal to 1 if the firm's primary 2-digit SIC is 62 or 49;
IDIORISK = Sum of squared errors from the regression of weekly firm returns on current and prior market and industry weekly returns;
NFOLLOW = The number of analysts used in the IBES estimate in the month of the earnings announcement.

97
VITA
Joseph Johnston was born in Shreveport, Louisiana, but grew up in Queens, New York. He
returned with his family to Shreveport in 1991. He attended Caddo Magnet High School. Out of
high school, he attended Louisiana State University in Shreveport but transferred to Louisiana
Tech University in 2000. He earned his Bachelor of Science in Business Administration with an
emphasis in accounting from Louisiana Tech University in 2001. In 2002, he received his Master
of Professional Accountancy from Louisiana Tech University. That same year he was married
his wife, Elizabeth. He has one child, Mary. After graduation, Joseph will continue to teach for a
year as a lecture at Louisiana State University. His teaching interests are in financial accounting
and accounting information systems. His research interest is on the effects of financial reporting
on the firm’s information environment.