Accuracy of Nitrogen Temperature Correction Factors€¦ · Accuracy of Nitrogen Temperature...
33
Feb. 6 - 10, 2012 2012 Gas-Lift Workshop 1 Accuracy of Nitrogen Temperature Correction Factors Rob Sutton 35 th Gas-Lift Workshop Houston, Texas, USA February 6 – 10, 2012
Transcript of Accuracy of Nitrogen Temperature Correction Factors€¦ · Accuracy of Nitrogen Temperature...

Feb. 6 - 10, 2012 2012 Gas-Lift Workshop 1
Accuracy of Nitrogen Temperature Correction Factors
Rob Sutton
35th Gas-Lift Workshop Houston, Texas, USA February 6 – 10, 2012
Objectives
• Definitions • Need for nitrogen temperature factors (TCF) • Methods to determine nitrogen TCF
– Charts – Tables – Equations
• Method accuracy – Conventional pressure and temperature conditions – HPHT
• Observations and Recommendations

Background
• Nitrogen charged bellows • Temperature effect • Pressure effect • Valve setup in shop • Valve setup in field

Classical TCF References
• Graphs – Kermit Brown: Gas Lift Theory and Practice, Appendix B,
Fig. 24A & 24B (1967). – H.W. Winkler and S.S. Smith: Camco Gas Lift Manual,
Appendix A2, Fig. A2-2 (1962).
• Tables – API Gas Lift Book 6 of the Vocational Training Series,
Table 4-1 (1984). – API Gas Lift Book 6 of the Vocational Training Series,
Third Edition, Table 4-1 (1994).

Classical TCF References
• Equations – H.W. Winkler: “Here’s how to improve your gas lift
installations, Part 6: The Use of Gas Lift Valve Specifications and Force Balance Equations,” (Jan. 1960) 129-135.
– Winkler, H.W. and Eads, P.T.: “Algorithm for More Accurately Predicting Nitrogen-charged Gas-Lift Valve Operation at High Pressures and Temperatures,” paper SPE 18871 presented at the SPE Productions Operations Symposium, Oklahoma City, OK (March 13-14, 1989).
– Takacs, G.: Gas Lift Manual, (2005) 174-175.

Theory – Real Gas Law
TRZnVp =where
p = pressure, psia
V = volume, ft3
n = number of moles
Z = gas compressibility factor
R = universal gas constant =10.73147 psia-ft3/°R-lbm mol
T = temperature, °R
Changing P & T for constant volume and moles of gas
22
2
11
1
TZp
TZp
=

Theory
22
1121 TZ
TZpp =
Condition 2 = operating pressure and temperature.
Condition 1 = test rack (60 °F = 520 °R)
Z = f(p,T) so solving this equation is iterative

Background – TCF
• Dependencies – Gas composition (nitrogen) – Pressure – Temperature
7.147.14
60
−
−=
Td
dt p
pC

Anyone got an App?
N2 TCF
Sources for Nitrogen TCF

Early Sources (1950-60’s) for Nitrogen TCF Multi-Core Processors Limited Apps Available
Problems with 4G Network
Dual-Core Processors

1950 Sage & Lacey Nitrogen Z Factor

Nitrogen TCF Chart from Winkler

Nitrogen TCF Chart
600
800
1,000
1,200
1,400
1,600
1,800
2,000
2,200
2,400
2,600
600 800 1,000 1,200 1,400 1,600 1,800 2,000
Dome Pressure at 60°F, psig
Dom
e Pr
essu
re a
t Ope
ratin
g Te
mpe
ratu
re, p
sig
100 °F120 °F140 °F160 °F180 °F200 °F220 °F240 °F260 °F280 °F300 °F320 °F340 °F360 °F380 °F400 °F
Nitrogen TCF Chart from Brown

Original Nitrogen TCF Table for 60°F
Derived from Winkler 1960 Eqn
Still used today – API RP 11V6
(Continuous Design – IPO,
1999)
( )[ ]6000215.011
−+=
TCt
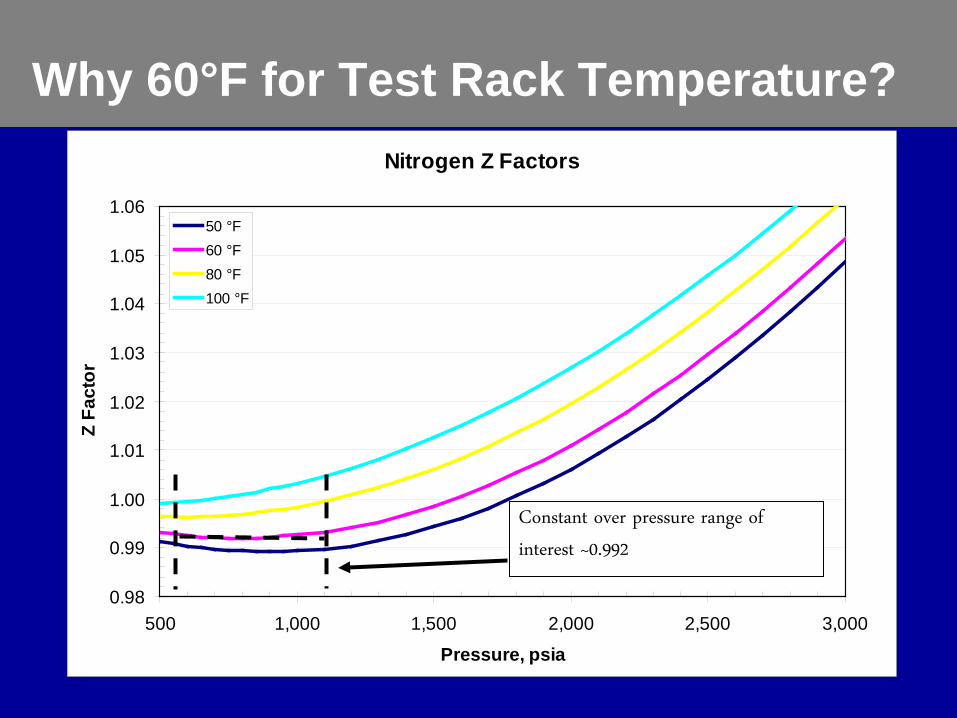
Why 60°F for Test Rack Temperature? Nitrogen Z Factors
0.98
0.99
1.00
1.01
1.02
1.03
1.04
1.05
1.06
500 1,000 1,500 2,000 2,500 3,000
Pressure, psia
Z Fa
ctor
50 °F60 °F80 °F100 °F
Constant over pressure range of
interest ~0.992

Development of Winkler 1960 TCF
• Plot vs where Z60 = 0.992 ( )
5204601
6060 ZTZ
pp
CTT
T
+== 60−T
Development of Winkler Equation
y = 0.00215x + 1.00000R2 = 0.99968
1.00
1.10
1.20
1.30
1.40
1.50
1.60
0 50 100 150 200 250 300Temperature - 60, °F
1 / C
t
1,000 psia
Development of Winkler Equation
y = 0.00215x + 1.00000R2 = 0.99968
1.00
1.10
1.20
1.30
1.40
1.50
1.60
0 50 100 150 200 250 300Temperature - 60, °F
1 / C
t
1,000 psia 800 psia
Development of Winkler Equation
y = 0.00215x + 1.00000R2 = 0.99968
1.00
1.10
1.20
1.30
1.40
1.50
1.60
0 50 100 150 200 250 300Temperature - 60, °F
1 / C
t
1,000 psia 800 psia2,000 psia

Error in TCF Table from 1960 Eqn
Error in Literature Temperature Correction Factor
-1
0
1
2
3
4
5
6
50 100 150 200 250 300 350
Temperature, °F
Tem
pera
ture
Cor
rect
ion
Fact
or
400 psig600 psig800 psig1000 psig1200 psig1400 psig1600 psig1800 psig2000 psig2200 psig2400 psig2600 psig2800 psig3000 psig

Evaluation of Pressure Error
• Assume operating pressure and temperature • Use “method” being evaluated to calculate the
pressure at test rack temperature = 60°F • Use NIST Refprop program for nitrogen Z factor to
accurately calculate the resulting pressure at operating temperature
• Determine the pressure error

Method Error
-50
-25
0
25
50
75
100
0 500 1,000 1,500 2,000 2,500 3,000
Dome Pressure at Operating Temperature, psig
Pres
sure
Err
or a
t Ope
ratin
g C
ondi
tions
, psi
100 °F200 °F300 °F400 °FError Bar
Error in TCF Table from 1960 Eqn
±10 psi Error Bars

Nitrogen Z Factor
0.990
0.995
1.000
1.005
1.010
1.015
1.020
1.025
1.030
1.035
0 50 100 150 200 250 300 350 400 450
Temperature, °F
Z Fa
ctor
Nitrogen Z Factor
y = -4.954E-07x2 + 3.102E-04x + 9.769E-01R2 = 9.976E-01
0.990
0.995
1.000
1.005
1.010
1.015
1.020
1.025
1.030
1.035
0 50 100 150 200 250 300 350 400 450
Temperature, °F
Z Fa
ctor
Nitrogen Z Factor
y = -4.954E-07x2 + 3.102E-04x + 9.769E-01R2 = 9.976E-01
0.990
0.995
1.000
1.005
1.010
1.015
1.020
1.025
1.030
1.035
0 50 100 150 200 250 300 350 400 450
Temperature, °F
Z Fa
ctor
Nitrogen Z Factor
y = -4.954E-07x2 + 3.102E-04x + 9.769E-01R2 = 9.976E-01
0.990
0.995
1.000
1.005
1.010
1.015
1.020
1.025
1.030
1.035
0 50 100 150 200 250 300 350 400 450
Temperature, °F
Z Fa
ctor
Let’s Build A Correlation
Actual Value

Updated Nitrogen TCF Table (1989)
1989 Method of Winkler & Eads
For pd60 < 1,238 psia
For 1,238 < pd60< 3,000 psia
)60(60
−+= TMPP ddT
2760
60
1084.1
002298.0267.0
d
d
p
pM−×
++−=
2760
60
10054.3
001934.000226.0
d
d
p
pM−×
++−=
( )[ ] 1
60600.1
−
−+= dt pMTC

Method Error
-50
-40
-30
-20
-10
0
10
20
30
40
50
0 1,000 2,000 3,000 4,000 5,000
Dome Pressure at Operating Temperature, psig
Pres
sure
Err
or a
t Ope
ratin
g C
ondi
tions
, psi
100 °F200 °F300 °F400 °FError Bar
Error in Updated TCF Table (1989)
±10 psi Error Bars

Takacs Nitrogen Z Factor
• Curve fit to Sage and Lacy nitrogen Z factors – 0-3,000 psia and 60-400°F
21 pcpbZ ++=
( ) 522437 10781.410122.510302.110207.1 −−−− −×+×−×= TTTb
( ) 822538 10880.110058.110640.210461.2 −−−− +×−×+×−= TTTc
Stated accuracy is ±0.1% at the indicated pressure and temperature range

Method Error
-50
-40
-30
-20
-10
0
10
20
30
40
50
0 1,000 2,000 3,000 4,000 5,000
Dome Pressure at Operating Temperature, psig
Pres
sure
Err
or a
t Ope
ratin
g C
ondi
tions
, psi
100 °F200 °F300 °F400 °FError Bar
Error in Takacs Method
±10 psi Error Bars

Dranchuk & Abou-Kassem Z Factor
( )( ) ( )
( ) ( ) ( )211
3221110
52879
22876
55
44
3321
exp1
1
rrrr
rrrrrr
rrrrr
ATAA
TATAATATAA
TATATATAAZ
ρρρ
ρρ
ρ
−+
++−++
++++++=
r
rcr TZ
pZ=ρ
Coefficient Natural Gas Nitrogen A1 0.3265 0.414453 A2 -1.0700 -0.885611 A3 -0.5339 -1.372537 A4 0.01569 -1.307205 A5 -0.05165 2.943774 A6 0.5475 0.244662 A7 -0.7361 -0.253387 A8 0.1844 0.281159 A9 0.1056 0.313724 A10 0.6134 0.307269 A11 0.7210 0.135200 Zc 0.27 0.2916

Method Error
-50
-40
-30
-20
-10
0
10
20
30
40
50
0 1,000 2,000 3,000 4,000 5,000
Dome Pressure at Operating Temperature, psig
Pres
sure
Err
or a
t Ope
ratin
g C
ondi
tions
, psi
100 °F200 °F300 °F400 °FError Bar
Error in DAK (Natural Gas Z)
±10 psi Error Bars

Method Error
-50
-40
-30
-20
-10
0
10
20
30
40
50
0 1,000 2,000 3,000 4,000 5,000
Dome Pressure at Operating Temperature, psig
Pres
sure
Err
or a
t Ope
ratin
g C
ondi
tions
, psi
100 °F200 °F300 °F400 °FError Bar
Error in DAK Z (Adapted for Nitrogen)
±10 psi Error Bars

Reference Temperature
• Field testing at temperatures other than 60 °F • Winkler-Eads developed only for 60 °F
– Reference temperature other than 60 °F • Correct operating pressure to pressure at 60 °F • Correct this pressure to new reference temperature
• TCF for temperatures other than 60 °F should be calculated from fundamental relationships – Real gas law – Nitrogen Z routine (Sutton modification of DAK)
• Reference temperature 60-100 °F, the pressure error is < ±10 psi for operating pressure < 9,000 psig at 100-400 °F

Observations & Recommendations
• Reviewed 5 methods to correct Nitrogen charged dome pressures to 60 °F shop temperature
• Errors for all methods acceptable below 1,200 psig operating pressure (OP)
• Winkler-Eads method acceptable below 4,000 psig OP – If tables are used, need several tables to cover pressure range
• Takacs method acceptable below 3,000 psig OP • Methods from Winkler-Eads and Takacs offer no advantage over
original DAK method which is developed to model the Standing-Katz natural gas Z factor chart
• Sutton tuned DAK equation to Nitrogen Z factors offers accuracy to 9,000 psig OP at temperatures (60-400 °F)

Additional References • Dranchuk, P.M. and Abou-Kassem, J.H.: "Calculation
of Z Factors For Natural Gases Using Equations of State," J. Cdn. Pet. Tech. (July-Sept., 1975) 34-36.
• Sutton, R.P.: “Fundamental PVT Calculations for Associated and Gas/Condensate Natural-Gas Systems,” SPE Reservoir Evaluation & Engineering, v. 10, no. 3 (June 2007) 270-284.
• Lemmon, E.W., Huber, M.L., McLinden, M.O. : NIST Standard Reference Database 23: Reference Fluid Thermodynamic and Transport Properties-REFPROP, Version 9.0, National Institute of Standards and Technology, Standard Reference Data Program, Gaithersburg, 2010.
• http://webbook.nist.gov/chemistry/fluid/

Additional References
• Sage, B.H. and Lacey, W.N.: Thermodynamic Properties of the Lighter Paraffin Hydrocarbons and Nitrogen, Monograph on API Research Project 37, API (1950) 85-114.
• Eilerts, C.K.: Phase Relations of Gas-Condensate Fluids,Vol. II, Monograph 10, Bureau of Mines, American Gas Association (1959) 763-764.

Feb. 6 – 10. 2012 2012 Gas-Lift Workshop 32
Copyright Rights to this presentation are owned by the company(ies) and/or author(s) listed on the title page. By submitting this presentation to the Gas-Lift Workshop, they grant to the Workshop, the Artificial Lift Research and Development Council (ALRDC), and the American Society of Mechanical Engineers (ASME), rights to:
– Display the presentation at the Workshop. – Place it on the www.alrdc.com web site, with access to the site to be as
directed by the Workshop Steering Committee. – Place it on a CD for distribution and/or sale as directed by the Workshop
Steering Committee. Other uses of this presentation are prohibited without the expressed written permission of the company(ies) and/or author(s) who own it and the Workshop Steering Committee.
Feb. 6 – 10, 2012 2012 Gas-Lift Workshop 33
Disclaimer The following disclaimer shall be included as the last page of a Technical Presentation or Continuing Education Course. A similar disclaimer is included on the front page of the Gas-Lift Workshop Web Site. The Artificial Lift Research and Development Council and its officers and trustees, and the Gas-Lift Workshop Steering Committee members, and their supporting organizations and companies (here-in-after referred to as the Sponsoring Organizations), and the author(s) of this Technical Presentation or Continuing Education Training Course and their company(ies), provide this presentation and/or training material at the Gas-Lift Workshop "as is" without any warranty of any kind, express or implied, as to the accuracy of the information or the products or services referred to by any presenter (in so far as such warranties may be excluded under any relevant law) and these members and their companies will not be liable for unlawful actions and any losses or damage that may result from use of any presentation as a consequence of any inaccuracies in, or any omission from, the information which therein may be contained. The views, opinions, and conclusions expressed in these presentations and/or training materials are those of the author and not necessarily those of the Sponsoring Organizations. The author is solely responsible for the content of the materials. The Sponsoring Organizations cannot and do not warrant the accuracy of these documents beyond the source documents, although we do make every attempt to work from authoritative sources. The Sponsoring Organizations provide these presentations and/or training materials as a service. The Sponsoring Organizations make no representations or warranties, express or implied, with respect to the presentations and/or training materials, or any part thereof, including any warrantees of title, non-infringement of copyright or patent rights of others, merchantability, or fitness or suitability for any purpose.