ACCURACY OF MEASUREMENTS MADE WITH A...
6
1 ACCURACY OF MEASUREMENTS MADE WITH A CYRAX 2500 LASER SCANNER AGAINST SURFACES OF KNOWN COLOUR J. Clark and S. Robson ([email protected], [email protected]) Department of Geomatic Engineering, University College London Gower Street, London WC1E 6BT KEY WORDS: Laser scanning, point cloud, accuracy testing, colour analysis, correction. ABSTRACT: Several commercial manufacturers produce laser scanning systems capable of measuring the surfaces of objects to precisions of the order of a few millimetres at ranges of between 2 and 200 meters. Experience on a number of projects has demonstrated significant variations in the quality of point cloud data as a function of object surface reflectivity. This paper investigates the performance of a Leica HDS2500 laser scanner in making measurements to a variety of surfaces of specified colour characteristics under laboratory conditions. From the data obtained it is evident that significant systematic range discrepancies exist which can be broadly correlated against the colour of each surface with respect to the wavelength of the laser used. Over the distances investigated a high correlation between the point data quality measure returned by the scanner and the range discrepancy was observed, offering the possibility of applying a correction to the data produced by a HDS2500 scanner. Such a correction, which is demonstrated to be applicable for diffusely reflecting surfaces, can be carried out with data available to the end user in order to significantly improve scanner accuracy. INTRODUCTION The Cyrax 2500 laser scanner, recently renamed the Leica HDS2500, uses the time of flight principal to measure range by observing the two-way travel time of a short pulse of laser light. The range to the surface is measured if a sufficient amount of pulse energy is reflected so that a signal is registered by the scanner’s photodetector. The electrical signal generated by the detector must exceed a predefined threshold in order for the return time to be observed [3]. The proportion of the pulse reflected depends on the properties of the surface material and wavelength of the laser, which in the case of the 2500 system is 532nm. Lichti and Harvey [3] noted that the reflector-less nature of the system, and others of its type, raise the possibility of range errors due to pulse attenuation by the reflecting surface. Low reflectance results in poor quality data capture with some areas missing data completely or operating only effectively over a shorter range [1]. The system can operate over distances of up to 100 metres, although the recommended maximum range is 50 metres. Tests have shown that the system is not capable of measuring distances to materials with a low reflectivity beyond 50 metres [2]. In addition, Johansson [2] also detected some loss of points on these surfaces within the 50 metre range. In general it can be assumed that a material with a good diffuse reflectance, at the wavelength of the laser light being used, allows the capture of good quality data. For the 2500 system, Leica specify a single point positional accuracy of ±6mm (1σ) over a range of 1.5m to 50m, a distance accuracy of ±4mm (1σ) and an angular accuracy of ±12”. The modelled surface precision is quoted as ±2mm subject to modelling methodology. This specification can be accessed at www.leica.com and has been reported on and evaluated by Tucker [6] and Boehler et al [7]. The work described in this paper will use these values to assess system performance. As a matter of note, the laser scanner used for this work had just returned from a factory service. Experiences at Plowman Craven and Associates (PCA) Experience with the 2500 system on a variety of projects has shown that scanning materials with different colours and textures produces point clouds of varying quality. Visual impressions, gained through modelling operations performed on the point cloud data, convey the impression that surfaces of lighter colour with higher reflectance provide the most favourable results in terms of high point density and minimal noise. Whilst this is to be expected, significant differences in measured range between surface types have also been observed. An example of this effect is the scanning of a large grey aeroplane with a dark stripe painted along the side. The resultant point cloud shows a false indent in the region of the stripe of the order of two to three millimetres deep. This suggests that the surface properties are affecting the laser’s return signal in some way and therefore the range recorded by the scanner. Overview of Experiments To investigate scanner measurement quality to different surface types, a selection of standardised colour patches and selected building materials were scanned at varying ranges and angles to the scanner. In each case the resultant point cloud was analysed to examine the effect of different colours and textures at each position. This paper reports on results obtained from a small portion of these laboratory tests namely those designed to investigate the quality of the point cloud with respect to surface colour. Key to repeatability and quantifiable nature of these tests are a set of standardised colour reference surfaces. Such a set were provided by a GretagMacbeth ColorChecker chart (Figure 1) which is manufactured to provide a standard set of colour patches with known spectral reflectance for the photographic industry. For the purposes of these tests the chart was adhered to a rigid planar surface to provide a planar object suitable for scanning.
Transcript of ACCURACY OF MEASUREMENTS MADE WITH A...

� �
1
ACCURACY OF MEASUREMENTS MADE WITH A CYRAX 2500 LASER SCANNER AGAINST SURFACES OF KNOWN COLOUR
J. Clark and S. Robson
([email protected], [email protected]) Department of Geomatic Engineering,
University College London Gower Street, London WC1E 6BT
KEY WORDS: Laser scanning, point cloud, accuracy testing, colour analysis, correction. ABSTRACT: �
Several commercial manufacturers produce laser scanning systems capable of measuring the surfaces of objects to precisions of the order of a few millimetres at ranges of between 2 and 200 meters. Experience on a number of projects has demonstrated significant variations in the quality of point cloud data as a function of object surface reflectivity. This paper investigates the performance of a Leica HDS2500 laser scanner in making measurements to a variety of surfaces of specified colour characteristics under laboratory conditions. From the data obtained it is evident that significant systematic range discrepancies exist which can be broadly correlated against the colour of each surface with respect to the wavelength of the laser used. Over the distances investigated a high correlation between the point data quality measure returned by the scanner and the range discrepancy was observed, offering the possibility of applying a correction to the data produced by a HDS2500 scanner. Such a correction, which is demonstrated to be applicable for diffusely reflecting surfaces, can be carried out with data available to the end user in order to significantly improve scanner accuracy.
INTRODUCTION
The Cyrax 2500 laser scanner, recently renamed the Leica HDS2500, uses the time of flight principal to measure range by observing the two-way travel time of a short pulse of laser light. The range to the surface is measured if a sufficient amount of pulse energy is reflected so that a signal is registered by the scanner’s photodetector. The electrical signal generated by the detector must exceed a predefined threshold in order for the return time to be observed [3].
The proportion of the pulse reflected depends on the properties of the surface material and wavelength of the laser, which in the case of the 2500 system is 532nm. Lichti and Harvey [3] noted that the reflector-less nature of the system, and others of its type, raise the possibility of range errors due to pulse attenuation by the reflecting surface. Low reflectance results in poor quality data capture with some areas missing data completely or operating only effectively over a shorter range [1]. The system can operate over distances of up to 100 metres, although the recommended maximum range is 50 metres. Tests have shown that the system is not capable of measuring distances to materials with a low reflectivity beyond 50 metres [2]. In addition, Johansson [2] also detected some loss of points on these surfaces within the 50 metre range. In general it can be assumed that a material with a good diffuse reflectance, at the wavelength of the laser light being used, allows the capture of good quality data.
For the 2500 system, Leica specify a single point positional accuracy of ±6mm (1σ) over a range of 1.5m to 50m, a distance accuracy of ±4mm (1σ) and an angular accuracy of ±12”. The modelled surface precision is quoted as ±2mm subject to modelling methodology. This specification can be accessed at www.leica.com and has been reported on and evaluated by Tucker [6] and Boehler et al [7]. The work described in this paper will use these values to assess system performance. As a matter of note, the laser scanner used for this work had just returned from a factory service.
Experiences at Plowman Craven and Associates (PCA)
Experience with the 2500 system on a variety of projects has shown that scanning materials with different colours and textures produces point clouds of varying quality. Visual impressions, gained through modelling operations performed on the point cloud data, convey the impression that surfaces of lighter colour with higher reflectance provide the most favourable results in terms of high point density and minimal noise. Whilst this is to be expected, significant differences in measured range between surface types have also been observed. An example of this effect is the scanning of a large grey aeroplane with a dark stripe painted along the side. The resultant point cloud shows a false indent in the region of the stripe of the order of two to three millimetres deep. This suggests that the surface properties are affecting the laser’s return signal in some way and therefore the range recorded by the scanner.
Overview of Experiments
To investigate scanner measurement quality to different surface types, a selection of standardised colour patches and selected building materials were scanned at varying ranges and angles to the scanner. In each case the resultant point cloud was analysed to examine the effect of different colours and textures at each position.
This paper reports on results obtained from a small portion of these laboratory tests namely those designed to investigate the quality of the point cloud with respect to surface colour. Key to repeatability and quantifiable nature of these tests are a set of standardised colour reference surfaces. Such a set were provided by a GretagMacbeth ColorChecker chart (Figure 1) which is manufactured to provide a standard set of colour patches with known spectral reflectance for the photographic industry. For the purposes of these tests the chart was adhered to a rigid planar surface to provide a planar object suitable for scanning.
� �
2
Fig. 1 GretagMacbeth ColorChecker chart mounted on a
vertical optical rail for testing purposes. Data obtained from the bottom two rows of patches (primary and greyscale) are
reported on here
Since there is no universally defined standard reference colour at which scanning reference distances are measured, for the purpose of this work the Neutral 8 grey patch (second from bottom left) was selected as the reference patch.
The key aims of the experiments described in this paper are as follows:
• To investigate any variation in data distribution and noise for each colour patch
• To investigate any variation in data distribution and noise with rotation of each patch
• To investigate any changes in range for each colour patch and to attempt to link these to the scanner output giving a measure of the intensity of the return signal.
METHODOLOGY
Colour Checker Chart Scanning
The majority of scanning was carried out in the stable environment provided by UCL’s instrument calibration laboratory. A purpose built scanner mounting was manufactured that allowed the scanner to be attached onto an optical rail at the same height as the ColorChecker chart. Experiments were divided into three groups, a close range set where chart rotation and translation were carefully controlled, a near range set where only translation was varied and a further range set scanned outside the laboratory. The eight different distances employed gave a measurement range of 4 to 9.5 metres in the laboratory and up to 24 metres externally. In each case the chart was scanned at a resolution of 1mm by 1mm using the default scanner settings for atmospheric correction.
Close range case
In order to allow repeatable rotation and translation of the chart with respect to the laser scanner, the chart was securely clamped to a small optical rail mounted on a motorised high accuracy rotation stage (Newport RV160HAT). The rotation stage was located on top of a 600mm travel translation stage (Newport IMS600CC) which was in turn rigidly attached to an optical table. The optical bench mounted laser scanner was aligned so as to be orthogonal to the axis of the translation stage by auto reflection of a laser beam off the scanner glass entrance window.
The distances between the first three chart positions (one to three) were recorded to better than 20 microns by the translation
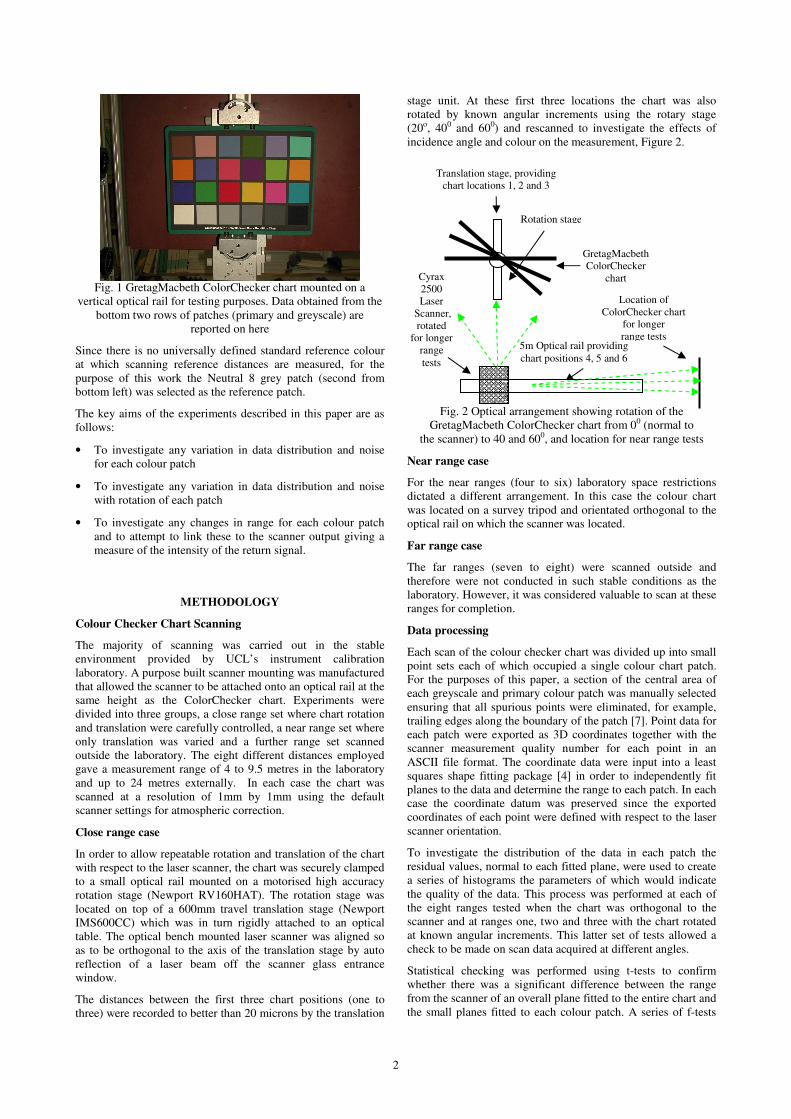
stage unit. At these first three locations the chart was also rotated by known angular increments using the rotary stage (20o, 400 and 600) and rescanned to investigate the effects of incidence angle and colour on the measurement, Figure 2.
Fig. 2 Optical arrangement showing rotation of the GretagMacbeth ColorChecker chart from 00 (normal to
the scanner) to 40 and 600, and location for near range tests
Near range case
For the near ranges (four to six) laboratory space restrictions dictated a different arrangement. In this case the colour chart was located on a survey tripod and orientated orthogonal to the optical rail on which the scanner was located.
Far range case
The far ranges (seven to eight) were scanned outside and therefore were not conducted in such stable conditions as the laboratory. However, it was considered valuable to scan at these ranges for completion.
Data processing
Each scan of the colour checker chart was divided up into small point sets each of which occupied a single colour chart patch. For the purposes of this paper, a section of the central area of each greyscale and primary colour patch was manually selected ensuring that all spurious points were eliminated, for example, trailing edges along the boundary of the patch [7]. Point data for each patch were exported as 3D coordinates together with the scanner measurement quality number for each point in an ASCII file format. The coordinate data were input into a least squares shape fitting package [4] in order to independently fit planes to the data and determine the range to each patch. In each case the coordinate datum was preserved since the exported coordinates of each point were defined with respect to the laser scanner orientation.
To investigate the distribution of the data in each patch the residual values, normal to each fitted plane, were used to create a series of histograms the parameters of which would indicate the quality of the data. This process was performed at each of the eight ranges tested when the chart was orthogonal to the scanner and at ranges one, two and three with the chart rotated at known angular increments. This latter set of tests allowed a check to be made on scan data acquired at different angles.
Statistical checking was performed using t-tests to confirm whether there was a significant difference between the range from the scanner of an overall plane fitted to the entire chart and the small planes fitted to each colour patch. A series of f-tests
Cyrax 2500 Laser
Scanner, rotated
for longer range tests�
GretagMacbeth ColorChecker
chart
Translation stage, providing chart locations 1, 2 and 3
Rotation stage
5m Optical rail providing chart positions 4, 5 and 6
Location of ColorChecker chart
for longer range tests
� �
3
were also used to determine whether the spread of points defining a colour patch were significantly different to those defining the same colour patch at the different ranges and angles. Finally, any relationship between the different colours and the scanner’s data quality value from the return signal was examined. This was achieved by plotting the range error of each colour patch against the reflectance value measured by the scanner, as well as the spectral reflectance value of each colour patch at the scanner’s wavelength (532nm). If any systematic effects could be identified this would offer the possibility of a correction model capable of further improving measurement accuracy to similar surfaces.
RESULTS OF THE COLOUR CHART ANALYSIS
Least squares plane fitting
Range parameters derived from least squares plane fits to the point cloud data demonstrate that different colour patches exhibited different range offsets. For the greyscale chart patches the range to the black patch, as determined by the scanner, was greater than the range to the white patch and the grey patches in between systematically stepped back from one another. The standard deviation of each individual colour patch plane fit was of the order of two to three millimetres. Larger planes were also fitted to the entire colour chart with all of the borders and edges omitted in order to obtain a mean range for the complete chart. Figure 3 shows the planes fitted to the point cloud at positions one to three. The plane offsets are consistent at each position, for example, the planes fitted to the white patches all lie in front of the large patch fitted to the entire data set.
��� �Figure 3: The large and small planes fitted to the point clouds
of the colour chart at positions one (nearest), two and three
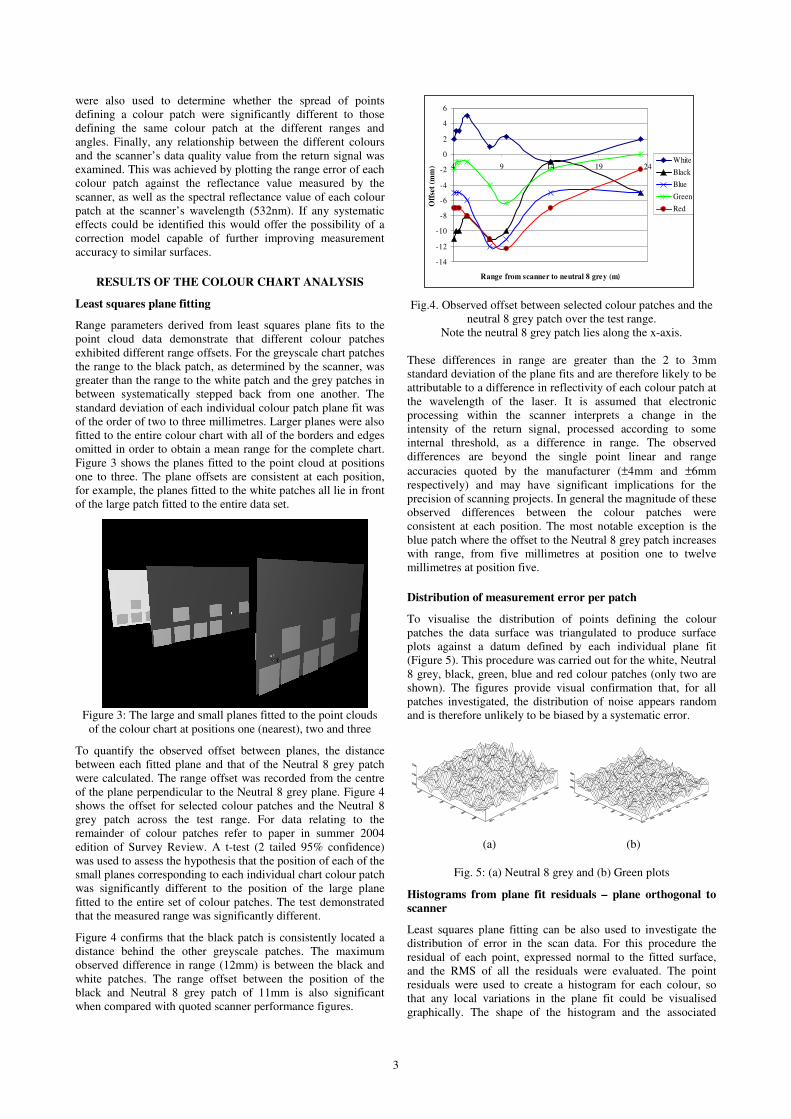
To quantify the observed offset between planes, the distance between each fitted plane and that of the Neutral 8 grey patch were calculated. The range offset was recorded from the centre of the plane perpendicular to the Neutral 8 grey plane. Figure 4 shows the offset for selected colour patches and the Neutral 8 grey patch across the test range. For data relating to the remainder of colour patches refer to paper in summer 2004 edition of Survey Review. A t-test (2 tailed 95% confidence) was used to assess the hypothesis that the position of each of the small planes corresponding to each individual chart colour patch was significantly different to the position of the large plane fitted to the entire set of colour patches. The test demonstrated that the measured range was significantly different.
Figure 4 confirms that the black patch is consistently located a distance behind the other greyscale patches. The maximum observed difference in range (12mm) is between the black and white patches. The range offset between the position of the black and Neutral 8 grey patch of 11mm is also significant when compared with quoted scanner performance figures.
-14
-12
-10
-8
-6
-4
-2
0
2
4
6
4 9 14 19 24
Range from scanner to neutral 8 grey (m)
Offs
et (m
m)
WhiteBlackBlue
GreenRed
�
Fig.4. Observed offset between selected colour patches and the neutral 8 grey patch over the test range.
Note the neutral 8 grey patch lies along the x-axis.
These differences in range are greater than the 2 to 3mm standard deviation of the plane fits and are therefore likely to be attributable to a difference in reflectivity of each colour patch at the wavelength of the laser. It is assumed that electronic processing within the scanner interprets a change in the intensity of the return signal, processed according to some internal threshold, as a difference in range. The observed differences are beyond the single point linear and range accuracies quoted by the manufacturer (±4mm and ±6mm respectively) and may have significant implications for the precision of scanning projects. In general the magnitude of these observed differences between the colour patches were consistent at each position. The most notable exception is the blue patch where the offset to the Neutral 8 grey patch increases with range, from five millimetres at position one to twelve millimetres at position five.
Distribution of measurement error per patch
To visualise the distribution of points defining the colour patches the data surface was triangulated to produce surface plots against a datum defined by each individual plane fit (Figure 5). This procedure was carried out for the white, Neutral 8 grey, black, green, blue and red colour patches (only two are shown). The figures provide visual confirmation that, for all patches investigated, the distribution of noise appears random and is therefore unlikely to be biased by a systematic error.
�
(a)� � � (b) �
Fig. 5: (a) Neutral 8 grey and (b) Green plots�
Histograms from plane fit residuals – plane orthogonal to scanner
Least squares plane fitting can be also used to investigate the distribution of error in the scan data. For this procedure the residual of each point, expressed normal to the fitted surface, and the RMS of all the residuals were evaluated. The point residuals were used to create a histogram for each colour, so that any local variations in the plane fit could be visualised graphically. The shape of the histogram and the associated

� �
4
descriptive statistics give an indication of the spread of the data and therefore allow any discrepancies in the data between experimental conditions to be detected. For the purpose of this paper only the white, Neutral 8 grey and black from the greyscale patches and blue, green and red from the primary colours will be discussed.
Figure six shows a typical set of histograms for the white, Neutral 8 grey and black residual values following plane fitting at position one with the planes orientated normal to the scanner. Table 1 documents a range of sample statistics connected with these data and also those for the Red, Green and Blue colour patches.
Histograms for all of the patches scanned with the chart orientated normal to the scanner exhibit very little variation. There is a slightly increased standard deviation for positions seven and eight, which may be due to ambient light levels as the chart was scanned outside for these positions. Of greatest importance is that the standard deviation of the residuals normal to the planar surface was of the order of 2 to 3mm, with minima and maxima of up to 12mm, for each individual surface patch.
0
2
4
6
8
10
12
14
16
18
10 -8 -6 -4 -2 0 2 4 6 8 10
Distribution from Mean
Freq
uen
cy
White
Neutral 8
Black
Fig.6 White, Neutral 8 and Black patch distributions at position 1 (4.08m)
An f-test was used to determine whether two populations taken from the same patches at different ranges were significantly different. The samples were tested using a two-tailed test at the 95% confidence level, the null hypothesis being that the variance of the two samples are equal. Results of the f-test demonstrated no significant difference between the same colour patches at the different ranges when positioned orthogonal to the scanner. For example, there was no significant difference between the points defining the white patch at position one (4.08m) and position five (7.75m). This shows that the response of the scanner to different orthogonally positioned colour patches does not change over the short range tested.
Table 1: Descriptive statistics (mm) for the white, Neutral 8 grey and black patch data at positions one, three, five and six
Position 1 (4080mm) 5 (7750mm) Patch W N 8 Blk W N 8 Blk Std Dev 2.5 3.6 4.0 3.2 3.6 4.0 Min -7.1 -9.0 -9.0 -7.0 -9.0 -9.0 Max 7.6 9.0 10.0 9.7 9.0 10.0 Patch G B R G B R Std Dev 2.4 3.2 3.5 3.0 3.2 3.5 Min -8.2 -10 -8.0 -10 -10 -8.0 Max 7.2 9.2 7.5 9 9.2 7.5
Histograms from plane fit residuals – plane rotated with respect to the scanner
Experimental results from the case where the colour chart was rotated with respect to the axis of the scanner demonstrate significant discrepancies. Figure 7 describes variations in the histograms for the white and black patches. Data are also summarised in Table 2.
White Patch
0
2
4
6
8
10
12
14
16
18
-10 -8 -6 -4 -2 0 2 4 6 8 10Distribution from Mean
Freq
uenc
y
Pos 1
Pos 1, 20 deg
Pos 1, 40 deg
Pos ,1 60 deg
�(a)
Black Patch
0
2
4
6
8
10
12
14
16
18
-10 -8 -6 -4 -2 0 2 4 6 8 10Distribution from Mean
Freq
uenc
y
Pos 1
Pos 1, 20 deg
Pos 1, 40 deg
Pos ,1 60 deg
�(b)
Histograms of variation in data distribution from the mean at 00, 200, 400 and 600 to the scanner Fig 7(a) White Patch and 7 (b) Black Patch
Table 2: Descriptive statistics (mm) for the white, Neutral 8
grey and black and colour patch data at position one. Chart aligned orthogonal and 40 degrees to the scanner.
Position Orthogonal 40 Degrees Patch W N 8 Blk W N 8 Blk Std Dev 2.4 2.6 2.6 1.7 2 2.2 Min -8.2 -8.2 -8.8 -5.3 -4.8 -6 Max 7.2 8.8 7.6 6.8 6.8 7.1 Patch G B R G B R Std Dev 2.4 2.6 2.6 1.8 1.9 2.17 Min -8.2 -8.2 -8.8 -5.4 -6.3 -5.6 Max 7.2 8.8 7.6 5.9 6.6 6.7
�
As expected from the scanning geometry the number of points captured (area under the curve) decreases with an increase in incident angle. The charts show that the normal distribution improves as the incidence angle is increased. The effect is most pronounced with patches that have greater reflectivity at the wavelength of the laser. F-test computations indicate that the observed changes in histogram shape with rotation angle are significant. For example, the white patch at 00 is significantly different to white at 400 at the 90 per cent significance level. This verifies the observed differences between the histograms where it appeared that the shape of the data distribution improved when each patch

� �
5
was scanned at increasingly greater angles. However, it should be noted that although the histograms for the chart scanned at 600 exhibit the narrowest distribution, implying that a greater majority of points lie close or on the plane, the density of points captured is noticeably reduced. These results therefore suggest that for matt surfaces it could be preferable to scan an object at an angle of 200 to 400 to produce the optimal point cloud with a reduced proportion of noise compared to an object scanned normal to the scanner. These findings need to be validated further with real objects with different surface properties to ascertain if scanning an object at an angle significantly increases the precision of the dataset for practical purposes such as 3D modelling.
Correlation with laser scanner data quality value
The data was analysed to assess any relationship between colour patch reflectance at the laser wavelength, the data quality measurement recorded by the scanner and the range error. Any such relationship could be important in generating a correction method for the observed range discrepancies.
Figure 8 demonstrates the difference in range measurement for each patch against the spectral reflectance value of each colour patch. Range offsets are recorded with respect to the Neutral 8 grey patch. Colour patch spectral reflectance was derived according to the known spectral reflectance of each chart patch at the wavelength of the scanner’s green laser [5]. A systematic, but non-linear, relationship between the two variables is apparent. Figure 9 shows a similar relationship between range offset and average scanner measurement quality value for each colour patch indicating that the quality measure is closely related to patch reflectance. In both cases the actual quality value recorded by the scanner was used rather than the normalised value which is used to colour code the resultant point cloud.
-4-202468
1012
0 0.2 0.4 0.6 0.8 1
GretagM acbeth Colour Chart Value at 532nm
Off
set (
mm
)
�
Fig. 8: GretagMacbeth spectral reflectance value against patch offset (Neutral 8 reference) at position five (7.75m)
-4-202468
1012
-600 -400 -200 0 200
Average M easurement Quality Value
Off
est (
mm
)
Fig 9: Average scanner measurement quality value against patch
offset (Neutral 8 reference) at position five (7.75m) The above figures show that there is a clear relationship between the error in range and the scanner’s measurement quality value. In general, as the offset from the Neutral 8 grey patch increases, the spectral reflectance and the quality values decrease. This information can be used to apply a correction to the range error, which could potentially increase range measurement accuracy.
Development of a simple correction factor
Figure 10 shows the quality measure recorded by the scanner against the patch offset from Neutral 8 for chart positions one to six. A cubic regression curve was fitted to each set of data. The curves fitted to the data fall into three groups, those from positions one to four (4.08m to 5.5m), those from positions five and six (7.75m and 9.5m) and those from positions seven to eight (14m to 24m). The reason behind this grouping is not fully understood without knowledge of manufacturer’s calibration models. It is possible that the scanner applies discrete correction factors for different groups of ranges, which could account for the offset between the three sets of data. To test this hypothesis further it would be necessary to carry out the tests over both a greater range of distances and a denser sampling interval.
Scanner Measurement Quality Value
-400 -300 -200 -100 0 100
Off
set (
mm
)
-10
-5
0
5
10
15
Position 1Position 2Position 3Position 4Position 5Position 6Position 7Postion 8Regression lines
Fig 10: Nonlinear regression analysis for the intensity at 532nm and offset (from neutral 8 grey) for positions one to eight. Note
the three distinctive groups of curves.
In order to compute a correction factor that could be used for close range work, the average regression cubic curve was plotted for positions one to four corresponding to the first set of curves.
As a test, corrections derived from the cubic regression curve were applied to the black patch point data at position one orthogonal to the scanner. A plane was fitted to the corrected points and analysed by creating a histogram of the residual values for each point. The histogram was the same shape and had very similar descriptive statistics to the original black patch data. However, the overall patch position had moved closer to the Neutral 8 grey patch. Therefore the corrected values for the black patch data had increased the accuracy, but had not increased the precision of the data.
Similar corrections were applied to all of the colour chart patches including the pastel shades on the top two rows. Figure 11 allows visualisation of the results. After the correction has been applied the entire point set lie closer to the average plane fitted through all points. For example, the plane fitted to the black patch lies 2mm behind the average patch after the correction has been applied. In comparison the uncorrected black patch is positioned 5mm behind the average plane. The points comprising the corrected colour chart (Figure 11) can be seen to be positioned nearer the plane than the uncorrected chart (Figure 3). The greyscale patches in the uncorrected point cloud

� �
6
have a distinct stepped appearance with the white points lying well in front of the plane and the black points well behind the plane. In the corrected point cloud this stepped pattern has been flattened out.
Fig 11: Corrected colour chart points
In practice the range correction can be applied after the data has been captured by the scanner, so that a correction for each scanned point location can be computed. Ideally the correction factor should be applied to the data within the scanner.
Further correction factor considerations
1. The correction factor was formulated for a limited range (4 to 5.5 metres). It was noted during this experiment that there appeared to be different regression curves for different bands of ranges. This assumption should be tested further.
2. Neutral 8 grey was selected as the optimum colour in terms of reflectivity.
3. It is possible that this correction factor will be different for individual scanners using similar range measurement methods.
CONCLUSIONS
It is known from practical experience with the 2500 laser scanner that materials of different colour and texture produce point clouds of varying quality. At Plowman Craven and Associates (PCA) the scanner is being applied to projects demanding greater accuracy where errors imposed by different materials may be significant. It is therefore important to understand where possible erroneous points may be found in order to be able to evaluate and make use of the resulting point cloud in an effective manner.
Prior to these experiments it was assumed that point cloud data representing different coloured surfaces would vary in density and data quality according to the surface properties at the scanner laser wavelength. This paper has demonstrated that, over the limited range of test distances investigated, the noise within each dataset to orthogonal surfaces appeared random and largely insensitive in terms of distribution and data density to variations in surface reflectivity. Significant differences were however found when the planar colour chart was rotated by angles of up to 60 degrees to the scanner. In such cases the spread of the data distribution actually improved with scan angle. Unfortunately at 60 degrees the density of the point data began to noticeably decrease making angles of 40 degrees more practical.
Experimental results demonstrate a systematic discrepancy in range recorded by the scanner to different colour patches. Results agree with the expectation that colours with a poor
reflectance at 532nm, for example black and red, reflect less of the laser pulse causing the scanner to record a greater range than the true position. Furthermore the observed difference in range between colour patches closely correlates with the data point measurement quality value recorded by the 2500 scanner. This correlation appears stratified into groups of different ranges which is likely to be related to the manufacturer’s scanner calibration methodology. A correction factor was formulated for ranges of 4 to 5.5 metres and applied to selected colour patch datasets to produce a set of corrected point locations. The correction was found to move 3D data points derived from different reflecting patches closer to physical location of the complete colour chart thereby enhancing accuracy. The correction did not improve the precision of the point cloud.
It is likely that all scanners which use a similar method of range measurement will also exhibit variations in range when scanning a variety of different colours. It may therefore be preferable to incorporate an experiment testing the response of the scanner to a variety of colours as a standard part of a calibration procedure.� A further paper is in progress which describes similar experiments undertaken to analyse scanner response to a selection of different material types at both close and longer ranges.
ACKNOWLEDGEMENTS
The authors would like to acknowledge the support of Plowman Craven and Associates Ltd (PCA) and the UK Department of Trade and Industry’s Teaching Company Scheme without which this work would not have been possible. Equipment purchased as part of EPSRC strategic equipment funding (GR/R06878/01) supported these tests.
REFERENCES
1. Barber, D. and Mills, J. 2001. Redefining the three R’s –
Reflectance, Resolution and Reference: Important considerations for Laser Mapping Systems. Surveying World. May/ June. Pages 33-34.
2. Johansson, M. 2002. Explorations into the Behaviour of Three Different High-Resolution Ground-Based Laser Scanners in the Built Environment. Proceedings of the CIPA WG 6. International Workshop on Scanning and Cultural Heritage Recording. Sept 1-2, 2002. Corfu, Greece. Pages 33-38.
3. Lichti, D and Harvey, B. 2002. The Effects of Reflecting Surface Material Properties on Time-of-Flight Laser Scanner Measurements. Symposium on Geospatial Theory, Processing and Applications, Ottawa.
4. Fryer, J.G., Parberry, R.D. & Robson, S., 1992. Analysis of as-built cylindrical shapes. Australian Journal of Geodesy, Photogrammetry and Surveying 56:91-109.
5. www.brucelindbloom.com A selection of useful Colour Calculators and Spreadsheets accessed July 2002.
6. Tucker, C. 2002. Testing and verification of the accuracy of 3D laser scanning data. Symposium on Geospatial Theory, Processing and Applications, Ottawa.
7. Boehler. W, Bordas Vicent, M. & Marbs A. 2003. Investigating laser scanner accuracy. Presented paper XIX CIPA Symposium at Antalya, Turkey, 30 Sep – 4 October 2003.