Accuracy of Bicycle Counting with Pneumatic Tubes in Oregon
19
Portland State University Portland State University PDXScholar PDXScholar Civil and Environmental Engineering Faculty Publications and Presentations Civil and Environmental Engineering 2016 Accuracy of Bicycle Counting with Pneumatic Tubes Accuracy of Bicycle Counting with Pneumatic Tubes in Oregon in Oregon Krista Nordback Portland State University, [email protected] Sirisha Murthy Kothuri Portland State University Taylor Phillips Portland State University Carson Gorecki Portland State University Miguel Figliozzi Portland State University, fi[email protected] Follow this and additional works at: https://pdxscholar.library.pdx.edu/cengin_fac Part of the Transportation Commons, Urban Studies Commons, and the Urban Studies and Planning Commons Let us know how access to this document benefits you. Citation Details Citation Details Nordback, K., Kothuri, S., Phillips, T., Gorecki, C., & Figliozzi, M. (2016). Accuracy of Bicycle Counting with Pneumatic Tubes in Oregon. http://dx.doi.org/10.3141/2593-02. This Post-Print is brought to you for free and open access. It has been accepted for inclusion in Civil and Environmental Engineering Faculty Publications and Presentations by an authorized administrator of PDXScholar. Please contact us if we can make this document more accessible: [email protected].
Transcript of Accuracy of Bicycle Counting with Pneumatic Tubes in Oregon

Portland State University Portland State University
PDXScholar PDXScholar
Civil and Environmental Engineering Faculty Publications and Presentations Civil and Environmental Engineering
2016
Accuracy of Bicycle Counting with Pneumatic Tubes Accuracy of Bicycle Counting with Pneumatic Tubes
in Oregon in Oregon
Krista Nordback Portland State University, [email protected]
Sirisha Murthy Kothuri Portland State University
Taylor Phillips Portland State University
Carson Gorecki Portland State University
Miguel Figliozzi Portland State University, [email protected]
Follow this and additional works at: https://pdxscholar.library.pdx.edu/cengin_fac
Part of the Transportation Commons, Urban Studies Commons, and the Urban Studies and Planning
Commons
Let us know how access to this document benefits you.
Citation Details Citation Details Nordback, K., Kothuri, S., Phillips, T., Gorecki, C., & Figliozzi, M. (2016). Accuracy of Bicycle Counting with Pneumatic Tubes in Oregon. http://dx.doi.org/10.3141/2593-02.
This Post-Print is brought to you for free and open access. It has been accepted for inclusion in Civil and Environmental Engineering Faculty Publications and Presentations by an authorized administrator of PDXScholar. Please contact us if we can make this document more accessible: [email protected].

ACCURACY OF BICYCLE COUNTING WITH PNEUMATIC TUBES IN OREGON
Paper 16-2118
Corresponding author:
Krista Nordback
Transportation Research and Education Center (TREC)
Portland State University
PO Box 751 – TREC
Portland, Oregon 97207-0751
Tel: 503-725-2897 Email: [email protected]
Sirisha Kothuri
Department of Civil and Environmental Engineering
Portland State University
PO Box 751 CEE
Portland, Oregon 97207-0751
Tel: 503-725-4208 Email: [email protected]
Taylor Phillips
Transportation Research and Education Center (TREC)
Portland State University
PO Box 751 – TREC
Portland, Oregon 97207-0751
Tel: 503-725-8545 Email: [email protected]
Carson Gorecki
Transportation Research and Education Center (TREC)
Portland State University
PO Box 751 – TREC
Portland, Oregon 97207-0751
Tel: 503-725-8545 Email: [email protected]
Miguel Figliozzi
Professor, Department of Civil and Environmental Engineering
Portland State University
PO Box 751 CEE
Portland, Oregon 97207-0751
Tel: 503-725-2836 Email: [email protected]
Word count: 5384 words text
Tables & Figures: 8
Submission Date: November 14, 2015

2
ABSTRACT
Interest in counting bicycles and establishing non-motorized counting programs is increasing, but
jurisdictions still struggle with how to integrate bicycle counting into standard practice. In this
paper, the authors share findings and recommendations for how to minimize error for bicycle
counting, based on tests conducted in conjunction with the Oregon Department of
Transportation. This research studied three types of off-the-shelf pneumatic tube counters for
counting bicycles, including equipment from five manufacturers: two bicycle-specific counters,
three varieties of motor-vehicle classification counters, and one volume-only motor-vehicle
counter. Tests were conducted both in a controlled environment and in on-road mixed traffic in
order to better identify problems in accuracy. Equipment studied generally undercounted cyclists,
especially those in groups. Results from the controlled test with standard bicycles showed that
within 10 feet of the counter, the undercounting error ranged from 0 to -12%. In the mixed traffic
test, all of the equipment tested tended to undercount with mean percent error ranging from
-10% to -73%. Each counter type has pros and cons but, in general, counting accuracy decreased
with increases in bicycle and motor-vehicle traffic and longer tube lengths. Higher accuracy can
be achieved by a careful selection of equipment type, classification scheme, and tube
configuration. Bicycle speeds given by off-the-shelf pneumatic counting equipment were
accurate.
3
INTRODUCTION
Over the last decade, there has been increased interest in counting bicycles and establishing non-
motorized counting programs, as exemplified by inclusion of an entire chapter of the 2013
edition of the Traffic Monitoring Guide devoted to bicycle and pedestrian counting methods and
technologies (1). However, jurisdictions still struggle with how to integrate bicycle counting into
standard practice.
Would it be possible for jurisdictions to use the same pneumatic tubes that are currently
used for short-duration motor-vehicle counts to count bicycles? If so, how can this be
accomplished? In this paper, the authors address these questions and share findings and
recommendations for how to maximize accuracy while minimizing the number and types of
counters needed for bicycle counting, based on tests conducted in conjunction with the Oregon
Department of Transportation (ODOT).
While others have also addressed these questions (2, 3), this study examines more types
of pneumatic tube equipment than have previously been included in one study and compares
equipment performance in a controlled environment and in mixed traffic in order to better
identify problems in accuracy. This research studied three types of off-the-shelf pneumatic tube
counters, including equipment from five manufacturers: two bicycle-specific counters, three
varieties of motor-vehicle classification counters, and one volume-only motor-vehicle counter.
This study also examines speed estimates using pneumatic tubes and how bicycle and
automobile traffic volume affect accuracy.
.
BACKGROUND
Bicycle and pedestrian counting techniques are continuously evolving. To summarize the state of
the practice, TRB’s bicycle and pedestrian data subcommittee developed a research circular in
2014 (4).
Another recent research report, NCHRP 797, provides a broader overview of the steps
necessary to establish counting programs, reviews technologies for counting non-motorized
travel and provides case studies of jurisdictions’ experiences with collecting bicycle and
pedestrian count data (5). A number of technologies have been utilized to count bicycles for
short- and long-term purposes.
The most widely used automated technologies for counting bicycles are inductive loops,
pneumatic tubes and infrared (in combination with inductive loops or pneumatic tubes to
distinguish bicycles from pedestrians). Automated video imaging, piezoelectric strips,
magnetometers, radio beam and thermal imaging are also used. For the purposes of short-
duration bicycle counts, pneumatic tubes, infrared, and manual counts are commonly used.
Automated counters are preferred, since manual counts (collected in the field or by reducing
video in the office) require more staff time per hour of data collected. Previous research has
found that at least one week of counts is desirable to minimize error in estimating annual bicycle
traffic volumes (6-8). Of the two common portable automated count technologies (infrared and
pneumatic tubes), only tubes are able to identify and count bicycles without counting pedestrians
or equestrians. Therefore, this paper will focus on pneumatic tubes.
Pneumatic tubes are commonly used to gather short-duration motor-vehicle counts.
Recently, there has been a push to adapt this technology to count bicycles in addition to motor
vehicles. Pneumatic tube equipment consists of two main elements: pneumatic tubes laid across a
roadway or path and a data recorder. As vehicles or bicycles pass over the tubes, pulses of air travel
through the tubes to the data recorder, which detects them due to change in pressure. These tubes

4
are portable, and a widely available technology. Three types of pneumatic tubes are available
commercially:
a) Bicycle-specific Counters – These are dual tube configurations, specifically designed for
bicycle counts. They differentiate between motor vehicles and bicycles, but provide bicycle
counts only and can be used in a shared lane with mixed traffic.
b) Classification Counters – These are dual tube configurations for motor vehicle classification
counts. Some equipment in this category can classify both motor vehicles and bicycles in
mixed traffic, when adjustments are made and bicycle-specific classification schemes are
used.
c) Volume Counters – These are single tube configurations for motor-vehicle traffic volume
counts without any classification ability. These can be used to count bicycles in a dedicated
bicycle lane or path, but they cannot distinguish between bicycles and vehicles in mixed
traffic.
There is limited research regarding the performance of pneumatic tubes to count
bicycles. Boulder County, Colorado evaluated the performance of one type of classification
counter and bicycle-specific pneumatic tube counters at various sites (2). Their results revealed
that bicycle-specific counters were more reliable and accurate than classification counters when
counting bicycles; however they observed a drop in accuracy as the distance from the counter
increased (2). A Norwegian study also tested classification counters and bicycle-specific tube
counters and found high accuracy for bicycle-specific counters (over 95%), but only 70 to 75%
accuracy for the classification counter (9). A study from New Zealand also examined a bicycle-
specific tube counter and a classification counter with similar results: nearly 100% of bicycles
were counted with the bicycle-specific tubes and 85% to 90% with the classification counter
(10).
More recently, Brosnan et al. also conducted tests of two classification counters and
bicycle-specific tube counters on two different facilities in Minnesota (3). Their results revealed
lower error on the lower volume facility. In addition, undercounting was a significant issue,
primarily due to occlusion, in which two vehicles simultaneously cross the tubes such that the air
pulses from both cannot be differentiated. They found that bicycle-specific counters had higher
accuracy than general traffic counters and developed adjustment factors to adjust for the error.
NCHRP 797 also tested bicycle-specific tube counters and found that they typically
undercount, with some models outperforming others. Mean percent errors of 11% and 53%
undercounts were obtained for the two products (11).
The purpose of this study is to provide guidance for agencies, which seek to integrate
bicycle counting with their existing short-duration motor-vehicle counting programs by
examining the performance of currently available off-the-shelf pneumatic tube counters for
counting bicycles. Using the same tubes to count bicycles and motor vehicles can help in
minimizing the number of counters that an agency has to maintain in their inventory.
EQUIPMENT
The research team tested three types of off-the-shelf pneumatic tube counters: volume,
classification, and bicycle-specific counters (Table 1). For simplicity, each piece of equipment
tested is designated by a letter number combination for reference in this paper. The diameters of
the tubes themselves varied, but were generally in two categories: road tubes and mini tubes.

5
Exact dimensions are given in Table 1. Tube lengths also varied as shown in Figures 1 and 2.
Two bicycle-specific counters were studied, B1 and B2. Both are available
commercially and provided by the same manufacturer. Like the classification counters, these use
two tubes placed on the roadway; however, they provide only binned, not time-stamped, counts
(15-minute bins) and do not provide axle hit data. B1 provides bicycle counts only, whereas B2
provides bicycle and motor vehicles separately, but provides no classification for motor vehicles.
Three classification counters were tested, referred to as C1 through C3 as listed in Table
1. The vendors for each claimed that the equipment was able to classify and count bicycles and
motor vehicles in mixed traffic. Installation consists of two tubes laid across the roadway. These
classifiers record every axle that passes over the tube and use a classification scheme to classify
the axle hits into vehicle types, including bicycles. C1 and C3 provide timestamps and speed for
each vehicle classified, while C2 provides counts in 1-minute bins. C2 and C3 allow the user to
select different classification schemes.
TABLE 1 Equipment Tested Type Designation Make Model Tubes Comments
Bicycle-specific
B1 Eco-Counter Bicycle only
TUBES
0.3 in. ID
0.6 in. OD
Vendor specific
tubes
B2 Eco-Counter Bicycle/motor-
vehicle
TUBES
0.3 in. ID
0.6 in. OD
Vendor specific
tubes
Classification
C1 JAMAR
Technologies, Inc.
TRAX Cycles
Plus
0.2 in. ID
0.4 in. OD
Also estimates
speeds
C2 Time Mark
Corporation
Gamma 0.3 in. ID
0.7 in. OD
Also estimates
speeds
C3 MetroCount MC5600 0.2 in. ID
0.4 in. OD
Natural rubber tubes
Volume V1 Diamond Traffic
Products
TT-6 0.3 in. ID
0.7 in. OD
Single tube
One volume-only counter was tested, referred to in this paper as V1. It does not distinguish
between bicycles and motor vehicles. Installation consists of a single road tube laid across the
roadway. Data for each counter was downloaded and processed using vendor supplied software.
METHODS
The research team conducted two tests: a controlled environment test with only bicycle traffic and
a mixed traffic test on a state highway. Each will be discussed separately below followed by a
discussion of performance metrics.
Controlled Environment Test
The purpose of the controlled environment test was to a) understand the limitations of the
equipment in the situation most advantageous for accurate counts, b) study the ability of each
counter to correctly count bicycles in especially challenging cases and c) potentially eliminate
some counting technologies from the mixed traffic test based on their performance. This test was
also an opportunity for the ODOT crew and Portland State University (PSU) research team to gain
further understanding of the equipment setup.
The test was conducted at ODOT’s Traffic Systems Services Unit parking lot in Salem,
Oregon on Monday, February 23rd, 2015, a sunny day with high temperature around 60 degrees
Fahrenheit. Figure 1 shows the pneumatic tube setup, including their length and distance between

6
tubes. The excess tube length shown in Figure 1 is the length of tube between the anchor point
(nail) and the counting device (box). For example, for V1 tubes the distance between the anchor
point and the counting device is 3.5 feet. B2 was not tested in this first test, as it was not available
at the time of testing. Traffic video cameras mounted on poles recorded the test in order to count
bicycles for ground truth.
Prior to the test, the research team met at the test site with vendors of various equipment
to ensure that it was set up and calibrated properly. The research team also recruited volunteers
from ODOT staff and other transportation professionals to ride over the pneumatic tube.
Participants were asked to ride over the tubes first in one direction for half an hour and then in the
opposite direction for half an hour. This was repeated twice for a total of two hours of testing. Each
half hour was broken into five-minute increments, one five-minute increment for Zones 1 through
6 (Figure 1). Zone 7 was tested separately for only one ten-minute period consisting of 5 minutes
in each direction. Thus, the ability of the technologies to detect and count bicycles in both
directions and at various distances from the counting device was tested.
Prior to the commencement of tests, the clocks for the counting equipment were
synchronized, which enabled comparison with the recorded video. In addition to obtaining manual
counts from video, the research team also counted bicyclists manually by time and zone during the
test. The bicycles used during this phase of testing consisted of standard wheelbase, steel and
aluminum frame, mountain, hybrid and road bicycles ridden by eight adult volunteers.
Following the standard bikes test, special cases were investigated: tandems, bicycles with
trailers, carbon fiber bikes, cargo bicycles, and bicyclists riding one behind the other and side by
side. The purpose of this test was to understand how well the technologies are able to count special
cases of bicycles that are encountered less frequently on the roadway. For the special cases tests,
bicyclists were asked to ride in Zone 1 for the tubes at all times.

7
FIGURE 1 Layout of Pneumatic Tube Counters for Controlled Environment Test.
Mixed Traffic Test
In order to evaluate the performance of the counting equipment in a real-world scenario, the
pneumatic tube counters were tested on a state highway with relatively high bicycle volumes. To
minimize tube displacement due to turning, accelerating or decelerating vehicles, the team sought
a relatively flat and straight section of roadway in a rural setting. Other criteria for selecting a site
included proximity to Portland to minimize travel time, moderate to high bicycle traffic volume,
and a cross-section representative of ODOT highways. The highway section selected was a two-
lane section with four to five-foot shoulders on the Historic Columbia River Highway, a road used
by tourist traffic and cyclists to access a scenic portion of the Columbia River Gorge east of
Corbett, Oregon. The slight grade provided the opportunity to study one direction with higher
bicycle speeds (15-30 mph) and the other with slower bicycles (5-15 mph). The roadway width of
32.5-feet allowed researchers to test how well one counter could count cyclists on both shoulders.
It was important to study actual traffic, not traffic generated by volunteer riders, since
actual bicycle traffic may behave differently than recruited riders. To maximize the number of
8
bicycles observed during the test, a three-day holiday weekend with high bicycle volumes was
selected: Memorial Day weekend, Friday, May 22, 2015 through Monday, May 25, 2015. The
weekend contained hours of both high and low bicycle and motor-vehicle traffic, partly cloudy
skies, high temperatures between 60 and 70 degrees Fahrenheit and some rain. A total of 576
cyclists, 300 eastbound (EB) and 276 westbound (WB) were observed during daylight hours (8:00
AM to 8:00 PM) from the manually counted video during the four days (46 hours) studied. Two
hours on Sunday were lost due to camera downtime while switching data storage cards. The video
was collected using two ODOT traffic observation cameras: one mounted on a luminaire pole and
the other on a signpost. Two cameras were installed for redundancy, but only the closer camera on
the signpost functioned properly.
Since preliminary results for all the equipment tested were sufficiently accurate (less than
10% error for bicycles 10 to 15 feet of the counter), the same equipment that was used in the
controlled environment test was tested in the mixed traffic test, with the addition of B2, which was
not available previously. As shown on Figure 2, tubes were laid out on both the north and south
side of the roadway. This tested the hypothesis that counts closer to the detector would be more
accurate based on previous studies and findings from the controlled environment test. Thus, an
effort was made to repeat the tube set up on each side of the roadway. ODOT transportation
monitoring staff set up all of the tubes and the V1 and C2 data loggers. In order to test both standard
setup for motor-vehicle classification counts (16-foot spacing) and a spacing recommended by the
manufacturer for bicyclists and motor-vehicles classification (10-foot spacing), ODOT set up two
sets of C2 equipment on each side of the road with different tube spacings. The PSU research team
set up the C1, C3, B1 and B2 data loggers.
The volume count tubes, V1, were only set up on the shoulder, since they cannot
differentiate between motorists and bicyclists. They were included in order to study whether
bicyclists would avoid the tubes or motorists drive over them. To test whether cyclists avoided the
tubes, these were set up in front of the other tubes so that cyclists could avoid them, though they
could not avoid the other tubes.
In order to ensure that our “ground truth” video counts were accurate, the three researchers
who counted bicycles for the study all counted the same one hour of video from the Sunday test
during the hour from 10:00 a.m. to 11:00 a.m. While counts between researchers were slightly
different when classifying motor vehicles, all three counted 32 bicycles during the hour (100%
inter-rater reliability).

9
FIGURE 2 Layout of Pneumatic Tube Counters for Mixed Traffic Test.

10
Performance Metrics
The following metrics were used to compare accuracy: overall error, mean percent error (MPE)
and mean absolute percent error (MAPE). These are equivalent to the average percent deviation
and average absolute percent deviation metrics used in NCHRP 797. To compute these metrics,
the counts from the automated equipment were compared to ground truth counts. The ground truth
for the controlled environment and special cases tests was the count collected by manual counters
in the field, which was later verified by video counts. The ground truth for the mixed traffic test
was manually counted video.
Overall error is computed for the entire study period: two hours for the controlled
environment standard bicycle test, 20 minutes for each category in the special cases test, and 46
hours for the mixed traffic test. Overall error was calculated as the difference between the ground
truth and counting equipment count divided by the total ground truth count for the study period as
explained in Equation 1.
Overall Error = 𝑐−𝑚
𝑚 (1)
where
m = ground truth count for study period
c = tube count for study period
While overall error gives a big picture view, it does not reveal the likelihood of a false negative
(cyclist is present but not counted) or a false positive (a cyclist is counted, when not present). If
each counter provided time stamps for every event, these false positives and false negatives could
be counted. Unfortunately, since some of the equipment binned their data in 1-minute (C2) and
15-minute (B1 and B2) bins, it was not possible to compute the true number of false positives and
negatives across all equipment types. However, by binning the data, it is possible to compute the
error per bin or count interval and observe over and undercounts per count interval. The count
intervals varied by equipment for the controlled environment and special cases test, ranging from
five minutes to 15 minutes. The count interval for the mixed traffic test was one hour for all
equipment types. In intervals with no bicycles and no counts, interval error was assigned a zero value.
𝑒𝑖 =𝑐𝑖−𝑚𝑖
𝑚𝑖 (2)
ei = interval error = error for the count interval i
mi = ground truth count for count interval i
ci = tube count for count interval i
MPE was calculated by averaging the errors for each count interval for the entire study period.
𝑀𝑃𝐸 =1
ℎ∑ 𝑒𝑖ℎ𝑖=1 (3)
where
h = the total number of count intervals counted in the study period
Similarly, the MAPE was calculated by averaging the absolute value of the errors for each count
interval for the entire study period.
𝑀𝐴𝑃𝐸 =1
ℎ∑ |𝑒𝑖|ℎ𝑖=1 (4)

11
FINDINGS
Controlled Environment Test
Table 2 shows the errors across zones for all tube counters that were tested, with undercounting
observed for all equipment. In Zones 1-3, most of the tube counters were fairly accurate. As the
distance from the counter increased, all three classification counters showed higher errors. Of all
counters tested, for standard bicycles, B1 was the most accurate with MPE of -0.6%, indicating a
slight undercount. The number of cyclists for each zone (n) was the same for all the equipment
types, but varied by zone and averaged 85 cyclists per zone.
Cyclist speeds for this test were relatively slow, averaging eight miles per hour based on
speeds reported by C1. This was due to sharp turns adjacent to the tube layout. Speeds were
especially slow for Zones 4 through 7, which averaged only seven miles per hour.
TABLE 2 Error for Controlled Environment Test by Distance from Counter (Zone) for
Standard Bicycles Only
Type Percent Overall Error by Zone (%) MPE
(%)
MAPE
(%)
Zone 1 2 3 4 5 6 7
n 69 85 92 95 93 90 73
B1* 0.0 -1.06 N/A -0.6 1.7
C1 1.5 0.0 0.0 -10.5 -38.0 -49.5 -26.0 -15.7 16.7
C2 -7.3 0.0 -5.3 -6.3 -25.0 -53.9 -82.2 -16.2 16.6
C3 -7.3 -1.2 -18.1 -26.3 -63.0 -64.8 -98.6 -30.8 30.8
V1 -11.6 6.0 3.2 N/A N/A N/A N/A -7.6 9.9 * B1 counters provided data in 15 minute bins, so error is reported for groups: 1 to 3 and 4 to 6.
Note: N/A indicates that the tubes were not long enough to reach these zones.
The results indicate that all of the equipment studied are viable technologies for counting
bicycles within 0-10 ft. from the tube counter, approximately up to the width of one general
traffic lane. Also, one particular counter is a viable technology to count in the range of 0-30 ft. –
approximately up to two general traffic lanes. These results agree with findings from a prior
research study, where researchers also reported drop in accuracy beyond 27 ft. for both bicycle-
specific and general-purpose tube counters (2).
Table 3 shows the accuracy of the pneumatic tube counters during the special cases test.
In the tandems and bikes with trailer category, both V1 and C2 counters showed the lowest error,
with V1 overcounting by 4% and C2 undercounting by 4%. In the carbon fiber, cargo bicycle
category, B1 was most accurate with undercounting errors of 4%. Both C1 and B1 were fairly
accurate when counting bicycles riding one behind the other. All the tube counters showed high
errors when counting bicycles riding side by side, indicating the limitation of pneumatic tube
counting technology.

12
TABLE 3 Error of Pneumatic Tube Counters with Special Cases
Tube Counter Tandem, Bike
with Trailer
Carbon Fiber,
Cargo Bicycle
Standard
Bicycles: One
Behind the Other
Standard
Bicycles: Side by
Side
n Overall
Error (%)
n Overall
Error
(%)
n Overall
Error
(%)
n Overall
Error
(%)
B1 24 -75 24 -4 68 -74 70 -59
C1 46 -50 54 -50 116 -2 118 -46
C2 46 -4 54 -6 116 -65 118 -38
C3 46 -96 54 -56 116 -95 118 -57
V1 46 4 54 -9 116 -4 118 -36
Mixed Traffic Test
Error attributed to each counter varied substantially during the mixed traffic test as shown in Table
4. Undercounting was encountered with all tested counters, and error for all counting equipment
was high (≥10% undercount MPE). The bicycle-specific counters had relatively low error (20% to
23% undercount MPE). The classification counters varied widely with the error of least accurate
equipment (C2 with 44% to 73% undercount MPE) twice as high as the most accurate counters,
C1 and C3 with BOCO classification scheme (10% to 28% undercount MPE). The volume-only
counter performed unexpectedly well with only 20% undercount MPE.
TABLE 4 Summary of Error for Mixed Traffic Tube Test
Counter Name n Bicycles
Counted
Overall
Error
(%)
MPE
(%)
MAPE
(%)
Total
Hourly
Over-
counts
B1, north side, (total) 576 361 -37 -23 26 2
B1, south side, (total) 576 378 -34 -20 23 3
B2, south side (half road) 300 183 -39 -20 26 2
C1, north side, (total) 576 409 -29 -18 22 9
C1, south side, (total) 576 400 -31 -13 31 15
C1, south side (half road) 300 185 -38 -23 24 1
C2, north side, 10ft, (total) 576 170 -70 -50 55 3
C2, north side, 16ft, (total) 576 200 -65 -44 50 12
C2, south side, 10ft, (total) 576 142 -75 -60 60 1
C2, south side, 16ft, (total) 576 79 -86 -73 73 3
C3, north side, (total) ARXCycle 576 236 -59 -43 43 0
C3, south side, (total) ARXCycle 576 288 -50 -32 32 0
C3, north side, (total) BOCO 576 380 -34 -28 29 1
C3, south side, (total) BOCO 576 495 -14 -10 10 1
V1, north & south sides, (total) 576 425 -26 -20 27 20

13
For C1, the manufacturer now provides bicycle-specific software, which can improve accuracy
but was not available at the time of this test. For C3, Boulder County’s improved classification
scheme, BOCO (2) (not supplied with the manufacturer’s software) greatly improves the accuracy
of the C3 compared the manufacturer supplied scheme, ARXCycle.
Another metric of interest is the number of overcounts in a given hour bin. These
overcounts for each technology are shown in the last column of Table 4. These “phantom cyclists”
are especially obvious for hours in which no cyclists were observed in the video. Such overcounts
are especially concerning if they are caused by misclassified motor vehicles, as this can cause the
counters to report biased data with incorrect traffic patterns for bicycles. Such errors can be
especially problematic for roads with low bicycle counts, a condition prevalent on state highways
in the U.S. While B1 and C3 show relatively few overcounts, C1, C2, and V1 show more.
The research team also compared bicycle speeds recorded by various counters with
measured speeds obtained by observing when each bicyclist passed a set of points during the mixed
traffic test. The two points are shown in Figure 2. This comparison of average speeds for the study
period shows that on average for each hour, the speed estimates for C1 and C3 agreed both with
each other and with the manually computed speed. The bicycle speed for both directions combined
averaged 17 to 19 miles per hour (mph) with an average of 12 to 13 mph in the eastbound (uphill)
direction and an average of 20 to 22 mph in the westbound (downhill) direction.
As found in the controlled environment study, error was found to be significantly higher
for bicyclists farther from the equipment. The error for cyclists on the opposite side of the road
from the equipment was on average about one and a half times higher than the error for cyclists
riding on the side nearest the equipment.
The excess tube length between the anchor and the data logger (Figure 2) increased the
effective distance between the bicyclists and the equipment. The C2 tubes had the longest excess
tube length (25 feet or more) and the highest error. While it may have been beneficial to test the
counters with shorter and similar tube lengths, the tubes for C2 and V1 were on loan from ODOT,
which uses them as part of their vehicle count program and therefore the length could not be
altered.
A related question is whether shorter tubes that only covered one vehicle lane and the
shoulder (half road) would yield more accurate results than longer tubes that covered the entire
road. However, the error for the two half road cases (B2 and C1 half road) does not show
substantially lower error than comparable equipment (B1 and C1).
Error also varied by direction as shown in Figure 3, which shows generally higher error
for eastbound (EB) than for westbound (WB) equipment. Perhaps this is due to higher error for
lower speed bicycles, since bicycle speeds were higher in the westbound (downhill) direction.
However, analysis of error with speed did not show a clear relationship between bicyclist speed
and accuracy.
The spacing between tubes may also play a role in accuracy. The classification counters
with the highest error (C2) also had the widest separation between tubes, but there does not appear
to be a big difference between the 10-foot and 16-foot spacings for C2.
Does tube diameter impact error? This study did not identify a clear link between error
and tube diameter. The large diameter tubes used with the C2 equipment did yield high errors, but
the same tubes were used with the V1 equipment and did not result in high error.

14
FIGURE 3 Error for Pneumatic Tube Counters in Mixed Traffic Test.
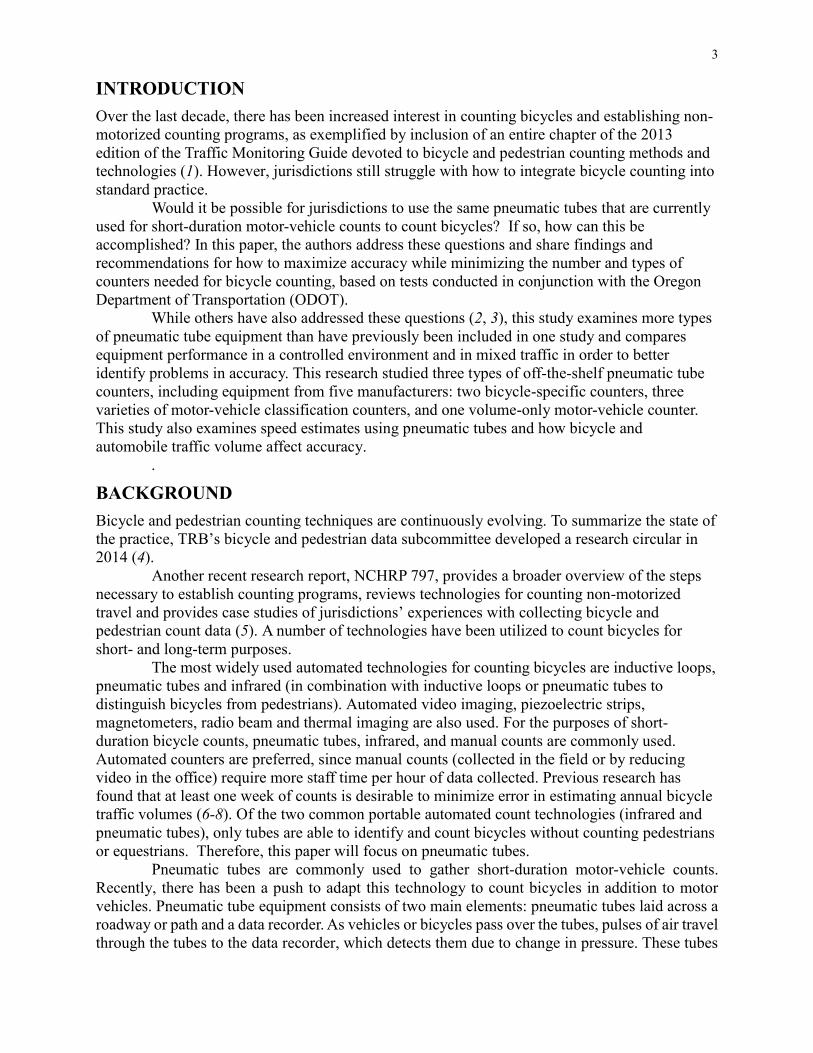
What is causing the error? Figure 4 examines error per count interval with bicycle and
motor-vehicle traffic volumes. Based on this figure, error appears to increase with increasing
bicycle traffic volumes and to a lesser extent with increasing motor-vehicle volumes. These results
are intuitive since passing vehicles cause occlusion, obscuring the pulse of air from the bicycle
that should be counted. Bicycles traveling in groups are similarly difficult to count as shown in the
earlier results from the controlled environment special cases tests (bicyclists riding side by side
and one behind the other). Some of the equipment tested is better than others at separating out
these cases.
Another cause of error is the classification scheme used for the classification counters.
For example, when the BOCO scheme was used on the same data for C3, it increased the accuracy
of the bicycle counts.
-80%
-70%
-60%
-50%
-40%
-30%
-20%
-10%
0%
10%
B1,NorthSide
B1,SouthSide
B2,SouthSide(halfroad)
C1,NorthSide
C1,SouthSide
C1,SouthSide(halfroad)
C2,NorthSide
(10ft)
C2,NorthSide
(16ft)
C2,SouthSide
(10ft)
C2,SouthSide
(16ft)
C3,NorthSide
C3,SouthSide
C3,NorthSide
BOCO
C3,SouthSide
BOCO
V1,Southand
NorthSides
Mea
n P
erce
nt
Erro
r (
MP
E)
WB EB

15
FIGURE 4 Absolute Interval Error with Traffic Volume in Mixed Traffic.
R² = 0.4325
0%
20%
40%
60%
80%
100%
120%
0 10 20 30 40 50
Ab
solu
te In
teva
l Err
or
(ho
url
y)
Ground Truth Bike Volume
Hourly Absolute Interval Error by Ground Truth Bike Volume and Counter Type
Volume Only
Classification
Bicycle Specific
Combined Trend
R² = 0.2347
0%
20%
40%
60%
80%
100%
120%
0 100 200 300 400 500 600 700
Ab
solu
te In
terv
al E
rro
r (h
ou
rly)
Ground Truth Vehicle Volume
Hourly Absolute Interval Error by Ground Truth Vehicle Volume and Counter Type
Volume Only
Classification
Bicycle Specific
Combined Trend

16
CONCLUSIONS & RECOMMENDATIONS
Using the same pneumatic tubes for counting motor vehicles and bicycles is desirable, but
challenging. Weaker air pulses from bicycles can be harder to detect and occlusion can prevent
bicycles from being counted. Some bicycles have longer than normal wheelbases or additional
wheels, and cyclists like to ride side-by-side or in platoons. Despite these obstacles, jurisdictions
would like to be able to count bicycles using the equipment they already have in their inventory –
an array of motor-vehicle counting equipment.
This study reviews three types of pneumatic tube counting equipment: bicycle-specific,
classification, and volume-only counters. The first two are able to distinguish between bicycles
and motor vehicles. The second two are commonly available to those who monitor motor-vehicle
traffic. Bicycle-specific counters have been found to be accurate in mixed traffic, but do not
provide speed or classify motor vehicles. Classification counters offer the opportunity to count
bicycles, classify motor vehicles, and provide speed data, but accuracies vary widely. Volume
counters should only be used in places where motor vehicles are rare, such as paths or some road
shoulders.
Findings from the controlled environment test with no mixed traffic revealed that all of
the equipment tested were capable of counting standard bicycles with less than 10% error within
10 to 15 feet of the count equipment, when no other vehicles are present and only one bicyclist
rides over the tubes. The results from the special cases test showed that bicycles riding side-by-
side, one-behind-the-other, bicycles with trailers, and long wheelbase bicycles are particularly
difficult to count using pneumatic tubes.
Findings from the mixed traffic test are listed below.
Error for all of the equipment tested was high. All equipment in the two-lane highway
condition tested undercounted bicyclists, with MPE ranging from -10% (C3) to -73%
(C2).
Generally, higher bicycle and motor-vehicle traffic lead to higher undercounts, likely due
to occlusion, especially for classification counters.
Greater error was observed farther from the counting equipment.
Accuracy can be improved through bicycle-specific changes to classification schemes.
Bicyclist speed estimates from classification counters, C1 and C3, are consistent with
each other and with observed speeds from video.
A clear relationship between error and bicyclist speed was not observed.
Some counters were more likely to count false positives (C1, C2 and V1), which can lead
to an incorrect understanding of bicycle travel patterns.
False positives, counting motor vehicles as bicycles, should be carefully watched in future
studies. Low bicycle traffic on highways mean that even low numbers of vehicles incorrectly
identified as bicycles could lead to substantial error and mislead those studying bicycle travel
patterns.
When standard motor-vehicle counting equipment is used to count bicycles error can be
high but not for all devices. Bicycle-specific counters and some classification counters have lower
error. Unexpectedly, in this test, simply using single-tube volume counters in the shoulder had
similar error to the bicycle-specific and the two best classification counters. However, this
approach should only be used where bicycles travel predictably in the shoulder, motor vehicles

17
avoid the shoulder and where bicycle volumes are similar or greater than those observed in this
study.
This research contributes to the academic literature on bicycle counting using pneumatic
tubes in three ways: 1) it verifies that bicycle speeds given by off-the shelf pneumatic counting
equipment are accurate, 2) it shows that in the tested situation, volume-only tubes placed in the
shoulder were as accurate as classification counters placed over the entire road, and 3) it reports
error in bicycle counting for three types of off-the-shelf pneumatic tube counters and from five
manufacturers – more than any previous study.
Regardless of what equipment is used, verification testing should be conducted and care
should be taken when setting up the equipment and processing the data. Bicycle counting using
pneumatic tubes is a more challenging task than counting motor vehicles and should be approached
with attention to detail.

18
ACKNOWLEDGEMENTS
The authors gratefully acknowledge funding support for this study from ODOT. The authors would
also like to thank Bill Link, Fraser Groves, Gary Obery, Sheila Lyons, Lyn Cornell, Amanda
Owens, Roger Boettcher, Amanda Owings, and Bruce Moody for their participation during the
controlled environment testing. Thanks are also due to Don Crownover, Dara Gayler, Will Adams,
Phillip Armand, and Rick Hindle and all the vendors for their assistance with equipment set up.
REFERENCES
Federal Highway Administration. Traffic Monitoring Guide. Publication FHWA PL-13-
015. U.S. Department of Transportation, Washington, D.C., April 2013.
2. Hyde-Wright, A., B. Graham, and K. Nordback. Counting Bicyclists with Pneumatic
Tube Counters on Shared Roadways. ITE Journal, February 2014, pp.32-37.
Brosnan, M., M. Petesch, J. Pieper, S.Schumacher, G. Lindsey. Validation of Bicycle Counts from Pneumatic Tube Counters in Mixed Traffic Flows. Proceedings of the 94th
Annual Meeting of the Transportation Research Board, Transportation Research Board
of the National Academies, Washington, D.C., 2015.
Griffin, G., K. Nordback, T. Gotschi, E. Stolz, and S. Kothuri. Monitoring Bicyclist and Pedestrian Travel and Behavior. Transportation Research Circular E-C183,
Transportation Research Board of the National Academies, Washington D.C., March
2014.
5. Ryus, P., E. Ferguson, K. Laustsen, R. Schenider, F. Proulx, T. Hull, and L. Miranda-
Moreno. Guidebook on Pedestrian and Bicycle Volume Data Collection. National
Cooperative Highway Research Program Report 797, Transportation Research Board of
the National Academies, Washington D.C., 2014.
6. Nordback, K., W. Marshall, B. Janson, and Elizabeth Stolz. "Estimating Annual Average
Daily Bicyclists: Error and Accuracy." Transportation Research Record, Transportation
Research Board of the National Academies, Washington, D.C., 2013.
7. Nosal, Thomas, Luis Miranda-Moreno, and Zlatko Krstulic. "Incorporating Weather:
Comparative Analysis of Annual Average Daily Bicyclist Traffic Estimation Methods."
Transportation Research Record: Journal of the Transportation Research Board 2468,
Transportation Research Board of the National Academies, Washington, D.C., 2014.
8. Hankey, S., G. Lindsey, and Julian Marshall. "Day-of-Year Scaling Factors and Design
Considerations for Nonmotorized Traffic Monitoring Programs." Transportation
Research Record: Journal of the Transportation Research Board 2468, Transportation
Research Board of the National Academies, Washington, D.C., 2014.
Hjelkrem, O. A., and T. Giæver. A Comparative Study of Bicycle Detection Methods and Equipment. Presented at the 16th ITS World Congress and Exhibition on Intelligent
Transport Systems and Services, Stockholm, Sweden, 2009.
ViaStrada Ltd. Continuous Cycle Counting Trial. New Zealand Transport Agency,
Auckland, New Zealand, January 2009. Accessed at
http://www.nzta.govt.nz/assets/resources/continuous-cycle-counting-
trial/docs/continuous-cycle-counting-trial.pdf
Ryus, P., F. R. Proulx, R. J. Schneider, T. Hull, and L. Miranda-Moreno. Methods and
Technologies for Pedestrian and Bicycle Volume Data Collection. Washington, DC:
National Cooperative Highway Research Program, 2015.