Accuracy Improvement of 3D Models Generated by … · manual surveying, it has low cost, high...
10
Internet Journal of Society for Social Management Systems Vol. 11 Issue 1 sms17-4917 ISSN: 2432-552X ORIGINAL ARTICLE Received: 2017.08.08 / Accepted: 2017. 11.29 Copyright © 2017 Society for Social Management Systems. Internet Journal of Society for Social Management Systems Published Date: 2017.12.20 All Rights Reserved. 26 Accuracy Improvement of 3D Models Generated by Structure from Motion (SfM) Using Joint Histogram of Oriented Gradients (Joint-HOG) Reika Yamaguchi 1* , Nobuyoshi Yabuki 1 , Tomohiro Fukuda 1 1 Division of Sustainable Energy and Environmental Engineering, Osaka University 2-1 Yamadaoka, Suita, Osaka, 565-0871, JAPAN * E-mail: [email protected] Abstract: This study investigates the potential of 3D modeling of construction sites with high precision. Structure from Motion (SfM) combined with Unmanned Aerial Vehicle (UAV) provides a novel platform for photogrammetry. In construction industry, research and development have been promoted for practical use in automatically quantity calculation and obtaining its as-is forms. Nothing in the shooting area of any construction sites must not move during the UAV aerial shooting. Because moving construction machinery cause serious errors in 3D modeling. Hence, it is necessary to stop all works while UAV aerial shooting. As it can take a few hours for UAV aerial shooting, it is difficult to shoot frequently at construction sites. Therefore, by eliminating construction machinery which are error factors of 3D modeling automatically from all photographs taken in advance in UAV aerial photography, it is possible to realize highly accurate 3D modeling even under work conditions. Construction machinery can be detected by Histgrams of Oriented Gradients (HOG) features. HOG features calculate the intensity of the gradient for each gradient direction in the region, expressed as a histogram. It is possible to extract the boundary line of change in luminance in the image. However, using single HOG features ends up to have low detection accuracy. In this paper, the authors deployed Joint-HOG features combined with multiple HOG features by Real AdaBoosting which was constructed in two stages in order to detect construction machinery. Then, a 3D model of the construction site is created by SfM, after generating mask image of objects that showed be eliminated, detecting construction machinery. Keywords: Histograms of Oriented Gradients, Joint Features, Structure from Motion, Unmanned Aerial Vehicle, Construction Site Modeling, Photogrammetry 1. Introduction In recent years, Structure from Motion (SfM) combined with Unmanned Aerial Vehicle (UAV) provides a novel platform for photogrammetry. 3D modeling combining SfM and UAV is used for grasping the damage situation of buildings in the afflicted earthquake area 1) and for measuring tree height of forest trees 2) . In construction industry,
Transcript of Accuracy Improvement of 3D Models Generated by … · manual surveying, it has low cost, high...

Internet Journal of Society for Social Management Systems Vol. 11 Issue 1 sms17-4917
ISSN: 2432-552X
ORIGINAL ARTICLE
Received: 2017.08.08 / Accepted: 2017. 11.29 Copyright © 2017 Society for Social Management Systems.
Internet Journal of Society for Social Management Systems Published Date: 2017.12.20 All Rights Reserved. 26
Accuracy Improvement of 3D Models Generated
by Structure from Motion (SfM)
Using Joint Histogram of Oriented Gradients (Joint-HOG)
Reika Yamaguchi1*, Nobuyoshi Yabuki1, Tomohiro Fukuda1
1 Division of Sustainable Energy and Environmental Engineering, Osaka University
2-1 Yamadaoka, Suita, Osaka, 565-0871, JAPAN
*E-mail: [email protected]
Abstract: This study investigates the potential of 3D modeling of construction sites with high precision.
Structure from Motion (SfM) combined with Unmanned Aerial Vehicle (UAV) provides a novel platform for
photogrammetry. In construction industry, research and development have been promoted for practical use in
automatically quantity calculation and obtaining its as-is forms. Nothing in the shooting area of any
construction sites must not move during the UAV aerial shooting. Because moving construction machinery
cause serious errors in 3D modeling. Hence, it is necessary to stop all works while UAV aerial shooting. As it
can take a few hours for UAV aerial shooting, it is difficult to shoot frequently at construction sites. Therefore,
by eliminating construction machinery which are error factors of 3D modeling automatically from all
photographs taken in advance in UAV aerial photography, it is possible to realize highly accurate 3D modeling
even under work conditions. Construction machinery can be detected by Histgrams of Oriented Gradients
(HOG) features. HOG features calculate the intensity of the gradient for each gradient direction in the region,
expressed as a histogram. It is possible to extract the boundary line of change in luminance in the image.
However, using single HOG features ends up to have low detection accuracy. In this paper, the authors
deployed Joint-HOG features combined with multiple HOG features by Real AdaBoosting which was
constructed in two stages in order to detect construction machinery. Then, a 3D model of the construction site
is created by SfM, after generating mask image of objects that showed be eliminated, detecting construction
machinery.
Keywords: Histograms of Oriented Gradients, Joint Features, Structure from Motion, Unmanned Aerial
Vehicle, Construction Site Modeling, Photogrammetry
1. Introduction
In recent years, Structure from Motion (SfM)
combined with Unmanned Aerial Vehicle (UAV)
provides a novel platform for photogrammetry. 3D
modeling combining SfM and UAV is used for
grasping the damage situation of buildings in the
afflicted earthquake area1) and for measuring tree
height of forest trees2). In construction industry,
Internet Journal of Society for Social Management Systems Vol. 11 Issue 1 sms17-4917
ISSN: 2432-552X
27
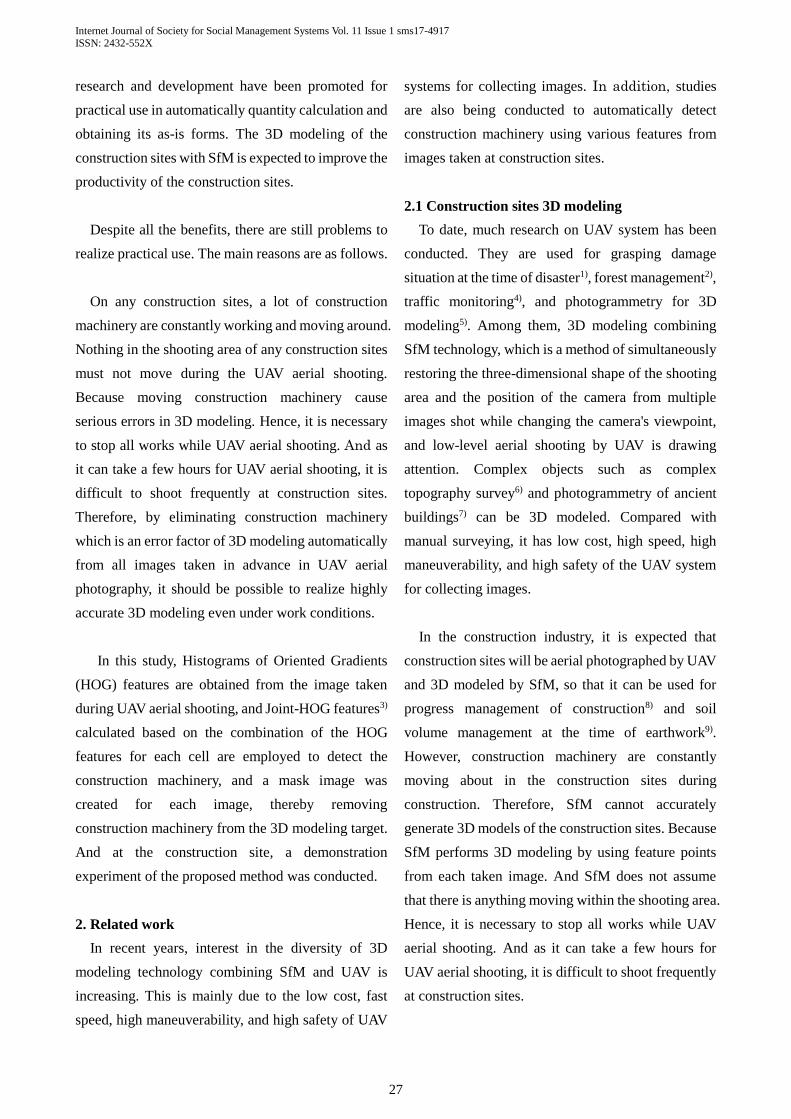
research and development have been promoted for
practical use in automatically quantity calculation and
obtaining its as-is forms. The 3D modeling of the
construction sites with SfM is expected to improve the
productivity of the construction sites.
Despite all the benefits, there are still problems to
realize practical use. The main reasons are as follows.
On any construction sites, a lot of construction
machinery are constantly working and moving around.
Nothing in the shooting area of any construction sites
must not move during the UAV aerial shooting.
Because moving construction machinery cause
serious errors in 3D modeling. Hence, it is necessary
to stop all works while UAV aerial shooting. And as
it can take a few hours for UAV aerial shooting, it is
difficult to shoot frequently at construction sites.
Therefore, by eliminating construction machinery
which is an error factor of 3D modeling automatically
from all images taken in advance in UAV aerial
photography, it should be possible to realize highly
accurate 3D modeling even under work conditions.
In this study, Histograms of Oriented Gradients
(HOG) features are obtained from the image taken
during UAV aerial shooting, and Joint-HOG features3)
calculated based on the combination of the HOG
features for each cell are employed to detect the
construction machinery, and a mask image was
created for each image, thereby removing
construction machinery from the 3D modeling target.
And at the construction site, a demonstration
experiment of the proposed method was conducted.
2. Related work
In recent years, interest in the diversity of 3D
modeling technology combining SfM and UAV is
increasing. This is mainly due to the low cost, fast
speed, high maneuverability, and high safety of UAV
systems for collecting images. In addition, studies
are also being conducted to automatically detect
construction machinery using various features from
images taken at construction sites.
2.1 Construction sites 3D modeling
To date, much research on UAV system has been
conducted. They are used for grasping damage
situation at the time of disaster1), forest management2),
traffic monitoring4), and photogrammetry for 3D
modeling5). Among them, 3D modeling combining
SfM technology, which is a method of simultaneously
restoring the three-dimensional shape of the shooting
area and the position of the camera from multiple
images shot while changing the camera's viewpoint,
and low-level aerial shooting by UAV is drawing
attention. Complex objects such as complex
topography survey6) and photogrammetry of ancient
buildings7) can be 3D modeled. Compared with
manual surveying, it has low cost, high speed, high
maneuverability, and high safety of the UAV system
for collecting images.
In the construction industry, it is expected that
construction sites will be aerial photographed by UAV
and 3D modeled by SfM, so that it can be used for
progress management of construction8) and soil
volume management at the time of earthwork9).
However, construction machinery are constantly
moving about in the construction sites during
construction. Therefore, SfM cannot accurately
generate 3D models of the construction sites. Because
SfM performs 3D modeling by using feature points
from each taken image. And SfM does not assume
that there is anything moving within the shooting area.
Hence, it is necessary to stop all works while UAV
aerial shooting. And as it can take a few hours for
UAV aerial shooting, it is difficult to shoot frequently
at construction sites.

Internet Journal of Society for Social Management Systems Vol. 11 Issue 1 sms17-4917
ISSN: 2432-552X
28
Thus, in this research, construction machinery are
detected in advance from all images taken by UAV
and removed from 3D modeling targets. After that,
3D modeling by SfM is performed, and improvement
of accuracy of 3D modeling is aimed even under
construction work situation.
2.2 Features used for construction machinery
detection
In the computer vision community, many
researches on object detection and human detection
are done. In the construction field, the researchers
focus on developing techniques for automated 2D
detection of construction workers, equipment and
machinery10) 11). Based on these results, improvement
of productivity is expected by performing automatic
tracking and evaluating construction performance.
As to the detection method, it can be divided into
two methods, detection method using a background
difference in time unit from movie11) and detection
method using features in each image or each frame of
the movie10). In the method using the background
subtraction, it is impossible to detect an object in the
idling state, and it is impossible to detect from a still
image.
For object detection methods using features in
images, HOG features10) 12), Haar-like features13),
EOH features14) and Edgelets features15) have been
proposed as classifiers. Detectable objects are
different for each features. The construction
machinery under working changes its shape, such as
changing the direction or moving the arm. HOG
features have a longer calculation time compared with
others and have low detection accuracy, but it can be
detected even if there is some shape change in the
detection object. Construction machinery detection
method using HOG features have been proposed.
Also, in order to improve the detection accuracy,
method for improving HOG features have also been
proposed3) 10).
In this study, Joint-HOG features3) generated by
patterning a plurality of HOG features with thresholds
and performing Real AdaBoost in two stages were
used for construction machinery detection.
3. Overview of the proposed method
In this research, our goal is as follows. Construction
machinery are detected in advance from all images
taken by UAV and removed from 3D modeling targets.
After that, 3D modeling by SfM is performed, and
improvement of accuracy of 3D modeling is aimed
even under construction work situation.
The algorithm flow of the system developed in this
study is shown in Fig. 1. Of this system, detection of
construction machinery using the Joint-HOG features
and generation of a mask images were performed by
Visual Studio 2015. Creation of mask images were
made using OpenCV 3.0 which is a computer vision
library. And to create the 3D model, PhotoScan
professional of Agisoft Corporation was used.
Fig. 1. Algorithm flow of developed system.
3.1 Resource detection3) 10)
The shape and appearance of construction
Internet Journal of Society for Social Management Systems Vol. 11 Issue 1 sms17-4917
ISSN: 2432-552X
29
machinery can be characterized by distribution of
local intensity gradients. These properties can be
captured via HOG features10) 12) 16). However, using
single HOG features ends up to have low detection
accuracy. In this study, Joint-HOG features3)
generated by patterning a plurality of HOG features
with thresholds and performing Real AdaBoost in two
stages were used for construction machinery detection.
3.1.1 Histograms of Oriented Gradients (HOG)
features
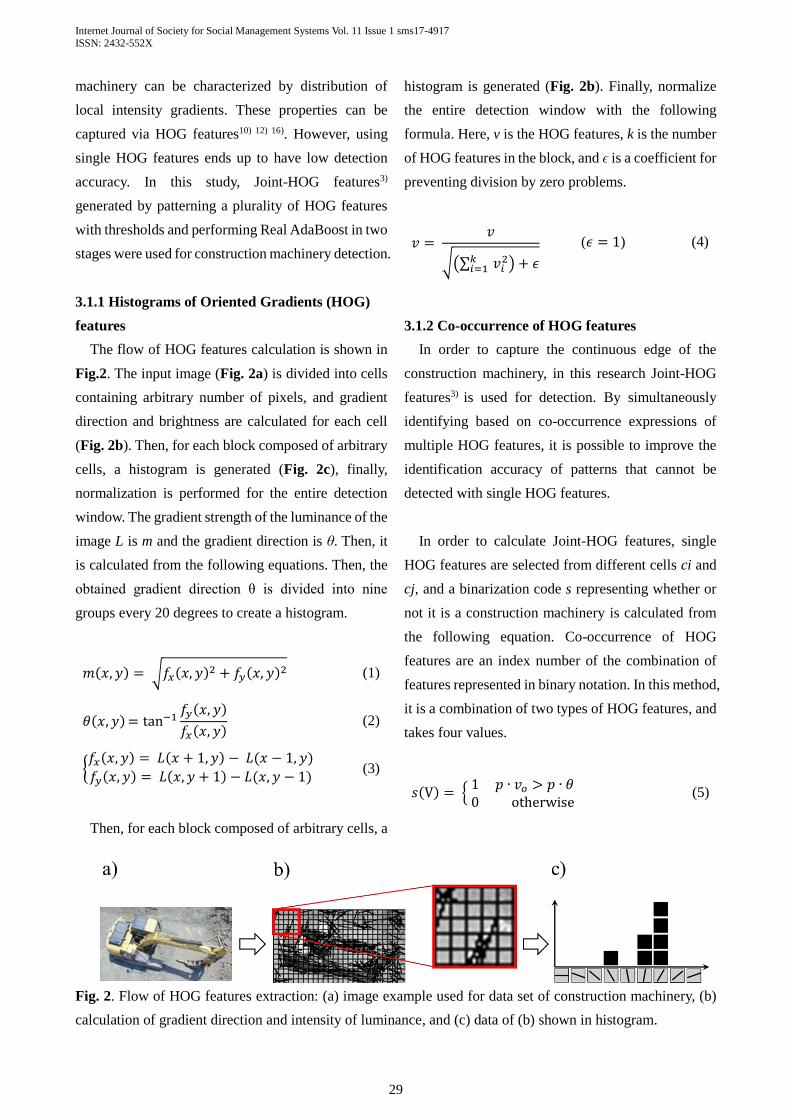
The flow of HOG features calculation is shown in
Fig.2. The input image (Fig. 2a) is divided into cells
containing arbitrary number of pixels, and gradient
direction and brightness are calculated for each cell
(Fig. 2b). Then, for each block composed of arbitrary
cells, a histogram is generated (Fig. 2c), finally,
normalization is performed for the entire detection
window. The gradient strength of the luminance of the
image L is m and the gradient direction is θ. Then, it
is calculated from the following equations. Then, the
obtained gradient direction θ is divided into nine
groups every 20 degrees to create a histogram.
𝑚(𝑥, 𝑦) = √𝑓𝑥(𝑥, 𝑦)2 + 𝑓𝑦(𝑥, 𝑦)2 (1)
𝜃(𝑥, 𝑦) = tan−1𝑓𝑦(𝑥, 𝑦)
𝑓𝑥(𝑥, 𝑦) (2)
{𝑓𝑥(𝑥, 𝑦) = 𝐿(𝑥 + 1, 𝑦) − 𝐿(𝑥 − 1, 𝑦)
𝑓𝑦(𝑥, 𝑦) = 𝐿(𝑥, 𝑦 + 1) − 𝐿(𝑥, 𝑦 − 1) (3)
Then, for each block composed of arbitrary cells, a
histogram is generated (Fig. 2b). Finally, normalize
the entire detection window with the following
formula. Here, v is the HOG features, k is the number
of HOG features in the block, and ϵ is a coefficient for
preventing division by zero problems.
𝑣 = 𝑣
√(∑ 𝑣𝑖2𝑘
𝑖=1 ) + 𝜖
(𝜖 = 1) (4)
3.1.2 Co-occurrence of HOG features
In order to capture the continuous edge of the
construction machinery, in this research Joint-HOG
features3) is used for detection. By simultaneously
identifying based on co-occurrence expressions of
multiple HOG features, it is possible to improve the
identification accuracy of patterns that cannot be
detected with single HOG features.
In order to calculate Joint-HOG features, single
HOG features are selected from different cells ci and
cj, and a binarization code s representing whether or
not it is a construction machinery is calculated from
the following equation. Co-occurrence of HOG
features are an index number of the combination of
features represented in binary notation. In this method,
it is a combination of two types of HOG features, and
takes four values.
𝑠(V) = { 1 𝑝 ∙ 𝑣𝑜 > 𝑝 ∙ 𝜃0 otherwise
(5)
Fig. 2. Flow of HOG features extraction: (a) image example used for data set of construction machinery, (b)
calculation of gradient direction and intensity of luminance, and (c) data of (b) shown in histogram.

Internet Journal of Society for Social Management Systems Vol. 11 Issue 1 sms17-4917
ISSN: 2432-552X
30
3.1.3 Joint-HOG features
The co-occurrence expression of HOG features
obtained in the previous section is used in the first
stage Real Adaboost to generate the Joint-HOG
features. First, an object suitable for Real AdaBoost is
selected from the calculated Co-occurrence of HOG
features. The weak classifier ht (x) of Real AdaBoost
at the first stage is shown by the following equation.
Here, yi ∈ {+1, -1} indicates the label of the correct
answer, and the set of N labeled training samples is (x
1, y 1), ..., (x N, y N). Also, t is the number of training
rounds, and ϵ is a coefficient for preventing division
by zero problems.
ℎ𝑡(x) = 1
2ln
𝑃𝑡(𝑦 = +1|𝑗) + 𝜖
𝑃𝑡(𝑦 = −1|𝑗) + 𝜖 (6)
Pt (y = + 1 | j) and Pt (y = + 1 | j) are conditional
probabilities when observing the co-occurrence
expression j of HOG features. The weights are
initialized by D1(i)=1/N. The above process is
performed for all cell combinations.
𝑃𝑡(𝑦 = +1|𝑗) = ∑ 𝐷𝑡(𝑖)
𝑖:𝐽𝑡(𝑥𝑖)=𝑗∧𝑦𝑖=+1
(7)
𝑃𝑡(𝑦 = −1|𝑗) = ∑ 𝐷𝑡(𝑖)
𝑖:𝐽𝑡(𝑥𝑖)=𝑗∧𝑦𝑖=−1
(8)
𝐷𝑡+1(𝑖) = 𝐷𝑡(𝑖)exp[−𝑦𝑖ℎ𝑡(𝑥𝑖)] (9)
Next, using the conditional probability distribution,
we obtain the evaluation value z1 representing the
separation of the distribution by the following
equation. Here, the distribution of the positive class
and the negative class are far apart as the value of z1
is smaller. The minimum value of z1 is used to select
weak classifiers in each round.
𝑧1 = 2 ∑ √𝑃𝑡(𝑦 = +1|𝑗)𝑃𝑡(𝑦 = −1|𝑗)
𝑗
(10)
Then, for all combinations of cells, a pool of Joint-
HOG features, which is a strong classifier, is
generated by Real AdaBoost of the first stage by the
following equation. All of the generated Joint-HOG
features generate the final classifier according to the
following procedure.
𝐻𝑐𝑚,𝑐𝑛(𝑥) = ∑ ℎ𝑡𝑐𝑚,𝑐𝑛(𝑥)
𝑇
𝑡=1
(11)
First, the pool of Joint-HOG features are input, and
probability density distributions W+ and W- of
positive and negative class are created. From the
weight Dt (i) of the learning sample i, it is obtained as
a one-dimensional histogram by the following
equation. The calculation formula of the weight Dt (i)
of the learning sample i is the same as that of the first
stage Real AdaBoost. The number of BINs in the one-
dimensional histogram is set to 64. And the created
probability density distributions Wk+, Wk
- are
normalized so that the sum of the probability density
distributions of each class becomes 1.
𝑊+𝑘 = ∑ 𝐷𝑡(𝑖)
𝑖:𝑘∈𝐾∧𝑦𝑖=+1
(12)
𝑊−𝑘 = ∑ 𝐷𝑡(𝑖)
𝑖:𝑘∈K∧𝑦𝑖=−1
(13)
Based on the obtained probability density
distribution, an evaluation value z2 representing the
degree of separation of the distribution is obtained.
Here, the distribution of the positive class and the
negative class are far apart as the value of z2 is smaller.
The minimum value of z2 is used to select weak
classifiers in each round.
𝑧2 = 2 ∑ √𝑊+𝑘𝑊−
𝑘
𝑗
(14)
Internet Journal of Society for Social Management Systems Vol. 11 Issue 1 sms17-4917
ISSN: 2432-552X
31
Then, gt (c) which is the weak classifier of Real
AdaBoost of the second stage is calculated using the
created probability density distribution Wk+ and Wk
-.
And the c is a number that represents combinations of
cells. ϵ is a coefficient for preventing division by zero
problems.
𝑔𝑡(c) = 1
2ln
𝑊+𝑘 + 𝜖
𝑊−𝑘 + 𝜖
(15)
Finally, with the Real AdaBoost of the second stage,
only the effective features are selected from the pool
of the Joint-HOG features calculated from the Real
AdaBoost of the first stage to obtain the final strong
classifier G (c).
𝐺(c) = { 1 ∑ 𝑔𝑡(𝑐)
𝑇
𝑡=1
> 𝜆
0 otherwise
(16)
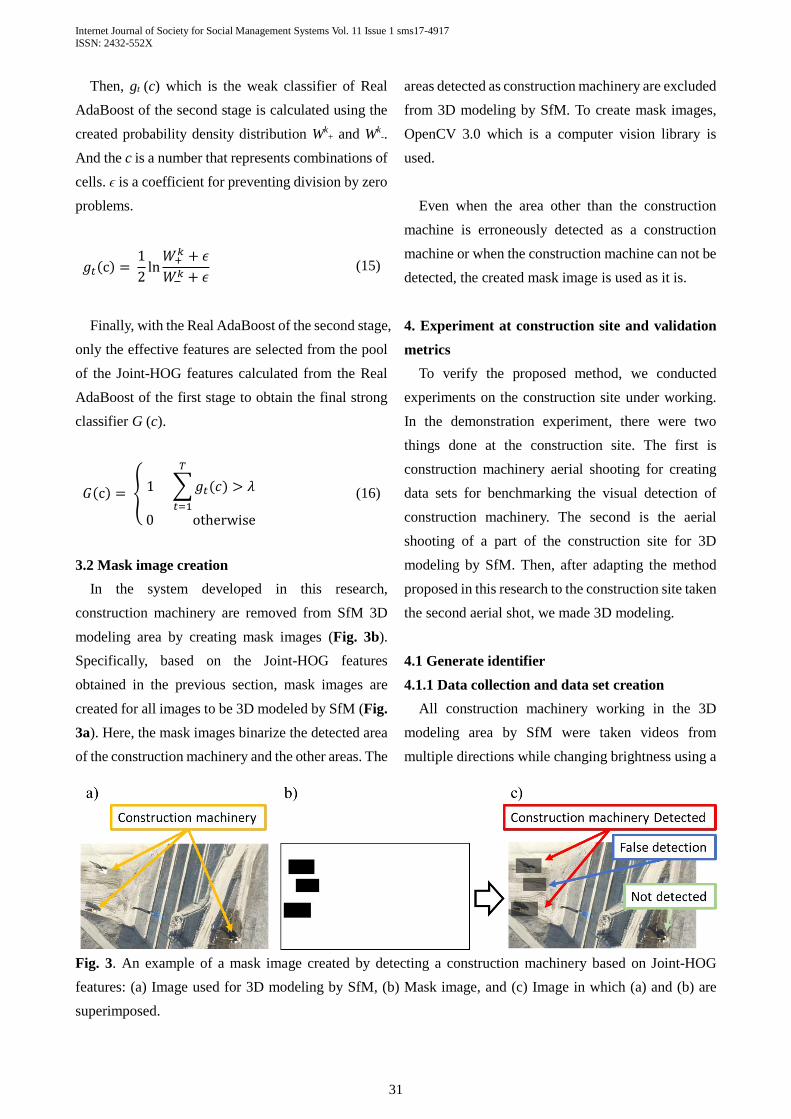
3.2 Mask image creation
In the system developed in this research,
construction machinery are removed from SfM 3D
modeling area by creating mask images (Fig. 3b).
Specifically, based on the Joint-HOG features
obtained in the previous section, mask images are
created for all images to be 3D modeled by SfM (Fig.
3a). Here, the mask images binarize the detected area
of the construction machinery and the other areas. The
areas detected as construction machinery are excluded
from 3D modeling by SfM. To create mask images,
OpenCV 3.0 which is a computer vision library is
used.
Even when the area other than the construction
machine is erroneously detected as a construction
machine or when the construction machine can not be
detected, the created mask image is used as it is.
4. Experiment at construction site and validation
metrics
To verify the proposed method, we conducted
experiments on the construction site under working.
In the demonstration experiment, there were two
things done at the construction site. The first is
construction machinery aerial shooting for creating
data sets for benchmarking the visual detection of
construction machinery. The second is the aerial
shooting of a part of the construction site for 3D
modeling by SfM. Then, after adapting the method
proposed in this research to the construction site taken
the second aerial shot, we made 3D modeling.
4.1 Generate identifier
4.1.1 Data collection and data set creation
All construction machinery working in the 3D
modeling area by SfM were taken videos from
multiple directions while changing brightness using a
Fig. 3. An example of a mask image created by detecting a construction machinery based on Joint-HOG
features: (a) Image used for 3D modeling by SfM, (b) Mask image, and (c) Image in which (a) and (b) are
superimposed.
Internet Journal of Society for Social Management Systems Vol. 11 Issue 1 sms17-4917
ISSN: 2432-552X
32
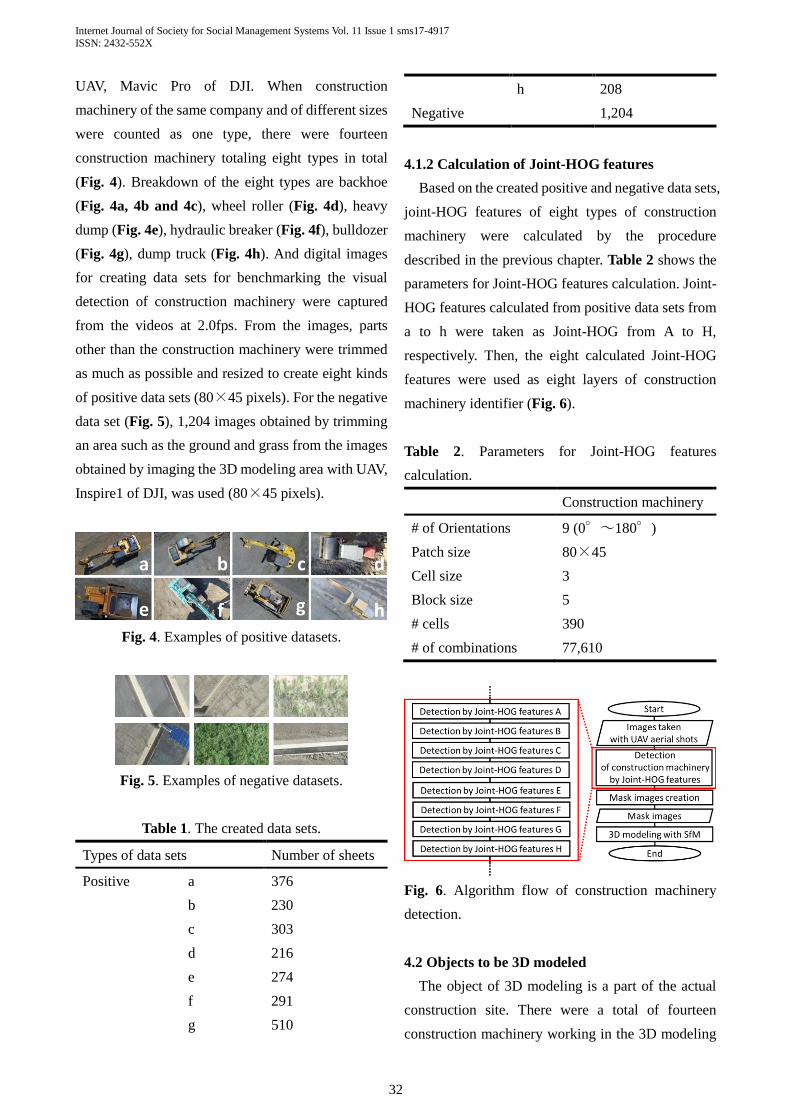
UAV, Mavic Pro of DJI. When construction
machinery of the same company and of different sizes
were counted as one type, there were fourteen
construction machinery totaling eight types in total
(Fig. 4). Breakdown of the eight types are backhoe
(Fig. 4a, 4b and 4c), wheel roller (Fig. 4d), heavy
dump (Fig. 4e), hydraulic breaker (Fig. 4f), bulldozer
(Fig. 4g), dump truck (Fig. 4h). And digital images
for creating data sets for benchmarking the visual
detection of construction machinery were captured
from the videos at 2.0fps. From the images, parts
other than the construction machinery were trimmed
as much as possible and resized to create eight kinds
of positive data sets (80×45 pixels). For the negative
data set (Fig. 5), 1,204 images obtained by trimming
an area such as the ground and grass from the images
obtained by imaging the 3D modeling area with UAV,
Inspire1 of DJI, was used (80×45 pixels).
Fig. 4. Examples of positive datasets.
Fig. 5. Examples of negative datasets.
Table 1. The created data sets.
Types of data sets Number of sheets
Positive a 376
b 230
c 303
d 216
e 274
f 291
g 510
h 208
Negative 1,204
4.1.2 Calculation of Joint-HOG features
Based on the created positive and negative data sets,
joint-HOG features of eight types of construction
machinery were calculated by the procedure
described in the previous chapter. Table 2 shows the
parameters for Joint-HOG features calculation. Joint-
HOG features calculated from positive data sets from
a to h were taken as Joint-HOG from A to H,
respectively. Then, the eight calculated Joint-HOG
features were used as eight layers of construction
machinery identifier (Fig. 6).
Table 2. Parameters for Joint-HOG features
calculation.
Construction machinery
# of Orientations 9 (0°~180°)
Patch size 80×45
Cell size 3
Block size 5
# cells 390
# of combinations 77,610
Fig. 6. Algorithm flow of construction machinery
detection.
4.2 Objects to be 3D modeled
The object of 3D modeling is a part of the actual
construction site. There were a total of fourteen
construction machinery working in the 3D modeling

Internet Journal of Society for Social Management Systems Vol. 11 Issue 1 sms17-4917
ISSN: 2432-552X
33
area (Fig. 7). The 3D modeling area was taken a video
using UAV, Inspire1 of DJI. Aerial photographing by
UAV was carried out during the day when
construction work was carried out and the weather
was sunny. The total flight distance of UAV was 646
m and the flight time was five minutes (Fig. 8). And
715 digital images (3840× 2160 pixels) used 3D
modeling by SfM were captured from the video at
2.0fps. Here, the 715 images are referred to as
"original images".
Fig. 7. Work position of construction machinery.
Fig. 8. 3D modeling area and UAV flight path.
4.3 Mask image creation
By using Joint-HOG features calculated in Chapter
4, Section 1, Subsection 2, construction machinery
were detected from the 715 original images, and a
mask image was created for each image.
4.4 Detection of construction machinery by Joint-
HOG features and 3D modeling by SfM
Finally, 3D modeling by SfM using PhotoScan pro
was done twice, the first is for original images and the
second is for images applied the developed system to
original images. Here, “original images” indicate 715
images of a part of the construction site created in the
previous section. Then, we output 3D model and point
cloud data respectively from the created model.
5. Experimental result
5.1 Detection of construction machinery by Joint-
HOG features
The detection rate of fourteen construction
machinery was on average 54.5%. Also, the
proportion of images including erroneous detection
was 5.1%, and the proportion of images including
undetected was 32.3%.
5.2 3D model and point cloud data
Fig. 9 shows a 3D model created from original
images. Fig. 10 shows a 3D model created from
images applied the developed system to original
images. And Fig. 11 shows expand part of Fig. 9 (A)
and Fig.10 (B). And (A´) and (B´) are single color
solid models. In Fig. 11, two construction machinery
are included, respectively. From these, it can be
confirmed that the 3D model created from images
applied the developed system to original images has a
smaller part of the construction machinery than the
3D model created from original images.
Fig. 12 is a diagram in which two output 3D point
cloud data are superimposed. Then, the difference
between the distances between the nearest points of
the two three-dimensional point cloud data is
indicated by a histogram. As shown in Fig. 12, the dif-

Internet Journal of Society for Social Management Systems Vol. 11 Issue 1 sms17-4917
ISSN: 2432-552X
34
Fig. 9. 3D model created from
original images.
Fig. 10. 3D model created
from images applied the
developed system to original
images.
Fig. 11. Expand part of Fig. 9 and 10:
(A´) and (B´) are single color solid
models.
ference in the distance between the nearest neighbor
points was large at the part where the construction
machinery was present, and it was confirmed that the
accuracy of 3D modeling was improved by the
developed system.
Fig. 12. Difference of nearest neighbor points
between created models.
6. Conclusion
In this paper, 3D modeling at construction sites by
SfM, we developed a system for 3D modeling after
detecting construction machinery based on Joint-
HOG features and creating mask images to remove
construction machinery from images used for 3D
modeling. The conclusion of this study is as follows.
Joint-HOG features can be used as a classifier of
construction machinery. The detection rat was on
average 54.5%. Also, the proportion of images
including erroneous detection was 5.1%, and the
proportion of images including undetected was
32.3%.
With the developed system, we confirmed the
improvement of the 3D modeling accuracy in the
situation where the construction machinery
working in the shooting area.
In addition, by increasing the detection rate, it is
expected that noise of construction machinery can be
removed more in 3D modeling. In the future, we will
aim for not only construction machinery but also
workers and other 3D modeling error factors to extend
the removal target and improve the detection rate.
Acknowledgment
In promoting this research, for cooperating in
demonstration experiments, the authors would like to
express the deepest appreciation to Himeyuri Total
Work Co., Ltd. and Kajima Corporation.
References
1) F. Yamazaki, T. Matsuda, S. Denda, and W. Liu,
Construction of 3D models of buildings damaged
by earthquakes using UAV aerial images,
Proceedings of the Ninth Pacific Conference on

Internet Journal of Society for Social Management Systems Vol. 11 Issue 1 sms17-4917
ISSN: 2432-552X
35
Earthquake Engineering, Paper No. 204, 2014.
2) T. Tamura, A. Kato, H. Obanawa and T. Yoshida,
2015. Three height measurement from areal
images taken by a small Unmanned Aerial
Vehicle using Structure Motion, J. Jpn. Soc.
Reveget. Tech, 41(1):163-168.
3) T. Mitsui, Y. Yamauchi and H. Fujiyoshi, 2009.
Object Detection by Two-Stage Boosting with
Joint Features, The IEICE Transactions on
Information and Systems, 92(9):1591-1601.
4) F. Heintz, P. Rudol, P. Doherty, From images to
traffic behavior—a UAV tracking and monitoring
application, 10th International Conference on
Information Fusion, IEEE, 2007.
5) F. Remondino, L. Barazzetti, F. Nex, M. Scaioni,
and D. Sarazzi, 2011. UAV photogrammetry for
mapping and 3d modeling–current status and
future perspectives, International Archives of the
Photogrammetry, Remote Sensing and Spatial
Information Sciences, 38(1), C22.
6) S. Lee and Y. Choi, 2015. Topographic survey at
small-scale open-pit mines using a popular
rotary-wing unmanned aerial vehicle (drone),
Tunnel and Underground Space, 25(5): 462-46.
7) SG. Barsantia, F. Remondino, and D. Visintini,
2013. 3D Surveying and Modelling of
Archaeological Sites-some critical issues, ISPRS
Photogrammetry, Remote Sensing and Spatial
Information Sciences, 2-6.
8) M. Golparvar-Fard, F. Peña-Mora, CA. Arboleda,
and S. Lee, 2009. Visualization of construction
progress monitoring with 4D simulation model
overlaid on time-lapsed photographs, Journal of
Computing in Civil Engineering, 23(6):391-404.
9) YS. Cho, NY. Lim, WS. Joung, SH. Jung and SK.
Choi, 2014. Management of Construction Fields
Information Using Low Altitude Close-range
Aerial Images, Journal of the Korean Society of
Surveying, Geodesy, Photogrammetry and
Cartography, 32(5):551-560.
10) M. Memarzadeh, M. Golparvar-Fard and JC.
Niebles, 2013. Automated 2D detection of
construction equipment and workers from site
video streams using histograms of oriented
gradients and colors, Automation in Construction,
32:24-37.
11) S. Chi and CH. Caldas, 2011. Automated object
identification using optical video cameras on
construction sites. Computer‐Aided Civil and
Infrastructure Engineering, 26(5):368-380.
12) Q. Zhu, MC. Yeh, KT. Cheng, and S. Avidan, Fast
human detection using a cascade of histograms of
oriented gradients. In Computer Vision and
Pattern Recognition, IEEE Computer Society
Conference on, Vol. 2, pp. 1491-1498. 2006.
13) P. Viola, MJ. Jones and D. Snow, Detecting
pedestrians using patterns of motion and
appearance, IEEE International Conference on
Computer Vision, pp.734-741, 2003.
14) K. Levi and Y. Weiss, Learning object detection
from a small number of examples: the importance
of good features, Proceedings of the 2004 IEEE
Computer Society Conference, pp. 53-56, 2004.
15) B. Wu, R. Nevatia, Detection of multiple,
partially occluded humans in a single image by
bayesian combination of edgelet part detectors.
International Conference on Computer Vision,
Beijing, pp. 90-97, 2005.
16) N. Dalal and B. Triggs, Histograms of oriented
gradients for human detection, Proc. IEEE Conf.
Computer Vision and Pattern Recognition, pp. 886-
893, 2005.