ACCURACY ASSESSMENT OF TERRESTRIAL LASER …3325/...I hereby declare that I am the sole author of...
54
ACCURACY ASSESSMENT OF TERRESTRIAL LASER SCANNING AND DIGITAL CLOSE RANGE PHOTOGRAMMETRY FOR 3D CULTURAL HERITAGE by Abdullah Taha Ahmed Albourae Bachelor of Architecture Faculty of Environmental Designs at King Abdul Aziz University Jeddah, Kingdom of Saudi Arabia, 2008 A thesis presented to Ryerson University in partial fulfillment of the requirements for the degree of Master of Applied Science in the program of Civil Engineering (Geomatics Engineering) Toronto, Ontario, Canada, 2014 ©Abdullah Taha Ahmed Albourae 2014
Transcript of ACCURACY ASSESSMENT OF TERRESTRIAL LASER …3325/...I hereby declare that I am the sole author of...

ACCURACY ASSESSMENT OF TERRESTRIAL LASER SCANNING AND DIGITAL CLOSE RANGE PHOTOGRAMMETRY FOR 3D CULTURAL HERITAGE
by
Abdullah Taha Ahmed Albourae
Bachelor of Architecture Faculty of Environmental Designs at King Abdul Aziz University
Jeddah, Kingdom of Saudi Arabia, 2008
A thesis
presented to Ryerson University
in partial fulfillment of the requirements for the degree of Master of Applied Science
in the program of Civil Engineering (Geomatics Engineering)
Toronto, Ontario, Canada, 2014 ©Abdullah Taha Ahmed Albourae 2014

ii
Author's Declaration
I hereby declare that I am the sole author of this thesis. This is a true copy of the thesis, including any required final revisions, as accepted by my examiners.
I authorize Ryerson University to lend this thesis to other institutions or individuals for the purpose of scholarly research.
I further authorize Ryerson University to reproduce this thesis by photocopying or by other means, in total or in part, at the request of other institutions or individuals for the purpose of scholarly research.
I understand that my thesis may be made electronically available to the public.

iii
Abstract
There are various surveying techniques used in the field of cultural heritage
documentation. Close Range Photogrammetry (CRP) and Terrestrial Laser Scanning
(TLS) techniques have been widely used in 3D modeling applications. Various research
studies integrate these techniques to enhance the quality of the data acquired. The main
objective of this research is to assess the accuracy of TLS and CRP. The two methods are
applied to two culture heritage case studies, which are located in the historic district in
Jeddah, Saudi Arabia. The data obtained from both techniques is compared with data
captured using traditional surveying techniques as reference data. The results show that
TLS tends to be more accurate than CRP. In the first case study (Bab Makkah), CRP and
TLS produced 0.044 m and 0.008 m overall RMS error, respectively; while CRP
produced 0.025 m and TLS produced 0.021 m in the second case study (Bab Sharif).

iv
Acknowledgements
First, I am very grateful to the almighty Allah, the gracious and the merciful, for this
accomplishment. A special thank to my Dad and Mom as they are always my inspiration
and solid source of support. Also, to all of my sisters and brothers, many thanks for your
care and support. Finally, and most importantly, many thanks to my dear wife for her
patience and support throughout my studies.
A special thanks to all staff members of the Geomatics Department in the Faculty of
Environmental Designs at King Abdul Aziz University, who supported me by providing
all instruments needed for this study. In addition, I’d like to thank the Saudi Arabian
Cultural Bureau in Canada, who facilitated my Canadian study term. I dedicate this work
to my country, The Kingdom of Saudi Arabia, and I sincerely hope that this thesis helps
to improve the heritage preservation methods in my country.
I should also thank my supervisor, Dr. Ahmed Shaker, for his unabated advice and
careful guidance despite his extremely busy schedule. I’d like to further thank my thesis
committee: Prof. Songnian Li, Dr. Darko Joksimovic, and Dr. Serhan Guner, for their
suggestions and insightful comments. My sincere thanks also goes to the Graduate
Program Director, Dr. Ahmed El-Rabbany, for his care and advice during my Master's
degree.
Finally, I would like to express my gratitude to Dr. Wai Yeung Yan for his continuous
support to help me finalize my thesis; and also, to all of my friends and colleagues in the
Department of Civil Engineering for their help, consideration, and thoughts.

v
Table of Contents
Author's Declaration ..................................................................................................................... ii Abstract ........................................................................................................................................ iii Acknowledgements ...................................................................................................................... iv List of Tables ............................................................................................................................... vi List of Figures ............................................................................................................................. vii CHAPTER 1: INTRODUCTION ..................................................................................................1 1.1. Introduction ........................................................................................................................1 1.2. Problem Definition .............................................................................................................1 1.3. Objectives ..........................................................................................................................3 1.4. Thesis Structure .................................................................................................................3
CHAPTER 2: BACKGROUND ....................................................................................................4 2.1. Introduction ........................................................................................................................4 2.2. Close Range Photogrammetry (CRP) ................................................................................4 2.3. Terrestrial Laser Scanning (TLS) ......................................................................................7 2.4. Traditional Survey Using Leica Smart-Station (LSS) .....................................................10 2.5. Close Range Photogrammetry (CRP) vs. Terrestrial Laser Scanning (TLS) ...................11 2.6. Existing Studies of Heritage Documentation ...................................................................12
2.6.1. The Use of CRP for Heritage Documentation .........................................................12 2.6.2. The Use of TLS for Heritage Documentation .........................................................13 2.6.3. CRP vs. TLS for Heritage Documentation ..............................................................14
CHAPTER 3: METHODOLOGY ...............................................................................................16 3.1. Introduction ......................................................................................................................16 3.2. Study Areas ......................................................................................................................16 3.3. General Workflow ...........................................................................................................18 3.4. Close Range Photogrammetry (CRP) ..............................................................................19
3.4.1. Data Acquisition for Bab Makkah and Bab Sharif ..................................................20 3.4.2. Data Processing of Image Calibration .....................................................................21
3.4.2.1. Lab Camera Calibration......................................................................................21 3.4.2.2. Field Camera Calibration....................................................................................23
3.4.3. CRP Image Registration ..........................................................................................24 3.5. Terrestrial Laser Scanning (TLS) ....................................................................................25
3.5.1. Data Acquisition ......................................................................................................25 3.5.2. Data Processing .......................................................................................................26
3.6. Traditional Surveying ......................................................................................................29 CHAPTER 4: RESULTS AND ANALYSIS...............................................................................30 4.1. CRP Results of Bab Makkah Dataset ..............................................................................30 4.2. CRP Results of Bab Sharif Dataset ..................................................................................31 4.3. TLS Results for Bab Makkah and Bab Sharif ..................................................................32 4.4. Accuracy Assessment of Bab Makkah Results ................................................................33 4.5. Accuracy Assessment of Bab Sharif Results ...................................................................38
CHAPTER 5: CONCLUSIONS ..................................................................................................42 References ....................................................................................................................................44
vi
List of Tables
Table 2.1. Characteristics of photogrammetry and laser scanner data ...........................................11 Table 3.1. Camera specification .....................................................................................................20 Table 4.1. Camera calibration results for Bab Makkah and Bab Sharif .........................................32 Table 4.2. Comparison between LSS and CRP coordinates of the same targets ............................34 Table 4.3. Comparison between LSS and TLS coordinates of the same targets ............................36 Table 4.4. A summary of the accuracy assessment between CRP and TLS ..................................37 Table 4.5. Accuracy assessment for Bab Sharif results ..................................................................39 Table 4.6. A comparison of accuracy assessment achieved between CRP and TLS .....................41

vii
List of Figures
Figure 2.1. Photogrammetry principle ..............................................................................................4 Figure 2.2. An example of configuration for a bundle solution .......................................................5 Figure 2.3. The Collinearity condition .............................................................................................5 Figure 2.4. Concept of TLS measurments ........................................................................................7 Figure 2.5. The principle of the Tacheometric laser .........................................................................8 Figure 2.6. The seven transformation parameters ............................................................................9 Figure 2.7. An illustration of a traditional survey using LSS .........................................................10 Figure 3.1. The historical region of Jeddah (Bab Makkah & Sharif Gate).....................................16 Figure 3.2. A pictogram illustration of general workflow ..............................................................18 Figure 3.3. Research workflow ......................................................................................................19 Figure 3.4. An illustration of close range photogrammetry concept ..............................................20 Figure 3.5. Multi-sheet lab camera calibration ...............................................................................22 Figure 3.6. The automatic calibration process in PhotoModeler ....................................................22 Figure 3.7. Example images used for field calibration ...................................................................24 Figure 3.8. An illustration of the laser scanning configuration and the targets used ......................25 Figure 3.9. An illustration of the TLS in the Bab Sharif ................................................................26 Figure 3.10. The results of data registration for Bab Makkah ........................................................27 Figure 3.11. The results of data registration for Bab Sharif ...........................................................28 Figure 3.12. An illustration of traditional survey methods using Leica Smart Station ..................29 Figure 4.1. The distribution of 20 artificial black and white targets on Bab Makkah ....................30 Figure 4.2. Four artificial targets that were assigned for image registration ..................................31 Figure 4.3. CRP image processing for Bab Sharif .........................................................................31 Figure 4.4. 3D model generation of Bab Makkah ..........................................................................33 Figure 4.5. 3D model generation of Bab Sharif .............................................................................33 Figure 4.6. The RMS error produced by the CRP technique..........................................................35 Figure 4.7. The RMS error produced by the TLS technique ..........................................................37 Figure 4.8. A comparison of RMS error between CRP and TLS ...................................................38

1
CHAPTER 1: INTRODUCTION
1.1.Introduction
Cultural heritage buildings play an important role in reflecting a country’s identity.
Recently, governments have directed their attention towards protecting cultural heritage
buildings from war, natural disasters, and general wear and tear. In addition to individual
countries, international organizations, such as the United Nations Organization of
Education, Science and Culture (UNESCO), and its World Heritage Centre, are interested
in documenting and preserving historical sites. Based on this increase demand, engineers
have been seeking more efficient and cost effective methods to document these cultural
heritage sites.
Rehabilitation and restoration of heritage buildings depends on being able to
accurately record their measurements and details. In the last decade, the field of historic
building documentation has developed competition between different surveying
techniques, systems, and devices for accuracy, cost effectiveness, and overall efficiency.
Two of the main documentation techniques are: Digital Close-Range Photogrammetry
(CRP) and Terrestrial Laser Scanner (TLS).
1.2.Problem Definition
Heritage documentation is one of the official ways to give definition and recognition
to cultural and historical infrastructure. Heritage documentation is used as an aid for
protection, restoration, conservation, preservation, identification, monitoring,
interpretation, and finally, management of historical buildings, sites, and cultural
landscapes (Haddad and Akasheh, 2005). In the past, the heritage documentation mainly

2
relied on human interpretation and record keeping, such as hand drawings, on-site
measurement, and sculptures. Documentation tools have undergone a major improvement
over the past 20 years. However, these tools provide an additional way to capture the
materials, colors, decorations, and so forth, in order to obtain more accurate results.
Digital photogrammetry and laser scanning are the two measurement techniques
growing in the field of heritage documentation. Digital photogrammetry offers a rapid
accurate method for acquiring three dimensional data, particularly related to large
complex objects. Data processing software, such as PhotoModeler, can be used to extract
accurate measurements and three dimension models from photographs (Haddad and
Akasheh, 2005). Furthermore, laser scanners are used intensively for the generation of 3D
models in a number of diverse areas, including: glacier monitoring, robotics navigation,
and space exploration. Initially, it appears that laser technology has surpassed traditional
close-range photogrammetry in accuracy and automation level.
In this study, two historic sites (Bab Makkah and Bab Sharif) in Saudi Arabia are
surveyed and documented using digital photogrammetry and terrestrial laser scanning
techniques. Due to their historical significance, availability of equipment and the
uniqueness of structure, both gates remain in their original position, which is now situated
in the middle of street intersections. Built in the 15th century, these gates still attract a lot
of attention from tourists and authorities; and thus, their appearance and maintenance are
very important. Furthermore, these gates serve a purpose in the Islamic tradition, in that
they have outstanding geometrical details, which reflect the city’s identity.

3
1.3.Objectives
Natural disasters, erosion, war, neglect, and conflicts of interest result in an urgent
need to document heritage sites all over the world. Buildings and landmarks of great
value are destroyed and removed each day. Therefore, documentation and recoding with
the best methods available (CRP and TLS) is pertinent for the restoration and
reconstruction of these damaged sites. The main objectives of this study aim to:
1. Assesses the accuracy of CRP and TLS techniques for documentation of two
cultural heritage sites in Saudi Arabia, with reference to traditional surveying data
and existing CAD drawings.
2. Construct digital 3D models of the two cultural heritage sites acquired by both
techniques for site documentation.
1.4.Thesis Structure
The thesis is structured into 5 chapters: Chapter 1 is the Introduction where the
problem statement and objectives of the research are presented. Chapter 2 provides the
conceptual background of CRP and TLS techniques. In addition, this chapter covers the
relevant research regarding the use of CRP and TLS in cultural heritage documentation.
Chapter 3 presents the overall method for the two case studies in the Bab Makkah and
Bab Sharif. Chapter 4 presents the experimental results to assess the accuracy of the CRP
and TLS techniques for the two case studies. The thesis ends with conclusions of the
research presented in Chapter 5.

4
CHAPTER 2: BACKGROUND
2.1.Introduction
This chapter reviews the principles of CRP, TLS, and traditional surveying techniques,
as well as discusses previous uses of CRP and TLS. A comparison of TLS and CRP is
presented with respect to some previous studies using CRP and TLS techniques for
cultural heritage documentation.
2.2.Close Range Photogrammetry (CRP)
According to the Manual of Photogrammetry (Salam, 1980), CRP is a combination of
art, science, and technology used to obtain precise mathematical measurements and three-
dimensional (3D) data from two or more photographs. It is a measurement technique that
calculates the 3D coordinates of an object from the measurements of two or more images
of that object from different positions. The fundamental principle used in CRP is
triangulation (Figure 2.1), which can be presented by colleaniarity equation as described
in Equation 2.1.
Image1 Image 2 3D coordinates
Figure 2.1. Photogrammetry principle

5
CRP follows two main steps:
1. Object (to be measured) data acquisition is performed by taking the required and
necessary photos.
2. Processing the photos and producing maps or spatial coordinates.
If more than two photos are captured (Figure 2.2), a bundle adjustment solution is
used, including all available measurements on the photos at the same time (Grussenmeyer
and Hanke, 2002).
Figure 2.2. An example of configuration for a bundle solution
The collinearity equation (Equation 2.1) can be used in photogrammetry to relate
coordinates from a two dimensional image to 3D object coordinate, as shown in Figure
2.3 (Salam, 1980).
Figure 2.3. The Collinearity condition

6
x = 𝑥0 - f𝑟11(𝑋 − 𝑋0) + 𝑟21(𝑌 − 𝑌0) + 𝑟31(𝑍 − 𝑍0)𝑟13(𝑋 − 𝑋0) + 𝑟23(𝑌 − 𝑌0) + 𝑟33(𝑍 − 𝑍0)
𝑦 = 𝑦0 - f𝑟12(𝑋 − 𝑋0) + 𝑟22(𝑌 − 𝑌0) + 𝑟32(𝑍 − 𝑍0)𝑟13(𝑋 − 𝑋0) + 𝑟23(𝑌 − 𝑌0) + 𝑟33(𝑍 − 𝑍0)
where:
(X,Y,Z) are the object point coordinates
(x, 𝑦) are the image coordinates
The interior orientation parameters
o (𝑥0,𝑦0) are the location of the principal point (offset)
o (f) is the camera focal length
The exterior orientation parameters
o (𝑋0,𝑌0,𝑍0) are the projection center (camera location coordinates)
o (r) is the rotation matrix with respect to the three orientation angles (ω,φ, κ)
and
𝑅 = �𝑟11 𝑟21 𝑟31𝑟12 𝑟22 𝑟32𝑟13 𝑟23 𝑟33
�
= �cos φ cos 𝛋 −cos φ sin 𝛋 sin φ
cos ω sin 𝛋 + sin ω sin φ cos 𝛋 cos ω cos 𝛋 + sin ω sin φ sin 𝛋 − sin ω cos φsin ω sin 𝛋 − cos ω sin φ cos 𝛋 sin ω cos 𝛋 + cos ω sin φ sin 𝛋 cos ω cos φ
�
[Omega (ω), Phi (φ), Kappa (κ)] are elements of image rotation around the three
axes.
(Eq. 2.1)

7
2.3.Terrestrial Laser Scanning (TLS)
Compared to CRP, TLS is a relatively new active remote sensing technique for 3D
data acquisition. It is an active sensor technique referred to as Light Detection and
Ranging (LiDAR) that can provide its own energy. It is now well-known for the precise
measurements it provides and the accuracy it can achieve. TLS is one of laser scanning
techniques that can be used for heritage building documentation. The basic measurement
of any laser scanning system is based upon measuring the difference in time between the
transmission and the reception of the laser pulse signal and the distance between the
sensor and object.
Figure 2.4. Concept of TLS measurments (Van Genechten, 2008)
The formula (Equation 2.2) used to measure the distance the pulse travels to the target
and the time it takes to reflect it back (Figure 2.4) is described as follows:
D =(c . t)
2
where:
D = distance
c = speed of light in the air
t = time between sending and receiving the signal
(Eq. 2.2)

8
The laser scanner, in addition to the measurement of distance(ρ), also measures the
horizontal and vertical angles, (α), as well as (θ) of the laser beam (Figure 2.5). The
intensity of backscattered laser beam is also recorded. Equation 2.3 is used to convert
those measurements into Cartesian coordinates.
�xyz� = ρ �
cos θ . cosαcos θ . sinα
sinθ�
In any geodetic application, the most common transformation method used is the
Helmert Transformation, also known as the Seven Transformations (Andrei, 2006). It
performs coordinate transformations between two different Cartesian coordinate systems
(Equation 2.4). For instance, the acquired coordinates for the surveyed objects are
transformed from the TLS local coordinate system (X1, Y1, Z1) to the real world projected
coordinate system (X2, Y2, Z2). The model considers the transformation parameters,
including: three translations, three rotations, and a scale of the axes (Figure 2.6).
(Eq. 2.3)
Figure 2.5. The principle of the Tacheometric laser

9
Figure 2.6. The seven transformation parameters
�𝑋2𝑌2𝑍2� = 𝑆 𝑅𝑋1(𝜔) 𝑅𝑌1(𝜙) 𝑅𝑍1(𝜅) �
𝑋1𝑌1𝑍1� + �
𝑋𝑇𝑌𝑇𝑍𝑇�
where:
𝐶𝑜𝑜. 𝑆1,𝐶𝑜𝑜. 𝑆2 refers to the point coordinates with respect to system 1 and 2.
(𝑋2,𝑌2,𝑍2) are the geocentric coordinates with reference to the target datum
(transformed coordinates vectors).
(𝑆) is the scale.
(𝑅𝑋1 ,𝑅𝑌1 ,𝑅𝑍1) are the rotation matrices.
(𝜔,𝜙, 𝜅) are the rotation angles around 𝑋1,𝑌1,𝑎𝑛𝑑 𝑍1, respectively.
(𝑋1,𝑌1,𝑍1) are the 3D coordinates of system 1 (initial coordinates’
vectors).
(𝑋𝑇 ,𝑌𝑇 ,𝑍𝑇) are the translations parameters.
(Eq. 2.4)

10
2.4.Traditional Survey Using Leica Smart-Station (LSS)
Leica Smart-Station (LSS) is a smart tool that combines traditional total-Station (TPS
1200) and GPS devices (Leica Geosystems, 2005). During the surveying process with
Leica Smart-Station, two controls points have to be used as a baseline in order to set up
the Smart-Station orientation and coordinate system. The position at the first point (P1)
should be determined with GPS. The surveyor should then orient to a second point (P2)
that should be the backsight. Meanwhile, P1 will be the location that the smart station is
set up. When the bearing between P1-P2 is known, all of the detail points surveyed will
automatically be surveyed with respect to the predefined coordinate system. The process
continues in the same way where the surveyor orients to P1 as backsight, in order to
calculate the azimuth (Leica Geosystems, 2007); and then, surveys the rest of the targets
from P2 (Figure 2.7). All points to be measured using Smart-Station can be measured
from one or more base stations. More stations can be added depending on the site and the
visibility to all points on the site.
Figure 2.7. An illustration of a traditional survey using LSS (Leica Geosystems, 2007)

11
2.5.Close Range Photogrammetry (CRP) vs. Terrestrial Laser Scanning (TLS)
Photogrammetry and laser scanning are the two best-known remote sensing
technologies for high resolution 3D data acquisition. The two techniques provide a
number of advantages and disadvantages to the practitioners. High redundancy in
photogrammetry is one of the main advantages, resulting in more accurate data. In
addition, photogrammetry can be used to capture the façade of the target objects. Beside
its redundancy and spatial information, the photogrammetry technique is considered
cheaper and faster than TLS (Habib et al., 2004).
Conversely, TLS has an important advantage, the ability to provide direct extraction of
3D coordinates. Moreover, unlike photogrammetry, which has a passive sensor, laser
scanning is equipped with an active sensor using its own energy, in turn, permitting data
collection during the day and at night. Unfortunately, the high cost and amount of time
needed to undertake laser scanning are two disadvantages, particularly when considering
a smaller project (Habib et al., 2004). Table 2.1 summarizes the characteristics of
photogrammetry and laser scanning.
Table 2.1. Characteristics of photogrammetry and laser scanner data Characteristics Photogrammetry Laser Scanner
Modeling type Image modeling Range modeling Cost of the instruments Low High Time of data acquisition Quite short Long 3D information To be derived Direct Scale Absent Present Data volume Images resolution Dense point cloud Texture Included Absent/Low resolution Edges Excellent Quite problematic Data collection Day time only Day or night 3D coordinates acquisition Complicated Direct

12
2.6.Existing Studies of Heritage Documentation
The main goal of heritage documentation is to record the geometry of a structure so
that it can be used for maintenance, restoration, reconstruction, conservation, or
educational purposes. Yilmaz et al. (2007) summarized four existing techniques for
heritage documentation, including: the traditional manual method, topographic surveying,
photogrammetry, and laser scanning. The traditional surveying method mainly utilizes
hand-held measurement tools (e.g. tape) to perform on-site measurement of the
dimensions of structures. Nevertheless, manual measurement is time-consuming and
labor intensive. In addition, direct contact with the heritage structure during measurement
may destroy the integrity of the structure unintentionally. Therefore, other alternatives
have been introduced for heritage documentation in order to avoid such direct contact.
2.6.1. The Use of CRP for Heritage Documentation
CRP has been used for heritage documentation due to its accuracy and ability to record
building texture information. A number of case studies have reported the documentation
and restoration of heritage buildings such as: agro-industrial buildings (Arias et al.,
2006), a historic castle (Brunetaud et al., 2012), and a fire-damaged historical building
(Yilmaz et al., 2007). Yilmaz et al. (2008) used CRP measurements to document a
historical building in Konya, Turkey, which had been destroyed by fire. A digital 3D
model was constructed using the CRP data, which was used to restore the building after
the accident.
Fuhi et al. (2009) used the CRP technique to document an archaeological site in Ajina
Tepa, Tajikistan. The RMSE accuracy achieved was within 0.1 m throughout the entire

13
site. Hendrickx et al. (2011) researched the use of an unmanned aerial vehicle to mount a
CRP system in order to survey the Tuekta burial mounds in the Russian Altay. The RMS
error achieved was within 0.077-to-0.082 m. However, all the aforementioned studies did
not perform or report any laboratory or on-site camera calibration, which is an important
step to increase the accuracy of the photogrammetric product (Fraser 1997).
2.6.2. The Use of TLS for Heritage Documentation
The TLS technique has been used recently for the acquisition of information on
heritage structures due to its ability for a massive collection of data point cloud. Such a
technique can collect the geometric details of a structure on very fine scale, which can
compensate for the drawbacks of CRP, especially when dealing with a complex structure
and architecture (Haddad 2011). Al-kheder et al. (2009) combined the use of CRP and
TLS to acquire the 3D structure of Amra, located in a desert area in Jordan. Lerma et al.
(2010) performed a similar study using both techniques to document a natural
environment – the upper Palaeolithic Cave of Parpallό - that is suited on top of a rugged
terrain surface. Both techniques are used efficiently to produce a high quality 3D model
with high geometric accuracy and visual quality.
Rüther et al. (2009) performed a large scale heritage conservation mapping of both
the inside and outside of the Wonderwerk Cave in South Africa using TLS. The applied
technique is able to relate the interior of the cave to its exterior, investigate the
Cosmogenic burial dating, and pave the way for future conservation and development. In
another application, Lubowiecka et al. (2009) combined the use of TLS and ground
penetrating radar to model a historic bridge structure so as to estimate the structural

14
behavior for further maintenance. With the aid of finite element modelling, an assessment
of the structural dynamics of the Cernadela Bridge can be achieved for rehabilitation and
maintenance. Armesto-González et al. (2010) further demonstrated the use of the TLS
intensity data to detect the potential damage within historical buildings. By applying a
fuzzy k-means algorithm on the 2D intensity image, the suspicious location of cracks and
damage can be located.
2.6.3. CRP vs. TLS for Heritage Documentation
Despite the extensive use of CRP and TLS techniques for heritage documentation, few
attempts were reported of comparing the accuracy achieved by the two techniques.
Nuttens et al. (2011) compared the CRP (using Canon EOS 1Ds) and TLS (Leica
ScanStation 2) measurements for Sint-Baads Abbey, Flanders, Belgium. The RMSE
achieved using CRP and TLS with respect to the use of total station measurements was
0.04 m and 0.023 m, respectively. Grussenmeyer et al. (2008) compared the use of TLS
and CRP on recording the data for the Haut-Andlau Castle, Bas-Rhin province, France.
The results reported showed that the RMS achieved by CRP and TLS was 0.005 m and
0.007 m, respectively. In addition to these attempts, Boehler and Marbs (2004) assessed
five case studies to compare both measurement techniques. They concluded that CRP is a
perfect solution if the object has distinct textures with predominated point-or line-based
structures, so as to produce an accurate façade of the object. Nevertheless, TLS definitely
outperforms CRP when dealing with complex and irregular objects, such as sculptures
and reliefs.

15
With respect to the aforementioned studies, the majority agrees that a combination of
CRP and TLS techniques yields the best results for heritage documentation, if sufficient
time and resources are available. Nevertheless, with respect to the increased volume of
data, a fully-automatic approach is still desired in the research community so as to
provide an efficient and one-off solution for reality-based surveying and 3D modeling of
heritage structures (Remondino, 2011).

16
CHAPTER 3: METHODOLOGY
3.1. Introduction
This chapter presents the method and experimental work for documenting two
historical sites in Saudi Arabia, Bab Makkah and Bab Sharif. Data collection and
processing for CRP and TLS were carried out in August 2013 for the two sites in order to
compare the two techniques. General workflow on the process of how the work was run
was followed. Later in this chapter, data collection and processing from CRP and TLS
techniques, which were obtained from the field work, is presented. Finally, a traditional
survey technique is used as a reference to assess the accuracy of the 3D model generated
from both the CRP and TLS techniques.
3.2.Study Areas
Figure 3.1. The historical region of Jeddah (Bab Makkah & Sharif Gate)

17
Jeddah has a remarkable mixture of modern and ancient history. About a century ago,
Jeddah city was walled. This wall included six ancient gates which were originally
implemented by Husain Al-Kurdi, one of the Mamluk princes, for the purpose of defense.
The wall was totally removed in 1947, opening the way for the rapidly growing city,
leaving the six gates to stand as historical landmarks. For the purposes of this study, I
have chosen Bab Makkah and Bab Sharif, which in Arabic means “gateway to Makkah”
and “gateway to Sharif”, respectively. These famous gates are located in historic district
in downtown of Jeddah city. Both gates are mainly built using a stone, extracted from the
sea, called 'Manqabi'. The gates were constructed by placing stones in rows, known as
'Madamik', and separating them by wooden intersection, called 'takail', in order to equally
distribute the load on the walls.
Bab Makkah is considered a large gate. The gate size is 30m in length, 7m in width,
and 8.50m in height. Unlike Bab Makkah, the size of Bab Sharif is relatively small, with
a length of 4.39m, a width of 3.65m, and a height of 6.71m. Due to their historical
significance both gates remain in their original position, which is now the middle of a
street. Built in the 15th century, these two gates still attract a lot of attention; and thus,
their appearance and maintenance are very important. Furthermore, these gates serve a
purpose in the Islamic tradition, in that they have outstanding geometrical details (Figure
3.1).

18
3.3.General Workflow
Figure 3.2 and 3.3 show the general workflow for CRP, TLS, and traditional survey
work:
Figure 3.2. A pictogram illustration of general workflow
The four steps of the workflow:
1. Site selection was based on many factors such as construction size, architectural
nature, building materials, and accessibility.
2. Field work has been done using the three methods including traditional survey, close-
range photogrammetry, and 3D terrestrial laser scanning methods.
3. The collected data was used to create CAD drawings, High Dynamic Range
photographs, 3D Point Clouds.
4. Each method was evaluated and compared across methods.

19
The procedure followed for each method is explained in the following section.
Figure 3.3. Research workflow
3.4.Close Range Photogrammetry (CRP)
Regarding the use of the CRP technique, a digital image processing software, called
PhotoModeler, was used in both case studies. PhotoModeler is a software for close-range
photogrammetry and image-based modeling. The software can be used to create 3D
models from a set of images taken from the surveyed object (Jiang and Miao, 2011).
Since PhotoModeler is an image-based modeling software, photography should be
performed in a professional way where existing and artificial control points can easily be
distinguished. Successive calibration and image processing in PhotoModeler are
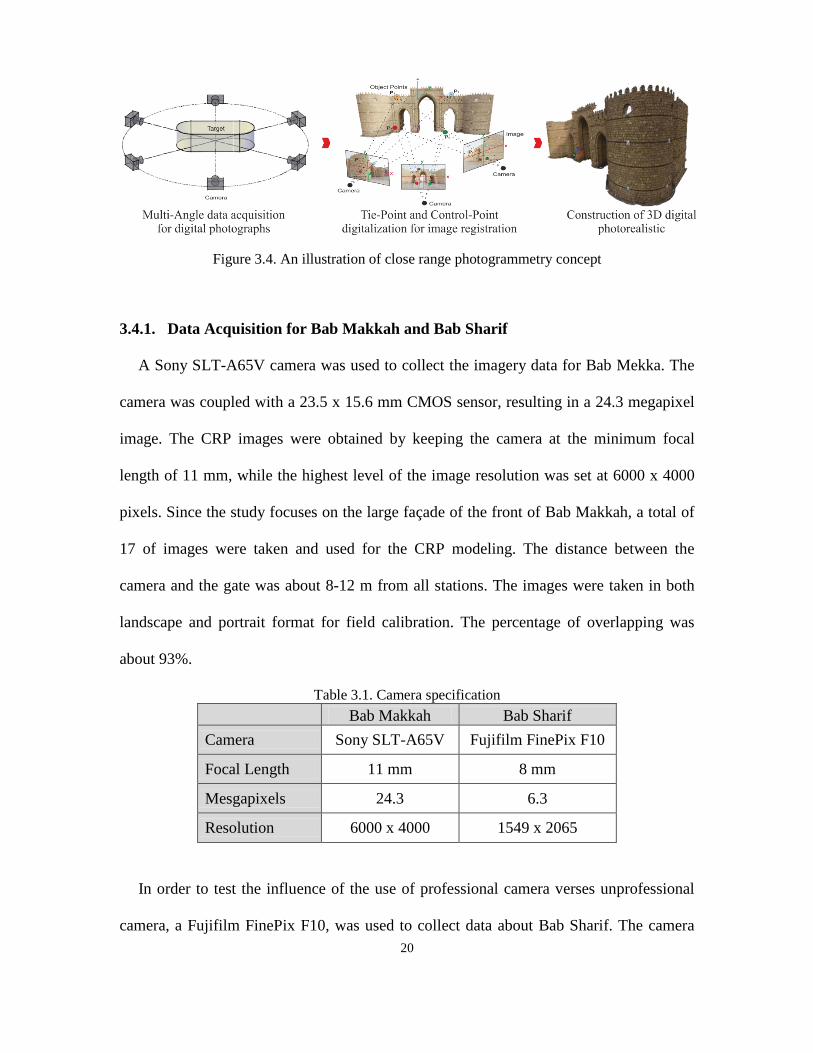
necessary for a successful outcome. Figure 3.4 shows the concept of digital close range
photogrammetry.
20
Figure 3.4. An illustration of close range photogrammetry concept
3.4.1. Data Acquisition for Bab Makkah and Bab Sharif
A Sony SLT-A65V camera was used to collect the imagery data for Bab Mekka. The
camera was coupled with a 23.5 x 15.6 mm CMOS sensor, resulting in a 24.3 megapixel
image. The CRP images were obtained by keeping the camera at the minimum focal
length of 11 mm, while the highest level of the image resolution was set at 6000 x 4000
pixels. Since the study focuses on the large façade of the front of Bab Makkah, a total of
17 of images were taken and used for the CRP modeling. The distance between the
camera and the gate was about 8-12 m from all stations. The images were taken in both
landscape and portrait format for field calibration. The percentage of overlapping was
about 93%.
Table 3.1. Camera specification
Bab Makkah Bab Sharif
Camera Sony SLT-A65V Fujifilm FinePix F10
Focal Length 11 mm 8 mm
Mesgapixels 24.3 6.3
Resolution 6000 x 4000 1549 x 2065
In order to test the influence of the use of professional camera verses unprofessional
camera, a Fujifilm FinePix F10, was used to collect data about Bab Sharif. The camera

21
features 6.3 megapixels, with a 1/1.7" Super CCD HR sensor. Since the size of Bab
Sharif is smaller than the Bab Makkah, a total of 7 images were sufficient to cover Bab
Sharif. The images were obtained keeping the camera at the minimum focal length of 8
mm, while the highest level of the image resolution was set at 1549 × 2065 pixels in
order to obtain high quality textures. The distance between the camera and the object was
approximately 10 to 20 m from all stations. The percentage of overlap was about 83%.
3.4.2. Data Processing of Image Calibration
Camera calibration is an important step in any photogrammetric data collection. The
purpose of camera calibration is to determine the exact values of camera parameters, such
as focal length and lens distortion. In this study, two image calibration methods were
carried out using PhotoModeller: Lab calibration and field calibration. The two
calibration methods were used in order to test the effect of camera calibration on the
overall accuracy.
3.4.2.1.Lab Camera Calibration
According to the instructions provided by PhotoModeller, a multi-sheet calibration
should be used if the surveyed object is greater than a foot away (PhotoModeler Tutorial,
2013). Before taking the photos for calibration, all camera settings, such as resolution,
zoom, and image quality, were retained as constant; while all other post-processing
operations, such as sharpening and image stabilization were turned off. During image
acquisition, the image scene was fully filled up with the photo window so that all parts of
the camera lens were covered with at least one calibration sheet, as shown in Figure 3.5.

22
Figure 3.5. Multi-sheet lab camera calibration
Figure 3.6 shows an example of the automatic calibration process in PhotoModeler, as
well as the 12 images taken by the digital camera (Sony SLT-A65V) for the calibration
sheets. Firstly, four photos were taken at each side using a landscape orientation. After
that, four more portrait photos were taken (the camera is rotated in a clockwise direction).
In the last step, the camera was rotated in a counter-clockwise direction for the last four
photos. All images were then added to a PhotoModler project, where auto-marking
detected all the target points and solved for camera parameter, such as focal length and
lens distortion.
Figure 3.6. The automatic calibration process in PhotoModeler

23
Finally, the calibration report was generated. The overall RMS and maximum point
marking residuals was 0.897 pixels and 3.432 pixels, respectively. According to the
PhotoModeler tutorial guide (2013), a residual between 5 to 10 pixels can be considered
high quality in a CRP project. Therefore, the residuals achieved were deemed within the
acceptance level. The estimated focal length was 11.895 mm for the Sony camera.
Similar lab camera calibration was conducted for the Fujifilm FinePix F10 camera
using a single-sheet calibration method. A total of 12 images were taken with similar
settings to what has been mentioned previously. Finally, the RMS and maximum point
marking residuals were calculated and found to be 0.126 pixels and 0.628 pixels,
respectively, with an estimated focal length of 8.192 mm. Both calibration files were used
as an input for post-processing of the CRP.
3.4.2.2.Field Camera Calibration
Field calibration is an alternative calibration method for fine tuning cameras in the
field before the CRP is performed. When high accuracy is required, certain requirements
have to be fulfilled in order to achieve accurate field calibration. For instance, 1) the
camera parameters should be consistent during the shoot (no changes in zoom or focus);
2) the camera positions should cover a wide range of angles; 3) high redundancy of points
should appear on photos from different angles; 4) all images should be consistently
covered; 5) camera positions should be rolled in both landscape and portrait positions;
and finally, 6) the targets or control points should also be clear and obvious.
According to the recommended settings of PhotoModeler, a field camera calibration
was performed for the Bab Makkah to explore the effect of the camera field calibration

24
on result accuracy. Figure 3.7 shows the images taken for the field camera calibration for
Bab Makkah. Though the camera was previously calibrated with a multi-sheet calibration
approach (lab calibration) as mentioned in Section 3.4.2.1, the process was further
improved by running the field calibration. Finally, the overall RMS of the point marking
residual was 0.483 pixels, where the maximum residual was 0.994 pixels only.
Figure 3.7. Example images used for field calibration
3.4.3. CRP Image Registration
After image calibration, CRP images are taken for the two sites, where image registration
is performed in the PhotoModeller. By providing sufficient tie points and control points
for the partially overlapping CRP images, the registration can be performed based on the
use of the collinearity equation (Eq. 2.1), as mentioned in section 2.2. At least 3 control
points (with known ground coordinates) should be provided for a pair of CRP images so
as to solve the unknown transformation parameters in the collinearity equation, which
thus register the CRP images into the ground coordinate system.

25
3.5.Terrestrial Laser Scanning (TLS)
TLS was conducted on Bab Makkah using Leica ScanStation C10. The device is
configured with a wide field of view of 360° H × 270° V, and pulse repetition rate up to
50,000 pts/s, with a 3D scan precision of 6 mm/50 m. The data processing software,
Cyclone, was used to process the collected data point cloud and generate the 3D models.
3.5.1. Data Acquisition
There were a total of five scans conducted on Bab Makkah, using twenty 6" black &
white targets, resulting in a dataset of 35,173,299 points. These scans (Figure. 3.8)
captured an external perspective of the gate at a distance of 8 - 12 m. At least three visible
targets were set up in each scan, so that geo-registration could be performed to combine
all the scans. The collected data was stored in the scanner and transferred to a laptop for
post-data processing using Cyclone.
Figure 3.8. An illustration of the laser scanning configuration and the targets used

26
For Bab Sharif, five laser scans were carried out using four 6" circular tilt & turn
targets. The data set comprises 25,208,377 points. The first four scans (as shown in
Figure. 3.9) that captured the external surface of the gate were performed with a distance
of 10 m to 20 m. An additional scan was setup inside the center of the gate so as to
capture the structure under the gate. Similar to the above TLS work, at least three targets
were used in each scan in order to register and combine all the five scans together.
Figure 3.9. An illustration of the TLS in the Bab Sharif
3.5.2. Data Processing
The TLS data processing for Bab Makkah and Bab Sharif followed the same
procedure. All five data scans were imported into the Cyclone software for data
registration of the collected data point cloud. The data registration aims to use the
common targets falling within the overlapping scans in order to align all the TLS data
points into the ground coordinate system, based on the Equation. 2.4. By using the seven-
parameter transformation, the acquired TLS data point cloud are geo-registered in the
ground coordinate system by considering the translation, rotation and scale factors. As

27
shown in Figures 3.10 and 3.11 for tables captured from Cyclone S/W, the overall
registration error ranges from 0.001 m to 0.002 m. The error represents the registration
error between the targets aligned within the overlapping scans. According to the user
guide of Cyclone, the registration error should be lower than 0.006 m so as to produce a
high quality data point cloud model (Cyclone, 2008). Therefore, the results obtained in
both case studies were deemed to be within the acceptable level of accuracy. After the
registration, the data points falling outside the study structure are removed, so that the
constructed 3D model represents only Bab Makkah and Bab Sharif.
Figure 3.10. The results of data registration for Bab Makkah

28
Figure 3.11. The results of data registration for Bab Sharif

29
3.6.Traditional Surveying
The Leica Smart-Station (LSS) was used to collect the target points installed on Bab
Makkah in order to assess the accuracy of the same points collected by CRP and TLS.
The measurements and the focus is given to those target points due to the unavailability
of authorized 3D CAD drawings for Bab Makkah, which can be used as reference data to
assess accuracy. Figure 3.12 illustrates the concept of data acquisition for Bab Makkah
using the Smart-station. The LSS was set up in front of the gate in a location named
station P1, where another backside station was setup as station P2. Since the Smart-
station was equipped with GPS, the coordinates of these two points could be obtained in a
global coordinate system (WGS84). In this case, a baseline was setup so that the 3D
coordinates of the object points located on the gate could be surveyed with absolute
coordinates. Finally, the 20 target points were collected for Bab Makkah in order to
assess accuracy. It is worth mentioning that the 20 target points are evenly distributed
within the structure and located at different parts of the structure. These points were then
used to assess the accuracy of the object points measured by CRP and TLS.
Figure 3.12. An illustration of traditional survey methods using Leica Smart Station

30
CHAPTER 4: RESULTS AND ANALYSIS
4.1.CRP Results of Bab Makkah Dataset
Seventeen images were collected and used for the 3D modeling of the gate using
PhotoModeler Scanner software. The CRP images were matched using 164 natural
control points located on different parts of the gate, such as wood edges and dots marking
on the building materials. The points were matched and identified in order to create an
accurate matching sequence for the images. The 20 artificial black and white targets,
which were placed on the facade of the gate (Figures 4.1), were used for the accuracy
assessment. However, in order to create a geo-registered 3D model, coordinates obtained
from the Leica Smart-Station (Figures 4.2) for four artificial targets (points 2, 14, 11, and
23) were used during the image registration process.
Figure 4.1. The distribution of 20 artificial black and white targets on Bab Makkah

31
Figure 4.2. Four artificial targets that were assigned for image registration
4.2.CRP Results of Bab Sharif Dataset
Seven CRP images were used for the 3D modeling of the gate using PhotoModeler
Scanner software. The first processing step involved matching 83 natural control points
(wood edges) across different images. Unlike Bab Makkah, the detection of the reference
features was done manually using PhotoModeler’s point and line tools (Figure 4.3).
Figure 4.3. CRP image processing for Bab Sharif

32
The accuracy of the camera calibration results have been checked for both Bab
Makkah and Bab Sharif. In Bab Makkah, lab and field calibration methods were used,
while only lab calibration was used for Bab Sharif. Based upon lab calibration for Bab
Makkah, the RMS calculated was 0.89 pixels, and the maximum residual was 3.43 pixels.
To improve the camera performance, a field calibration was conducted. As a result, the
projects maximum residual dropped to 0.994 pixels, and the overall RMS became 0.483
pixels. Meanwhile, the RMS and maximum point marking residuals for Bab Sharif using
lab calibration only were 0.126 pixels and 0.628 pixels, respectively (See Table 4.1).
Table 4.1. Camera calibration results for Bab Makkah and Bab Sharif
Lab calibration Field calibration Max. residuals
(pixels) RMS
(pixels) Max. residuals
(pixels) RMS
(pixels) Bab Makkah 3.430 0.890 0.994 0.483 Bab Sharif 0.628 0.126 Nil Nil
4.3.TLS Results for Bab Makkah and Bab Sharif
In order to process the laser scanning data, the five scans of both Bab Makkah and Bab
Sharif were imported and registered using Cyclone software (as mentioned in Section 3),
which created a complete 3D model of point clouds as shown in Figures 4.4 and 4.5.

33
Figure 4.4. 3D model generation of Bab Makkah
Figure 4.5. 3D model generation of Bab Sharif
4.4.Accuracy Assessment of Bab Makkah Results
Due to the lack of official government drawings or survey plans for Bab Makkah, the
Leica Smart-Station was used to measure the artificial targets as reference data. The
target measurements were used to evaluate the results obtained from the CRP and TLS
methods. Table 4.2 shows the 3D coordinates measured for these 20 target points using
the LSS and CRP, where the RMSE was computed between these two methods.

34
Table 4.2. Comparison between LSS and CRP coordinates of the same targets
Points
Traditional Survey (m) Close Range Photogrammetry (m)
Leica Smart-Station Sony a 65 Camera
PhotoModeler Scanner S.W. Residuals RMS
error X Y Z X Y Z dX dY dZ
BW14 518926.531 2376894.205 5.866 518926.531 2376894.218 5.864 0.000 -0.013 0.002 0.013
BW02 518926.582 2376894.161 9.834 518926.583 2376894.160 9.835 -0.001 0.001 -0.001 0.002
BW03 518931.153 2376894.495 9.883 518931.166 2376894.488 9.892 -0.013 0.007 -0.009 0.017
BW15 518931.158 2376894.501 5.798 518931.170 2376894.503 5.796 -0.012 -0.002 0.002 0.013
BW05 518931.55 2376899.552 9.797 518931.5563 2376899.504 9.793 -0.006 0.048 0.004 0.048
BW17 518931.551 2376899.528 5.873 518931.5594 2376899.473 5.881 -0.008 0.055 -0.008 0.057
BW16 518931.716 2376897.929 5.856 518931.7175 2376897.89 5.861 -0.002 0.039 -0.005 0.039
BW04 518931.76 2376897.852 9.83 518931.7693 2376897.815 9.828 -0.009 0.037 0.002 0.038
BW18 518934.863 2376902.962 5.867 518934.8508 2376902.909 5.870 0.012 0.053 -0.003 0.055
BW06 518934.867 2376902.979 9.79 518934.8594 2376902.922 9.784 0.008 0.057 0.006 0.058
BW07 518939.393 2376907.608 9.738 518939.3743 2376907.549 9.733 0.019 0.059 0.005 0.062
BW19 518939.414 2376907.624 5.866 518939.3929 2376907.567 5.865 0.021 0.057 0.001 0.061
BW20 518942.67 2376910.973 5.848 518942.6508 2376910.91 5.845 0.019 0.063 0.003 0.066
BW08 518942.69 2376910.98 9.737 518942.6687 2376910.931 9.738 0.021 0.049 -0.001 0.053
BW21 518945.686 2376910.617 5.839 518945.6849 2376910.517 5.838 0.001 0.100 0.001 0.100
BW09 518945.748 2376910.609 9.716 518945.7693 2376910.508 9.701 -0.021 0.101 0.015 0.105
BW11 518948.062 2376915.845 9.663 518948.0614 2376915.844 9.672 0.001 0.001 -0.009 0.009
BW23 518948.113 2376915.739 5.826 518948.1133 2376915.727 5.816 0.000 0.012 0.010 0.015
BW22 518948.417 2376912.414 5.875 518948.4331 2376912.386 5.865 -0.016 0.028 0.010 0.034
BW10 518948.475 2376912.501 9.671 518948.4946 2376912.482 9.681 -0.020 0.019 -0.010 0.029
Total RMS error 0.011 0.040 0.005 0.044

35
As shown in Figure 4.1, ten of the target points are located in the lower portion of the
structure (approximately 5 m above the measurement datum) and the other half of the 20
points are located in the upper portion (approximately 10 m above the measurement
datum) of Bab Makkah. The RMS errors using the CRP technique of the control points
are 0.011 m, 0.04 m and 0.005 m in X, Y, and Z directions, respectively. Results also
show that the minimum errors of X, Y and Z are 0 m , 0.001 m, and 0.001 m,
respectively; while the maximum error reaches 0.021 m, 0.1 m, and 0.015 m in the X, Y,
Z directions (as shown in Table 4.2).
The minimum RMSE of all the points is 0.005 m where the maximum RMSE reaches
up to 0.040 m, resulting in an overall RMSE of 0.044 m. One should note that the
relatively large RMSE values are found at points BW09 and BW21 (Figure 4.6), on the
right side of the main entrance of Bab Makkah. Due to the low contrast of photos taken at
this portion, a relatively low number of matching points can be achieved in this curvy
area. This situation thus degrades the geometric quality of the generated 3D model,
resulting in a relatively high RMSE in Y direction close to 0.1 m.
Figure 4.6. The RMS error produced by the CRP technique
-0.040 -0.020 0.000 0.020 0.040 0.060 0.080 0.100 0.120
RMS
Erro
r (m
)
Point Number
dX
dY
dZ

36
Table 4.3. Comparison between LSS and TLS coordinates of the same targets
Points
Traditional Survey (m) Terrestrial Laser Scanning (m)
Leica Smart-Station Leica Laser Scanner C10
Cyclone S.W. Residuals RMS
error X Y Z X Y Z dX dY dZ
BW14 518926.531 2376894.205 5.866 518926.530 2376894.205 5.866 0.001 0.000 0.000 0.001
BW02 518926.582 2376894.161 9.834 518926.583 2376894.161 9.834 -0.001 0.000 0.000 0.001
BW03 518931.153 2376894.495 9.883 518931.156 2376894.489 9.882 -0.003 0.006 0.001 0.003
BW15 518931.158 2376894.501 5.798 518931.162 2376894.496 5.800 -0.004 0.005 -0.002 0.004
BW05 518931.55 2376899.552 9.797 518931.544 2376899.533 9.797 0.006 0.019 0.000 0.006
BW17 518931.551 2376899.528 5.873 518931.548 2376899.508 5.874 0.003 0.020 -0.001 0.003
BW16 518931.716 2376897.929 5.856 518931.731 2376897.933 5.855 -0.015 -0.004 0.001 0.015
BW04 518931.76 2376897.852 9.83 518931.773 2376897.855 9.830 -0.013 -0.003 0.000 0.013
BW18 518934.863 2376902.962 5.867 518934.851 2376902.949 5.868 0.012 0.013 -0.001 0.012
BW06 518934.867 2376902.979 9.79 518934.858 2376902.964 9.790 0.009 0.015 0.000 0.009
BW07 518939.393 2376907.608 9.738 518939.376 2376907.599 9.738 0.017 0.009 0.000 0.017
BW19 518939.414 2376907.624 5.866 518939.396 2376907.616 5.865 0.018 0.008 0.001 0.018
BW20 518942.67 2376910.973 5.848 518942.648 2376910.969 5.848 0.022 0.004 0.000 0.022
BW08 518942.69 2376910.98 9.737 518942.669 2376910.975 9.737 0.021 0.005 0.000 0.021
BW21 518945.686 2376910.617 5.839 518945.692 2376910.606 5.840 -0.006 0.011 -0.001 0.006
BW09 518945.748 2376910.609 9.716 518945.755 2376910.596 9.716 -0.007 0.013 0.000 0.007
BW11 518948.062 2376915.845 9.663 518948.062 2376915.845 9.663 0.000 0.000 0.000 0.000
BW23 518948.113 2376915.739 5.826 518948.113 2376915.739 5.826 0.000 0.000 0.000 0.000
BW22 518948.417 2376912.414 5.875 518948.419 2376912.414 5.875 -0.002 0.000 0.000 0.002
BW10 518948.475 2376912.501 9.671 518948.477 2376912.502 9.670 -0.002 -0.001 0.001 0.002
Total RMS error 0.008 0.007 0.001 0.008

37
Table 4.4. A summary of the accuracy assessment between CRP and TLS
CRP (m) TLS (m) dX dY dZ dX dY dZ
Min error 0.000 0.001 0.001 0.000 0.000 0.000 Max error 0.021 0.100 0.015 0.022 0.02 0.001 RMS error 0.011 0.040 0.005 0.008 0.007 0.001
Table 4.3 shows the same 20 points measured by the Leica Smart Station and TLS.
The RMS errors of the target point residuals are 0.008 m, 0.007 m, and 0.001 m in X, Y,
and Z directions, respectively. Results also show that the minimum error using the TLS
for Bab Makkah in X, Y, and Z are all close to zero; while the maximum error reaches to
0.022 m, 0.02 m, and 0.002 m, in X, Y, Z directions, respectively. Overall, the RMSE
calculated at the target points is better than those obtained measured by the CRP
technique (Table 4.4). The overall RMSE is 0.008 m with a maximum RMSE of 0.008 m
and minimum RMSE of 0.001 m. Comparing to the results obtained with CRP, there is
no notable fluctuation of the RMSE among the 20 points (Figure 4.7).
Figure 4.7. The RMS error produced by the TLS technique
-0.02
-0.01
0.00
0.01
0.02
0.03
RMS
Erro
r (m
)
Point Number
dX
dY
dZ

38
The results summarized in Tables 4.2 and 4.3 represent the RMSE for each targeted
point. The overall RMSE value for CRP is 0.044 m, where the overall RMSE value for
TLS is 0.008 m.
The results achieved also demonstrate that the RMS error achieved using CRP is
always higher than that obtained using TLS. The minimum difference between these two
methods is found at point BW02. However, a significant difference in the RMS error is
observed in points BW09 and BW21, where the difference is up to 0.1 m. One should
note that BW09 and BW21 are located on the curvy structure of Bab Makkah (Figure
4.8). If the heritage structure has a large portion of irregular components, TLS should be
used in order to achieve higher accuracy.
Figure 4.8. A comparison of RMS error between CRP and TLS
4.5.Accuracy Assessment of Bab Sharif Results
Table 4.5 shows ten selected measurements for dimensions on Bab Sharif. The
accuracy of the CRP and TLS methods are evaluated by measuring different length on the
gate based upon the unavailability of geo-referenced coordinates or point measurements.
In addition, it was decided to use another evaluation tool by measuring distances on the
gate considering that AutoCAD drawings were available for the gate. The measurements
0.000
0.020
0.040
0.060
0.080
0.100
0.120
BW14 BW02 BW03 BW15 BW05 BW17 BW16 BW04 BW18 BW06 BW07 BW19 BW20 BW08 BW21 BW09 BW11 BW23 BW22 BW10
RMS
Erro
r (m
)
Point Number
Terrestrial Laser Scanning
Close Range Photogrammetry

39
performed on the gate included: the width of the window, height of the arch, and width of
the gate. Table 4.6 summarizes the minimum, maximum, and average errors derived from
the CRP and TLS methods in relation to the AutoCAD drawing provided by authorities.
Table 4.5. Accuracy assessment for Bab Sharif results
Output
Close Range Photogrammetry
Terrestrial Laser Scanner (Reference)
PhotoModeler Software Cyclone Software AutoCAD Software
6.698 m
6.737 m
6.71 m
Error compared to the reference 0.012 m - 0.027 m
4.395 m
4.396 m
4.39 m
Error compared to the reference - 0.005 m -0.006 m
1.988 m
1.992 m
1.98 m
Error compared to the reference -0.008 m - 0.012 m
1.661 m
1.662 m
1.67 m
Error compared to the reference 0.009 m 0.008 m
4.819 m
4.851 m
4.82 m
Error compared to the reference 0.001 m -0.031 m

40
Output
Close Range Photogrammetry
Terrestrial Laser Scanner (Reference)
PhotoModeler Software Cyclone Software AutoCAD Software
1.178 m
1.177 m
1.19 m
Error compared to the reference 0.012 m 0.013 m
5.364 m
5.374 m
5.34 m
Error compared to the reference -0.024 m - 0.034 m
3.226 m
3.190 m
3.16 m
Error compared to the reference -0.066 m -0.03 m
1.308 m
1.300 m
1.29 m Error compared to the reference -0.018 m -0.01 m
1.053 m
1.032 m
1.03 m Error compared to the reference -0.023 m -0.002 m

41
Based on the results presented in Table 4.5, the RMS error using TLS is 0.021 m;
whereas, the overall RMS error achieved by using the CRP is 0.025 m. Such a result is
better than some of the previous studies, such as Nuttens et al. (2011), where the RMS
error achieved was 0.04 m and 0.023 m using CRP and TLS, respectively. Table 4.6
summarizes the minimum, maximum, and overall RMS error of Bab Sherif’s
measurements. It is still noted that the TLS method produces better accuracy in
comparison to CRP. However, the improvement of the accuracy achieved using TLS, in
this case, is less than what had been achieved for Bab Makkah. This change in accuracy
can be justified by the differences between the two data sets in terms of how the data is
collected and the equipment used.
Table 4.6. A comparison of accuracy assessment achieved between CRP and TLS
CRP (m) TLS (m)
Min error 0.001 0.002
Max error 0.066 0.031
Average error 0.010 0.013
Overall RMS Error 0.025 0.021

42
CHAPTER 5: CONCLUSIONS
In this study, two remote sensing techniques are used for heritage site documentation in
two study sites in Saudi Arabia: Bab Makkah and Bab Sharif. Due to the historic value,
availability of equipment and the uniqueness of structure of the two sites, they were both
surveyed using two remote sensing techniques: close-range photogrammetry (CRP) and
terrestrial laser scanner (TLS). The results of the two methods were compared with
reference data taken from two different data sources. Due to the unavailability of existing
authorized CAD drawings for Bab Makkah, the reference measurement was conducted
using Smart-Station equipment. For Bab Sharif, the measurements performed by both
CRP and TLS were compared against existing CAD drawings provided by local
authorities. Finally, the geometric accuracies achieved by the two methods (CRP and
TLS) are compared with reference to the CAD drawings and the Smart-Station
measurements in order to report and recommend the best method for heritage site
documentation.
For CRP, camera calibration was conducted in both case studies. Laboratory
calibration was carried out before performing the survey, where the RMS error achieved
was 0.89 pixel and 0.126 pixel for Bab Makkah and Bab Sharif, respectively. A field
calibration further improved the results to 0.483 pixels in the case study of Bab Makkah,
which is within the acceptable accuracy recommended by the CRP software. In order to
evaluate the geometric accuracy, 20 evenly distributed survey points were selected on
Bab Makkah and 10 geometric dimensions were selected from the CAD drawings of Bab
Sharif.

43
Finally, the results showed that the RMS error achieved by TLS and CRP for Bab
Makkah are found to be 0.008 m and 0.044 m, respectively. However, both TLS and CRP
achieved similar RMS errors for Bab Sharif, 0.021 m and 0.025 m, respectively.
Generally, it was found that TLS gave better results when compared to CRP, despite the
use of lab/field calibration in both case studies, which improved the accuracy of the
photogrammetric product. Maximum RMS errors in TLS were usually found on those
object points located on the complex structure of the study sites; whereas high RMS
errors in CRP were observed when those object points were extracted in the low contrast
portion of the images.
Based on the results of this study, heritage site documentation should be conducted
using both techniques. CRP is able to provide fruitful textural information of the
surveyed sites, which can be used to generate a photorealistic 3D model for site
documentation. The high density of TLS point cloud data can offer an accurate detailed
architectural description for the study sites, which is hence capable of providing a direct
solution for digital 3D modeling and site recovery. Therefore, both techniques should be
considered complementary; rather than, adversarial. Further research should look for an
efficient and one-off solution for reality-based surveying and 3D modeling of heritage
structures through using such a combination of measurement techniques.

44
References
Abdelhafiz, A. (2009). Integrating digital photogrammetry and terrestrial laser scanning. Inst. For Geodesy and Photogrammetry, Technical University Braunschweig, Germany. ISBN 3-926146-18-4. Online on Deutsche Geodätische Kommission (DGK), München 2009, ISBN 978-3-7696-5043-3.
Alan Walford. (April 2006). One Part in 300,000 Precision and Accuracy Discussion.
Report, Eos Systems Inc. Al-Kheder, S., Al-Shawabkeh, Y., & Haala, N. (2009). Developing a documentation
system for desert palaces in Jordan using 3D laser scanning and digital photogrammetry. Journal of Archaeological Science, 36(2), 537-546.
Alshawabkeh, Y., & Haala, N. (2004). Integration of digital photogrammetry and laser
scanning for heritage documentation. The International Archives of the Photogrammetry, Remote Sensing and Spatial Information Sciences, 35(B5).
Altuntas, C., and Yildiz, F. (2012). Range and image sensor combination for three
dimensional reconstruction of objects or scenes. Sensor Review, 32(3), 236 - 244. Andrei C.O., (2006). 3D affine coordinate transformations. MSc in Geodesy, School of
Architecture and the Built Environment. Royal Institute of Technology 'KTH', Stockholm, Sweden.
Arias, P., Herraez, J., Lorenzo, H., & Ordonez, C. (2005). Control of structural problems
in cultural heritage monuments using close-range photogrammetry and computer methods. Computers & Structures, 83(21), 1754-1766.
Arias, P., Ordóñez, C., Lorenzo, H., & Herraez, J. (2006). Methods for documenting
historical agro-industrial buildings: a comparative study and a simple photogrammetric method. Journal of Cultural Heritage, 7(4), 350-354.
Armesto-González, J., Riveiro-Rodríguez, B., González-Aguilera, D., & Rivas-Brea, M.
T. (2010). Terrestrial laser scanning intensity data applied to damage detection for historical buildings. Journal of Archaeological Science, 37(12), 3037-3047.
Barsanti, S. G., Remondino, F., & Visintini, D. (2012). Photogrammetry and Laser
Scanning for archaeological site 3D modeling–Some critical issues. In Proc. of the 2nd Workshop on'The New Technologies for Aquileia', V. Roberto, L. Fozzati.
Bartos, K., Pukanská, K., Gajdosik, J. and Krajnák, M. (2011). The Issue of
Documentation of Hardly Accessible Historical Monuments by Using of Photogrammetry and Laser Scanner Techniques. In: XXIIIrd International CIPA Symposium, Prague, Czech Republic. September 12–16, 2011.

45
Boehler, W., & Marbs, A. (2004). 3D scanning and photogrammetry for heritage recording: a comparison. In: Proceedings of the 12th International Conference on Geoinformatics, pp. 291-298.
Borkowski, A., & Józków, G. (2012). Accuracy Assessment of Building Models Created
from Laser Scanning Data. ISPRS-International Archives of the Photogrammetry, Remote Sensing and Spatial Information Sciences, 1, 253-258.
Cyclone (2008). Cyclone 5.8.1. Technical Specification. Available at: www.leica-
geosystems.com (Accessed June 4, 2014). Ebrahim, M. A. B. (2000). Determination of the Islamic art accuracy by using digital
close range photogrammetry. International Archives of Photogrammetry and Remote Sensing, 33(B5/1; PART 5), 195-202.
El-Tokhey, M. E., Abdel-Gawad, A. K., Mogahed, Y. M., & El-Maghraby, A. M. (2013).
Accuracy Assessment of Laser Scanner in Measuring and Monitoring Deformations of Structures. World Applied Sciences Journal, 26(2), 144-151.
Fraser, C. S. (1997). Digital camera self-calibration. ISPRS Journal of Photogrammetry
and Remote Sensing, 52(4), 149-159. Fujii, Y., Fodde, E., Watanabe, K., & Murakami, K. (2009). Digital photogrammetry for
the documentation of structural damage in earthen archaeological sites: The case of Ajina Tepa, Tajikistan. Engineering Geology, 105(1), 124-133.
Geosystems, L. (2008). Cyclone 5.8. 1: Comprehensive software for working with laser
scan data. San Ramon, Calif. Grussenmeyer, P., Landes, T., Voegtle, T., & Ringle, K. (2008). Comparison methods of
terrestrial laser scanning, photogrammetry and tacheometry data for recording of cultural heritage buildings. In ISPRS Congress Proceedings, Beijing, 213-18.
Grussenmeyer. P. & Hanke. K. (2002). Architectural photogrammetry: Basic theory,
Procedures, Tools. ISPRS Commission 5 Tutorial. Habib, A. F., Ghanma, M. S., & Tait, M. (2004). Integration of LIDAR and
photogrammetry for close range applications. In Proceedings if the ISPRS XXth Conference, Istanbul, Turkey B (Vol. 35).
Haddad, N. & Akasheh, T. (2005). Documentation of archaeological sites and
monuments: ancient theatres in Jerash. In Proceedings of CIPA XXth International Symposium, September 26–October 1, Torino, Italy, 350–355.
Haddad, N. A. (2011). From ground surveying to 3D laser scanner: A review of
techniques used for spatial documentation of historic sites. Journal of King Saud University-Engineering Sciences, 23(2), 109-118.

46
Hendrickx, M., Gheyle, W., Bonne, J., Bourgeois, J., De Wulf, A., & Goossens, R. (2011). The use of stereoscopic images taken from a microdrone for the documentation of heritage–an example from the Tuekta burial mounds in the Russian Altay. Journal of Archaeological Science, 38(11), 2968-2978.
Jiang, T., & Miao, X. (2011). Research and application of three-dimensional modeling
based on Photomodeler Scanner. Communications in Information Science and Management Engineering.
Kadobayashi, R., Kochi, N., Otani, H., & Furukawa, R. (2004). Comparison and
evaluation of laser scanning and photogrammetry and their combined use for digital recording of cultural heritage. International Archives of the Photogrammetry, Remote Sensing and Spatial Information Sciences, 35(5), 401-406.
Lee, S.Y., Majd, Z., and Setan, H. 2013. 3D data acquisition for indoor assets using
terrestrial laser scanning. ISPRS Annals of the Photogrammetry, Remote Sensing and Spatial Information Sciences, Volume II-2/W1, pp. 221-226.
Leica Geosystems (2005). Leica Smartstation - the Integration of GPS and Total Station
Technologies. Available at http://www.leica-geosystems.com/ (Accessed June 4, 2014)
Leica Geosystems (2007). Combining TPS and GPS SmartStation and SmartPole - high
Performance GNSS Systems. Available at http://www.leica-geosystems.com/ (Accessed June 4, 2014)
Lichti, D. (2007). Error modelling, calibration and analysis of an AM-CW terrestrial laser
scanner system. ISPRS Journal of Photogrammetry and Remote Sensing, 61(5), 307–324.
Lichti, D. D., & Licht, M. G. (2006). Experiences with terrestrial laser scanner modelling
and accuracy assessment. International Archives of Photogrammetry Remote Sensing and Spatial Information Sciences, 36(5), 155-160.
Luhmann, T., Robson, S., Kyle, S., and Harley, I. (2007). Close Range Photogrammetry:
Principles, Techniques and Applications. Whittles Publishing. Caithness, Scotland, UK.
Nuttens, T., De Maeyer, P., De Wulf, A., Goossens, R., & Stal, C. (2011). Terrestrial
laser scanning and digital photogrammetry for cultural heritage: an accuracy assessment. In FIG Working Week 2011: Bridging the gap between cultures. International Federation of Surveyors (FIG).
Pérez, M., Agüera, F., & Carvajal, F. (2011). Digital camera calibration using images
taken from an unmanned aerial vehicle. The International Archives of the Photogrammetry, Remote Sensing and Spatial Information Sciences, 38(1), C22.

47
PohotoModeler Tutorial (2013). PhotoModeler, Version 2013. Vancouver: Eos Systems Inc., 2013.
Remondino, F. (2011). Heritage recording and 3D modeling with photogrammetry and
3D scanning. Remote Sensing, 3(6), 1104-1138. Renyi. L., Guigang. S., and Fengquan. J. (2010). Ancient architecture reconstructing
based on Terrestrial 3D Laser Scanning technology. In: Proceedings of the 2010 2nd International Conference on Software Engineering and Data Mining (SEDM), pp.285- 288.
Rüther, H., Chazan, M., Schroeder, R., Neeser, R., Held, C., Walker, S. J., Matmon, A.,
& Horwitz, L. K. (2009). Laser scanning for conservation and research of African cultural heritage sites: the case study of Wonderwerk Cave, South Africa. Journal of Archaeological Science, 36(9), 1847-1856.
Singh, S. P., Jain, K., & Mandla, V. R. (2013). Virtual 3D Campus Modeling by Using
Close Range Photogrammetry. American Journal of Civil Engineering and Architecture, 1(6), 200-205.
Slama, C. C., Theurer, C., & Henriksen, S. W. (1980). Manual of photogrammetry (No.
Ed. 4). American Society of Photogrammetry and Remote Sensing. Tonon, F., & Kottenstette, J. T. (2006). Laser and photogrammetric methods for rock face
characterization. In: Report on a workshop held in Golden, Colorado. Van Genechten, B. (2008). Theory and practice on Terrestrial Laser Scanning: Training
material based on practical applications. Universidad Politecnica de Valencia Editorial.
Yilmaz, H. M., Yakar, M., & Yildiz, F. (2008). Documentation of historical caravansaries
by digital close range photogrammetry. Automation in Construction, 17(4), 489-498. Yilmaz. H.M., Yakar. M., and Gulec. S.A., and Dulgerler. O.N. (2007). Importance of
digital close-range photogrammetry in documentation of cultural heritage. Journal of Cultural Heritage. 8 (4), 428-433.
Zhan Z.Q. (2008). Camera calibration based on Liquid Crystal Display (LCD). The
International Archives of the Photogrammetry, Remote Sensing and Spatial Information Sciences, 37.
Zulkepli M., Setan, H., and Chong, A. K. (2009). Accuracy assessments of point cloud
3D registration method for high accuracy craniofacial mapping. Geoinformation Science Journal, 9 (2). pp. 36-44.