control delay variability at signalized intersection based on - EASTS

Accuracy and variability of GPS Tropospheric Delay Measurements of Water Vapor in the Western
Mediterranean
Submitted 31 October 2002
Jennifer Haase – ACRI-ST S.A. 260 Route du Pin Montard, BP 234, 06904 Sophia Antipolis, France Now at: Purdue University Department of Earth and Atmospheric Sciences CIVL 1397 West Lafayette, IN 47906 Tel 1-765-494-1643 Fax 1-765-496-1210 [email protected] Maorong Ge - CNRS Géosciences Azur 250 Rue Albert Einstein, 06560 Sophia Antipolis, France Now at: GeoForschungsZentrum Telegrafenberg A17 D-14473 Potsdam, Germany Tel 49 (0) 331 288 1116 Fax: 49 (0) 331 288 1759 [email protected] Henrik Vedel – Danish Meteorological Institute Lyngbyvej 100, 2100 Copenhagen, Denmark Tel +45 39 15 74 45 Fax +45 39 15 74 60 [email protected] Eric Calais, CNRS Géosciences Azur 250 Rue Albert Einstein, 06560 Sophia Antipolis, France Now at: Purdue University Department of Earth and Atmospheric Sciences CIVL 1397 West Lafayette, IN 47906 Tel 1-765-496-2915 Fax 1-765-496-1210 [email protected]

Haase et al., 2002, ZTD Water Vapor in the Western Mediterranean submitted to Bull. Am. Meteor. Soc.
2
Abstract
As a preliminary step for assessing the impact of Global Positioning System (GPS) refractive
delay data in numerical weather prediction (NWP) models, the GPS zenith tropospheric
delays (ZTD) are analyzed from 51 permanent GPS sites in the western Mediterranean. The
objectives are to estimate the error statistics necessary for future assimilation of GPS ZTD
data in numerical models, and to investigate the variability of the data in this area. The time
series, which were derived continuously from November 1998 to June 2001, are compared to
independent equivalent values derived from radiosonde profiles and the HIRLAM numerical
weather prediction model. From over two years of data, the difference between radiosonde
and GPS ZTD has a standard deviation of 12 mm of delay and a bias of 7 mm of delay. Some
sites have biases as high as 14 mm of delay. The bimodal distribution of residuals, with a
higher bias for daytime launches, indicates these biases may be due to radiosonde day-night
measurement biases. The biases between the GPS ZTD and HIRLAM estimates are smaller,
but the 18 mm ZTD standard deviation is significantly greater. The standard deviation of the
residuals depends strongly on the amount of humidity, which produces an annual signal due to
the much higher variability of water vapor in the summer months. The better agreement with
radiosonde data than HIRLAM estimates indicate that the NWP models will benefit from the
additional information provided by GPS. The long term differences between the observational
data sources require further study before GPS derived data become useful for climate studies.
Haase et al., 2002, ZTD Water Vapor in the Western Mediterranean submitted to Bull. Am. Meteor. Soc.
3
1 Introduction
Humidity is a highly variable parameter in atmospheric processes and it plays a crucial role in
atmospheric motions on a wide range of scales in space and time. Limitations in humidity
observation accuracy, as well as temporal and spatial coverage, often lead to problems in
numerical weather prediction, in particular prediction of clouds and precipitation. The
verification of humidity simulations in operational weather forecasts and climate modelling is
also difficult because of the lack of high temporal and spatial resolution data. Ground-based
GPS receivers have been proposed as a possible data source (Bevis et al. 1992) to improve
both model validation and the initial model state used in forecasts.
The refractive delay of Global Positioning System (GPS) radio signals measured by ground
based receivers is a function of pressure, temperature, and water vapor pressure. The
hydrostatic component of the delay can be determined from surface pressure measurements
and removed, leaving the non-hydrostatic component of the refractive delay which is nearly
proportional to the content of water vapor, hence called the wet delay.
The refractive delay of radio waves in the atmosphere is a large source of error for precise
positioning using space geodetic measurement techniques, contributing a range error in the
zenith direction on the order of 2.4 meters. This motivated the early work on methods to
model the error source (Saastamoinen 1972; Davis et al. 1985; Askne and Nordius 1987;
Elgered et al. 1991) in order to remove it and thus increase the accuracy of space geodetic
positioning estimates. Herring (1990) and Tralli and Lichten (1990) developed methods to
include the zenith delays as unknown parameters to be simultaneously estimated in the
Haase et al., 2002, ZTD Water Vapor in the Western Mediterranean submitted to Bull. Am. Meteor. Soc.
4
positioning calculation. Bevis et al. (1992) proposed the use of these estimated delays as a
means for studying the atmosphere.
Ground-based GPS receivers are an attractive source of humidity data for weather prediction
in that they are portable and economic, and provide measurements which are not affected by
rain and clouds. They do not provide the humidity profile as do radiosondes, but they have the
advantage of providing automated continuous data whereas radiosondes usually provide 2 or
4 measurements per day. Other ground based measurements such as water vapor radiometers
or photometers are affected by rain and clouds.
Many authors carried out studies to increase the accuracy of the technique, typically using a
small number of stations. Rocken et al. (1993) was the first to demonstrate agreement
between WVR and GPS derived relative estimates of integrated water vapor (IWV), with a
level of agreement of about 1 kg/m2. Evaluation of absolute rather than relative IWV was
made possible by extending the horizontal extent of the network, which also reduced biases in
the estimates (Duan et al. 1996; Tregoning et al. 1998). Systematic errors were reduced by
using improved mapping functions relating the delay observed at a given satellite elevation to
the zenith delay, and by using improved antenna phase center correction models (Niell 2000a;
Fang et al. 1998). Tests that included gradients as a first approximation for laterally varying
refractivity structure around the sites demonstrated that the estimation of zenith delays is
robust with or without including these gradients (Ruffini et al. 1999; Bar-Sever et al. 1998).
One long term study, (Emardson et al. 2000), detected instrumental biases due to antenna
radomes and the resulting contamination of network solutions. This study used independent
data from other instruments, in particular water vapor radiometers, to demonstrate the
accuracy of the data. It has been demonstrated that the integrated water vapor can be retrieved

Haase et al., 2002, ZTD Water Vapor in the Western Mediterranean submitted to Bull. Am. Meteor. Soc.
5
using ground based GPS observations with the same level of accuracy as radiosondes and
microwave radiometers (Elgered et al. 1997; Bevis et al. 1992; Rocken et al. 1995; Duan et al.
1996; Emardson et al. 1998; Tregoning et al. 1998).
As the technique has improved, the potential of this method has been realized as an important
source of humidity observations for numerical weather prediction (NWP) models (Kuo et al.
1996; Zou and Kuo 1996) and for climate (Yuan et al. 1993). There has been collaborative
work dedicated to exploiting the data to improve forecasting in both North America and
Europe. The first study of its kind was the GPS/STORM experiment which took place in the
high tornado risk midwestern United States (Rocken et al. 1995). This experiment compared
GPS water vapor measurements to radiosonde measurements during a time period which
included more than 6 major storms and demonstrated the validity of the method. Since then,
the U.S. National Oceanographic and Atmospheric Agency (NOAA) has installed an
operational network to further research in the use of a ground based GPS integrated water
vapor observing system for weather forecasting (Smith et al. 1999; Gutman and Benjamin
2001). GPS IWV data from an extensive network of stations in the Baltic region were
compared to NWP model delayed mode assimilation reanalyses and forecasts for a 4 month
period (Yang et al. 1999). The difference between the NWP reanalyses and GPS IWV for 25
sites had a bias of –0.1 kg/m2 and a root mean square error (rms) of 2.3 kg/m2. For some sites
the bias was as high as 2.4 kg/m2 and the rms 3.4 kg/m2, though the data that was used was
later found to contain errors due to the site specific radome equipment and has since been
improved (Emardson et al. 2000). In general the level of agreement between the GPS and the
NWP reanalyses was approximately the same as the agreement of the reanalyses with the
radiosondes. An extensive array of GPS receivers installed in Japan for earthquake research is
now being used by the Japanese Meteorological Agency to retrieve IWV for planned

Haase et al., 2002, ZTD Water Vapor in the Western Mediterranean submitted to Bull. Am. Meteor. Soc.
6
assimilation in NWP models. In preliminary comparisons with the Japanese Meteorological
Agency (JMA) objective analyses, the IWV was shown to track incoming storm fronts, but
the data had some biases on the order of 2-4 kg/m2 (Iwabuchi et al. 2000).
Concurrent with efforts in the U.S. to incorporate the GPS ZTD data into NWP models, the
MAGIC project was begun in Europe with similar objectives (Haase 1997; Haase et al. 2001).
MAGIC (Meteorological Applications of GPS Integrated Column Water Vapor
Measurements in the Western Mediterranean) was a 3 year project financed in part by the
European Commission. The project objectives were to test the usefulness of the GPS data for
numerical weather prediction (NWP) model validation, to develop the assimilation algorithms
necessary for incorporating this data into NWP models, and to study the long term use of this
data in climate model validation.
The focus of this paper is the presentation of error statistics from the comparison of the GPS
ZTD with radiosonde data and the HIRLAM 6 hour forecasts. This will provide the necessary
input for determining the error covariance matrix of the observation operator in the 3D
variational and 4D variational assimilation algorithms in the HIRLAM forecasts. The
comparison between the three data sets has been carried out continuously over a time period
greater than two annual cycles. The present study provides a comparison in a region which is
climatically very different from the Baltic (Yang et al. 1999) and the midwestern US (Smith
et al. 1999) and thus provides additional important insight for effective use of the data.
Haase et al., 2002, ZTD Water Vapor in the Western Mediterranean submitted to Bull. Am. Meteor. Soc.
7
2 GPS Data Processing
2.1 Network design, station distribution, and data flow
The data processing carried out for the MAGIC project includes data from 51 permanent GPS
stations. In order to reduce the computational load of the network geodetic solution, we
divided the GPS network into three sub-networks, one in France, one in Italy and one in
Spain, with each subnetwork containing 6 common IGS reference stations. The three
estimates of tropospheric delay at the common IGS stations are used to monitor the
consistency of each sub-network solution and are used for testing the sensitivity of the ZTD
solutions to the network geometry.
The GPS data are collected daily in RINEX format with a 30 s sampling rate from the
International GPS Service (IGS) data centers and other agencies responsible for permanent
regional station archives. Surface meteorological data taken at the GPS sites (pressure,
temperature, relative humidity) are also downloaded where they are available. The RINEX
data are quality checked and stored until the final precise IGS orbits (Kouba and Mireault
1998) become available, approximately 2 weeks later.
The GPS data are processed at three institutions involved in the MAGIC project, to ensure
consistent results independent of the software used. The Centre National de la Recherche
Scientifique (CNRS) Géosciences Azur laboratory in France processes all MAGIC stations,
using the GAMIT software; (Bock et al. 1986; King and Bock 1999). The Institute for Space
Studies of Catalonia (IEEC) in Spain processes a subset of IGS stations using the GIPSY
software point positioning strategy; (Webb and Zumberge 1997; Zumberge et al. 1997;Ruffini

Haase et al., 2002, ZTD Water Vapor in the Western Mediterranean submitted to Bull. Am. Meteor. Soc.
8
et al. 1999;Flores et al. 2000). The Italian Space Agency (ASI) in Italy processes the Italian
stations using the GIPSY software, and has tested both a network processing strategy and
point positioning strategy (Pacione et al. 2001). The ZTD estimated by the three centers are
then archived so that an ongoing, routine comparison among sub-networks, processing
centers, and radiosonde and HIRLAM data can be used to validate the results. The entire
procedure has been automated and runs routinely with very limited user input. Here we
present the results from the CNRS Géosciences Azur data processing center.
2.2 Zenith tropospheric delay retrieval
The quantity observed by the GPS receiver is the interferometric phase measurement of the
distance from the GPS satellites to the receiver. The processing software must resolve or
model the orbital parameters of the satellites, solve for the transmitter and receiver positions,
account for ionospheric delays, solve for phase cycle ambiguities and the clock drifts in
addition to solving for the tropospheric delay parameters of interest. This requires the same
type of GPS data processing software as that which is used for high precision geodetic
measurements. We use the GAMIT software (Bock et al. 1986; King and Bock 1999), which
solves for the ZTD and other parameters using a constrained batch least squares inversion
procedure.
The tropospheric delay for a zenith path is the integral of the refractivity, N, over height in the
atmosphere. The refractivity can be described as a function of temperature, T, the partial
pressure of dry air, Pd, and the partial pressure of water vapor, e (Smith and Weintraub 1953;
Thayer 1974; Davis et al. 1985):
Haase et al., 2002, ZTD Water Vapor in the Western Mediterranean submitted to Bull. Am. Meteor. Soc.
9
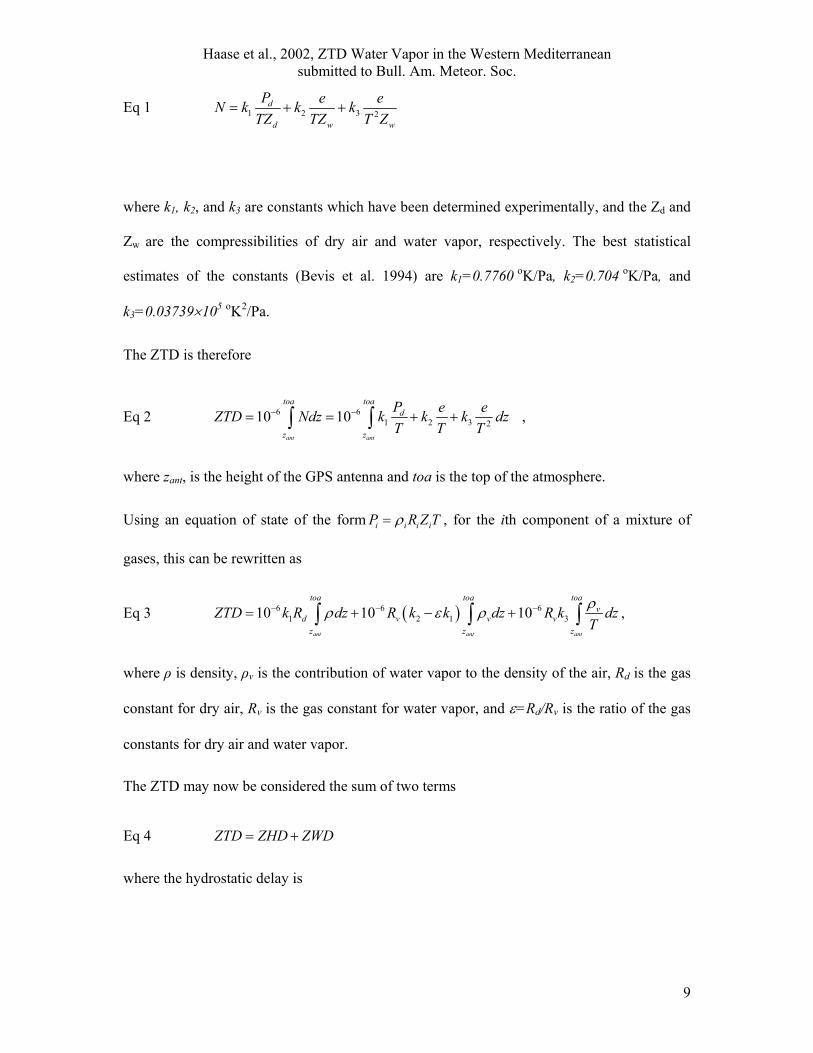
Eq 1 1 2 3 2d
d w w
P e eN k k kTZ TZ T Z
= + +
where k1, k2, and k3 are constants which have been determined experimentally, and the Zd and
Zw are the compressibilities of dry air and water vapor, respectively. The best statistical
estimates of the constants (Bevis et al. 1994) are k1=0.7760 oK/Pa, k2=0.704 oK/Pa, and
k3=0.03739×10⁵ oK2/Pa.
The ZTD is therefore
Eq 2 6 61 2 3 210 10
ant ant
toa toad
z z
P e eZTD Ndz k k k dzT T T
− −= = + +∫ ∫ ,
where zant, is the height of the GPS antenna and toa is the top of the atmosphere.
Using an equation of state of the form i i i iP R Z Tρ= , for the ith component of a mixture of
gases, this can be rewritten as
Eq 3 ( )6 6 61 2 1 310 10 10
ant ant ant
toa toa toav
d v v vz z z
ZTD k R dz R k k dz R k dzTρρ ε ρ− − −= + − +∫ ∫ ∫ ,
where ρ is density, ρv is the contribution of water vapor to the density of the air, Rd is the gas
constant for dry air, Rv is the gas constant for water vapor, and ε=Rd/Rv is the ratio of the gas
constants for dry air and water vapor.
The ZTD may now be considered the sum of two terms
Eq 4 ZTD ZHD ZWD= +
where the hydrostatic delay is
Haase et al., 2002, ZTD Water Vapor in the Western Mediterranean submitted to Bull. Am. Meteor. Soc.
10
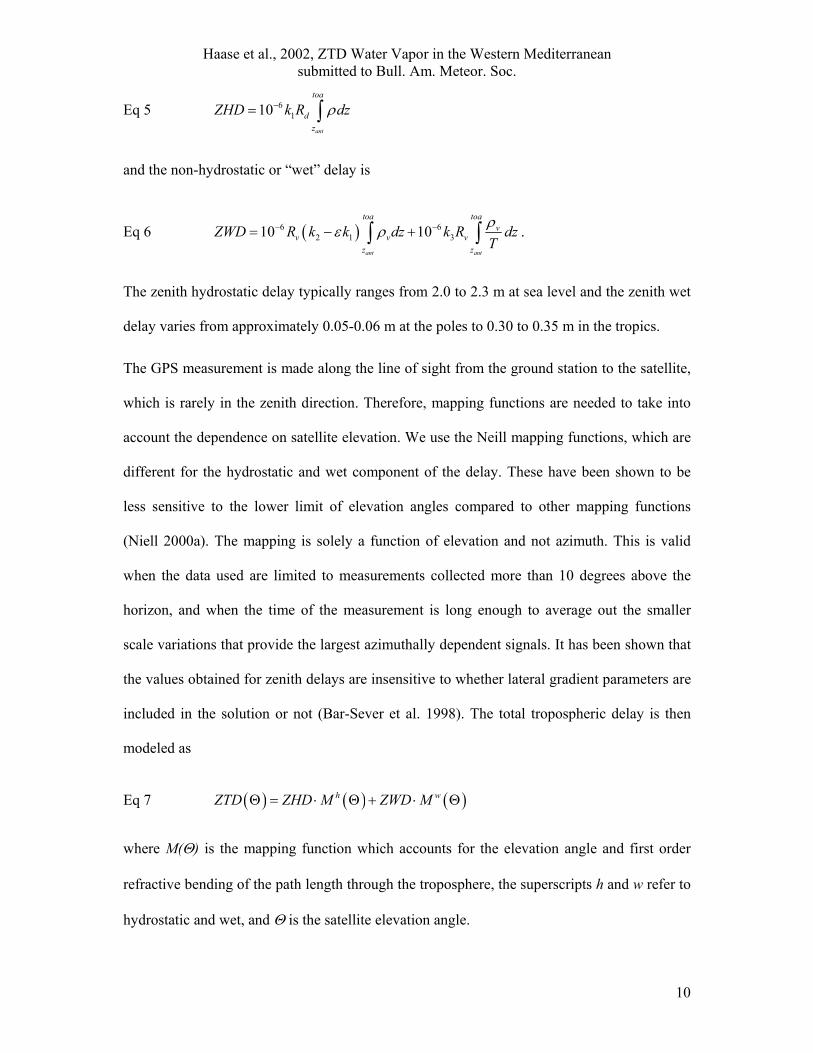
Eq 5 6110
ant
toa
dz
ZHD k R dzρ−= ∫
and the non-hydrostatic or “wet” delay is
Eq 6 ( )6 62 1 310 10
ant ant
toa toav
v v vz z
ZWD R k k dz k R dzTρε ρ− −= − +∫ ∫ .
The zenith hydrostatic delay typically ranges from 2.0 to 2.3 m at sea level and the zenith wet
delay varies from approximately 0.05-0.06 m at the poles to 0.30 to 0.35 m in the tropics.
The GPS measurement is made along the line of sight from the ground station to the satellite,
which is rarely in the zenith direction. Therefore, mapping functions are needed to take into
account the dependence on satellite elevation. We use the Neill mapping functions, which are
different for the hydrostatic and wet component of the delay. These have been shown to be
less sensitive to the lower limit of elevation angles compared to other mapping functions
(Niell 2000a). The mapping is solely a function of elevation and not azimuth. This is valid
when the data used are limited to measurements collected more than 10 degrees above the
horizon, and when the time of the measurement is long enough to average out the smaller
scale variations that provide the largest azimuthally dependent signals. It has been shown that
the values obtained for zenith delays are insensitive to whether lateral gradient parameters are
included in the solution or not (Bar-Sever et al. 1998). The total tropospheric delay is then
modeled as
Eq 7 ( ) ( ) ( )h wZTD ZHD M ZWD MΘ = ⋅ Θ + ⋅ Θ
where M(Θ) is the mapping function which accounts for the elevation angle and first order
refractive bending of the path length through the troposphere, the superscripts h and w refer to
hydrostatic and wet, and Θ is the satellite elevation angle.
Haase et al., 2002, ZTD Water Vapor in the Western Mediterranean submitted to Bull. Am. Meteor. Soc.
11
The GAMIT software parameterizes ZTD as a stochastic variation from the Saastamoinen
model (Saastamoinen 1972), with piecewise linear interpolation in between solution epochs.
GAMIT is very flexible in that it allows a priori constraints of varying degrees of uncertainty.
The variation from the hydrostatic delay is constrained to be a Gauss-Markov process with a
specified power density of 2 cm/hour1/2, referred to below as the “zenith tropospheric
parameter constraint”.
We designed a 12 hour sliding window strategy in order to process the shortest data segment
possible without degrading the accuracy of ZTD estimates. The Gauss-Markov process
provides an implicit constraint on the ZTD estimate at a given epoch from observations at
preceding and following epochs, which means that the accuracy is expected to be lower at the
beginning and end of each window. We therefore extract ZTD estimates from the middle 4
hours of the window and then move the window forward by 4 hours.
Station coordinates are constrained to values from a precise long term geodetic solution in
order to avoid any correlation between coordinates and ZTD estimates. Any errors in the
coordinates, in particular the height component, would otherwise directly bias the estimated
ZTD. Tregoning et al. (1998), for instance, showed that a 5 cm height error at a fixed station
could map into a 0.5 mm ZTD bias at another site 800 km away. Precise estimates of both
station coordinates and velocities in the same reference frame as the IGS satellite orbits are
needed to take into account the station position change caused by global and regional tectonic
movements. We therefore compute a geodetic solution from the data accumulated on a
weekly basis in order to account for the GPS site motions and to ensure the best possible a

Haase et al., 2002, ZTD Water Vapor in the Western Mediterranean submitted to Bull. Am. Meteor. Soc.
12
priori site position. We tightly constrain the positions of 6 stations of the IGS network
(GRAZ, KOSG, NOTO, VILL, WTZR, ZIMM) to the latest ITRF97 values and the satellite
orbits to the final IGS ephemerides. We fit new parameters to the IGS ephemerides in order to
have smooth orbit estimates across the day boundary. These processing parameters are
summarized in Table 1.
To refine our data processing strategy, we performed a systematic test of all the parameters
that could have a significant impact on the ZTD estimates during the GPS analysis: the cut-off
satellite elevation angle, the tropospheric constraint, the variation of orbit quality (using SIO,
JPL, and IGS precise final orbit products), the reference network, and uncertainties in station
coordinates. The test network included the MAGIC reference network (6 IGS stations) and 8
other stations, most of them having radiosonde observations within 50 km. We performed the
test on a data set that covers the period from May 10 to June 10, 1999. The maximum
differences are on the order of 0.1 ± 1.5 mm of delay. In addition we compared the solutions
of the three processing centers (ASI, CNRS, IEEC) using different software packages and
strategies and found differences of 1 ± 7 mm delay. This standard deviation of 7 mm is the
best estimate of the random error of the GPS ZTD measurements.
For the main objectives of the MAGIC project, the GPS derived ZTD rather than integrated
water vapor will be used directly as an assimilated variable in the 3D variational system.
However, at 8 stations of the network, surface pressure measurements are available. For these
sites, the hydrostatic delay is calculated and the ZTD are transformed routinely into integrated
water vapor (IWV) for validation purposes in the following manner.

Haase et al., 2002, ZTD Water Vapor in the Western Mediterranean submitted to Bull. Am. Meteor. Soc.
13
Saastamoinen 1972 (see also Davis et al. 1985) derived an expression for the ZHD given in
Eq 5 using the hydrostatic assumption and adopting a standard atmospheric temperature
profile. This yields a function for the gravitational acceleration at the center of mass of the
atmospheric column which is a function solely of latitude, θ, and height above the geoid, H:
Eq 8 ( ) ( )00.0022768 0.0000005 m/hPa,
PZHDf Hθ
= ±
where Po =surface pressure in hPa and
Eq 9 ( )29.784 m/s , 0.0001mg f Hθ= ⋅ ± , and
Eq 10 ( ) 1, 1 0.00266cos 2 0.00028 kmf H Hθ θ −= − − ⋅ .
In order to derive an expression for wet delay, following Askne and Nordius (1987), we
define the mean temperature of water vapor in the atmospheric column as
Eq 11 ant
ant
toa
vz
m toav
z
dzT
dzT
ρ
ρ=∫
∫.
The definition of integrated water vapor, IWV, in kg m-2 of a column above height zant is
defined as
Eq 12 ant
toa
vz
IWV dzρ= ∫
Using these expressions, the wet component of the delay, ZWD can be written as
( )6 6 31 210 10d d
m
R R k IWVZWD k k IWVT
εε ε
− −= − + +
Haase et al., 2002, ZTD Water Vapor in the Western Mediterranean submitted to Bull. Am. Meteor. Soc.
14
and this can be inverted to solve for IWV.
Eq 13 6
31 2
10
vm
IWV ZWDkR k kT
ε=
− + +
Bevis et al. 1992 derived a linear relationship between Tm and the surface temperature, Ts,
based on radiosonde profiles from 9000 sites in the United States:
Eq 14 70.2 0.72m sT T= +
in order to estimate IWV without access to information about the whole atmospheric column
to provide Tm. Emardson and Derks (1998) improved the derivation of Tm by fitting 120,000
radiosonde profiles from 30 sites in Europe with a quadratic regression. This is the formula
that we use to transform ZWD to IWV.
Eq 15 ( )20 1 2ZWD a a T a T IWV= + ∆ + ∆ ⋅
where s avT T T∆ = − , and Ts is the surface temperature, and where Tav, a0, a1, and a2 are the
following constants
Eq 16
o
3 -10
2 3 -1 o -11
5 3 -1 o -22
283.49 K
6.458 m kg
1.78 10 m kg K
2.2 10 m kg K
avT
a
a
a
−
−
=
=
= − ×
= − ×
While previous studies have concentrated on demonstrating the quality of GPS-derived IWV,
we have concentrated on evaluating zenith tropospheric delay as the final product rather than
precipitable water or integrated water vapor. This is done, first of all, because the ZTD is a
more direct product of the raw GPS observations, free of errors due to pressure sensors and
Haase et al., 2002, ZTD Water Vapor in the Western Mediterranean submitted to Bull. Am. Meteor. Soc.
15
uncertainties in the derivation of Tm. Secondly, ZTD is expected to become the preferred
measure in modern NWP models using 3D or 4D variational data assimilation. Such systems
combine different types of observations with a recent forecast field in an optimal way,
resulting in the statistically best estimate of the current state of the atmosphere. For this to
work properly, a precise statistical description is necessary for the errors of each type of
observation (and their eventual correlations), as well as the errors of the forecast variables. If
supplementary observations at the GPS site exist, it is beneficial to assimilate them in parallel
with ZTD in the NWP systems, rather than use them to transform ZTD to IWV. However,
certain data assimilations systems need IWV rather than ZTD. Similarly IWV will be
preferred in certain types of climate studies. Note that 1 kg /m2 of IWV or 1 mm of PW
corresponds to approximately 6.4 mm of zenith tropospheric delay.
3 Characteristics and time variability of the GPS ZTD data
The GPS ZTD time series have been analyzed for 2.5 years for the majority of the 51 sites of
the network. The ZTD time series for a typical station, such as SJDV in France (Figure 2),
shows an annual variation with lower values in the winter and higher values in the summer
months. The annual variation in ZTD ranges from 25 mm to 75 mm depending on the site,
with most sites around 40 mm to 50 mm (Figure 4). Sites on the Atlantic coast have lower
annual variation, probably because of the moderating effect of the ocean on climate (Figure
5). Sites on the lee side of the Alps have higher annual variation, possibly due to the
combined effects of a rain shadow in the winter and high moisture from the Mediterranean in
the summer. The annual variation is due primarily to the wet component, even though the wet
delay is only 5% of the total delay.
Haase et al., 2002, ZTD Water Vapor in the Western Mediterranean submitted to Bull. Am. Meteor. Soc.
16
We estimate the higher frequency variability by taking the RMS of the ZTD time series after
removing the annual variation as the best fit sinusoid. This higher frequency variability ranges
from 22 to 40 mm of delay, once again primarily due to the wet component. The variability
depends on the total water vapor content and hence shows a dependence on altitude of the
station (Figure 6). Inland stations tend to have lower variability. Sites with some of the
highest variability are found at coastal Mediterranean stations. The northern Mediterranean
stations in particular are located in a region well known for large abrupt changes in the
weather. (Figure 7).
An oft cited advantage of the GPS ZTD data relative to other sources of data is the high
possible sampling rate, up to 1 every 5 minutes, which comes at no extra operational cost. The
spatial resolution of the GPS ZTD data is effectively limited by the averaging of raw
observations over an elevation angle range from 10 degrees to vertical. This corresponds to a
radius of 45 km for a tropospheric scale height of 7.5 km, and a radius of only 11 km for a
humidity scale height of 2 km. To the degree that local atmospheric changes mainly due to
advection, and with an average velocity of transport of air masses on the order of 30 km/h,
this implies that independent measurements of the humidity structure would be made at about
40 minute intervals. The ZTD sample rate of 1 per 15 minutes used in the processing is above
the Nyquist frequency. The ZTD variance constraint applied in the processing is a power
density of 2 cm/hour1/2. This temporal constrain produces solutions with a lower effective
time resolution that remains consistent with the rapidly sampled (60 second) raw GPS phase
data observations. Though the same constrain was applied to all sites, we found that the true
variance of the data is different depending on the geographic location.
Haase et al., 2002, ZTD Water Vapor in the Western Mediterranean submitted to Bull. Am. Meteor. Soc.
17
Structure functions are one way to characterize the temporal variability of the time series, as
has been carried out by Jarlemark and Elgered (1998). We calculate structure functions, D,
for the ZTD time series using the definition
Eq 17 ( ) ( ) ( ) 2D ZTD t ZTD tτ τ ≡ + − ,
where t is the time epoch of the measurement, τ is the time lag, and the angle brackets indicate
expected value or average. The structure function generally follows a power law
Eq 18 ( )D c ατ τ= × ,
where c is a constant, termed the variance rate, and α is the power-law index, with values
ranging between 1, (Jarlemark and Elgered 1998) and 2/3 (Treuhaft and Lanyi 1987).
Examples of average structure functions from two high latitude sites (ZIMM and WTZR) and
two low latitude sites (NOTO and LAMP) for the entire length of the time series are shown in
Figure 8. The value at the lower limit time lag indicates the sample to sample variance at 30
minute intervals. We fit a constant, c, to the structure function for each site for time lags from
30 minutes to 2.5 hours assuming a value for α of 1. We find a variance rate that varies from
500 to 2000 mm2/day, depending on the site, with sites at lower latitudes in general having
higher variance rates. The time variability and its latitudinal dependence will be discussed
further in the HIRLAM comparison section.
We examine how much of that variability is predictable from surface measurements. This
gives an indication of the potential information contained in the ZTD data on the upper
atmosphere beyond that contained in surface measurements and simple climatological models,
and describes the relative weight of ZTD compared to surface measurements for NWP
models. The wet delay is positively correlated with the temperature. This is due to the

Haase et al., 2002, ZTD Water Vapor in the Western Mediterranean submitted to Bull. Am. Meteor. Soc.
18
combined effects of increasing evaporation and a strong increase in the water vapor saturation
pressure. For the time series from SJDV, the correlation coefficient between ZWD and surface
temperature is 0.72 (Figure 3).
The ZWD is also correlated with surface humidity. Mendes (1999) reviewed the accuracy of
several models for calculating ZWD based solely on surface parameters and a simple
functional dependence on height. Based on an analysis of radiosonde data, he determined that
the ZWD could be predicted with a standard deviation of ±27 mm for sites in the continental
US. We calculate a regression fit to ZWD as a function of specific humidity measured locally
at the antenna height, qsurf. This gives a correlation coefficient of 0.88 and a residual of
±23.9 mm.
Eq 19 41.7555 10 5.0 23.9 mmsurfZWD q= × ⋅ − ±
The mean wet delay over this time period is 123.0 mm. The standard deviation of ±23.9 mm,
which is not correlated with surface humidity measurements, is due to the humidity variations
in the upper atmosphere. This upper atmosphere signal is four times greater than the 7 mm
precision level of the GPS ZTD data that was estimated from the processing methodology
inter-comparison.
4 Comparison with radiosonde data
Radiosondes are the primary operational source of upper air humidity observations, therefore
they are a good source of independent validation data for demonstrating the potential value of
GPS ZTD data for future assimilation.
Haase et al., 2002, ZTD Water Vapor in the Western Mediterranean submitted to Bull. Am. Meteor. Soc.
19
4.1 Radiosonde Data Processing
The radiosonde profiles come from the World Meteorological Organization (WMO) Global
Telecommunications Service (GTS) and for the purpose of this project are provided by the
Danish Meteorological Institute. As part of the automatic processing procedure, we download
radiosonde data regularly from the DMI for launch sites closer than 50 km to the GPS sites.
The radiosonde profiles contain measurements of temperature and dew point temperature as
function of pressure. To generate values from the radiosonde profiles that are directly
comparable to the GPS ZTD data, the integral in Eq 3 is transformed from an integral over
geometric height to an integral over pressure, using the assumption of hydrostatic
equilibrium, ( ) ( )dP g z z dzρ= −
Eq 20 6 6 31 1 2
0 0
1 110 10ant antP P
d vkZTD k R dP R q k k dP
g g Tε− − = + − + +
∫ ∫ ,
where Pant is the pressure at the antenna height, and q= ρv/ρ is the specific humidity.
The calculation of the ZTD from RS records for comparison with GPS ZTD is done in a
number of steps: 1) Quality checking of radiosonde profiles. 2) Conversion of dewpoint
temperatures to relative and specific humidity. 3) Transformation of the radiosonde profile to
correct for altitude offsets between GPS and radiosonde sites. 4) Numerical integration of the
transformed profile, calculating separately ZHD, ZWD, and IWV and compensating for the
change in g with pressure. 5) Addition of the contribution to delays from above the
radiosonde profile.
Quality checking of radiosonde profiles. First we reject profiles that start high above ground
level leading to initial pressure levels that are not within 100 hPa of that expected for a
Haase et al., 2002, ZTD Water Vapor in the Western Mediterranean submitted to Bull. Am. Meteor. Soc.
20
standard atmosphere at that latitude and altitude. Then we reject profiles that have large gaps
(greater than 200 hPa) in pressure between recordings of temperature or humidity. These are
not well suited for numerical integration under the applied assumptions and can lead to
systematically erroneous results. For example, in common reporting practice, low values of
humidity data are often discarded as unreliable if the air temperature is below -40oC. This
means that a decrease in humidity within the profile at the 100-200 mbar level can go
undetected.
Conversion from dewpoint temperatures to specific humidity. The actual radiosonde
ground station equipment measures relative humidity, but the data are converted to dew point
temperature, Tdew, before being transmitted to the WMO GTS. There is no common agreement
on the method of conversion, consequently systematic biases can be introduced when
converting back to relative or specific humidity using a different, albeit precise method (Elms
2000). The bias is on the order of 2.3 mm ZTD between certain standard conversion formulae
(Vedel et al. 2000). We attempt to remove this bias, by carrying out the following steps.
First we find the best approximation to the relative humidity measured by the radiosonde. We
do that by inverting the conversion formula used by Digicora radiosonde stations, the most
widely used in Europe, leading to,
Eq 21 ( )( )
approx dew
approx
esat Trh
esat T≈
where Tdew, and T are taken from the GTS radiosonde report, and the function for the
saturation pressure, esatapprox, is given by
Eq 22 ( )3 02
4
expapprox
R T Tesat R
T R−
= −
with 2 611.21R Pa= , o3 17.502R K= , 4 32.19oR K= and 0 273.16oT K= .
Haase et al., 2002, ZTD Water Vapor in the Western Mediterranean submitted to Bull. Am. Meteor. Soc.
21
This approach gives good estimates of relative humidity in an average sense (Vedel 2000;
Vedel et al. 2000). In general, if the conversion formula used at a particular radiosonde station
is known and is different from a Digicora station, or if the measured relative humidity is
available directly, then those appropriate values should be used.
Secondly, the calculated estimate of the measured relative humidity is converted to the
specific humidity using a more precise formula (taken from the NWP HIRLAM model, e.g.
(Sass et al. 1999) ),
Eq 23 ( )( )( )1
HIRLAM
HIRLAM
rh esat Tq
P rh esat Tε
ε⋅ ⋅
=− ⋅ −
with P and T provided from the radiosonde report and rh from Eq 21. The formula for
esatHIRLAM is given by
Eq 24 ( )3 02
4
expHIRLAM
R T Tesat R
T R−
= −
with R2= 610.78 Pa, T0=273.16o K, R3_ice=21.875o K, R3_liquid=17.269o K, R4_ice=7.66o K,
R4_liquid=35.86o K, with the 'ice' constants being used below -15 oC and the 'liquid' constants
above freezing, and a gradual change, linear in T, from the ice constants to the liquid
constants over the -15 to 0 oC interval. The use of different constants is an ad hoc way to
mimic the existence of a three phase medium in that temperature interval.
Correction for altitude offsets between sites. The GPS and radiosonde sites are not co-
located. For the comparisons we have selected pairs with separations less than 50 km, which
will limit the effects of horizontal variations in atmospheric properties. It is necessary,
however, to correct for vertical offsets, because the delay is a strong function of surface
Haase et al., 2002, ZTD Water Vapor in the Western Mediterranean submitted to Bull. Am. Meteor. Soc.
22
pressure or mass which varies strongly with altitude. The largest altitude offsets are on the
order of 1.7 km, but most are much smaller.
In general, altitudes in meteorology are given relative to mean sea level. The GPS heights,
which are geometric heights relative to the WGS84 ellipsoid, are converted to heights above
the local geoid representing the equipontential surface of the gravity potential at mean sea
level. We use the geoid model EGM96 (Lemoine et al. 1997).
For GPS antenna levels above the lower most radiosonde level, the properties at the antenna
level are found by interpolation in the radiosonde profile. Within levels, it is assumed that ∆z
is proportional to ∆lnP, ∆z is proportional to ∆T, and ∆lnP is proportional to ∆q. For GPS
antenna levels below the radiosonde launch level the properties at the antenna level are
estimated by extrapolation. Here it is assumed that ∆z is proportional to ∆lnP, the temperature
lapse rate of –0.00655oK/m is constant with altitude, and relative humidity is constant at the
value of the lowermost radiosonde level. The outcome in both cases is a transformed profile,
valid from the GPS antenna level to the top of the radiosonde record.
One could consider using a scheme that shifts the lower part of the profile to the height of the
GPS antenna such as that which is used in the HIRLAM calculations (Majewski 1985) in
order to preserve the boundary layer structure present in the radiosonde profiles. However, the
resolution of the boundary layer varies dramatically in the radiosonde records, making the
necessary software too complex in view of the other uncertainties present in the comparisons.
Integration of ZHD, ZWD, and IWV over the transformed radiosonde profiles. ZTD is
calculated as the sum of the hydrostatic and wet delays. The contributions to both terms from
the transformed profiles are found by numerical integration. Having access to both T and P,
we can study the precision of the Saastamoinen formula for the hydrostatic term that is based
on an assumption about the temperature profile being constant.

Haase et al., 2002, ZTD Water Vapor in the Western Mediterranean submitted to Bull. Am. Meteor. Soc.
23
In the integrations we model g as,
Eq 25 2
( ) ss
s
Rg z gR z
= +
where ( )2 2 21 29.780356 m s 1 sin sin 2sg a aθ θ−≈ ⋅ + + , 3
1 5.2885 10a −= × , 62 5.9 10a −= − × ,
Eq 26 ( )2 2 2/ sin cos
es
e p
RRR R θ θ
≈+
6378.1 kmeR ≈ , and the average pole radius is 21.5 kmp eR R≈ − (Lide 1992). Using instead
a constant value of g will result in significant offsets. For g = 9.80665 m/s2 such a bias is of
the order –5 mm at mid latitudes.
The relation between pressure and height is determined from the hydrostatic equation and the
equation of state, yielding
Eq 27 11 1 lndR T q P g zε
− − ∆ = − ∆
We use this to numerically calculate g as a function of pressure, which is then used in Eq 20
to find ZTD. We do not use the geopotential heights provided in the radiosonde data which
are based on certain assumptions for g. When interpolating during the numerical integration
for the delays we use the same assumptions (linear for temperature and specific humidity,
exponential for pressure) as when correcting for altitude offsets described above.
The integrated water vapor is calculated by numerical integration of Eq 28 (which is exact for
a hydrostatic atmosphere), once again taking into account the height variation of gravitational
acceleration, and the difference in height between the GPS antenna and the radiosonde launch.

Haase et al., 2002, ZTD Water Vapor in the Western Mediterranean submitted to Bull. Am. Meteor. Soc.
24
Eq 28 0
siteP qIWV dPg
= ∫
Contribution from above the measured profiles. The first term of the integral in Eq 20, the
hydrostatic component, includes a significant contribution from above the radiosonde profile.
We derive an expression for that based on the assumptions of a hydrostatic atmosphere,
constant temperature from the top of the radiosonde profile and above, and
Eq 29 2
11
1
( ) s
s
R zg z gR z z
+= + +
which gives
Eq 30 ( ) ( )
2
1 1 1 1
1 1 1 1 1
1 2 2d d d
s s
k R P R T R TZHDg R z g R z g
∆ ≈ + + + +
with T1, g1, z1, and P1 being the values at the top of the known profile. ∆ZHD is added to the
ZHD derived by numerical integration over the measured profile, yielding the total ZHD. The
water vapor density is negligible above the top of the radiosonde profiles, therefore no
contribution is added to ZWD or IWV.
The results for the hydrostatic component, ZHD, are found to be very close to the results
based on the Sastamoinen formula, with maximum systematic offsets of less than 0.5 mm of
delay (Vedel et al. 2001). The assumption of a constant temperature profile, as adopted by
Sastamoinen, has no significant negative effect upon the estimate of ZHD, and the
Sastamoinen formula can in general safely be used to estimate ZHD from the surface pressure
data.
Haase et al., 2002, ZTD Water Vapor in the Western Mediterranean submitted to Bull. Am. Meteor. Soc.
25
In the comparisons, it important to keep in mind that the radiosonde data also have errors
associated with them. There are random errors in the temperature of ±0.5 oC. The relative
humidity sensor has errors of ±2-3%. There are gross outliers that are removed to some extent
by the screening employed above. More importantly there may be systematic errors in the
radiosonde data (Eskridge et al. 1995; Parker and Cox 1995). Historically, these have been
due to differences in instrumentation, though instrumentation in western Europe has become
standardized before the start of our experiment. Thermal lag and radiative characteristics of
radiosonde thermometry affect the perceived pressure level at which temperature
measurements are reported. These lag and radiative effects increase with height. Daytime
radiation corrections are typically -7 oC between 100 hPa and 30 hPa. Since these vary with
solar radiation, then the time of launch as well as balloon size, and rate of ascent can produce
errors in the data. These errors show up as systematic differences between night and day
radiosonde launches (WMO 1996). Systematic differences in albedo (over ocean surfaces or
clouds) also increase errors in the radiative corrections. Data processing algorithms for
treating humidity measurements below 20% and those made at low ambient temperatures
have been inconsistently applied (Elliott and Gaffen 1991; 1993; Wade 1994). Liljegren et al.
(1999) have shown that the age of the radiosonde at the time of launch has contributed to
biases in the humidity measurements which led to differences up to 2 mm of integrated water
vapor if uncorrected. These possible error sources will be considered in later discussions of
the comparison results.

Haase et al., 2002, ZTD Water Vapor in the Western Mediterranean submitted to Bull. Am. Meteor. Soc.
26
4.2 Results of the GPS-Radiosonde Comparison
We compared GPS and radiosonde-derived ZTD calculated at the 13 GPS stations for which
we have radiosonde profiles nearby (Table 2, Figure 1). Because of the uncertainty between
the atmospheric state at the two sites which may be separated by as much as 50 km, there is a
limit to the level of agreement that can be expected. However, the extremely low scatter of the
residuals shows very good agreement of the two data sets.
Table 2 and Figure 10 show the result of the comparison, together with the horizontal
separation and difference in altitude between the GPS and the radiosonde launch sites. The
standard deviation of the residuals is ±12.3 mm, which is the equivalent of approximately 2
kg/m2 of integrated water vapor error. 9 sites show small biases, less than 7 mm of delay, but
which are systematically positive (GPS ZTD greater than RS ZTD). The standard deviation
for the best sites is near the level obtained in the comparisons carried out between different
GPS processing centers, ±7 mm, indicating that the agreement is at the limit of the precision
of the GPS technique. The correlation coefficients between the data sets are very high, greater
than 0.9 at all sites (Figure 11, Figure 12).
There is no correlation of the bias with the altitude difference between the radiosonde launch
site and the GPS site (Table 2). This demonstrates that the height correction applied before
integration of the radiosonde profiles was successful in removing the first order effects of this
difference, even for sites with vertical offsets as large as 1700 m. If uncorrected, the
difference in ZTD would be on the order of 0.28 mm of delay per meter of height difference.
These sites where large vertical corrections were necessary tend to be sites in mountainous
regions where, due to the high altitude, the integrated water vapor is generally lower. NWP

Haase et al., 2002, ZTD Water Vapor in the Western Mediterranean submitted to Bull. Am. Meteor. Soc.
27
algorithms must take into account the vertical offset between the GPS observation altitude and
the model orography before the data can be assimilated.
The standard deviation of the radiosonde residual and the bias show a dependence on the
absolute site altitude, with the lowest altitude stations having much higher residuals. The low
altitude stations also have the highest humidity and the horizontal variability between the GPS
and radiosonde site is probably greater. There is some dependence of the standard deviation of
the residuals on the latitude of the site, which could also be due to the fact that the low
latitude sites are more humid. This is discussed further in the HIRLAM comparison.
Figure 14 displays the one-year time series at these 13 sites, and their residuals. There is a
strong seasonal signal that is visible in the residual time series, with the standard deviation
significantly higher in the summer than in the winter. The mean and the standard deviation of
the residuals are calculated for each station for each month (Figure 15). The standard
deviation increases from about 7 mm ZTD in the winter to about 15 mm ZTD in the summer.
A few sites, such as CAGL and CART have exceptionally high residuals. The level of
agreement of 7 mm ZTD for most sites during the winter months indicates that the
measurements are consistent with the precision level of the GPS ZTD measurements.
The distribution of the residuals is bimodal. For example, at MEDI, the radiosondes launched
at noon show a bias of 6.5 mm, while the ones launched at midnight show a bias of 0.3 mm.
There is no significant difference in the standard deviation of 8.1 versus 8.9 mm. This is true
for the entire data set. Furthermore, the mid-day bias varies seasonally, but the midnight bias
is relatively constant over the year (Figure 17). One cannot argue that the biases are higher

Haase et al., 2002, ZTD Water Vapor in the Western Mediterranean submitted to Bull. Am. Meteor. Soc.
28
during the day because of higher humidity and higher variability, because we show that the
mean GPS ZTD is the same during the day and during the night (Figure 17c). This indicates
that the seasonal biases between the GPS and the radiosondes seen in Figure 15 and Figure 17
are most likely due to the day-night humidity bias present in the radiosonde measurement,
rather than in a humidity bias related to the GPS measurement. The fact that this day-night
radiosonde bias scales with humidity produces the seasonal dependence. This day-night bias
of radiosondes has been documented in simultaneous flight tests comparing many standard
radiosondes against a reference radiosonde (WMO 1996). Our results indicate the effects of
these biases on the humidity measurements. On the other hand, we have no basis for
distinguishing the origin of the small positive bias of GPS ZTD relative to the midnight
radiosonde data, which could equally likely be attributed to a GPS or a radiosonde error
source. The standard deviation of the GPS minus radiosonde ZTD has the same seasonal
variation both in the mid-day and the midnight radiosonde comparisons.
Throughout the comparisons that we carried out, correlations exist which indicate that the bias
and the standard deviation increase with increasing humidity. This is particularly obvious in
the monthly comparisons where there is a higher standard deviation for higher humidity
summer months. It is also clear in the elevation dependence of the standard deviation, where
low elevation stations which are closer to sea level have higher humidity and a high standard
deviation of GPS-radiosonde residuals. High altitude stations, even though there may be a
large topographic height correction applied, generally have much lower biases and standard
deviations because they tend to have less overall humidity. This also shows up in the
comparisons where the standard deviation of the residuals increases with lower latitude
stations, consistent with higher averages of water vapor content at lower latitudes.

Haase et al., 2002, ZTD Water Vapor in the Western Mediterranean submitted to Bull. Am. Meteor. Soc.
29
The observation of an increase in standard deviation of the residuals with increasing humidity
could have several possible origins, either in the GPS ZTD data, the radiosonde data, or the
natural variability of the water vapor fields themselves. The summertime standard deviation
of 15 mm ZTD would correspond to an error of approximately 2-3 kg/m2 of integrated water
vapor, or 6 to 9% of typical values of integrated water vapor for these stations. This is
significantly higher than the specified random error level of the radiosonde humidity sensors,
which is nominally less than 5%. The most likely source for this seasonally dependent error is
the spatial variability of the humidity fields. During periods of high humidity, the distribution
of water vapor is more heterogeneous, thus more likely to have significant lateral variations in
the structure that would lead to higher disagreement between the GPS and radiosonde
measurement sites.
Figure 18 shows the type of results for integrated water vapor (IWV) obtained routinely at the
station SJDV near Lyon, France. The comparison with radiosonde measurements shows a bias
of 0.4 kg/m2 and a standard deviation of 2.3 kg/m2. The level of agreement is consistent with
previous studies (Bevis et al. 1992; Rocken et al. 1995; Duan et al. 1996; Emardson et al.
1998; Tregoning et al. 1998), and slightly better in terms of bias. The better agreement could
be caused by the fact that, having processed a very long time series, our estimates of the bias
is less sensitive to transient signals in the humidity.
5 Comparison with the DMI HIRLAM NWP model
A version of the operational HIRLAM model running at DMI centered on the western
Mediterranean has been implemented specifically for the MAGIC project. The model has a
Haase et al., 2002, ZTD Water Vapor in the Western Mediterranean submitted to Bull. Am. Meteor. Soc.
30
resolution of 0.3 degree with 31 vertical levels. The region extends from -33o to 39.3o in
longitude and from 24o to 55.5o latitude. Analyses (assimilation of new observational data
without including the GPS ZTD data) are made every six hours (00, 06, 12, 18 UTC). The
maximum forecast length for the data provided are six hours. The boundary fields come from
the European Centre for Medium Range Weather Forecasting (ECMWF). Except for the
limits of the region and the necessary modifications to extract the data for the MAGIC
project, the model we run is the same as the operational model being used at DMI.
We calculate the ZTD values from the model fields of HIRLAM, extracting the data at the
locations of the GPS points every 15 minutes from the 6 and 12 hour forecast run. The
properties of the atmosphere above each GPS site are calculated first by a horizontal
interpolation within the HIRLAM grid. Second a vertical transformation is applied to the
atmospheric profile at the GPS site to allow for the offset in altitude between the HIRLAM
surface and the real surface (the specified altitude of the GPS antenna). Here we adopt a
method described by Majewski (1985), which is widely used for mapping meteorological data
from one model grid to another. After the vertical shift of the atmospheric profile, we derive
estimates of the 2 m temperature and 2 m humidity. Then we carry out a numerical integration
of the model fields to estimate ZTD, ZWD, and IWV at the GPS antenna level. The
integration uses the same methodology as that used for the radiosonde profiles.
The comparison statistics between the ZTD values extracted from HIRLAM and those
derived from the GPS analysis are shown in Figure 19 and Figure 20. The bias in ZTD is
3.4 mm, with a standard deviation of 18.1 mm. The equivalent error in terms of IWV,
assuming most error is associated with the wet component and not the hydrostatic component,
would correspond to 0.5 kg/m2 bias and 3 kg/m2 standard deviation. These results are close to

Haase et al., 2002, ZTD Water Vapor in the Western Mediterranean submitted to Bull. Am. Meteor. Soc.
31
those obtained by Kuo et al. (1996) and Yang et al. (1999), which are on the order of
0.5 kg/m2 bias and 2.5 kg/m2 rms. The bias and standard deviation for the 6 hour forecast is
not significantly different than the 12 hour forecast.
The correlation between the GPS and HIRLAM ZTD is high, but lower than that for the
radiosonde ZTD. The correlation decreases for lower latitude sites (Figure 21). Typical
correlation plots are shown in (Figure 22).
Figure 23 shows a positive correlation between the standard deviation of the GPS-HIRLAM
residuals and the altitude of the GPS sites: the agreement between GPS and HIRLAM
increases when the altitude of the site increases, contrary to what might be expected given the
resolution of the model orography. This is consistent however with the observation that the
agreement is better for low humidity and hence low humidity variability situations. It is also
consistent with the GPS – radiosonde residuals. The bias is systematically positive for all but
three stations.
There is a strong correlation between the standard deviation of the GPS - HIRLAM residuals
and the latitude of the site (Figure 23). While there are three low latitude sites with high
standard deviation in the GPS- radiosonde comparison, the correlation is not as obvious, and
the standard deviation is not nearly as high as for the GPS- HIRLAM comparison. This
indicates that HIRLAM does not model the moisture as well at low latitudes. This is not
unexpected for the implementation of HIRLAM at the Danish Meteorological Institute which
has been tuned to run within higher latitude limits. It could also be the case that HIRLAM
forecasts better for high latitudes where dynamical forcing dominates, rather than in the

Haase et al., 2002, ZTD Water Vapor in the Western Mediterranean submitted to Bull. Am. Meteor. Soc.
32
Mediterranean where the evolution of heterogeneous high humidity fields may be more
dominated by physics. It could also be indicating that the scale of variability is smaller or has
higher temporal variability at low latitudes which HIRLAM is less adapted to model. In any
case, the humidity information provided by GPS would be expected to have the greatest
impact for assimilation in lower latitudes, based on this observation.
There is no obvious correlation between the HIRLAM-GPS bias and standard deviation and
the proximity of a radiosonde launch site. The agreement might be expected to be better since
the humidity information in HIRLAM derives almost exclusively from the radiosonde
observations. However that is not the case.
Once again, there is a strong seasonal signal in the residual time series, with the standard
deviation significantly higher in the summer than in the winter. The mean and the standard
deviation of the residuals are calculated for each station for each month (Figure 24). The
standard deviation increases from about 12 mm ZTD in the winter to about 24 mm ZTD in the
summer. All sites are well above the 7 mm level of precision of the GPS ZTD measurements.
The mean across the network is around 5 mm ZTD. In contrast to the GPS – radiosonde
comparison, this mean does not vary between noon and midnight measurements, and is very
similar to the midnight mean GPS – radiosonde comparison. Both have no clear dependence
on the season and have an exceptionally low bias for the month of February 2000. Because it
occurs in both comparisons, we suspect that the relatively stable 5 mm level positive bias may
be a characteristic of the GPS observations, though the source of this bias is unknown.
6 Error correlations
Haase et al., 2002, ZTD Water Vapor in the Western Mediterranean submitted to Bull. Am. Meteor. Soc.
33
Part of the GPS ZTD data assimilation methodology development that is undertaken in the
MAGIC project requires the characterization of the errors, and in particular, the investigation
into the horizontal correlation structure of the data errors. The GPS-radisonde residuals are
calculated at each epoch for a given pair of GPS stations, and then the correlation coefficient
between the residuals is calculated. The correlation coefficient is plotted as a function of the
distance separating the pair of GPS stations in Figure 25. This is done for each pair of stations
that have nearby radiosonde data. The GPS-radiosonde residual can be considered an estimate
of the error, and for the purposes of assimilation into NWP models, it would be preferable that
the errors at one GPS site were not correlated with another GPS site. However, there is some
indication that the correlation coefficient is higher for GPS stations pairs that are closer
together. The correlation coefficient is less than 0.3 after 600 km separation, but there are not
enough data from the 13 GPS stations to determine with confidence the distance dependence
of the error correlation at short distances.
The same is done for the GPS – HIRLAM6 residuals (Figure 26). Once again, the residuals
are calculated at each time for a given pair of GPS stations, and the correlation coefficient
between the residuals is calculated. The correlation coefficients are plotted as crosses in
Figure 26 as a function of the distance separating the pair of GPS stations. Here there are
enough data to average the correlation coefficients over bins in 25 km distance ranges, shown
as circles. Here, the correlation drops off quickly and on average is below 0.3 at less than 200
km distance, but there are a significant number of station pairs that have a correlation greater
than 0.3 between 200 and 400 km. An e-folding scale on the order of 200 km is not unrealistic
for error correlations near the ground for HIRLAM variables, but further studies are needed to
clarify how much of the correlation can be attributed to the GPS data.

Haase et al., 2002, ZTD Water Vapor in the Western Mediterranean submitted to Bull. Am. Meteor. Soc.
34
7 Discussion
In this section we discuss the implications the error characteristics of the data have for on-
going and future assimilation tests. Then we discuss the main problem in dealing with the
data: handling the relatively large biases that vary significantly over the time scale of a month.
Finally we review the possible remaining sources of error that merit further investigation in
both the radiosonde and GPS data set.
The objective of this study was to investigate the potential for improving initial humidity
fields in NWP models based on the available quality of the data. The outlook is promising
because of the better agreement of the GPS ZTD data with the radiosonde data than with the
HIRLAM fields. The GPS-HIRLAM residuals have a standard deviation of 18 mm ZTD. To
put this in context, the standard deviation of the ZTD time series with a sinusoidal yearly
signal removed is 33 mm, and the standard deviation of the ZTD minus an estimated ZTD
based on a linear regression on the surface humidity is 23 mm. Therefore, there is on the order
of 24 mm of variation in the ZTD data due to the signal from upper level humidity. The best
estimate of the precision of the GPS data is 12 mm based on the radiosonde comparison.
Thus, there is a potential additional variance reduction of at least 55% to be achieved in
assimilating the GPS ZTD data compared to the 40% variance reduction in going from
surface predictions of total column humidity to the HIRLAM modeled values. An important
further benefit from GPS ground observations is the order of magnitude increase in reporting
frequency compared to present observations of the upper air humidity field: observations are
available at fractions of hours compared to the typical launch frequency of 12 hours for
radiosondes. Likewise they will increase the spatial resolution of the upper air humidity

Haase et al., 2002, ZTD Water Vapor in the Western Mediterranean submitted to Bull. Am. Meteor. Soc.
35
observing network, which is currently poorer than for most other important atmospheric
properties.
The GPS data processing strategy has been modified to run in near real-time (Ge et al. 2000).
In operational weather prediction, meteorological observations are typically assimilated every
6 hours. With the new generation of meteorological satellite observations provided at intervals
of 1 h 40 minutes and the new generation of 4D variational models which can assimilate
observations made at any time rather than the historically chosen 6 hour intervals, the
reporting delay currently required by the World Meteorological Organization (WMO 1996) is
approximately 1 h 45 minutes at the latest. We have compared the NRT estimates to the
precise post-processed estimates of ZTD from one month of data at 15 sites in Western
Europe and there is a negligible bias and a standard deviation of less than 6.1 mm in the ZTD
estimates compared to using IGS final orbits. This is less than the 7 mm level of precision of
GPS-derived ZTD from IGS final orbits, based on the intercomparisons of results from
different software. While future operational assimilation would use the NRT estimates of
ZTD, currently the number of stations whose data are available in NRT in Europe is not
sufficient to carry out a detailed analysis. Therefore the results presented in this paper were
the post-processed estimates of ZTD derived from the final IGS orbits with a 2 week delay.
The total number of sites is rapidly approaching the number of radiosonde sites, 51 GPS sites
compared to 123 radiosonde sites used in this study. The installation of new GPS stations is
increasing at a rapid rate in Europe. This steady increase in the quantity of available data
compared to other observations will soon provide sufficient weight for definitive near real-
time NWP impact tests.

Haase et al., 2002, ZTD Water Vapor in the Western Mediterranean submitted to Bull. Am. Meteor. Soc.
36
Through the comparisons, we demonstrated that there is a significantly poorer fit of the
HIRLAM model to the GPS data as latitude decreases and as mean integrated water vapor
increases. This indicates that there is a high potential benefit for improving model forecasts in
the Mediterranean region in particular. The low latitude sea level sites with high humidity due
to their proximity to the warm Mediterranean Sea are particularly poorly modeled. This will
be tested in future assimilation studies.
The most important drawback to the current data set is the relatively large biases we have
shown in the comparisons. There is some indication that the errors are not random and
independent at the level of 1 kg/m2 of water vapor (about 6.4 mm ZTD). The biases at
individual stations in the radiosonde comparison exceed the equivalent of 1 kg/m2 in water
vapor. This does not reduce the potential impact of the GPS ZTD data, if the biases are
understood well enough to be removed. For example, if they are constant over some temporal
scale at each site, then the data can be empirically corrected and assimilated without serious
complications. The standard deviation is relatively well understood, and shows similar trends
in both the radiosonde and HIRLAM comparisons. It is well below the signal level, therefore
we do not expect it to pose any particular problems.
We also showed that significant biases exist in the radiosonde data that are most likely due to
day/night biases that reach up to 15 mm ZTD during humid summer months. Temperature
biases have been shown to exist in radiosonde comparisons where multiple types of
radiosonde equipment have been flown simultaneously with a reference radiosonde (WMO
1996). There is a background positive bias of less than 5 mm ZTD that is present in both day
and night radiosonde data comparisons that does not correlate with seasonal variations in
Haase et al., 2002, ZTD Water Vapor in the Western Mediterranean submitted to Bull. Am. Meteor. Soc.
37
humidity. This is the maximum likely bias that may be attributed to the GPS data or data
processing method.
The biases show a coherent regional pattern over time scales on the order of a month,
indicating that they are more or less typical for a given geographical location. In addition,
however, there is some seasonal variation in the amplitude of these biases. One possible
approach is to remove a monthly or weekly mean bias from the GPS ZTD data before
assimilation into a NWP model. However, it is not the best approach for considering future
applications for climate studies where the long term seasonal biases may interfere with the
interpretation of long term trends in the GPS ZTD data. Interestingly, long term biases are
small or non-existent in the comprehensive studies that have been carried out by NOAA in the
midwestern United States. The most obvious difference would be the scale of the topography
and resulting complications in synoptic weather patterns such as secondary cyclogenesis in
the Alps and Mediterranean, compared to the relatively flat and homogeneous land surface of
the mid-western US.
The GPS – radiosonde biases are not unambiguously correlated with the GPS – HIRLAM
biases, making it likely that there are several remaining sources of bias in the data sets. We
now provide a short discussion of these potential error sources.
7.1 “instrumental” GPS error sources
The mapping function describes the elevation angle dependence of the geometrical ray path
and assumes a horizontally stratified atmosphere with no azimuthal variations in the volume
sampled by the receiver. We use the Niell mapping functions which provide empirical
relations for that mapping based on atmospheric data sets with typical scale heights. If the

Haase et al., 2002, ZTD Water Vapor in the Western Mediterranean submitted to Bull. Am. Meteor. Soc.
38
average vertical structure at the site is significantly different from that on which the functions
were based, or varies seasonally, then this could create biases. The Niell mapping functions
have been shown to be the best average functions for reducing these biases (Fang et al. 1998;
Niell 2000b) and in fact, this is true for our data set as well, averaged across the entire
network. The regional and seasonal variations in the biases could be due to systematic local
variations, and should be the subject of further study. Some stations may be placed where the
axisymmetric assumption is not true over hours, days, weeks or even over the year. A site at
the coast, on average, may have a marked difference in atmospheric properties to the inland
and seaside, at least during periods of days and/or over the diurnal cycle during certain
weather conditions. Likewise, a site which has mountains to the one side and lowlands to the
other may not be symmetric because of differences in the boundary layer or problems with the
ability of the receiver to monitor down to the same elevation angle in all directions. Even for
axisymmetric structures, upper level moisture that creates a significant departure from an
exponentially distributed humidity profile would tend to produce a high bias from the
mapping function approximations. It would most likely create a positive bias, since the ray
path length variation would tend to be positive. The magnitude of any bias, based on the
differences that could be observed using a range of non-optimal mapping functions in past
studies (Fang et al. 1998; Dodson et al. 1999) would probably be on the order of 5-10 mm of
ZTD.
Local multipath of the GPS signal can cause systematic variations in the data at low
elevations that could possibly cause a bias in the ZTD. Normally, the geodetic sites that are
used here have good sky visibility and multipath reducing choke ring antennas in order to
reduce this effect. Recently, in the Japan GEONET network, it was found that the structure of
the geodetic monument changed the antenna phase center and multipath variations
significantly, leading to biases as large as 7 mm of ZTD (Ohtani 2002). The possibility that
Haase et al., 2002, ZTD Water Vapor in the Western Mediterranean submitted to Bull. Am. Meteor. Soc.
39
this could be a problem at the Mediterranean sites is less likely, since the monuments are
typically concrete pillars. This could be tested however, by running a nearby standard antenna
on a tripod at a site with a high bias. Multipath induced errors would not be a likely cause of
biases that had seasonal variations. Foliage on trees blocking visibility to the site could
produce a seasonal variation in multipath, however the MAGIC network sites have no such
obstructions.
Persistent large scale horizontal gradients in atmospheric structure could lead to regional
biases. Solving for ZTD gradient parameters in orbit calculations has been shown to decrease
the rms error of the orbits. Thus, there is some trade-off that should be the subject of future
investigation, through examination of systematic variations in vertical coordinates and orbital
geometry. Whether this type of bias could attain level comparable to the biases that are seen
(5-10 mm ZTD) is not known.
Atmospheric and hydrologic loading are phenomena where the Earth’s atmosphere or the
distribution of continental water exert loads on the surface and depress the crust. The vertical
motion due to this deformation is large enough to be detected in the signal by the GPS. This
would create a signal that is correlated with the dry delay term of the tropospheric delay, but
would tend to average out for periods greater than the tidal cycle. High pressure systems
would create a positive bias in the GPS signal, though not as large as the 15 mm ZTD biases
that we have observed. The feasibility of first order modeling of the signal and separating it
from the zenith delay signal requires further investigation.
7.2 Radiosonde errors
Radiosondes have typical instrumental temperature sensor standard errors between 0.2 and
0.5 oK, and relative humidity standard errors are 5%. In multiple flight comparisons, the two
standard deviation night-time flight-to-flight variation of temperature is within this standard
Haase et al., 2002, ZTD Water Vapor in the Western Mediterranean submitted to Bull. Am. Meteor. Soc.
40
error. However the flight-to-flight temperature variation during the day is 2 to 3 times higher.
There are biases between types of radiosondes that have been documented as a result of
comparison tests (WMO 1996). These show that variations in solar radiation heating of the
instruments remain a significant cause of systematic errors in measured temperature and
humidity. This shows up most in differences between day and night radiosonde launches
where temperatures can be biased by 0.9 oK, 1.3 oK, and 2.2 oK at 300 hPa, 100 hPa and 30
hPa, respectively, for the type of sonde most frequently used in western Europe. Software
corrections are applied for solar radiation heating, but are based on average flight conditions.
Radiosondes that fly over the relatively low albedo ocean where backscattered radiation is
lower may have corrections applied that may be too large by at least 20 per cent.
Backscattering from thick upper clouds with high albedo may result in a software correction
that is too small.
Most radiosondes are corrected for the thermal lag of the sensors, which can be given by a
time constant multiplied by the velocity of ascent and the temperature gradient. The error is
from 0.1 to 0.3 oK. However, in strong temperature inversions the errors may be very much
larger.
Biases between types of relative humidity sensors show systematic differences after passing
through low cloud or fog where the external temperature sensors have clearly become wet,.
This increases relative humidity by at least 10 percent on average (Nash et al. 1995). The
dewpoint pressure that is reported is calculated from the relative humidity measurement
multiplied by the saturated vapor pressure derived from the radiosonde temperature. An error
of –1.5 per cent at 50 % humidity can result because the thermal lag of the relative humidity
sensor is usually much longer than the thermal lag of the temperature sensor. This error can
decrease the relative humidity by 4-5% at temperatures from –10 to –30 oC. The actual
correction for this error was not determined in the radiosonde comparison because the error

Haase et al., 2002, ZTD Water Vapor in the Western Mediterranean submitted to Bull. Am. Meteor. Soc.
41
seemed to effect all types of radiosondes in a similar manner. The flight-to-flight sonde error
(2 standard deviations) for typical European radiosondes is 6% from 40-90% relative
humidity and 4% from 10-20% relative humidity.
Finally, significant humidity errors have been found to depend on the age of the radiosonde,
because of the gradual absorption of materials in which the radiosondes are stored that
impedes the influx of water molecules to the sensor (Liljegren et al. 1999). This has been
shown to lead to an increase in the bias between the microwave radiometer and radiosonde
data of 1.55 kg/m2 of integrated water vapor during the summer humid season or about an
increase of 10 mm ZTD, and an increase in the standard deviation during the summer months
as well. This can now be corrected if the model number of the radiosonde is known. For our
study, we did not have direct access to this information. While this error has properties similar
to the observations made about our data, it does not explain the low bias for night-time
launches.
In general, modern radiosondes typically used in western Europe provide high accuracy
measurements, and a good deal of progress has been accomplished through the
intercomparison tests to derive correction algorithms. However, we see that there are some
type of situations that may still cause systematic errors: these are the day-night differences,
differences due to solar radiation because of significantly different albedo, systematic errors
due to thermal lag in ascent through inversion layers, systematic humidity errors due to flight
through fog, and systematic errors due to the age of the radiosonde. These represent potential
systematic sources of bias that in some cases could correlate with local site conditions such as
coastal sites which sample preferentially over the ocean or land depending on the sea breeze.
Further pursuing such possible correlations is a subject of future study.
Haase et al., 2002, ZTD Water Vapor in the Western Mediterranean submitted to Bull. Am. Meteor. Soc.
42
8 Conclusions
The MAGIC project GPS ZTD data, because of its long term continuous comparison with
radiosondes and NWP model fields, is a unique data set for evaluating the error statistics of
GPS ZTD data over several complete annual cycles. The data set is also unique in that
HIRLAM forecast output is available at 15 minute intervals for the entire period, not the
typical 6 hour forecast interval, so that comparisons can be carried out at a large range of time
scales. The data set contains 51 sites and covers 2.5 years. The data set also covers an altitude
range from sea level to 2500 meters, with the climatic conditions varying from the warm,
humid climatic conditions of the Mediterranean to Alpine conditions.
The GPS ZTD data shows annual variations with amplitudes from 30 to 70 mm, and shorter
time scale variability with an rms of up to 40 mm. The variation of GPS ZTD on the annual
time scale is positively correlated with temperature and the temperature induced humidity
variations. The annual mean GPS ZTD is dependent on the pressure and hence altitude of the
site.
Comparing 13 sites with radiosonde data within a distance of 50 km shows that the two data
sets are in very close agreement, with biases less than 7 mm ZTD for 9 out of 13 sites and
standard deviations of 12 mm. The high bias sites tend to be high humidity low altitude
coastal sites. The biases increase during the summer months, but only for the daytime
launches, illustrating that at least part of these biases are most likely associated with day/night
radiosonde biases and are not an artifact of the GPS data processing. The scatter of the
Haase et al., 2002, ZTD Water Vapor in the Western Mediterranean submitted to Bull. Am. Meteor. Soc.
43
residuals increases during the summer months when more humidity is present and the
humidity fields have more temporal variability.
In the comparison with ZTD estimates calculated from the HIRLAM model, the GPS-
HIRLAM biases are smaller than for the radiosondes, only 3.4 mm ZTD. The standard
deviation of the GPS – HIRLAM residuals is greater than for radiosondes, more than 18 mm
ZTD. This indicates there is significant additional information contained in the GPS data that
has the potential to improved HIRLAM initial humidity fields. The strong seasonal
dependence of the errors must be considered in the statistics used for assimilation.
9 Acknowledgements
This work was carried out as part of the MAGIC project (http://www.acri.fr/magic), funded in
part by the European Commission DGXII Environment and Climate Program (EC contract
ENV4-CT98-0745).
We would like to thank the many institutions and academic organizations which provide GPS
observation data freely to the research community. We would like to acknowledge the
contribution of the International GPS Service (IGS) and the IGS analysis centers through their
provision of quality orbits and GPS archives.
The figures were prepared using the GMT software.

Haase et al., 2002, ZTD Water Vapor in the Western Mediterranean submitted to Bull. Am. Meteor. Soc.
44
10 References
Askne, J. and H. Nordius, 1987: Estimation of tropospheric delay for microwaves from
surface weather data. Radio Science, 22, 379-386.
Bar-Sever, Y. E., P. M. Kroger, and J. A. Borjesson, 1998: Estimating horizontal gradients of
tropospheric path delay with a single GPS receiver. J. Geophys. Res., 103, 5019-5035.
Bevis, M., S. Businger, T. A. Herring, C. Rocken, A. Anthes, and R. Ware, 1992: GPS
Meteorology: Remote sensing of atmospheric water vapor using the Global Positioning
System. J. Geophys. Res., 97, 15,787-15,801.
Bevis, M., S. Businger, S. Chiswell, T. A. Herring, R. A. Anthes, C. Rocken, and R. H. Ware,
1994: GPS meteorology: mapping zenith wet delays onto precipitable water. Journal of
applied meteorology, 33, 379-386.
Bock, Y., R. I. Abbot, C. C. Counselman, S. A. Gourevitch, and R. W. King, 1986:
Interferometric analysis of GPS phase observations. Manuscripta Geodaetica, 11, 282-288.
Davis, J. L., T. A. Herring, I. I. Shapiro, A. E. Rogers, and G. Elgered, 1985: Geodesy by
radio interferometry: Effects of atmospheric modeling errors on estimates of baseline length.
Radio Science, 20, 1593-1607.
Dodson, A., B. Buerki, G. Elgered, A. Rius, and M. Rothacher, 1999: WAVEFRONT, GPS
Water Vapour Experiment for Regional Operational Network Trials, Final Report to the
European Commission Framework IV, Environment and Climate Workprogramme. Final
Report.
Haase et al., 2002, ZTD Water Vapor in the Western Mediterranean submitted to Bull. Am. Meteor. Soc.
45
Duan, J., M. Bevis, P. Fang, Y. Bock, S. Chiswell, S. Businger, C. Rocken, F. Solheim, T.
Van Hove, R. Ware, S. McClusky, T. A. Herring, and R. W. King, 1996: GPS meteorology:
direct estimation of the absolute value of precipitable water vapor. Journal of applied
meteorology, 35, 830-838.
Elgered, G., J. L. Davis, T. A. Herring, and I. I. Shapiro, 1991: Geodesy by radio
interferometry- Water vapor radiometry for estimation of the wet delay. J. Geophys. Res., 96,
6541-6555.
Elgered, G., J. M. Johansson, B. O. Ronnang, and J. L. Davis, 1997: Measuring regional
atmospheric water vapor using the Swedish permanent GPS network. Geophysical Research
Letters, 24, 2663-2666.
Elliott, W. P. and D. J. Gaffen, 1991: On the utility of radiosonde humidity archives for
climate studies. Bull. Am. Meteorol. Soc., 72, 1507-1520.
——, 1993: Effects of conversion algorithms on reported upper-air dewpoint depressions.
Bull. Am. Meteorol. Soc., 74, 1323-1325.
Elms, J., 2000: Communication on Radiosonde Ground Equipment Conversion Formulas. H.
Vedel, Ed.
Emardson, T. R. and H. J. P. Derks, 1998: On the relation between the wet delay and the
integrated precipitable water vapour in the European atmosphere. Meteorological
Applications, submitted.
Emardson, T. R., G. Elgered, and J. M. Johansson, 1998: Three months of continuous
monitoring of atmospheric water vapor with a network of Global Positioning System
receivers. Journal of geophysical research, 103, 1807-1820.
Emardson, T. R., J. Johansson, and G. Elgered, 2000: The systematic behavior of water vapor
estimates using four years of GPS observations. IEEE transactions on geoscience and remote
sensing, 38, 324-329.
Haase et al., 2002, ZTD Water Vapor in the Western Mediterranean submitted to Bull. Am. Meteor. Soc.
46
Eskridge, R. E., O. A. Alduchov, I. V. Chernykh, Z. Panmao, A. C. Polansky, and S. R. Doty,
1995: A comprehensive aeorological reference data set (CARDS): rough and systematic
errors. Bull. Am. Meteor. Soc., 76, 1759-1775.
Fang, P., M. Bevis, Y. Bock, S. Gutman, and D. Wolfe, 1998: GPS meteorology: Reducing
systematic errors in geodetic estimates for zenith delay. Geophysical Research Letters, 25,
3583-3586.
Flores, A., A. Escudero, M. J. Sedo, and A. Rius, 2000: A near real time system for
tropospheric monitoring using IGS hourly data. Earth Planets Space, 52, 681-684.
Ge, M., E. Calais, and J. Haase, 2000: Reducing satellite orbit error effects in near real-time
GPS zenith tropospheric delay estimation for meteorology. Geophysical Research Letters, 27,
1915-1919.
Gutman, S. I. and S. G. Benjamin, 2001: The Role of Ground-Based GPS Meteorological
Observations in Numerical Weather Prediction. GPS Solutions, 4 - accepted.
Haase, J., E. Calais, J. Talaya, A. Rius, F. Vespe, R. Santangelo, X.-Y. Huang, J. M. Davila,
M. Ge, L. Cucurull, A. Flores, C. Sciaretta, R. Pacione, M. Boccolari, S. Pugnaghi, H. Vedel,
K. Mogensen, X. Yang, and J. Garate, 2001: The Contributions of the MAGIC Project to the
COST 716 objectives of assessing the operational potential of ground-based GPS meteorology
on an international scale. Phys. Chem. Earth (A), 26, 433-437.
Haase, J., E. Calais, A. Rius, I. Colomina, and F. Vespe, 1997: MAGIC Meteorological
Applications of GPS Integrated Column Water Vapor Measurements in the Western
Mediterranean. Joint Assemblies of the International Association for Meteorology and
Atmospheric Sciences (IAMAS) and the International Association for Physical Sciences of the
Ocean (IAPSO), Melbourne Australia.
Herring, T. A., 1990: Geodesy by Radiointerferometry: The application of kalman
filtering to the analysis of VLBI data. J. Geophys. Res., 95, 12561-12581.
Haase et al., 2002, ZTD Water Vapor in the Western Mediterranean submitted to Bull. Am. Meteor. Soc.
47
Iwabuchi, T., I. Naito, and N. Mannoji, 2000: A comparison of Global Positioning System
retrieved precipitable water vapor with the numerical weather prediction analysis data over
the Japanese Islands. Journal of geophysical research, 105, 4573-4585.
Jarlemark, P. O. J. and G. Elgered 1998: Characterizations of temporal variations in
atmospheric water vapor. IEEE Trans. Geosci. Remote Sens., 36, 319-321.
King, R. W. and Y. Bock, 1999: Documentation for the GAMIT GPS analysis software.
Kouba, J. and Y. Mireault, 1998: 1997 Analysis Coordinator Report. 1997 IGS Annual
Report, JPL 400-786 10/98, K. G. I. Mueller, and R. Nielan, Ed., Jet Propulsion Laboratory,
23-69.
Kuo, Y.-H., X. Zou, and Y.-R. Guo, 1996: Variational assimilation of precipitable water using
a nonhydrostatic mesoscale adjoint model. Part I: Moisture retrieval and sensitivity
experiments. Mon. Wea. Rev., 124, 122-147.
Lemoine, F. G., D. E. Smith, L. Kunz, R. Smith, E. C. Pavlis, N. K. Pavlis, S. M. Klosko, D.
S. Chinn, M. H. Torrence, R. G. Williamson, C. M. Cox, K. E. Rachlin, Y. M. Wang, S. C.
Kenyon, R. Salman, R. Trimmer, R. H. Rapp, and R. S. Nerem, 1997: The Development of
the NASA GSFC and NIMA Joint Geopotential Model. Gravity, Geoid and Marine Geodesy,
H. F. J. Segawa, and S. Okubo (editors), Ed., International Association of Geodesy Symposia,
461-469.
Lide, D. R., 1992: Handbook of Chemistry and Physics. 73rd edition ed. Chemical Rubber
Publishing Company.
Liljegren, J., B. Lesht, T. VanHove, and C. Rocken, 1999: A Comparison of integrated water
vapor from microwave radiometer, balloon-borne sounding system and Global Positioning
System. 9th Atmospheric Radiation Measurement Program Science Team Meeting, San
Antonio, Texas.
Haase et al., 2002, ZTD Water Vapor in the Western Mediterranean submitted to Bull. Am. Meteor. Soc.
48
Mader, G. L., cited 1999: GPS antenna calibration at the National Geodetic Survey.
[Available online from
http://www.grdl.noaa.gov/GRD/GPS/Projects/ANTCAL/Files/summary.html.]
Majewski, D., 1985: Balanced initial and boundary values for a limited area model. Beitr.
Phys. Atmosph., 58, 147-159.
Mendes, V. d. B., 1999: Modeling the neutral-atmosphere propagation delay in radiometric
space techniques, Geodesy and Geomatics Engineering, University of New Brunswick, 349.
Nash, J., J. B. Elms, and T. J. Oakley, 1995: Relative humidity sensor performance observed
in recent international radiosonde comparisons. 9th AMS Symposium on Meteorological
Observations and Instrumentation, Charlotte, NC, 43-48.
Niell, A., 2000a: Improved atmospheric mapping functions for VLBI and GPS. Earth,
Planets, and Space, Submitted 14-jan-2000.
Niell, A. E., 2000b: Improved atmospheric mapping functions for VLBI and GPS. Earth
Planets and Space, 52, 699-702.
Ohtani, R., 2002: Results of GPS meteorology project of Japan. COST Action 716 Workshop
"Exploitation of Ground-based GPS for Meteorology, Potsdam.
Pacione, R., C. Sciarretta, F. Vespe, C. Faccani, R. Ferretti, E. Fionda, C. Ferraro, and A.
Nardi, 2001: GPS meteorology: validation and comparisons with ground-based microwave
radiometer and mesoscale model for the Italian GPS permanent stations. Phys. and Chem. of
the Earth (A), 26, 139-145.
Parker, D. E. and D. I. Cox, 1995: Towards a consistent global climatological rawinsonde
data-base. Int. J. of Climatology, 14, 473-496.
Rocken, C., R. Ware, T. Van Hove, F. Solheim, C. Alber, and J. Johnson, 1993: Sensing
atmospheric water vapor with the Global Positioning System. Geophysical Research Letters,
20, 2631-2634.
Haase et al., 2002, ZTD Water Vapor in the Western Mediterranean submitted to Bull. Am. Meteor. Soc.
49
Rocken, C., T. V. Hove, J. Johnson, F. Solheim, R. Ware, M. Bevis, S. Chiswell, and S.
Businger, 1995: GPS/Storm - GPS Sensing of Atmospheric Water Vapor for Meteorology. J.
of Atmos. and Ocean. Technology, 12, 468 - 478.
Ruffini, G., L. P. Kruse, A. Rius, B. Burki, and L. Cucurull, 1999: Estimation of tropospheric
zenith delay and gradients over the Madrid area using GPS and WVR data. Geophysical
Research Letters, 26, 447-450.
Saastamoinen, J., 1972: Atmospheric correction for the troposphere and stratosphere in radio
ranging of satellites. The Use of Artificial Satellites for Geodesy, S. W. Henriksen and others,
Eds., American Geophysical Union, 247-251.
Sass, B. H., N. W. Nielsen, J. U. Jorgensen, and B. Ammstrup, 1999: The operational
HIRLAM system at DMI, DMI Technical Report 99-21. DMI technical report 99-21.
Smith, E. K. and S. Weintraub, 1953: The constants in the equation for atmospheric refractive
index at radio frequencies. Proc. IRE,, 41, 1035-1037.
Smith, T. L., S. G. Benjamin, B. Schwartz, and S. I. Gutman, 1999: Using GPS-IPW in a 4-D
Data Assimilation System. GPS-99 Symposium, Tsukuba, Japan.
Thayer, G. D., 1974: An improved equation for the radio refractive index of air. Radio Sci., 9,
803-807.
Tralli, D. M. and S. M. Lichten, 1990: Stochastic estimation of tropospheric path delays in
global positioning system geodetic measurements. Bulletin geodesique, 64, 127-159.
Tregoning, P., R. Boers, D. O'Brien, and M. Hendy, 1998: Accuracy of absolute precipitable
water vapor estimates from GPS observations. Journal of geophysical research, 103, 28701-
28710.
Treuhaft, R. N. and G. E. Lanyi, 1987: The effect of the dynamic wet troposphere on radio
interferometric measurements. Radio Science, 22, 251-265.
Haase et al., 2002, ZTD Water Vapor in the Western Mediterranean submitted to Bull. Am. Meteor. Soc.
50
Vedel, H., 2000: MAGIC Project Radiosonde Data Specification Document. MAGIC Project
Report D05210, 4 pp.
Vedel, H., K. S. Mogensen, and X.-Y. Huang, 2000: Calculation of delays from
meteorological data, comparison of NWP model and observed delays. COST 716 Workshop -
Towards Operational GPS Meteorology, Oslo, Norway.
——, 2001: Calculation of delays from meteorological data, comparison of NWP model and
observed delays. Phys. Chem. Earth (A), 26, 497-502.
Wade, C. G., 1994: An evaluation of probblems affecting the measurement of low relative
humidity on the United States radiosonde. J. Atmos. Ocean. Tech., 11, 687-700.
Webb, F. H. and J. F. Zumberge, 1997: An Introduction to GIPSY/OASIS II. JPL Report.
WMO, 1996: Guide to Meteorological Instruments and Methods of Observation. 6th
ed.WMO-No.8.
Yang, S., B. H. Sass, G. Elgered, J. M. Johansson, and T. R. Emardson, 1999: A comparison
of the precipitable water vapor estimates by an NWP simulation and GPS observations. J.
Appl. Meteor., 38, 941-956.
Yuan, L. L., R. A. Anthes, R. H. Ware, C. Rocken, W. D. Bonner, M. G. Bevis, and S.
Businger, 1993: Sensing climate change using the global positioning system. J. Geophys.
Res., 98, 14925-14937.
Zou, X. and Y.-H. Kuo, 1996: Rainfall assimilation through an optimal control of initial and
boundary conditions in a limited-area mesoscale model. Mon. Wea. Rev., 124, 2859-2882.
Zumberge, J. F., M. B. Heflin, D. C. Jefferson, M. M. Watkins, and F. H. Webb, 1997:
Precise point positioning for the efficient and robust analysis of GPS data from large
networks. Journal of Geophysical Research, 102, 5005-5017.

Haase et al., 2002, ZTD Water Vapor in the Western Mediterranean submitted to Bull. Am. Meteor. Soc.
51
Table Captions
Table 1 Table of parameters used in the routine MAGIC data processing.
Table 2 GPS ZTD – Radiosonde comparison table. Comparison of the zenith tropospheric
delay derived from the GPS measurements with those integrated from the radiosonde
profiles. The column “dis” gives the horizontal distance between the radiosonde launch
site and the GPS antenna, “dz” is the difference in altitude between the GPS antenna and
the radiosonde launch site.
Table 3 Comparison of the ZTD derived from GPS measurements with those calculated from
the HIRLAM 6 hour forecasts. The column altitude gives the altitude of the GPS
antenna, and the column dz give the difference between the actual GPS antenna altitude
and the HIRLAM model orography. This height difference is taken into account by an
interpolation or extrapolation of the model fields. This height difference has been
modeled accurately since there is no correlation of mean ZTD difference and height
difference.

Haase et al., 2002, ZTD Water Vapor in the Western Mediterranean submitted to Bull. Am. Meteor. Soc.
52
11 Figure Captions
Figure 1 MAGIC GPS station distribution. Shaded circles indicate sites with radiosonde sites
within 50 km. Stars indicate the six sites used as common reference sites in the
processing.
Figure 2 From top to bottom: Integrated water vapor (IWV), zenith wet delay (ZWD), zenith
tropospheric delay (ZTD), surface temperature, pressure and specific humidity measured
at the site SJDV in France from June 23 to December 31 1999. Modified julian day is the
day number since XXX.
Figure 3 Correlation of zenith wet delay at site SJDV with site surface specific humidity and
surface temperature, and correlation of total zenith tropospheric delay with surface
specific humidity.
Figure 4 Correlation between ZTD and T, P, Q, rH for coastal versus inland sites
Figure 5 Correlation coefficient of a) temperature vs ZTD b) pressure vs ZTD c) surface
humidity vs ZTD, d) ZTD vs ZWD for a coastal site.
Figure 6 Amplitude of the annual sinusoidal variation of ZTD is the order of 25 to 75 mm of
ZTD, with the highest variation for sites on the lee side of the Alps.
Figure 7 Geographical dependance of the annual variability of the GPS ZTD. A symbol scaled
with the size of the annual term removed is plotted at the location of the GPS site.
Figure 8 High frequency variability, measured here as the rms variation of the ZTD time
series after the annual term has been removed, is the order of 20 to 40 mm of ZTD. The

Haase et al., 2002, ZTD Water Vapor in the Western Mediterranean submitted to Bull. Am. Meteor. Soc.
53
variability shows a dependence on the water vapor content through the inverse
dependence on altitude of the site.
Figure 9 Geographical dependance of GPS ZTD high frequency variability. A symbol scaled
with the size of the rms variation with the annual term removed is plotted at the location
of the GPS site. High variability is found at Mediterranean coastal sites.
Figure 10 Average and standard deviation of the difference between GPS ZTD and
radiosonde ZTD for each station. Stations are sorted alphabetically. Average and
standard deviation for all stations together are shown by ALL_. There is only 1 month of
data for AJAC.
Figure 11 Histogram of correlation coefficient between the GPS ZTD and radiosonde ZTD
time series for each site, with sites sorted by increasing geographic latitude. There is not
an obvious correlation with latitude as there is with HIRLAM data.
Figure 12 Correlation between GPS ZTD and radiosonde ZTD. Light gray line has a 1:1
slope, dark gray line is the best linear fit to the data.
Figure 13 Standard deviation of GPS ZTD - radiosonde residuals a) as a function of site
altitude, b) as a function of site latitude.
Figure 14 : Comparison between GPS derived ZTD and radiosonde measurements at 9 sites of
the MAGIC network. (XXX Feb 2000 statistics)
Figure 15 a) Time dependent behavior of the mean GPS-radiosonde ZTD difference over a
2.5 year time period. b) standard deviation of the GPS-radiosonde ZTD difference.
Figure 16 a) Histogram of GPS ZTD - radiosonde residuals for station MEDI. Black curve is
mid-day launches with mean 6.5 and standard deviation 8.1 mm ZTD; white curve is
midnight launches with mean 0.3 and standard deviation 8.9 mm ZTD.

Haase et al., 2002, ZTD Water Vapor in the Western Mediterranean submitted to Bull. Am. Meteor. Soc.
54
Figure 17 a) Mean GPS – Radiosonde ZTD residuals for mid-day radiosonde launches. b)
Mean GPS – Radiosonde ZTD residuals for midnight radiosonde launches, c) mean GPS
ZTD values. The mean residual is much lower for midnight launches even though the
mean humidity (represented by mean GPS ZTD) is the same for mid-day and midnight.
Figure 18 Geographical distribution of GPS ZTD - radiosonde biases for a) entire 1.5 years, b)
1 month, c) 3 days.
Figure 19 Comparison of GPS-derived integrated water vapor with radiosonde profiles at
SJDV (near Lyon, France).
Figure 20 : GPS-derived ZTD time series and difference with HIRLAM 6-hour forecast at 5
sites of the MAGIC network.
Figure 21 ZTD bias and rms as a function of GPS site altitude (WGS84 ellipsoid)
Figure 22 Average and standard deviation of the difference between GPS ZTD and Hirlam
ZTD for each station. Stations are sorted by latitude. Average and standard deviation for
all stations together are shown by ALL_.
Figure 23 a) The standard deviation of the difference between the GPS ZTD and the
HIRLAM 6 hour forecast decreases as altitude increases. The model is successful in
reproducing the observed ZTD in mountainous, high altitude terrain, even though the
HIRLAM model orography is very low resolution. b) The standard deviation decreases
as latitude increases, indicating dynamics are better modeled in higher latitude regions
than in the Mediterranean.
Figure 24 Histogram of correlation coefficient between the GPS ZTD and HIRLAM ZTD
time series for each site, with sites sorted by increasing geographic latitude. The
correlation decreases with decreasing latitude.
Haase et al., 2002, ZTD Water Vapor in the Western Mediterranean submitted to Bull. Am. Meteor. Soc.
55
Figure 25 Correlation between GPS ZTD and HIRLAM ZTD. Two of sites with the highest
correlation coefficient are (a) WTZR, correlation coefficient R=0.96, and (b) UPAD,
R=0.96. Two of the lowest correlation sites are (c) VILL, R=0.89, and (d) NOTO,
R=0.83. Light gray line has a 1:1 slope, dark gray line is the best linear fit to the data.
Figure 26 a) Time dependent behavior of the mean GPS-HIRLAM 6-hour forecast ZTD
difference over a 1.5 year time period. b) Time dependent behavior of the standard
deviation of the GPS-HIRLAM ZTD difference over a 1.5 year time period. The
standard deviation shows a seasonal trend, as in the radiosonde comparison, with higher
scatter from May to September.
Figure 27 Correlation coefficient for ZTD GPS-Radiosonde differences compared between
sites as a function of separation between the GPS sites.
Figure 28. The correlation coefficient for the GPS-HIRLAM6 differences compared between
sites as a function of separation. The red circles are the correlation coefficients averaged
over 50 km bins.
Figure 29 GPS ZTD time series. The ZTD time series for station SJDV in the Beaujolais
region of France, and the residuals for the radiosonde comparison (located at 35 km
distance) and HIRLAM comparison. There is a clear increase in the scatter of the
residuals from May (~day 51350) to October (~day 51470) and then again starting in
May 2000 (~day 51665) when the atmosphere is more humid
Haase et al., 2002, ZTD Water Vapor in the Western Mediterranean submitted to Bull. Am. Meteor. Soc.
56
12 Figures and Tables
Table 1 Table of parameters used in the MAGIC data processing.
• IGS final orbits are used, orbits are re-estimated across day boundaries.
• Reference frame is the ITRF97.
• Network station constraints are provided on 6 IGS sites.
• Data is processed in 3 subnetworks.
• Zenith parameter constraint is a Gauss-Markov process with power density 2 cm/(hour)1/2.
• Cut-off satellite elevation angle is 10 degrees.
• 12 hour sliding window is used, with ZTD extracted from the central 4 hours.
• GPS data sampling interval is 60 seconds.
• Antenna phase pattern corrections are applied following the IGS recommendations
(Mader 1999).
• Zenith delay is estimated at 15 minute intervals.
• Tropospheric delay is mapped into zenith delay using the Niell mapping functions (Niell
2000a).
• GPS observables are doubly-differenced LC (ionosphere-free) observations, ambiguity
free solution.
• Bad satellite and station observations are removed automatically based on the
corresponding phase observation residuals.

Haase et al., 2002, ZTD Water Vapor in the Western Mediterranean submitted to Bull. Am. Meteor. Soc.
57
Table 2 GPS ZTD – radiosonde comparison table. Comparison of the zenith tropospheric
delay derived from the GPS measurements with those integrated from the radiosonde profiles.
The column “dis” gives the horizontal distance between the radiosonde launch site and the
GPS antenna, “dz” is the difference in altitude between the GPS antenna and the radiosonde
launch site.
GPS ZTD – Radiosonde ZTD Comparison
GPS name Radiosonde
ID
dis
(km)
dz
(m)
GPS alt
(m)
bias
(mm)
stddev
(mm)
N
data
correlation
ACOR 08001 2 -52 15 6.7 11.7 674 0.958
AJAC 07761 3 45 54 6.9 11.5 47 0.949
BRST 07110 10 -74 21 11.9 11.7 221 0.966
CAGL 16560 15 187 192 14.3 13.3 2487 0.953
CART 08430 48 -19 43 12.6 18.1 576 0.901
CASC 08579 26 -82 23 7.9 14.7 531 0.947
GRAZ 11240 9 144 491 -4.1 7.6 418 0.987
HFLK 11120 6 1743 2336 1.6 6.6 457 0.980
KOSG 06260 44 49 53 2.9 10.6 2946 0.976
MEDI 16144 15 -1 10 3.3 9.2 1083 0.984
OBER 10868 27 107 596 6.1 8.9 1291 0.980
SJDV 07481 35 142 382 5.2 10.8 1192 0.969
VILL 08221 32 -38 595 9.1 11.3 906 0.952
ZIMM 06610 40 417 908 6.1 11.5 1427 0.961
ALL_ - - - - 6.8 12.3 14256 0.996
Haase et al., 2002, ZTD Water Vapor in the Western Mediterranean submitted to Bull. Am. Meteor. Soc.
58

Haase et al., 2002, ZTD Water Vapor in the Western Mediterranean submitted to Bull. Am. Meteor. Soc.
59
Table 3. Comparison of the zenith tropospheric delay derived from the GPS measurements
with those calculated from the HIRLAM 6 hour forecasts. The column “altitude” give the
altitude of the GPS antenna relative to mean sea level, and the column “dz” gives the
difference between the GPS antenna altitude and the HIRLAM model orography. This height
difference is taken into account by an interpolation or extrapolation of the model fields.
station latitude longitude altitude dz ZTD bias std dev N correlation
(deg N) (deg E) (m) (m) (mm) (mm) data
ACOR 43.36438 -8.39893 14.9 -120.9 1.7 19.8 16153 0.88
ALAC 38.33892 -0.48123 14.3 -215.9 6.7 19.9 19417 0.89
AQUI 42.36884 13.35034 667.2 -419.4 0.7 16.8 15661 0.90
BELL 41.59962 1.40114 803.6 309.0 3.8 17.0 29230 0.92
BZRG 46.49902 11.33680 279.5 -1162.4 -2.6 19.2 29856 0.94
CAGL 39.13591 8.97275 191.8 57.1 5.1 19.3 32138 0.89
CART 37.58675 -1.01204 43.5 -5.0 5.4 20.0 13562 0.88
CASC 38.69341 -9.41852 22.8 -8.6 0.8 24.4 23042 0.82
CHAT 45.30414 6.35856 799.3 -959.4 3.6 17.7 16969 0.90
COSE 39.20142 16.31041 618.2 -11.0 5.6 22.6 10173 0.81
CREU 42.31884 3.31560 83.8 65.8 5.4 19.9 26521 0.92
EBRE 40.82089 0.49236 57.7 -239.1 2.8 21.6 31037 0.92
ESCO 42.69357 0.97566 2455.2 916.8 3.5 11.3 18749 0.93
FCLZ 45.64300 5.98568 1308.7 542.9 6.4 12.6 29519 0.95
GENO 44.41939 8.92114 110.8 -164.5 5.2 20.1 33185 0.93
GINA 43.67572 5.78698 331.5 -128.9 3.4 16.7 31161 0.94
GRAS 43.75474 6.92057 1269.4 561.3 2.0 15.0 26093 0.94
GRAZ 47.06713 15.49348 490.9 -79.8 2.1 13.8 31524 0.96
HFLK 47.31290 11.38609 2336.0 809.5 2.9 9.7 30175 0.96
KOSG 52.17843 5.80964 53.5 36.1 1.1 12.8 32264 0.97
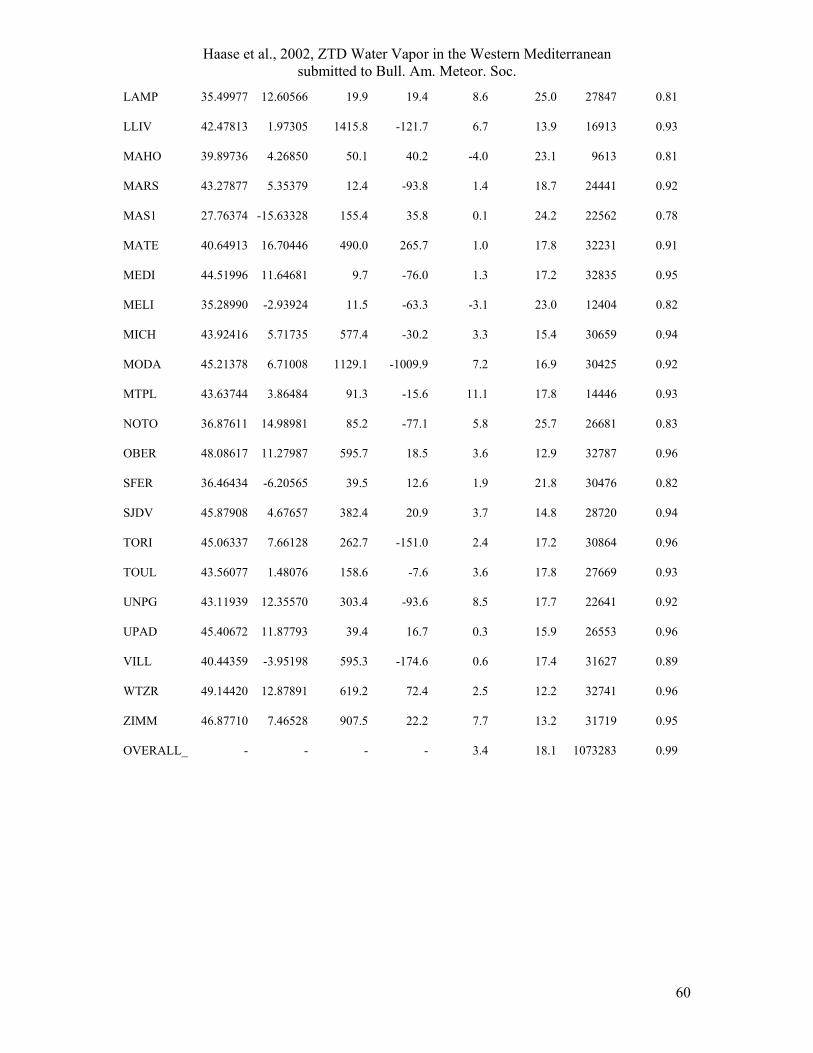
Haase et al., 2002, ZTD Water Vapor in the Western Mediterranean submitted to Bull. Am. Meteor. Soc.
60
LAMP 35.49977 12.60566 19.9 19.4 8.6 25.0 27847 0.81
LLIV 42.47813 1.97305 1415.8 -121.7 6.7 13.9 16913 0.93
MAHO 39.89736 4.26850 50.1 40.2 -4.0 23.1 9613 0.81
MARS 43.27877 5.35379 12.4 -93.8 1.4 18.7 24441 0.92
MAS1 27.76374 -15.63328 155.4 35.8 0.1 24.2 22562 0.78
MATE 40.64913 16.70446 490.0 265.7 1.0 17.8 32231 0.91
MEDI 44.51996 11.64681 9.7 -76.0 1.3 17.2 32835 0.95
MELI 35.28990 -2.93924 11.5 -63.3 -3.1 23.0 12404 0.82
MICH 43.92416 5.71735 577.4 -30.2 3.3 15.4 30659 0.94
MODA 45.21378 6.71008 1129.1 -1009.9 7.2 16.9 30425 0.92
MTPL 43.63744 3.86484 91.3 -15.6 11.1 17.8 14446 0.93
NOTO 36.87611 14.98981 85.2 -77.1 5.8 25.7 26681 0.83
OBER 48.08617 11.27987 595.7 18.5 3.6 12.9 32787 0.96
SFER 36.46434 -6.20565 39.5 12.6 1.9 21.8 30476 0.82
SJDV 45.87908 4.67657 382.4 20.9 3.7 14.8 28720 0.94
TORI 45.06337 7.66128 262.7 -151.0 2.4 17.2 30864 0.96
TOUL 43.56077 1.48076 158.6 -7.6 3.6 17.8 27669 0.93
UNPG 43.11939 12.35570 303.4 -93.6 8.5 17.7 22641 0.92
UPAD 45.40672 11.87793 39.4 16.7 0.3 15.9 26553 0.96
VILL 40.44359 -3.95198 595.3 -174.6 0.6 17.4 31627 0.89
WTZR 49.14420 12.87891 619.2 72.4 2.5 12.2 32741 0.96
ZIMM 46.87710 7.46528 907.5 22.2 7.7 13.2 31719 0.95
OVERALL_ - - - - 3.4 18.1 1073283 0.99

Haase et al., 2002, ZTD Water Vapor in the Western Mediterranean submitted to Bull. Am. Meteor. Soc.
61
Figure 1 MAGIC GPS station distribution. Shaded circles indicate sites with radiosonde sites within 50 km. Stars indicate the six sites used as common reference sites in the processing.
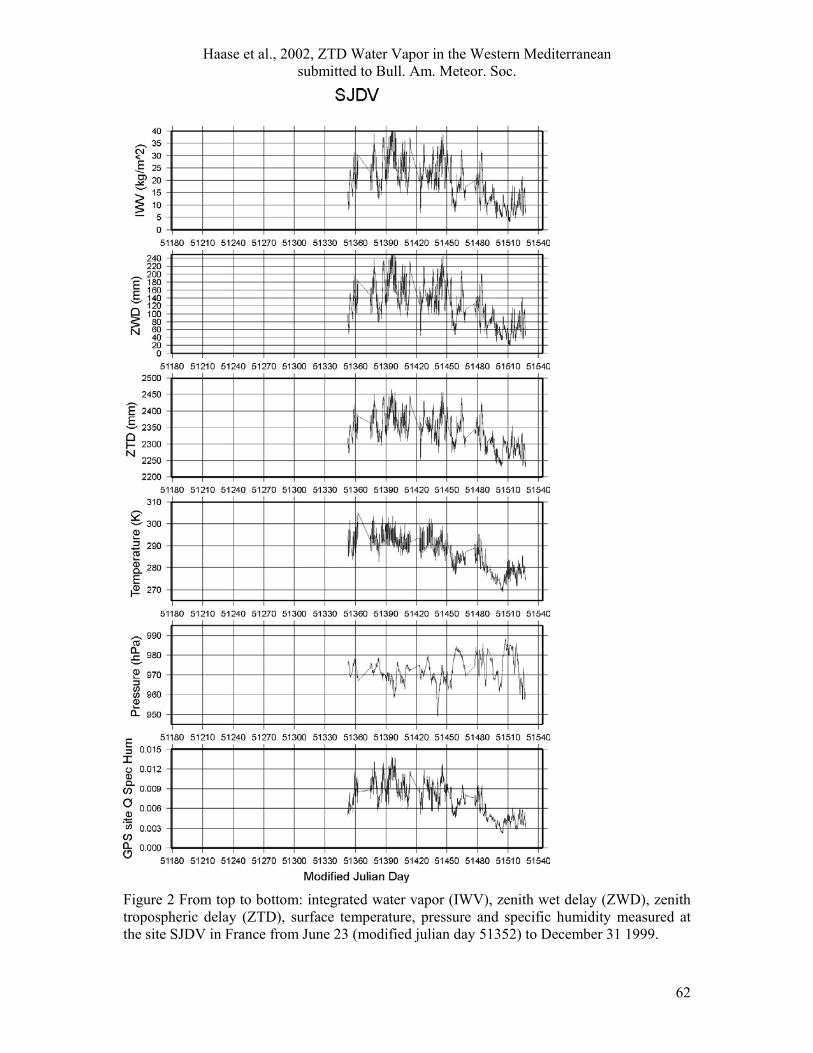
Haase et al., 2002, ZTD Water Vapor in the Western Mediterranean submitted to Bull. Am. Meteor. Soc.
62
Figure 2 From top to bottom: integrated water vapor (IWV), zenith wet delay (ZWD), zenith tropospheric delay (ZTD), surface temperature, pressure and specific humidity measured at the site SJDV in France from June 23 (modified julian day 51352) to December 31 1999.

Haase et al., 2002, ZTD Water Vapor in the Western Mediterranean submitted to Bull. Am. Meteor. Soc.
63
Figure 3 Correlation of zenith wet delay at site SJDV with site surface specific humidity and surface temperature, and correlation of total zenith tropospheric delay with surface specific humidity.
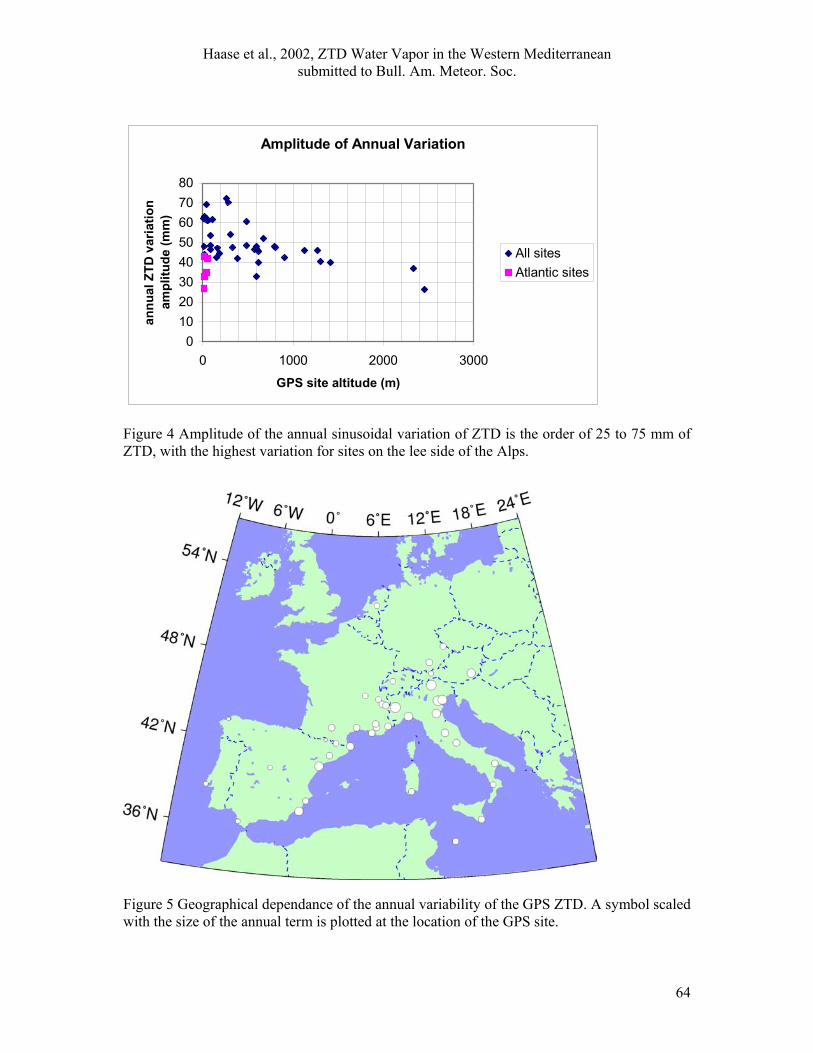
Haase et al., 2002, ZTD Water Vapor in the Western Mediterranean submitted to Bull. Am. Meteor. Soc.
64
Amplitude of Annual Variation
01020304050607080
0 1000 2000 3000
GPS site altitude (m)
annu
al Z
TD v
aria
tion
ampl
itude
(mm
)
All sitesAtlantic sites
Figure 4 Amplitude of the annual sinusoidal variation of ZTD is the order of 25 to 75 mm of ZTD, with the highest variation for sites on the lee side of the Alps.
Figure 5 Geographical dependance of the annual variability of the GPS ZTD. A symbol scaled with the size of the annual term is plotted at the location of the GPS site.

Haase et al., 2002, ZTD Water Vapor in the Western Mediterranean submitted to Bull. Am. Meteor. Soc.
65
.
ZTD High Frequency Variability
27
12172227323742
0 1000 2000 3000
GPS site altitude (m)
rms
of Z
TD m
inus
ann
ual
term
(mm
)
All sitesAtlantic sites
Figure 6 High frequency variability, measured here as the rms variation of the ZTD time series after the annual term has been removed, is the order of 20 to 40 mm of ZTD. The variability shows a dependence on the water vapor content through the inverse dependence on altitude of the site.
Figure 7 Geographical dependance of GPS ZTD high frequency variability. A symbol scaled with the size of the rms variation after the annual term is removed is plotted at the location of the GPS site. High variability is found at Mediterranean coastal sites.

Haase et al., 2002, ZTD Water Vapor in the Western Mediterranean submitted to Bull. Am. Meteor. Soc.
66
Figure 8 Structure functions for low latitude sites NOTO and LAMP in grey, and high latitude sites ZIMM and WTZR in black. Average structure functions are calculated for time lags of 30 minutes to 1 day using 2 years of data.
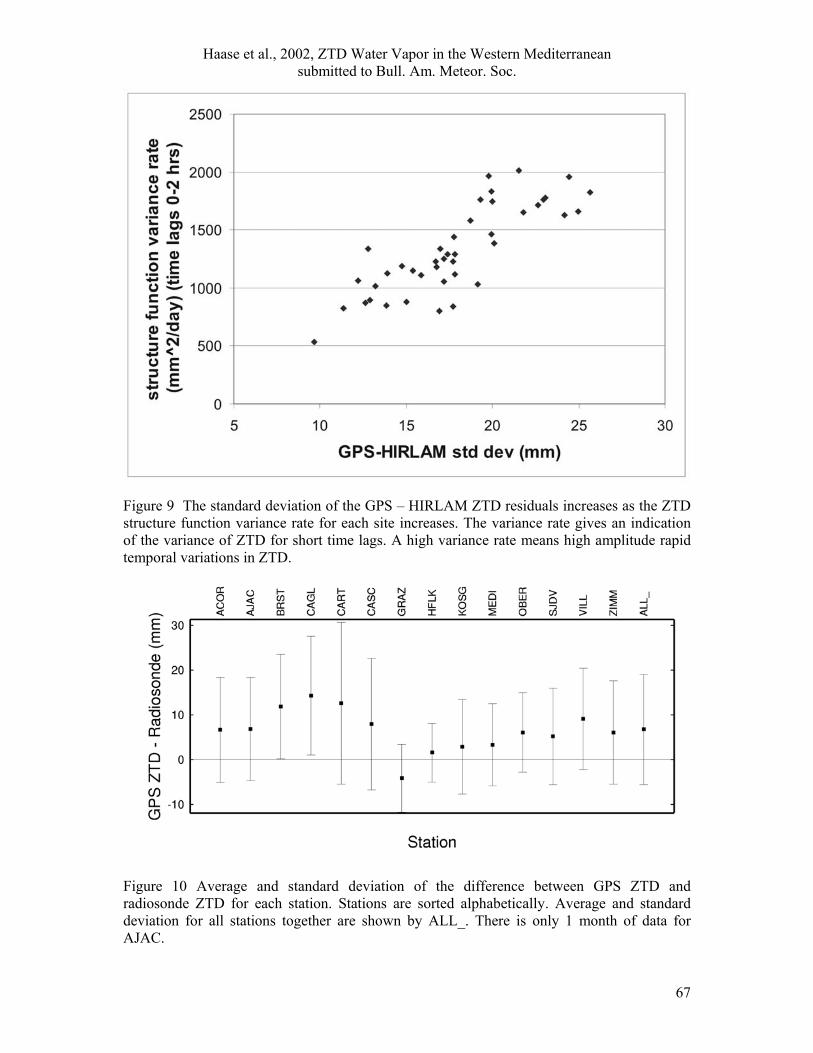
Haase et al., 2002, ZTD Water Vapor in the Western Mediterranean submitted to Bull. Am. Meteor. Soc.
67
Figure 9 The standard deviation of the GPS – HIRLAM ZTD residuals increases as the ZTD structure function variance rate for each site increases. The variance rate gives an indication of the variance of ZTD for short time lags. A high variance rate means high amplitude rapid temporal variations in ZTD.
Figure 10 Average and standard deviation of the difference between GPS ZTD and radiosonde ZTD for each station. Stations are sorted alphabetically. Average and standard deviation for all stations together are shown by ALL_. There is only 1 month of data for AJAC.
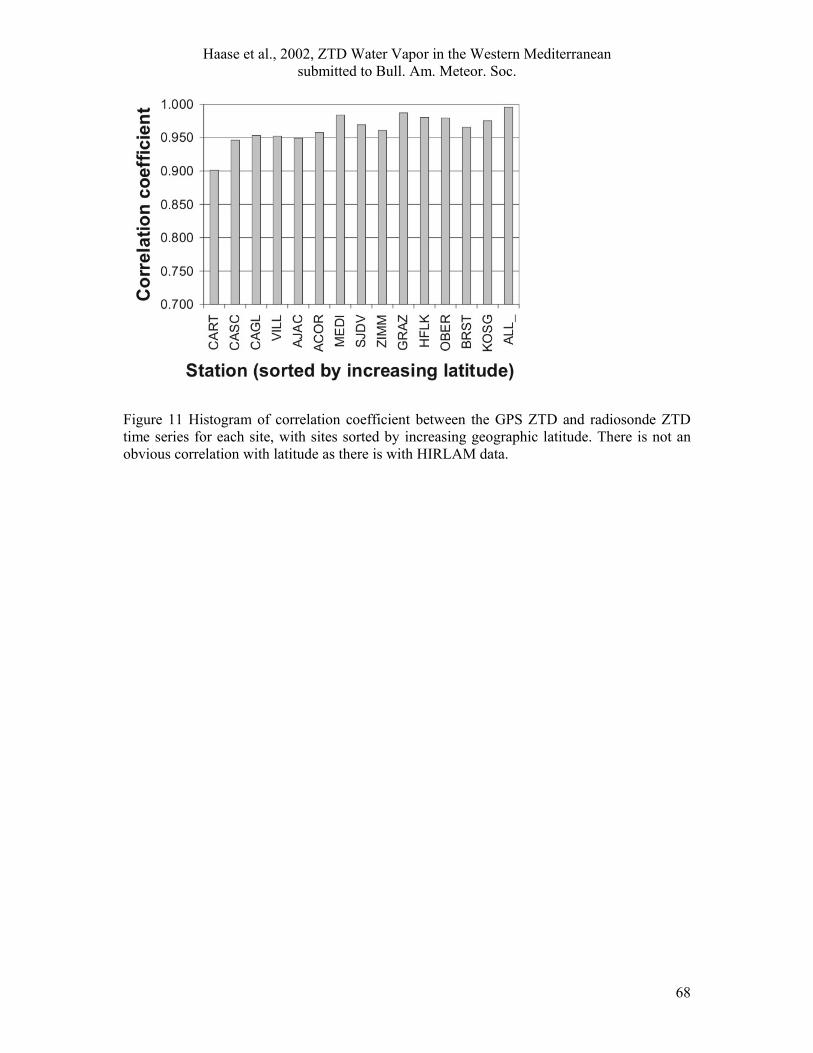
Haase et al., 2002, ZTD Water Vapor in the Western Mediterranean submitted to Bull. Am. Meteor. Soc.
68
Figure 11 Histogram of correlation coefficient between the GPS ZTD and radiosonde ZTD time series for each site, with sites sorted by increasing geographic latitude. There is not an obvious correlation with latitude as there is with HIRLAM data.

Haase et al., 2002, ZTD Water Vapor in the Western Mediterranean submitted to Bull. Am. Meteor. Soc.
69
Figure 12 Correlation between GPS ZTD and radiosonde ZTD. Light gray line has a 1:1 slope, dark gray line is the best linear fit to the data.
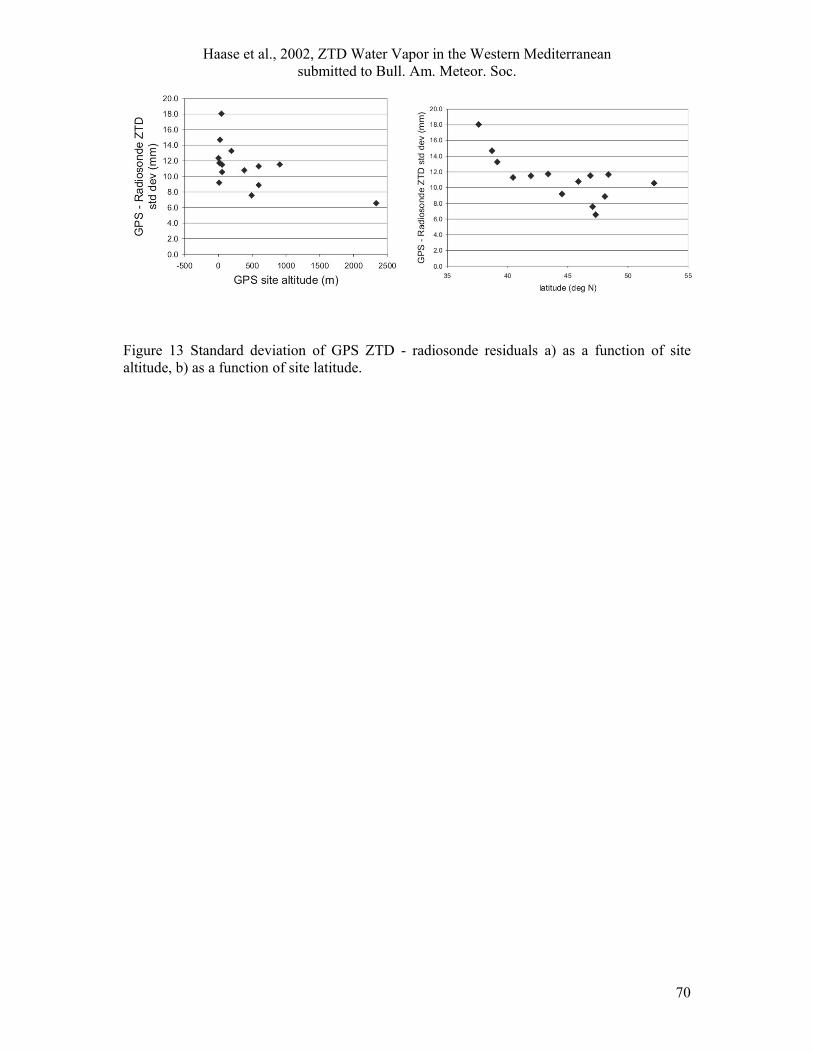
Haase et al., 2002, ZTD Water Vapor in the Western Mediterranean submitted to Bull. Am. Meteor. Soc.
70
Figure 13 Standard deviation of GPS ZTD - radiosonde residuals a) as a function of site altitude, b) as a function of site latitude.
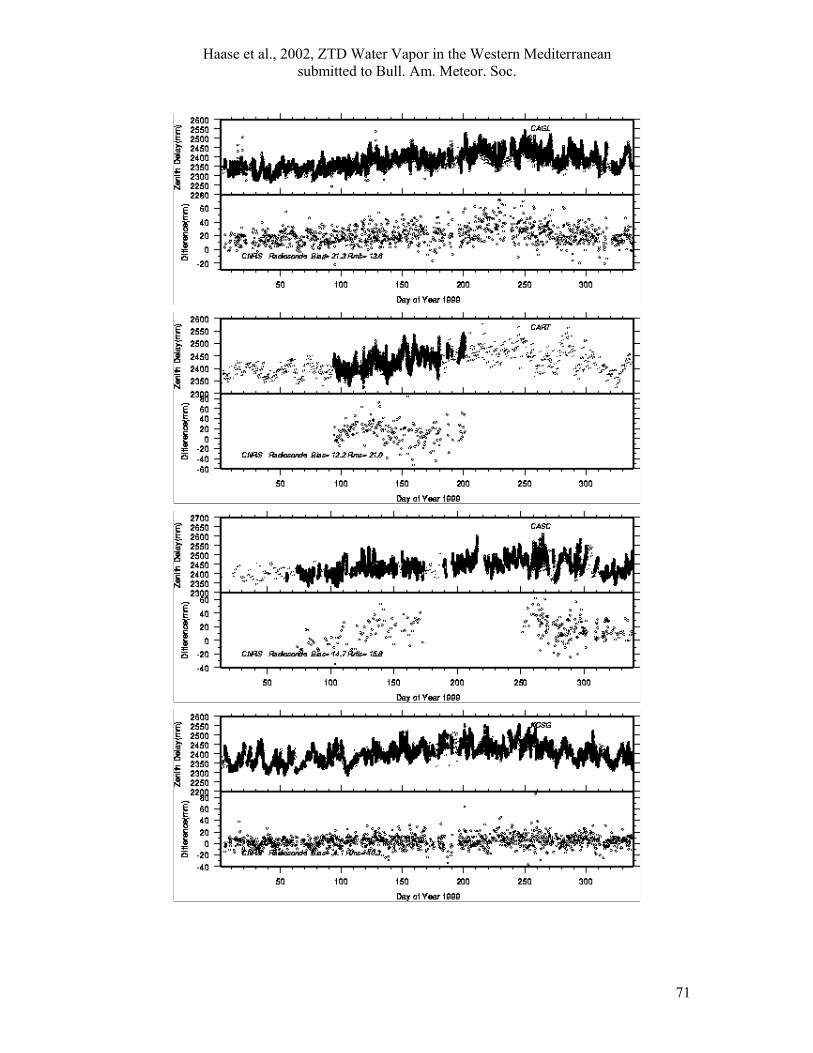
Haase et al., 2002, ZTD Water Vapor in the Western Mediterranean submitted to Bull. Am. Meteor. Soc.
71
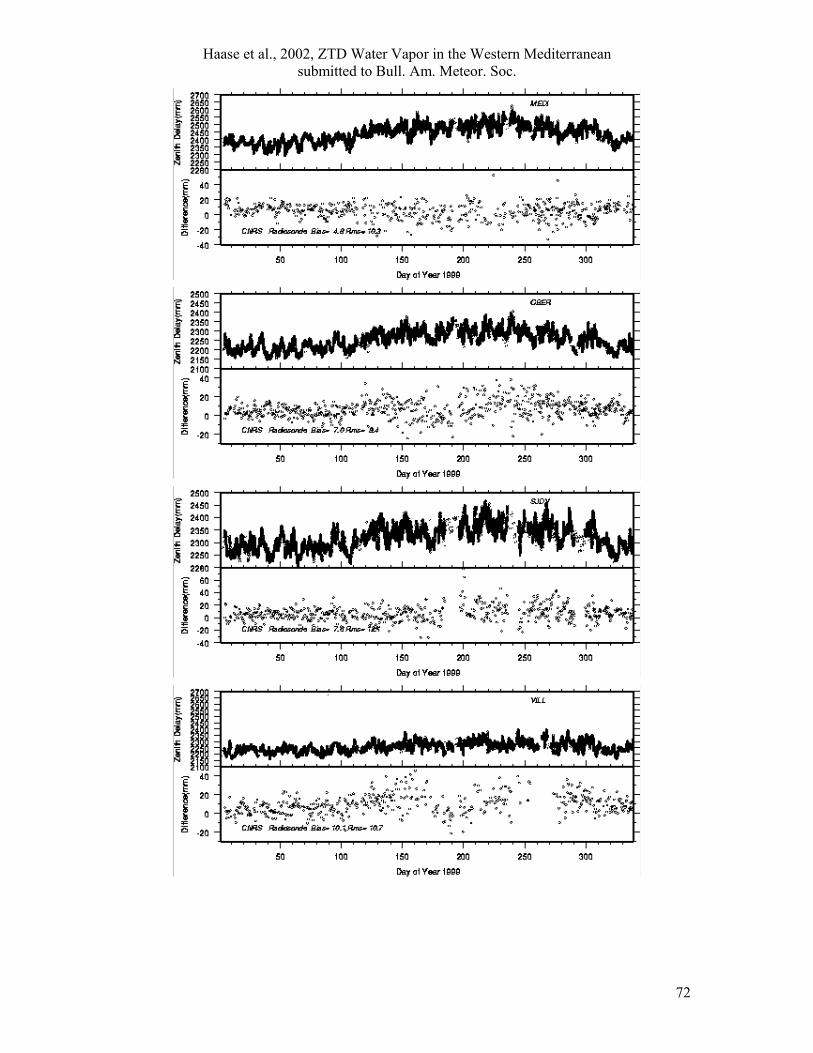
Haase et al., 2002, ZTD Water Vapor in the Western Mediterranean submitted to Bull. Am. Meteor. Soc.
72
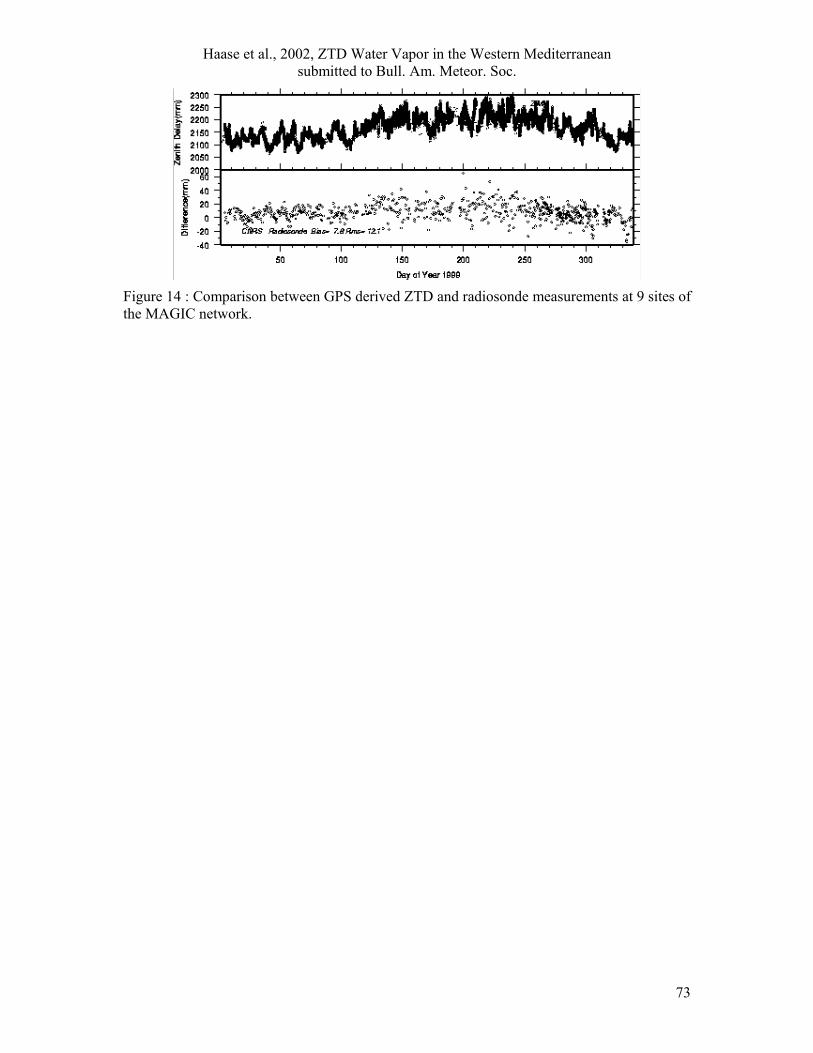
Haase et al., 2002, ZTD Water Vapor in the Western Mediterranean submitted to Bull. Am. Meteor. Soc.
73
Figure 14 : Comparison between GPS derived ZTD and radiosonde measurements at 9 sites of the MAGIC network.
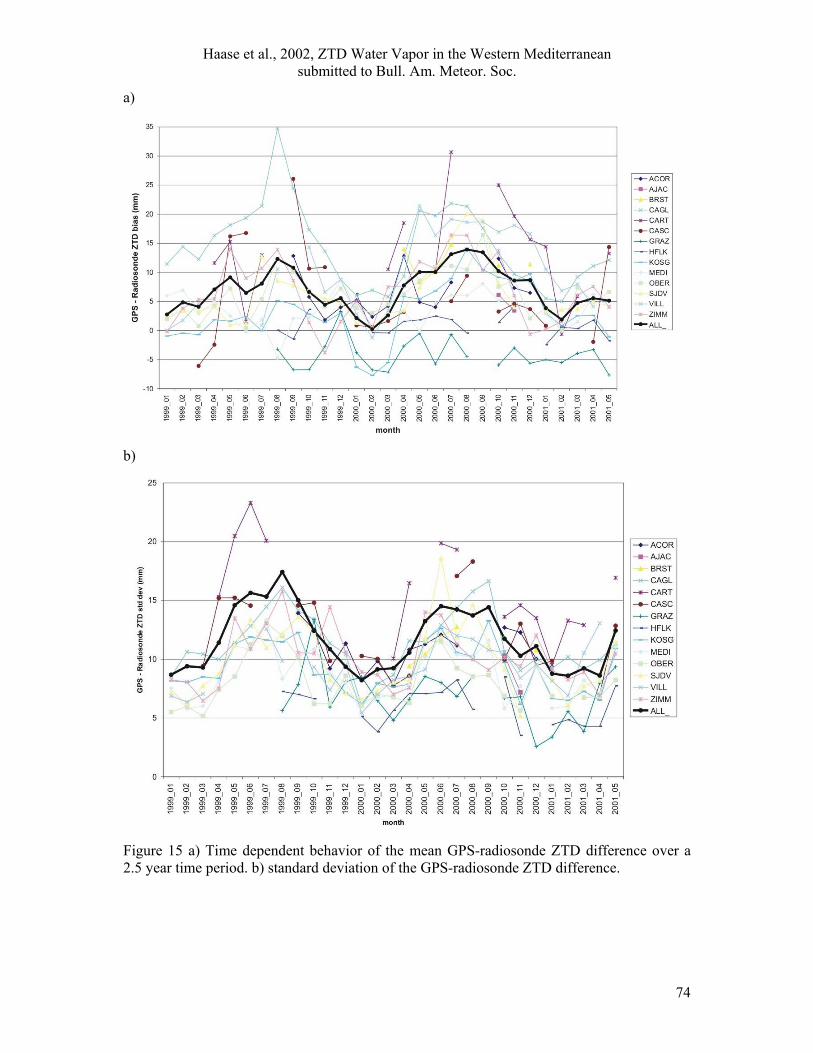
Haase et al., 2002, ZTD Water Vapor in the Western Mediterranean submitted to Bull. Am. Meteor. Soc.
74
a)
b)
Figure 15 a) Time dependent behavior of the mean GPS-radiosonde ZTD difference over a 2.5 year time period. b) standard deviation of the GPS-radiosonde ZTD difference.
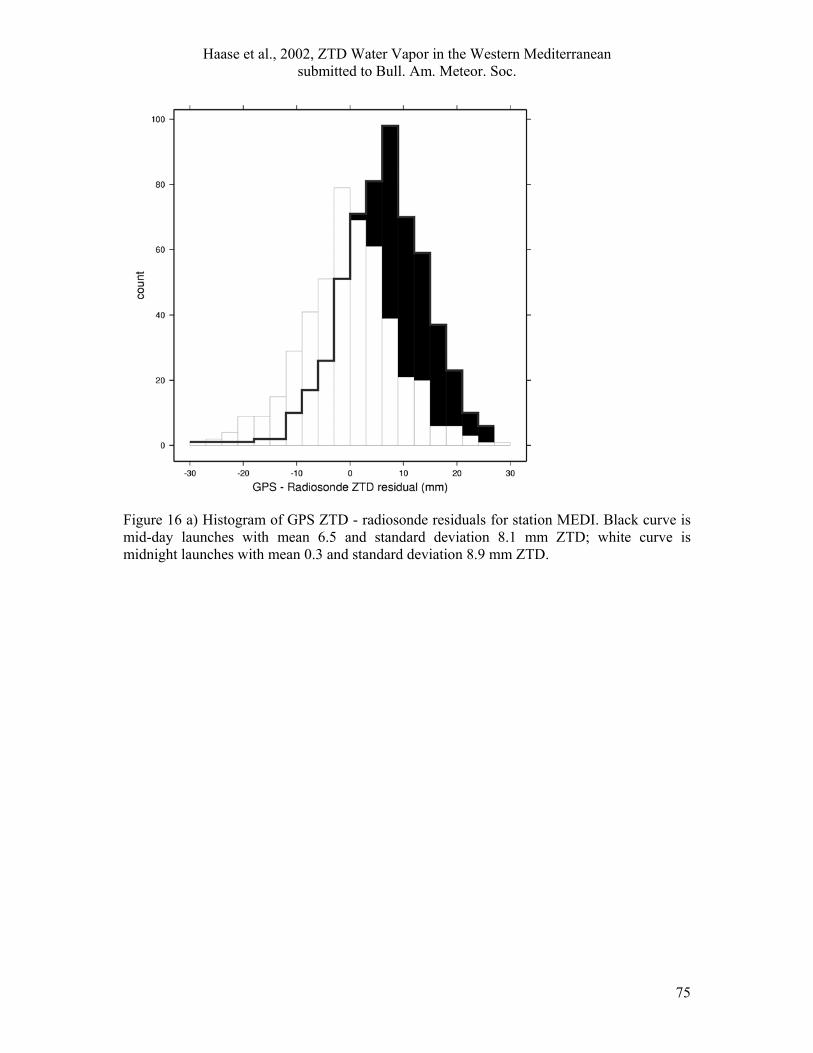
Haase et al., 2002, ZTD Water Vapor in the Western Mediterranean submitted to Bull. Am. Meteor. Soc.
75
Figure 16 a) Histogram of GPS ZTD - radiosonde residuals for station MEDI. Black curve is mid-day launches with mean 6.5 and standard deviation 8.1 mm ZTD; white curve is midnight launches with mean 0.3 and standard deviation 8.9 mm ZTD.
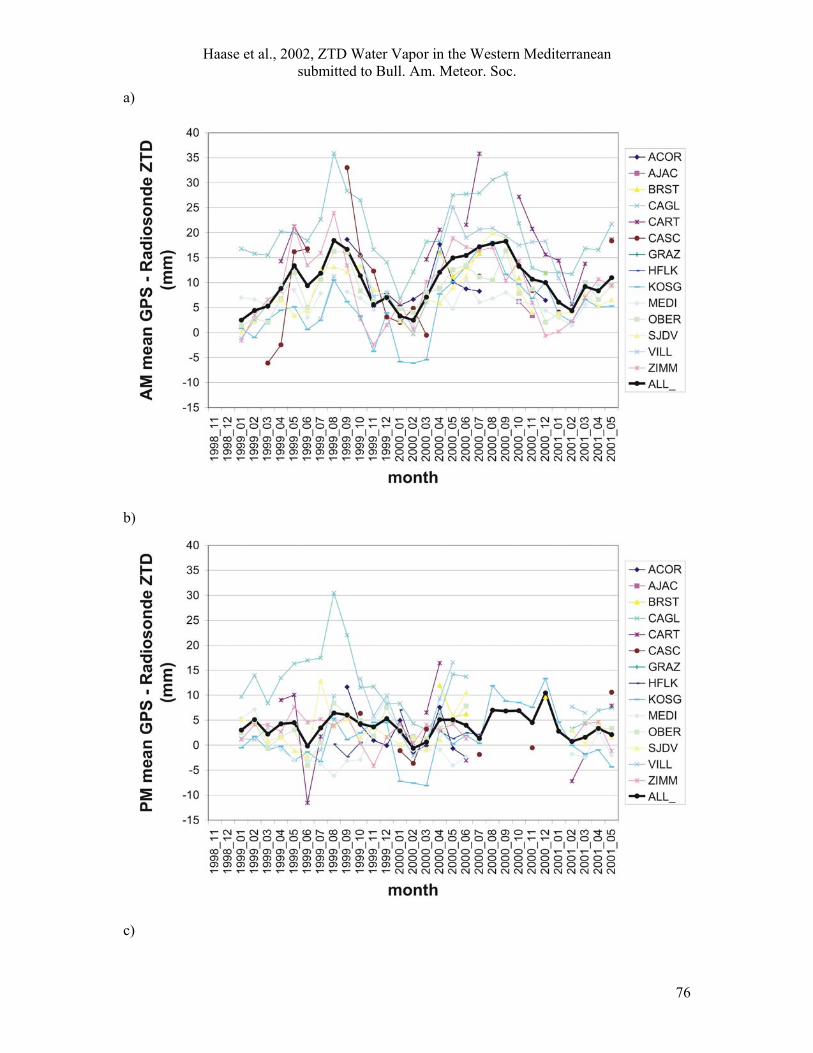
Haase et al., 2002, ZTD Water Vapor in the Western Mediterranean submitted to Bull. Am. Meteor. Soc.
76
a)
b)
c)
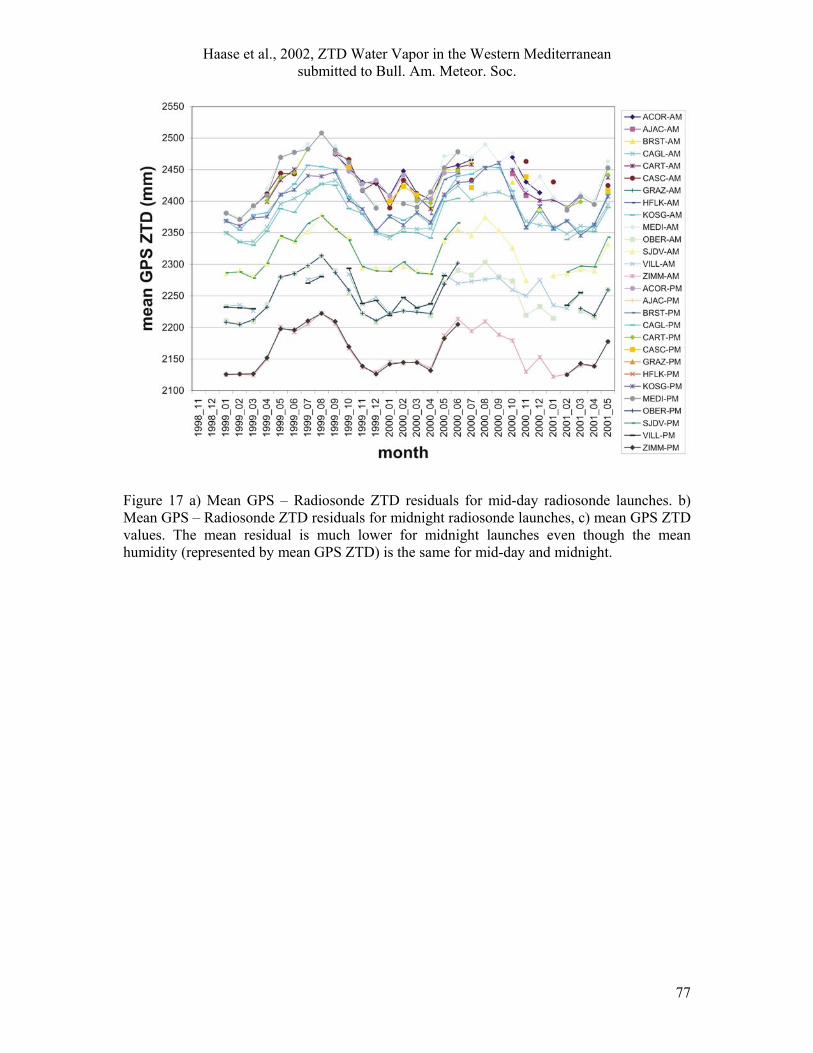
Haase et al., 2002, ZTD Water Vapor in the Western Mediterranean submitted to Bull. Am. Meteor. Soc.
77
Figure 17 a) Mean GPS – Radiosonde ZTD residuals for mid-day radiosonde launches. b) Mean GPS – Radiosonde ZTD residuals for midnight radiosonde launches, c) mean GPS ZTD values. The mean residual is much lower for midnight launches even though the mean humidity (represented by mean GPS ZTD) is the same for mid-day and midnight.
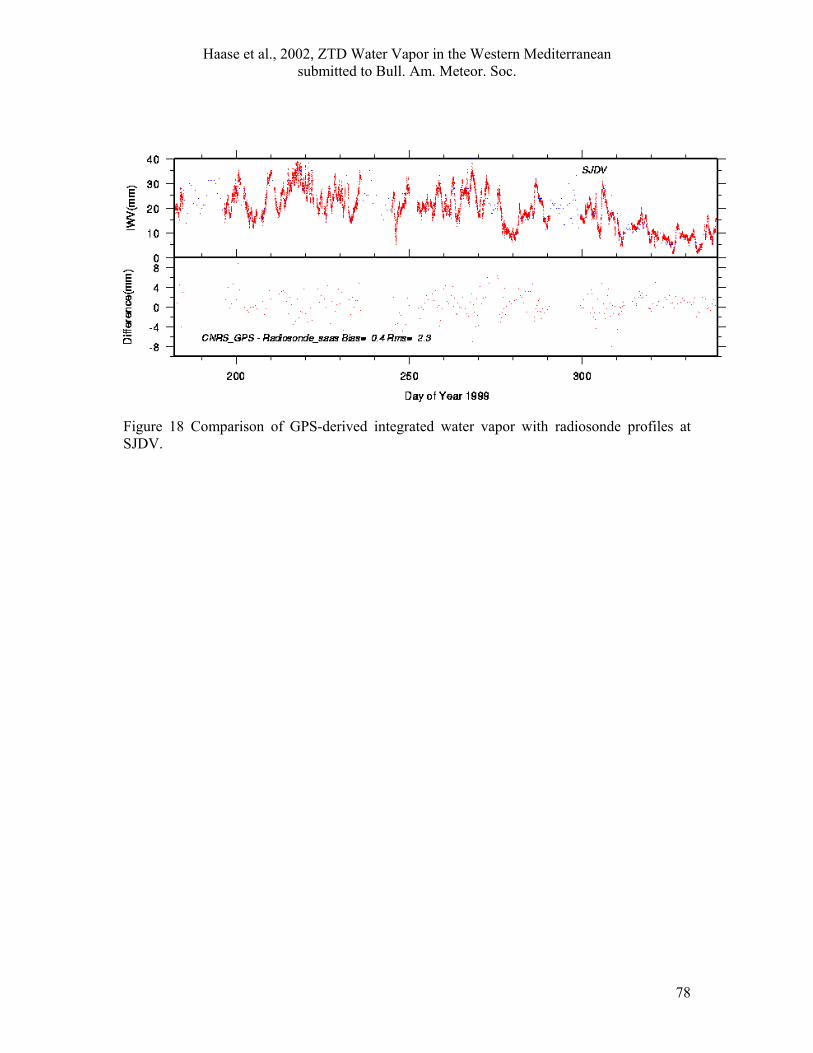
Haase et al., 2002, ZTD Water Vapor in the Western Mediterranean submitted to Bull. Am. Meteor. Soc.
78
Figure 18 Comparison of GPS-derived integrated water vapor with radiosonde profiles at SJDV.

Haase et al., 2002, ZTD Water Vapor in the Western Mediterranean submitted to Bull. Am. Meteor. Soc.
79
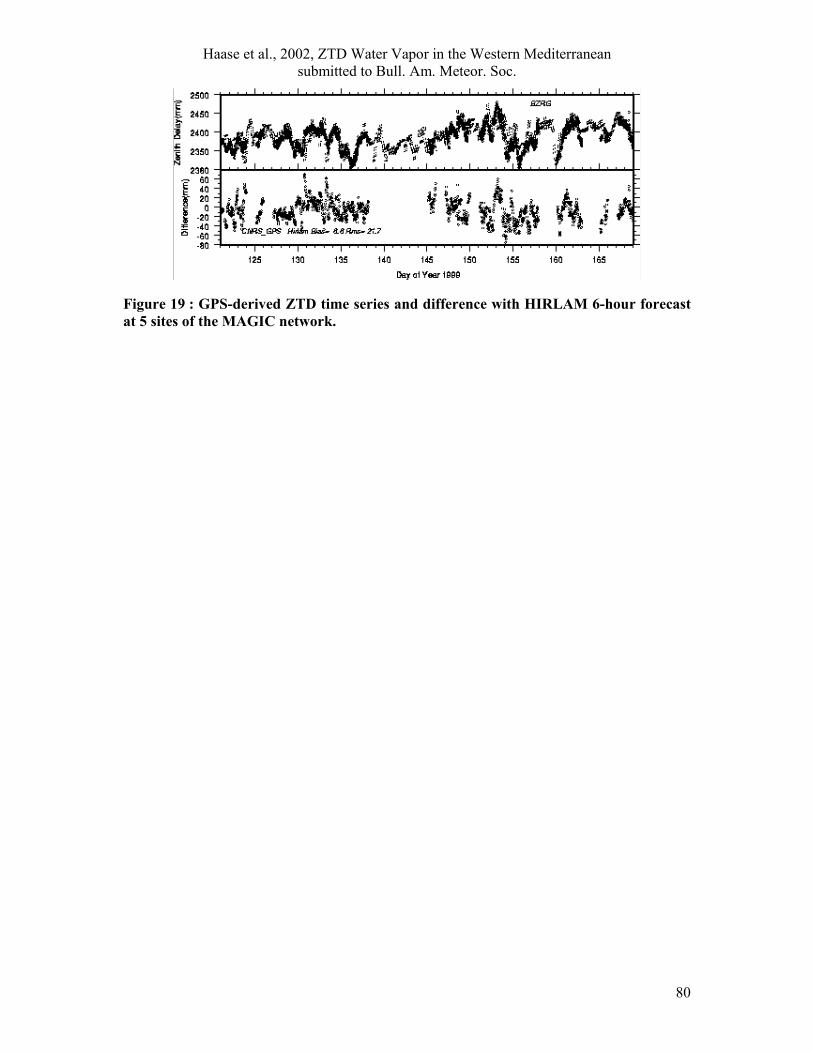
Haase et al., 2002, ZTD Water Vapor in the Western Mediterranean submitted to Bull. Am. Meteor. Soc.
80
Figure 19 : GPS-derived ZTD time series and difference with HIRLAM 6-hour forecast at 5 sites of the MAGIC network.

Haase et al., 2002, ZTD Water Vapor in the Western Mediterranean submitted to Bull. Am. Meteor. Soc.
81
Figure 20 Average and standard deviation of the difference between GPS ZTD and Hirlam ZTD for each station. Stations are sorted by latitude. Average and standard deviation for all stations together are shown by ALL_.
0.7
0.75
0.8
0.85
0.9
0.95
1
MA
S1
ME
LILA
MP
SFE
RN
OTO
CAR
TA
LAC
CA
SC
CA
GL
CO
SE
MAH
OV
ILLM
ATEE
BR
EB
ELL
CR
EUA
QU
ILLIVE
SC
OU
NPG
MAR
SA
CO
RTO
UL
MTP
LG
INA
GR
AS
MIC
HG
EN
OM
EDI
TOR
IM
OD
AC
HAT
UP
AD
FCLZ
SJDV
BZRG
ZIMM
GR
AZ
HFLK
OB
ER
WTZR
KO
SG
station (sorted by increasing latitude)
GPS
- H
IRLA
M Z
TD c
orre
latio
n co
effic
ient
Figure 21 Histogram of correlation coefficient between the GPS ZTD and HIRLAM ZTD time series for each site, with sites sorted by increasing geographic latitude. The correlation decreases with decreasing latitude.

Haase et al., 2002, ZTD Water Vapor in the Western Mediterranean submitted to Bull. Am. Meteor. Soc.
82
Figure 22 Correlation between GPS ZTD and HIRLAM ZTD. Two of sites with the higher correlation coefficient are (a) WTZR, correlation coefficient R=0.96, and (b) UPAD, R=0.96. Two of the lower correlation sites are (c) VILL, R=0.89, and (d) NOTO, R=0.83. Light gray line has a 1:1 slope, dark gray line is the best linear fit to the data.
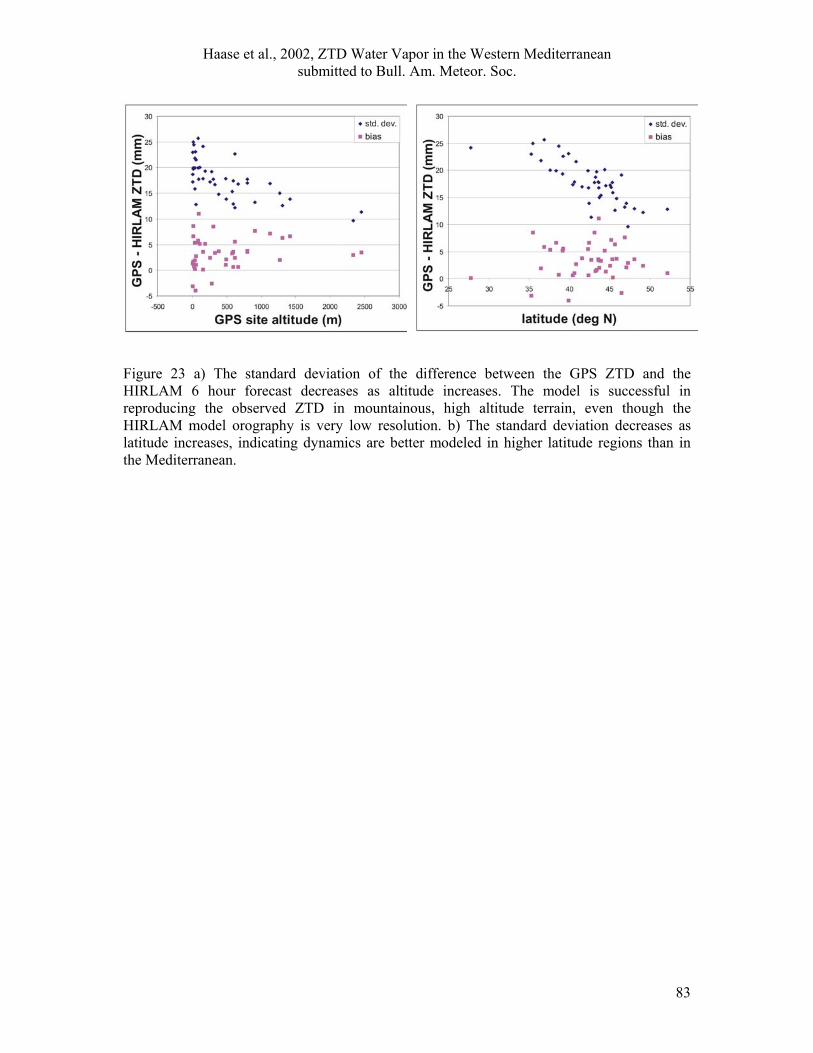
Haase et al., 2002, ZTD Water Vapor in the Western Mediterranean submitted to Bull. Am. Meteor. Soc.
83
Figure 23 a) The standard deviation of the difference between the GPS ZTD and the HIRLAM 6 hour forecast decreases as altitude increases. The model is successful in reproducing the observed ZTD in mountainous, high altitude terrain, even though the HIRLAM model orography is very low resolution. b) The standard deviation decreases as latitude increases, indicating dynamics are better modeled in higher latitude regions than in the Mediterranean.
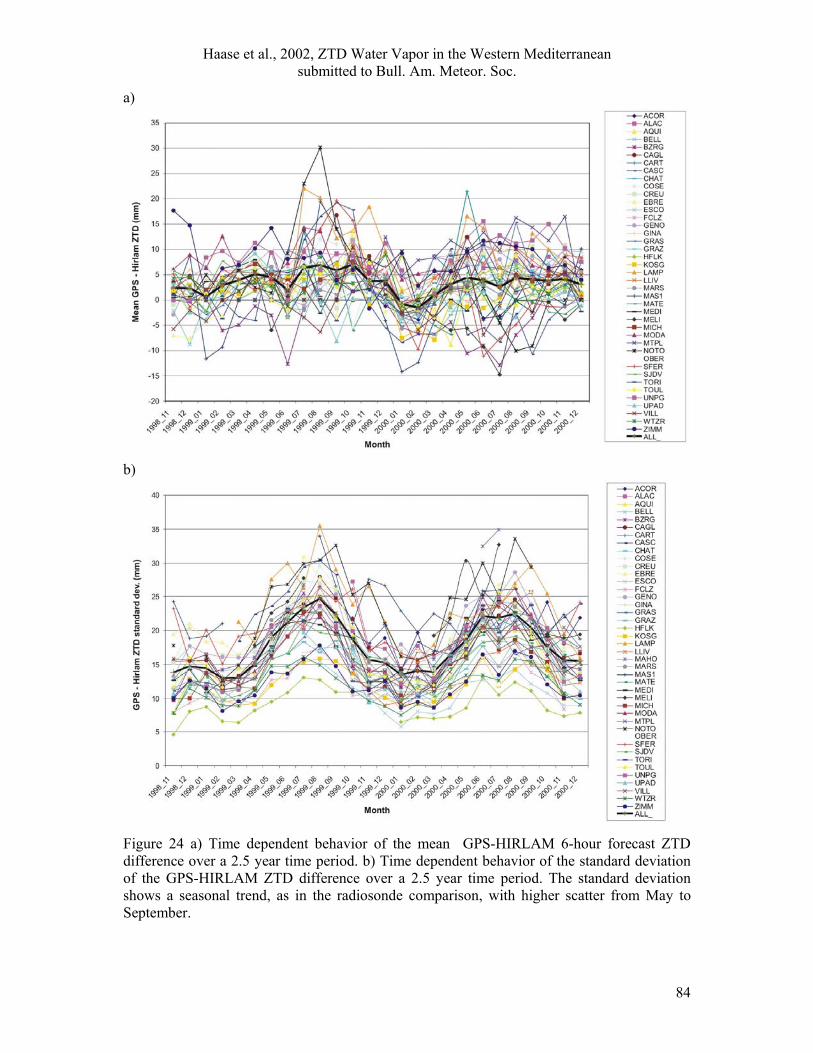
Haase et al., 2002, ZTD Water Vapor in the Western Mediterranean submitted to Bull. Am. Meteor. Soc.
84
a)
b)
Figure 24 a) Time dependent behavior of the mean GPS-HIRLAM 6-hour forecast ZTD difference over a 2.5 year time period. b) Time dependent behavior of the standard deviation of the GPS-HIRLAM ZTD difference over a 2.5 year time period. The standard deviation shows a seasonal trend, as in the radiosonde comparison, with higher scatter from May to September.

Haase et al., 2002, ZTD Water Vapor in the Western Mediterranean submitted to Bull. Am. Meteor. Soc.
85
-0.3
-0.2
-0.1
0.0
0.1
0.2
0.3
0.4
0.5
0.6
0.7
0.8
0.9
1.0
0 400 800 1200 1600 2000 2400 2800 3200
station separation (km)
Cor
rela
tion
coef
. of G
PS -
RS
ZTD
/
Figure 25 Correlation coefficient for ZTD GPS-Radiosonde differences compared between sites as a function of separation between the GPS sites.

Haase et al., 2002, ZTD Water Vapor in the Western Mediterranean submitted to Bull. Am. Meteor. Soc.
86
Figure 26. The correlation coefficient for the GPS-HIRLAM6 differences compared between sites as a function of separation. The circles are the correlation coefficients averaged over 50 km bins.

Haase et al., 2002, ZTD Water Vapor in the Western Mediterranean submitted to Bull. Am. Meteor. Soc.
87