Accumulation mode aerosol number concentrations in the...
14
Accumulation‐mode aerosol number concentrations in the Arctic during the ARCTAS aircraft campaign: Long‐range transport of polluted and clean air from the Asian continent H. Matsui, 1 Y. Kondo, 1 N. Moteki, 1 N. Takegawa, 2 L. K. Sahu, 3 M. Koike, 1 Y. Zhao, 4 H. E. Fuelberg, 5 W. R. Sessions, 5 G. Diskin, 6 B. E. Anderson, 6 D. R. Blake, 7 A. Wisthaler, 8 M. J. Cubison, 9 and J. L. Jimenez 9 Received 2 May 2011; revised 9 August 2011; accepted 9 August 2011; published 29 October 2011. [1] We evaluate the impact of transport from midlatitudes on aerosol number concentrations in the accumulation mode (light‐scattering particles (LSP) with diameters >180 nm) in the Arctic during the Arctic Research of the Composition of the Troposphere from Aircraft and Satellites (ARCTAS) campaign. We focus on transport from the Asian continent. We find marked contrasts in the number concentration (N LSP ), transport efficiency (TE N_LSP , the fraction transported from sources to the Arctic), size distribution, and the chemical composition of aerosols between air parcels from anthropogenic sources in East Asia (Asian AN) and biomass burning sources in Russia and Kazakhstan (Russian BB). Asian AN air had lower N LSP and TE N_LSP (25 cm -3 and 18% in spring and 6.2 cm -3 and 3.0% in summer) than Russian BB air (280 cm -3 and 97% in spring and 36 cm -3 and 7.6% in summer) due to more efficient wet scavenging during transport from East Asia. Russian BB in this spring is the most important source of accumulation‐mode aerosols over the Arctic, and BB emissions are found to be the primary source of aerosols within all the data in spring during ARCTAS. On the other hand, the contribution of Asian AN transport had a negligible effect on the accumulation‐mode aerosol number concentration in the Arctic during ARCTAS. Compared with background air, N LSP was 2.3–4.7 times greater for Russian BB air but 2.4–2.6 times less for Asian AN air in both spring and summer. This result shows that the transport of Asian AN air decreases aerosol number concentrations in the Arctic, despite the large emissions of aerosols in East Asia. The very low aerosol number concentrations in Asian AN air were caused by wet removal during vertical transport in association with warm conveyor belts (WCBs). Therefore, this cleansing effect will be prominent for air transported via WCBs from other midlatitude regions and seasons. The inflow of clean midlatitude air can potentially have an important impact on accumulation‐mode aerosol number concentrations in the Arctic. Citation: Matsui, H., et al. (2011), Accumulation‐mode aerosol number concentrations in the Arctic during the ARCTAS aircraft campaign: Long‐range transport of polluted and clean air from the Asian continent, J. Geophys. Res., 116, D20217, doi:10.1029/2011JD016189. 1. Introduction [2] High concentrations of aerosols occur in the Arctic (Arctic Haze) in winter and spring because of efficient transport of pollutants from midlatitudes and slow removal processes in these seasons [Barrie, 1986; Shaw, 1995]. These aerosols are considered to significantly contribute to Arctic warming [Shindell and Faluvegi, 2009] through reduction of the surface albedo [Flanner et al., 2007, 2009; Hansen and Nazarenko, 2004] and enhancement of cloud 1 Department of Earth and Planetary Science, Graduate School of Science, University of Tokyo, Tokyo, Japan. 2 Research Center for Advanced Science and Technology, University of Tokyo, Tokyo, Japan. 3 Department of Space, Physical Research Laboratory, Ahmedabad, India. 4 Air Quality Research Center, University of California, Davis, California, USA. 5 Department of Meteorology, Florida State University, Tallahassee, Florida, USA. 6 Chemistry and Dynamics Branch, NASA Langley Research Center, Hampton, Virginia, USA. 7 Department of Chemistry, University of California, Irvine, California, USA. 8 Institute of Ion Physics and Applied Physics, University of Innsbruck, Innsbruck, Austria. 9 Department of Chemistry and Biochemistry and CIRES, University of Colorado at Boulder, Boulder, Colorado, USA. Copyright 2011 by the American Geophysical Union. 0148‐0227/11/2011JD016189 JOURNAL OF GEOPHYSICAL RESEARCH, VOL. 116, D20217, doi:10.1029/2011JD016189, 2011 D20217 1 of 14
Transcript of Accumulation mode aerosol number concentrations in the...

Accumulation‐mode aerosol number concentrations in the Arcticduring the ARCTAS aircraft campaign: Long‐range transportof polluted and clean air from the Asian continent
H. Matsui,1 Y. Kondo,1 N. Moteki,1 N. Takegawa,2 L. K. Sahu,3 M. Koike,1 Y. Zhao,4
H. E. Fuelberg,5 W. R. Sessions,5 G. Diskin,6 B. E. Anderson,6 D. R. Blake,7
A. Wisthaler,8 M. J. Cubison,9 and J. L. Jimenez9
Received 2 May 2011; revised 9 August 2011; accepted 9 August 2011; published 29 October 2011.
[1] We evaluate the impact of transport from midlatitudes on aerosol numberconcentrations in the accumulation mode (light‐scattering particles (LSP) with diameters>180 nm) in the Arctic during the Arctic Research of the Composition of the Tropospherefrom Aircraft and Satellites (ARCTAS) campaign. We focus on transport from theAsian continent. We find marked contrasts in the number concentration (NLSP), transportefficiency (TEN_LSP, the fraction transported from sources to the Arctic), size distribution,and the chemical composition of aerosols between air parcels from anthropogenic sourcesin East Asia (Asian AN) and biomass burning sources in Russia and Kazakhstan(Russian BB). Asian AN air had lower NLSP and TEN_LSP (25 cm−3 and 18% in spring and6.2 cm−3 and 3.0% in summer) than Russian BB air (280 cm−3 and 97% in spring and36 cm−3 and 7.6% in summer) due to more efficient wet scavenging during transport fromEast Asia. Russian BB in this spring is the most important source of accumulation‐modeaerosols over the Arctic, and BB emissions are found to be the primary source of aerosolswithin all the data in spring during ARCTAS. On the other hand, the contribution ofAsian AN transport had a negligible effect on the accumulation‐mode aerosol numberconcentration in the Arctic during ARCTAS. Compared with background air, NLSP was2.3–4.7 times greater for Russian BB air but 2.4–2.6 times less for Asian AN air inboth spring and summer. This result shows that the transport of Asian AN air decreasesaerosol number concentrations in the Arctic, despite the large emissions of aerosols in EastAsia. The very low aerosol number concentrations in Asian AN air were caused by wetremoval during vertical transport in association with warm conveyor belts (WCBs).Therefore, this cleansing effect will be prominent for air transported via WCBs from othermidlatitude regions and seasons. The inflow of clean midlatitude air can potentially havean important impact on accumulation‐mode aerosol number concentrations in the Arctic.
Citation: Matsui, H., et al. (2011), Accumulation‐mode aerosol number concentrations in the Arctic during the ARCTASaircraft campaign: Long‐range transport of polluted and clean air from the Asian continent, J. Geophys. Res., 116, D20217,doi:10.1029/2011JD016189.
1. Introduction
[2] High concentrations of aerosols occur in the Arctic(Arctic Haze) in winter and spring because of efficient
transport of pollutants from midlatitudes and slow removalprocesses in these seasons [Barrie, 1986; Shaw, 1995].These aerosols are considered to significantly contribute toArctic warming [Shindell and Faluvegi, 2009] throughreduction of the surface albedo [Flanner et al., 2007, 2009;Hansen and Nazarenko, 2004] and enhancement of cloud
1Department of Earth and Planetary Science, Graduate School ofScience, University of Tokyo, Tokyo, Japan.
2Research Center for Advanced Science and Technology, University ofTokyo, Tokyo, Japan.
3Department of Space, Physical Research Laboratory, Ahmedabad,India.
4Air Quality Research Center, University of California, Davis,California, USA.
5Department of Meteorology, Florida State University, Tallahassee,Florida, USA.
6Chemistry and Dynamics Branch, NASA Langley Research Center,Hampton, Virginia, USA.
7Department of Chemistry, University of California, Irvine, California,USA.
8Institute of Ion Physics and Applied Physics, University of Innsbruck,Innsbruck, Austria.
9Department of Chemistry and Biochemistry and CIRES, University ofColorado at Boulder, Boulder, Colorado, USA.
Copyright 2011 by the American Geophysical Union.0148‐0227/11/2011JD016189
JOURNAL OF GEOPHYSICAL RESEARCH, VOL. 116, D20217, doi:10.1029/2011JD016189, 2011
D20217 1 of 14

longwave emissivity [Lubin and Vogelmann, 2006; Garrettand Zhao, 2006].[3] Previous studies have suggested that Arctic pollution in
the lower troposphere (LT) is mainly from northern Eurasia(Europe and Siberia) [e.g., Stohl, 2006; Law and Stohl, 2007;Klonecki et al., 2003; Huang et al., 2010]. However, thesources, transport pathways, removal processes, and dis-tributions of aerosols in the Arctic are still uncertain, partic-ularly in the middle and upper troposphere (MT and UT).Simulated aerosol concentrations in the Arctic are generallyquite variable between models, primarily due to the differenttreatments of transport, transformation, and removal pro-cesses in different models [Shindell et al., 2008; Koch et al.,2009]. To reduce these uncertainties, it is essential to vali-date these model calculations with detailed measurements ofaerosols (e.g., number and volume concentrations, chemicalcomposition) and information on sources and transportprocesses.[4] A number of studies on aerosol number concentrations
have been made in the Arctic previously based on aircraftmeasurements [e.g., Schnell and Raatz, 1984; Radke et al.,1984; Barrie, 1986; Leaitch et al., 1989, 1994; Brock et al.,1990; Yum and Hudson, 2001; Yamanouchi et al., 2005;Engvall et al., 2008a] and near‐surface measurements, e.g.,at Barrow station, Alaska, at Alert station, Canada, and atZeppelin station, Norway [e.g., Barrie, 1986; Staebleret al., 1994, 1999; Quinn et al., 2002; Ström et al., 2003;Heintzenberg et al., 2006; Engvall et al., 2008b]. Somestudies have reported vertical profiles of aerosol numberconcentration in the Arctic including MT and UT, e.g.,vertical profiles from near the surface to 5–7 km over theAlaskan Arctic during Arctic Gas and Aerosol SamplingProgram (AGASP) campaign in March 1983 [Schnell andRaatz, 1984], over the Canadian Arctic during AGASP IIin April 1986 [Leaitch et al., 1989] and during April 1992
[Leaitch et al., 1994], over the Alaskan Arctic Ocean duringMay 1998 [Yum and Hudson, 2001], and during the ArcticStudy of Tropospheric Aerosol and Radiation (ASTAR)campaign in March 2000 [Yamanouchi et al., 2005] and inMay–June 2004 [Engvall et al., 2008a]. However, they didnot fully clarify the impact of different source regions andtypes (anthropogenic or biomass burning) of aerosols in theMT and UT and did not interpret aerosol pathways andprocesses during long‐range transport from sources to theArctic.[5] Aerosol number concentrations were measured exten-
sively during the NASA Arctic Research of the Compositionof the Troposphere from Aircraft and Satellites (ARCTAS)aircraft campaign conducted in and near the Arctic in Apriland June–July 2008 [Jacob et al., 2010]. Using these data,we evaluate the impacts of transport from the midlatitudeson aerosol number concentrations in the accumulation mode(measured diameters of 180–860 nm (section 2)) in theArctic, especially from the Asian continent. We focus on airparcels from Asia because the ARCTAS measurementswere made mainly over the Alaskan and Canadian Arcticregion, which received air mostly originating from Asia[Fuelberg et al., 2010]. We characterize differences inaccumulation‐mode number concentration, size distribution,chemical composition, and transport efficiency of aerosolsbetween air parcels influenced by anthropogenic emissions inEast Asia (Asian AN) (e.g., China, Korea, and Japan) andemissions from biomass burning in Russia and Kazakhstan(Russian BB). Acronyms used in this study are summarizedin Table 1.
2. Measurements and Methods
2.1. ARCTAS Observations
[6] Measurements of aerosols and other related specieswere made on board the NASA DC‐8 aircraft during theARCTAS aircraft campaign. Overviews of the ARCTAScampaign and meteorological conditions during the obser-vation periods have been given by Jacob et al. [2010] andFuelberg et al. [2010], respectively. In this study, we usedNorth American Arctic data (one‐minute average data),which was selected by Matsui et al. [2011] (referred to asM2011, hereafter): 5 flights (Flights 06–10) over the AlaskanArctic from 8 to 17 April (ARCTAS‐A) and 2 flights(Flights 21–22) over the Canadian Arctic from 8 to 9 July(ARCTAS‐B) (Figure 1). These data do not contain airparcels in the stratosphere (defined as ozone mixing ratio>120 ppbv) and in clouds (defined as liquid or ice watercontents >0.01 g m−3) (M2011). M2011 suggested using sat-ellite measurements that these flights during the ARCTAS‐Aand ARCTAS‐B campaigns were representative of the NorthAmerican Arctic in April and July 2008, respectively.[7] The number and volume size distributions of light‐
scattering particles (LSP), which do not contain black carbon(BC) particles with volume‐equivalent dry diameters largerthan about 180 nm, were measured together with BC‐containing particles by a Single Particle Soot Photometer(SP2) with high accuracy and temporal resolution [Motekiand Kondo, 2007]. We denote the measured number andvolume concentrations of LSP at standard temperature andpressure (STP) as NLSP and VLSP, respectively, and number,mass, and volume concentrations of BC at STP as NBC,
Table 1. Acronyms Used in This Study
Terminology Definition
LSP Light‐scattering particlesBC Black carbonMBC Mass concentration of BCNLSP, NBC Number concentration of LSP and BCNCPC Number concentration measured by CPC (>4 nm)VLSP, VBC Volume concentration of LSP and BCTEN_LSP, TEN_BC,TEV_LSP, TEM_BC
Transport efficiency of NLSP,NBC, VLSP, and MBC defined by equation (1)
FN_LSP, FN_BC,FV_LSP, FM_BC
Fractional source contribution to the total amountof NLSP, VLSP, NBC, and MBC definedby equation (2)
RSO4, RORG Average mass ratio of sulfate and organic aerosolsto the total measured mass concentrations
Asian AN Air parcel from anthropogenic sourcesin East Asia
Russian BB Air parcel from biomass burning sourcesin Russia and Kazakhstan
APT Accumulated precipitation along individualtrajectories
WCB Warm conveyor beltCCN Cloud condensation nucleiAIE Aerosol indirect effectBL Boundary layerLT Lower troposphereMT Middle troposphereUT Upper troposphere
MATSUI ET AL.: LONG‐RANGE TRANSPORT OF CN TO THE ARCTIC D20217D20217
2 of 14

MBC, and VBC, respectively. Detailed descriptions of theSP2 used during the ARCTAS campaign are given elsewhere[Moteki and Kondo, 2010; Kondo et al., 2010, 2011]. DuringARCTAS, the SP2 covered mass equivalent diameters of80–860 nm for BC particles and 180–860 nm for LSP[Kondo et al., 2011]. LSP consisted of 89% and 97% ofmeasured aerosol number and volume (LSP + BC), respec-tively, during the ARCTAS periods (average of 7 flightsused in this study). Since the diameter of 180 nm correspondsapproximately to the critical diameter of CCN at low super-saturations (supersaturation of about 0.1% and hygroscop-icity of about 0.3 [Petters and Kreidenweis, 2007]), NLSP
approximates the concentrations of particles that act asCCN at 0.1% supersaturation. We also used the measurementsof carbon monoxide (CO) [Sachse et al., 1987], acetonitrile(CH3CN) [Wisthaler et al., 2002], dichloromethane (CH2Cl2)[Blake et al., 2003], the aerosol chemical composition of par-ticulate matter smaller than 1 mm (PM1) [DeCarlo et al., 2006;Dunlea et al., 2009], the total aerosol number concentration(>4 nm) measured by condensation particle counters (NCPC)[Anderson et al., 1998], and aerosol volume concentrationsin the coarse mode determined by a TSI AerodynamicParticle Sizer (APS) Model 3321 (aerodynamic diameter of0.7–5 mm). Since the lifetimes of CO, CH3CN, and CH2Cl2are longer than one month in the atmosphere, we representthe short‐term variability of these species by the differencesbetween the measured and background concentrations of thesespecies, denoted DCO, DCH3CN, and DCH2Cl2, respec-tively. The definitions of the background concentrations aregiven by M2011.
2.2. Methods of Data Analysis
[8] The methods of data analysis used in this study aresimilar to those of M2011. In brief, source regions of indi-vidual air parcels were estimated from 10‐day backwardtrajectories released along the flight tracks [Fuelberg et al.,2010, and references therein]. The source regions weredefined by M2011 as the boundary layer (BL) from the sur-face to 700 hPa over four regions: Europe, Russia (includingKazakhstan), Asia (including China, Korea, and Japan), and
North America. We focus on source regions of Asia andRussia, shown in Figure 1. In this study, air parcels wereclassified as Russia, Asia, R+A (trajectories passing oversource regions of both Russia and Asia), and other (fromEurope or North America or source‐unidentified data).[9] It is a key issue to understand the relative contribu-
tions of AN and BB in the Arctic because recent studiessuggested the importance of BB emissions to Arctic haze [e.g.,Warneke et al., 2009, 2010]. In this study, source types (ANor BB) of individual air parcels were estimated from theconcentrations ofDCH2Cl2 andDCH3CN, which have beenoften used as tracers of AN and BB sources, respectively[e.g., Chen et al., 2007; Warneke et al., 2006]. AN air wasdefined as having high DCH2Cl2 (>5 pptv) and lowDCH3CN (<100 pptv), while BB air was defined as havinghigh DCH3CN (>50 pptv) and low DCH2Cl2 (<10 pptv)(Figure 3 of M2011). Air parcels with high DCH2Cl2 andDCH3CN were influenced by both AN and BB sources, andthey are denoted as ANBB. The criteria of source regionsand types was chosen so that we examine relatively fresh(within 10 days prior to measurement) air parcels clearlyinfluenced by AN and BB emissions. As a result, thesources (both regions and types) were identified for about25% of all the data (referred to as source‐identified data)(M2011).[10] We calculated accumulated precipitation along indi-
vidual trajectories (APT) using Global Precipitation Clima-tology Project (GPCP) global precipitation data [Huffmanet al., 2001; Adler et al., 2003] as in work by M2011.The amount of precipitation was summed (accumulated)along individual trajectories from where the air was sampledto when each trajectory reached one of the source regions(t hours before the measurements, dependent on trajectories)plus an additional 48 h within the sources, because airparcels may have already been influenced by precipitationwithin the source regions. Thus, the integration period forcalculating the APT was t + 48 h (<10 days). The rationalefor choosing the additional 48 h was discussed by M2011.Results did not change qualitatively when other integra-tion periods (t + 24 h or t hours) were used for calculatingAPT values. We used the APT values as a measure of wetremoval processes during transport. We note that APT isa broad measure because we use surface precipitationamounts. Precipitation may occur below air parcels, that doesnot affect aerosols in the air parcels.[11] The ratios NLSP/DCO, VLSP/DCO, NBC/DCO, and
MBC/DCOwere used as indicators of the transport efficiency(TE) of NLSP (TEN_LSP), VLSP (TEV_LSP), NBC (TEN_BC), andMBC (TEM_BC), respectively, during transport from sourcesto the Arctic. TE values at time t were defined by the fol-lowing equations.
TEN LSP;t ¼ NLSP=DCO½ �tNLSP=DCO½ �dry
; TEV LSP;t ¼ VLSP=DCO½ �tVLSP=DCO½ �dry
TEN BC;t ¼ NBC=DCO½ �tNBC=DCO½ �dry
; TEM BC;t ¼ MBC=DCO½ �tMBC=DCO½ �dry
ð1Þ
In this equation, [NLSP/DCO]t, [VLSP/DCO]t, [NBC/DCO]t,and [MBC/DCO]t are the NLSP/DCO, VLSP/DCO, NBC/DCO,and MBC/DCO ratios at time t. The data withDCO > 20 ppbv
Figure 1. Flight tracks in spring (blue, 5 flights) andsummer (red, 2 flights) in and near the Arctic during theARCTAS campaign used in this study. Green and redsquares show the source regions defined in this study.
MATSUI ET AL.: LONG‐RANGE TRANSPORT OF CN TO THE ARCTIC D20217D20217
3 of 14

were used for the statistical analysis. [NLSP/DCO]dry, [VLSP/DCO]dry, [NBC/DCO]dry, and [MBC/DCO]dry are the ratiosfor air with a minimum impact of wet removal processes.These dry ratios were estimated using AN and BB air datawith APT < 5 mm in spring. We used these dry ratiosobtained in spring also for summer, because of very limiteddata with APT < 5 mm for summer.[12] Both numerators and denominators in equation (1)
include the increase in VLSP and NLSP by condensationand nucleation processes and the decrease in NLSP and NBC
by coagulation processes during transport from sources to theArctic. Therefore, these processes will partly compensateeach other in the TE calculations using equation (1). As aresult, we can regard the TE values as a measure of transportefficiency mostly due to removal processes during transport.[13] We note that the dry ratios for AN air were derived
mainly from North American air, because there are fewAsian air data with APT < 5 mm. The TE values in AsianAN air are likely overestimates, because the dry ratios ofNLSP/DCO, VLSP/DCO, NBC/DCO, and MBC/DCO observedin East Asia (A‐FORCE aircraft campaign (N. Oshima et al.,
Wet removal of black carbon in Asian outflow: AerosolRadiative Forcing in East Asia (A‐FORCE) aircraft cam-paign, submitted to Journal of Geophysical Research, 2011))were measured to be about 1.4 times higher than those ofAN air estimated in this study.
3. Transport Pathways and Processesof Air Parcels
[14] The transport pathways and processes of measured airparcels have been already analyzed in detail by M2011.Here we briefly summarize their main findings and provideadditional results from the viewpoint of the contrast betweenAsian AN and Russian BB air. During the springtime, mostAsian AN air parcels originated from lower latitudes (30°–40°N) with high relative humidity. They then underwentrapid ascent on the warmer side of cold fronts associatedwith low‐pressure systems and were transported northwardand reached the Arctic within a few days after experiencingheavy precipitation and large amounts of latent heating(Figure 2a). These transport pathways are frequently seen in
Figure 2. Ten‐day backward trajectories for (a) Asian AN and (b) Russian BB air during the ARCTAS‐A(spring) campaign. PI denotes precipitation intensity. The periods when PI < 0.01mm/h are shownwith graydots.
MATSUI ET AL.: LONG‐RANGE TRANSPORT OF CN TO THE ARCTIC D20217D20217
4 of 14

this region and season and are generally due to warm con-veyor belts (WCBs) [e.g., Stohl, 2001; Eckhardt et al., 2003;Oshima et al., 2004; Harrigan et al., 2011; Sessions et al.,2010]. The median APT value was 24 mm for Asian AN air(Table 2). The median transport time from their source (fromWCB lifting) to the measurement sites was 7.8 (2.4) days.Since the Asian AN air had relatively high potential tem-perature at its source and experienced further diabatic heating(due to latent heat release during the WCB ascent), they weregenerally observed in the UT (300–500 hPa), as shown inFigure 3.[15] On the other hand, Russian BB air parcels were
transported almost isentropically from higher latitudes (50°–70°N), hence they encountered less precipitation and latentheating (Figure 2b). The median APT value was 8.5 mm forRussian BB air (Table 2). The median transport time fromtheir source to the Arctic was 3.5 days. Since Russian BB airhad lower potential temperature in the source regions andexperienced quasi‐adiabatic transport, it was mostly observedin the MT (500–700 hPa) (Figure 3). As a result, the medianMBC and TEM_BC values were much less for Asian AN air(18 ng m−3 and 13%, respectively) than for Russian BB air(266 ng m−3 and 83%, respectively).[16] The median APT during summer was much greater
(17 mm) than during spring (3.2 mm) for all flight data usedin this study. This was mainly due to the greater precipita-tion and accompanying wet scavenging over the latitudes45°–70°N during summer. Correspondingly, the TEM_BC
values for both Russian BB and Asian AN air were muchlower during summer (4.0 and 0.76%, respectively) thanduring spring (83 and 13%, respectively). The median MBC
for all measured air parcels in the Arctic was 5.7 ng m−3,which is 10 times less than during spring (55 ng m−3), whilethe median DCO mixing ratio was somewhat higher thanduring spring (23 ppbv versus 14 ppbv).[17] The high TEM_BC − APT correlation (R2 = 0.80
between median values of log (TEM_BC) and APT forindividual sources and seasons, Figure 13b of M2011),together with the seasonal variations in APT, suggest thatthe large seasonal variations in MBC were caused mainly bythose in the wet removal rates. The contribution of RussianBB in spring to the MBC in the North American Arctic was
largest, because of the spring maximum in TEM_BC with lowprecipitation at higher latitudes.
4. Variation of Accumulation‐Mode AerosolNumber Concentration
4.1. Transport Efficiency of NLSP and NBC
From Asia to the Arctic
[18] Because the transport and removal processes differedgreatly between Asian AN and Russian BB air parcels, asshown in section 3, these processes should also affect theNLSP of individual air parcels. Figure 4 shows the scatterplotbetween the NLSP/DCO ratio and APT for all data (includingboth source‐identified and source‐unidentified data) used inthis study and that for individual source regions and types(AN and BB). On average, the NLSP/DCO ratio decreasedwith increasing APT in both spring and summer, indicatingthat removal by precipitation is one of the most importantprocesses in controlling NLSP in the Arctic. This tendency
Figure 3. Vertical profile of data number contribution(within the source‐identified data) from Russian BB (green),Russia+Asia BB (blue), Asian AN (red), Russia+Asia(orange), and others (gray) during the ARCTAS‐A (spring)campaign.
Table 2. Statistics of Individual Air Parcels During the ARCTAS Campaign
Source
Pressurea
(hPa)DCOa
(ppbv)NLSP
a
(cm−3)VLSP
a
(mm3 cm−3)NBC
a
(cm−3)MBC
a
(ng m−3)RORG
b
(%)RSO4
b
(%)APTa,c
(mm)
SpringAsia AN 410 32.4 25.4 0.49 2.8 18.4 24.4 66.5 23.7Russia BB 608 44.1 280 3.4 40.5 266 61.3 25.6 8.5Background — 614 1.8 59.7 0.83 5.5 42.9 25.8 61.3 3.8
SummerAsia AN 353 59.1 6.2 0.051 0.33 1.4 32.9 59.0 54.9Russia + Asia AN 329 78.9 4.3 0.036 0.17 0.99 48.1 43.8 30.2Russia + Asia BB, ANBB 466 83.8 35.5 0.43 2.1 15.8 54.9 36.4 38.5Russia BB, ANBB 527 69.6 36.4 0.40 2.1 13.6 67.8 25.4 19.0Background — 463 1.0 15.9 0.15 1.2 5.3 54.0 39.0 10.6
aMedian values are shown for these parameters.bRA denotes the average mass ratio of species A to the total measured submicron mass concentration (non‐refractory PM1 from the AMS plus BC from
the SP2).cAPT denotes accumulated precipitation along trajectories.
MATSUI ET AL.: LONG‐RANGE TRANSPORT OF CN TO THE ARCTIC D20217D20217
5 of 14
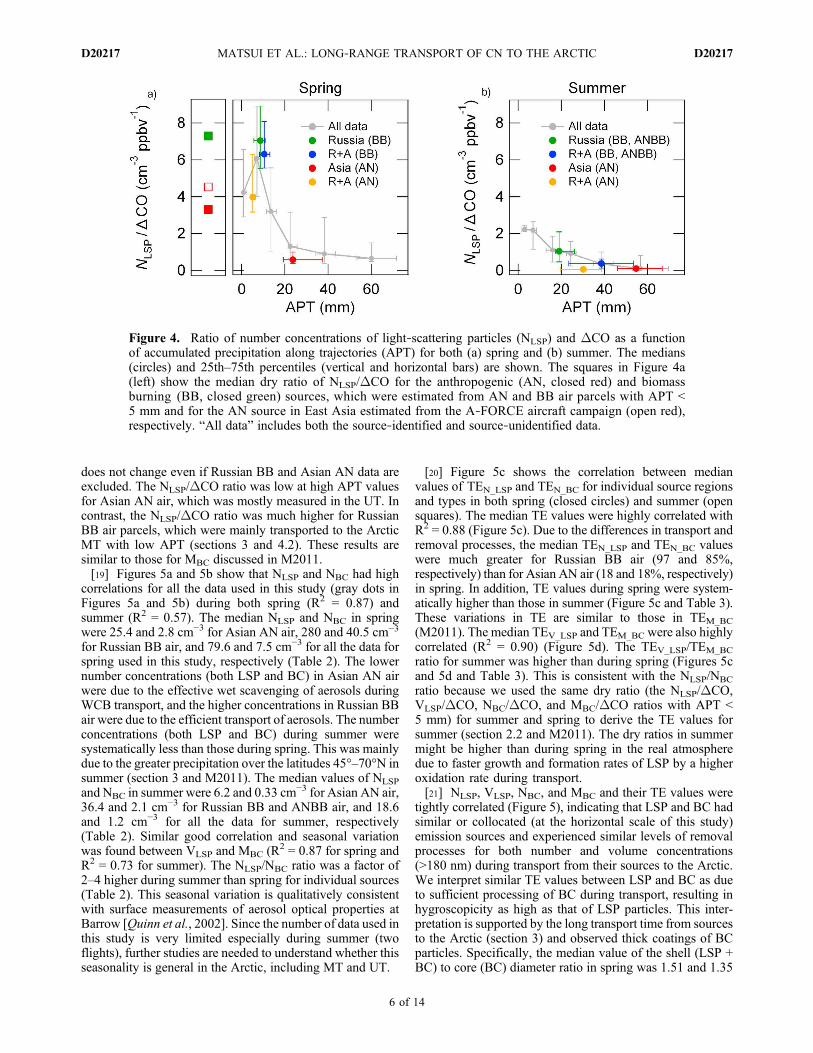
does not change even if Russian BB and Asian AN data areexcluded. The NLSP/DCO ratio was low at high APT valuesfor Asian AN air, which was mostly measured in the UT. Incontrast, the NLSP/DCO ratio was much higher for RussianBB air parcels, which were mainly transported to the ArcticMT with low APT (sections 3 and 4.2). These results aresimilar to those for MBC discussed in M2011.[19] Figures 5a and 5b show that NLSP and NBC had high
correlations for all the data used in this study (gray dots inFigures 5a and 5b) during both spring (R2 = 0.87) andsummer (R2 = 0.57). The median NLSP and NBC in springwere 25.4 and 2.8 cm−3 for Asian AN air, 280 and 40.5 cm−3
for Russian BB air, and 79.6 and 7.5 cm−3 for all the data forspring used in this study, respectively (Table 2). The lowernumber concentrations (both LSP and BC) in Asian AN airwere due to the effective wet scavenging of aerosols duringWCB transport, and the higher concentrations in Russian BBair were due to the efficient transport of aerosols. The numberconcentrations (both LSP and BC) during summer weresystematically less than those during spring. This was mainlydue to the greater precipitation over the latitudes 45°–70°N insummer (section 3 and M2011). The median values of NLSP
and NBC in summer were 6.2 and 0.33 cm−3 for Asian AN air,36.4 and 2.1 cm−3 for Russian BB and ANBB air, and 18.6and 1.2 cm−3 for all the data for summer, respectively(Table 2). Similar good correlation and seasonal variationwas found between VLSP and MBC (R2 = 0.87 for spring andR2 = 0.73 for summer). The NLSP/NBC ratio was a factor of2–4 higher during summer than spring for individual sources(Table 2). This seasonal variation is qualitatively consistentwith surface measurements of aerosol optical properties atBarrow [Quinn et al., 2002]. Since the number of data used inthis study is very limited especially during summer (twoflights), further studies are needed to understand whether thisseasonality is general in the Arctic, including MT and UT.
[20] Figure 5c shows the correlation between medianvalues of TEN_LSP and TEN_BC for individual source regionsand types in both spring (closed circles) and summer (opensquares). The median TE values were highly correlated withR2 = 0.88 (Figure 5c). Due to the differences in transport andremoval processes, the median TEN_LSP and TEN_BC valueswere much greater for Russian BB air (97 and 85%,respectively) than for Asian AN air (18 and 18%, respectively)in spring. In addition, TE values during spring were system-atically higher than those in summer (Figure 5c and Table 3).These variations in TE are similar to those in TEM_BC
(M2011). The median TEV_LSP and TEM_BC were also highlycorrelated (R2 = 0.90) (Figure 5d). The TEV_LSP/TEM_BC
ratio for summer was higher than during spring (Figures 5cand 5d and Table 3). This is consistent with the NLSP/NBC
ratio because we used the same dry ratio (the NLSP/DCO,VLSP/DCO, NBC/DCO, and MBC/DCO ratios with APT <5 mm) for summer and spring to derive the TE values forsummer (section 2.2 and M2011). The dry ratios in summermight be higher than during spring in the real atmospheredue to faster growth and formation rates of LSP by a higheroxidation rate during transport.[21] NLSP, VLSP, NBC, and MBC and their TE values were
tightly correlated (Figure 5), indicating that LSP and BC hadsimilar or collocated (at the horizontal scale of this study)emission sources and experienced similar levels of removalprocesses for both number and volume concentrations(>180 nm) during transport from their sources to the Arctic.We interpret similar TE values between LSP and BC as dueto sufficient processing of BC during transport, resulting inhygroscopicity as high as that of LSP particles. This inter-pretation is supported by the long transport time from sourcesto the Arctic (section 3) and observed thick coatings of BCparticles. Specifically, the median value of the shell (LSP +BC) to core (BC) diameter ratio in spring was 1.51 and 1.35
Figure 4. Ratio of number concentrations of light‐scattering particles (NLSP) and DCO as a functionof accumulated precipitation along trajectories (APT) for both (a) spring and (b) summer. The medians(circles) and 25th–75th percentiles (vertical and horizontal bars) are shown. The squares in Figure 4a(left) show the median dry ratio of NLSP/DCO for the anthropogenic (AN, closed red) and biomassburning (BB, closed green) sources, which were estimated from AN and BB air parcels with APT <5 mm and for the AN source in East Asia estimated from the A‐FORCE aircraft campaign (open red),respectively. “All data” includes both the source‐identified and source‐unidentified data.
MATSUI ET AL.: LONG‐RANGE TRANSPORT OF CN TO THE ARCTIC D20217D20217
6 of 14

Figure 5. Correlation between number concentrations of light‐scattering particles (NLSP) and blackcarbon (NBC) in (a) spring and (b) summer for all data used in this study (gray) and individual sources(colors). Correlation between (c) transport efficiencies of NLSP (TEN_LSP) and NBC (TEN_BC) and (d) thoseof VLSP (TEV_LSP) and MBC (TEM_BC) in spring (closed circles) and summer (open squares). Medians and25th–75th percentiles are shown for individual sources.
Table 3. Transport Efficiency (TE) and Fractional Contribution (F) of Individual Air Parcels During the ARCTAS Campaign
Source
TEN_LSPa
(%)TEV_LSP
a
(%)TEN_BC
a
(%)TEM_BC
a
(%)FN_LSP
b
(%)FV_LSP
b
(%)FN_BC
b
(%)FM_BC
b
(%)
SpringAsia AN 17.5 23.3 18.0 12.6 2.7 3.4 2.0 2.2Russia BB 96.5 92.1 85.1 82.6 27.3 26.7 28.1 28.0Russia + Asia BB 86.4 88.3 67.6 66.2 19.0 19.7 18.3 18.0Russia + Europe BB 88.1 87.7 80.0 74.3 13.4 13.7 13.5 13.2Othersc — — — — — 37.6 36.5 38.1 38.6
SummerAsia AN 3.0 1.6 1.4 0.82 8.4 6.8 8.9 9.0Russia + Asia AN 1.8 1.0 0.57 0.44 17.0 15.1 13.4 11.2Russia + Asia BB, ANBB 5.0 4.8 1.9 2.1 16.8 17.3 18.4 22.6Russia BB, ANBB 7.6 6.2 3.1 3.1 33.3 33.7 33.9 32.8Othersc — — — — — 24.5 27.1 25.4 24.4
aTE denotes transport efficiency defined by equation (1).bF denotes the fractional contributions of individual sources to the total concentrations in the North American Arctic (sum of the concentration for all
source‐identified data) defined by equation (2).cOthers denotes source‐identified data from other sources (Europe, Russia (AN), Russia + Europe, Russia + Asia, Asia (BB), and North America), which
were defined and used by M2011.
MATSUI ET AL.: LONG‐RANGE TRANSPORT OF CN TO THE ARCTIC D20217D20217
7 of 14

for Russian BB and Asian AN air, respectively, for a corediameter of 200 nm, although it should be noted that mea-sured particles were not scavenged during transport butsurvived wet removal processes.[22] We calculated the contributions of individual sources
to the total NLSP, VLSP, NBC, and MBC in the North AmericanArctic (sum of the measured concentration for all source‐identified data) using the following equations (2).
FN LSP;i ¼P
t
NLSP;i;t
P
j
P
t
NLSP; j;t; FV LSP;i ¼
P
t
VLSP;i;t
P
j
P
t
VLSP; j;t
FN BC;i ¼P
t
NBC;i;t
P
j
P
t
NBC; j;t; FM BC;i ¼
P
t
MBC;i;t
P
j
P
t
MBC; j;t
ð2Þ
FN_LSP,i, FV_LSP,i, FN_BC,i, and FM_BC,i are the fractionalcontribution of source i to the total amount of NLSP, VLSP,NBC, and MBC, respectively. NLSP,i,t, VLSP,i,t, NBC,i,t, andMBC,i,t are NLSP, VLSP, NBC, and MBC at time t fromsource i, respectively, while j means summation of thevalues for all sources. The fractional contribution of NLSP,VLSP, NBC, and MBC for BB air that passed over Russia(sum of BB and ANBB sources from Russian, Russia + Asia,and Russia + Europe) was as high as 60% in spring and 66%in summer (Table 3), indicating that Russian BB was thedominant source of aerosol (for both LSP and BC and forboth number and volume concentrations) within the source‐identified data. In contrast, the fractional contribution fromAsian AN air was as low as 2–3% in spring and 7–9% insummer within the source‐identified data (Table 3), indi-cating the very limited impact from Asian AN sources onArctic aerosol.[23] The contribution from BB and AN sources (including
data of unidentified source regions) to all the data (both
source‐identified and source‐unidentified data) in spring wasestimated to be 42–48% and 25–27%, respectively, for NLSP,VLSP, NBC, and MBC (the remainder is data of unidentifiedsource types) (Figure 6). This result suggests that BB emis-sions were the primary source of aerosol (for both LSP andBC and for both number and volume concentrations) in theNorth American Arctic in spring 2008. Although the sourceregions were not identified for more than 50% of the datain BB by trajectory calculations, most BB‐influenced airprobably originated from Russia and Kazakhstan consideringthat few data were from other BB sources within the source‐identified data during spring (Table 2 of M2011).[24] In summary, Russian BB in spring was the most
important source of accumulation‐mode aerosols over theArctic for both LSP and BC and for both number and volumeconcentrations during the ARCTAS campaign within thesource‐identified data. BB emissions were found to be theprimary source of aerosol within all the data in spring duringARCTAS. In contrast, Asian AN air provided a negligiblecontribution to the accumulation‐mode aerosols (both LSPand BC) over the North American Arctic in both spring andsummer 2008.
4.2. Vertical Profile of NLSP
[25] Figure 7 shows the vertical profiles of NLSP measuredduring spring and summer. NLSP had a broad maximum inthe MT in spring. This profile is similar to that of MBC
shown in M2011. We can interpret this vertical profile bythe differences in TEN_LSP (Figure 5c and Table 3) and thedifferences in altitude profiles (Figure 3) between the AsianAN and Russian BB air parcels. The broad peak in the MTwas due to the dominant contribution of Russian BB. Thedecrease in the UT was due to efficient wet removal of LSPin Asian AN air. The shapes of the vertical profiles of VLSP
and NBC were similar to that of NLSP (not shown).
4.3. Comparison of NLSP With BackgroundAerosol Concentrations
[26] The values of NLSP in Asian AN and Russian BB airwere compared with those of background air. We definedbackground air as source regions that were not identified(not from Europe, Russia, Asia, or North America) based ontrajectory calculations and had concentrations of DCO,DCH3CN, andDCH2Cl2 that were less than 5 ppbv, 50 pptv,and 5 pptv, respectively. Compared with background air, themedian NLSP for Russian BB air were factors of 4.7 and 2.3greater during spring and summer, respectively, while thoseof Asian AN air were factors of 2.4 and 2.6 smaller in springand summer, respectively (Figure 8 and Table 2). Thesefeatures were also seen for VLSP, NBC, and MBC (Table 2).This result indicates that inflow of midlatitude Asian AN airdecreased aerosol concentrations in the Arctic (cleansingeffect). The high concentrations of DCO (levels similar toRussian BB air) for AN air suggest high concentrations ofaerosols and their precursors in the source region.[27] WCBs are a common synoptic‐scale transport mech-
anism over various regions at midlatitudes and seasons[Stohl, 2001; Eckhardt et al., 2003]. Aerosol concentrationsin air transported via this mechanism from midlatitudes willgenerally be lower than that in background Arctic air. Thisprocess can be one of the most important processes in con-trolling aerosol concentrations in the MT and UT in the
Figure 6. Contribution from biomass burning (BB) andanthropogenic (AN) sources to the total NLSP concentrationswithin all the data during the ARCTAS‐A (spring) campaign.
MATSUI ET AL.: LONG‐RANGE TRANSPORT OF CN TO THE ARCTIC D20217D20217
8 of 14

Arctic in spring and summer. Further studies, especiallyusing chemical transport models, are needed to assess theeffect more quantitatively, including the frequency of inflowof clean midlatitude air to the Arctic.
4.4. Chemical Composition of LSP
[28] Asian AN and Russian BB air also had marked dif-ferences in aerosol chemical composition. The average massratio of sulfate aerosol to the total PM1 mass concentrations(RSO4) was largest (67% in spring and 59% in summer) inAsian AN air, while that of organic aerosol (RORG) waslargest (61% in spring and 68% in summer) in Russian BBair during both spring and summer (Table 2 and Figure 9).This reflects characteristics of the emissions of trace gasesand aerosols in the Asian continent. In fact, based on emissioninventories for the Asian continent, the mass emission ratiobetween SO2 and primary organic carbon is about 1–2 ordersof magnitude greater for anthropogenic sources in Asia
(7.2, SO2 dominant) [Zhang et al., 2009] than for biomassburning sources in East Asia (0.11, organic carbon dominant)[Streets et al., 2003], although the relative contribution ofsecondary organic aerosol formation during transport mightbe larger for AN air than BB air [Cubison et al., 2011]. Thesulfate mass fraction was as large as about 30% in RussianBB air (Table 2 and Figure 9). Sulfate in Russian BB aircould be from SO2 emission from fires in the flaming phaseand their oxidation to sulfate [Kondo et al., 2011] and mixingwith background air, which includes high fractions of sulfate(Table 2 and Figure 9c).[29] The background air parcels in spring had chemical
compositions similar to Asian AN air (high sulfate/organicsratio), suggesting that they could have been influenced mainlyby AN sources (Figure 9c). On the other hand, the backgroundair in summer had a greater fraction of organics (Figure 9f),suggesting that they had been influenced by both AN andBB sources. This result implies that Arctic background
Figure 8. Scatterplots of NLSP and DCO in (a) spring and (b) summer. Gray dots and circles denote1‐min data used in this study. Squares and bars show the medians and 25th–75th percentiles of AsianAN (red), Russian BB (green), and background (blue) air parcels.
Figure 7. Median vertical profiles in (a) spring and (b) summer for all data used in this study (gray) andindividual sources (colors). Horizontal bars denote 25th–75th percentiles.
MATSUI ET AL.: LONG‐RANGE TRANSPORT OF CN TO THE ARCTIC D20217D20217
9 of 14

aerosols during winter and early spring are mainly from ANsources, while BB emissions taking place from spring tosummer may alter aerosol concentrations and chemical com-positions in the Arctic by summer.[30] Chemical compositions (average mass ratio) in spring
shown in Figure 9 are generally consistent with the mea-surements during the Aerosol, Radiation, and Cloud Pro-cesses affecting Arctic Climate (ARCPAC) aircraft campaignin spring 2008 [Brock et al., 2011]. Both studies showedthat organics were dominant (about 60% of fine particles)for BB air parcels and comprised 20–30% of fine particlesfor AN air parcels. The contribution of sulfate in backgroundair was slightly higher during ARCTAS (about 60%) thanARCPAC (about 50%). The contribution of BC was about3–5% of fine particles for all air parcels.
4.5. Size Distribution of LSP
[31] Asian AN and Russian BB also exhibit markeddifferences in the normalized size distribution of VLSP
(Figure 10), which is defined for all one‐minute data as thesize distribution of VLSP normalized by the total VLSP:Russian BB air had nearly a single lognormal distributionwith a peak diameter of 250 nm, while Asian AN air had atwo‐mode lognormal distribution with peak diameters of250 and 530 nm (although the absolute concentrations werean order of magnitude less than Russian BB air, as shown
in Table 2). The widths of size distributions were narrowfor both NLSP (1.20–1.23) and VLSP (1.24–1.30) for bothRussian BB and Asian AN air. These standard deviations aregenerally consistent with those calculated from the peakdiameters of number and volume size distributions whenlognormal distributions are assumed. Compared with Brocket al. [2011], our measurements during spring had greaterpeak diameters of number size distributions and smallerpeak diameters of volume size distributions and standarddeviations for all air parcels.[32] The larger mode of Asian AN air is possibly due to
aqueous‐phase aerosol growth within cloud droplets duringtransport. The dispersions of the size distribution (vertical barsin Figure 10a) for Asian AN air were larger than for RussianBB air (Figure 10b) for LSP. These results are consistent witha stronger impact of wet removal processes for Asian AN air.In addition to the aqueous‐phase growth, mixing with back-ground air, which contained moderate concentrations of largerparticles (Figure 10c), could be a source of the larger modeof Asian AN air. Dust particles might be another potentialsource of larger particles [Leaitch et al., 2009; McKendryet al., 2011], but the median volume concentrations ofcoarse particles derived by APS (0.12 mm3 cm−3) were con-siderably smaller compared with those of the accumulationmode derived by SP2 (0.49 mm3 cm−3) for Asian AN airparcels during spring. The contribution from mixing of BB
Figure 9. Average chemical composition (mass ratio) in (a, b, c) spring and (d, e, f) summer for AsianAN (Figures 9a and 9d), Russian BB (Figures 9b and 9e), and background air parcels (Figures 9c and 9f).
MATSUI ET AL.: LONG‐RANGE TRANSPORT OF CN TO THE ARCTIC D20217D20217
10 of 14

air to Asian AN air should be limited for both smallerand larger modes because of the strict criteria for choosingAsian AN air (low concentrations of DCH3Cl).[33] Finally, we note that total aerosol number concentra-
tions (NCPC) and NLSP exhibited very different variationsduring ARCTAS. The median NLSP/NCPC ratio for AsianAN (Russian BB) air was 0.08 (0.53) in spring and 0.05 (0.09)in summer during ARCTAS. The Aitken and nucleation‐mode particles were dominant when the accumulation‐modeparticles were low, suggesting that new particle formationmight have occurred in these air parcels during transportafter the wet scavenging of accumulation‐mode particles.This tendency is consistent with previous measurements ofair transport from Asian sources [Brock et al., 2004; Dunleaet al., 2009; Weber et al., 2003].
5. Potential of Aerosol‐Cloud Interaction
[34] We briefly discuss the potential impacts of the trans-port of polluted (Russian BB) and clean (Asian AN) air onaerosol‐cloud interactions in the Arctic, based on the findingsof recent studies. The median NLSP of Russian BB air was280 cm−3 in spring. Lubin and Vogelmann [2006] estimateda longwave aerosol indirect effect (AIE) of 3.4 W m−2 forArctic stratus clouds, which contain aerosol number con-centrations greater than 175 cm−3. Assuming a case in whichRussian BB air forms stratus clouds in the Arctic, they couldhave an equivalent or greater potential of cloud‐radiationfeedback (longwave indirect warming effect) than that pre-sented by Lubin and Vogelmann [2006].[35] On the other hand, when shortwave AIE is included,
the total (longwave + shortwave) first AIE can be positiveduring early spring (March–April) but negative in late springand summer (April–July) [Lubin and Vogelmann, 2010;Alterskjær et al., 2010] because shortwave solar radiationincreases with the progression of the seasons. Longwave andshortwave AIEs will generally compensate for each other inspring. The onset of BB in Russia in 2008 corresponds to thetransition period from positive to negative total first AIE. Anearlier onset of Russian BB in the future [Stocks et al., 1998]
may contribute to an additional Arctic warming by the totalfirst AIE.[36] Some studies suggest that the entrainment of CCN
and ice nuclei into Arctic stratus clouds in the LT cancontribute to increases in cloud droplet number, liquid waterpath, and cloud optical depth [Jiang et al., 2001], andpossibly affect the acceleration of snow‐ice melting [Carrióet al., 2005a, 2005b]. Russian BB aerosols in the MT havethe potential to be entrained into the BL and could contributeto Arctic warming by this effect and resulting dynamicalchanges. Since Russian BB air may have both warming(longwave AIE and entrainment of ML air to the BL) andcooling (shortwave AIE) effects, as shown above, moredetailed studies are needed to understand the relativeimportance of the individual effects quantitatively.[37] Since Asian AN air had lower NLSP than background
air, these air parcels may cause opposite aerosol indirecteffects through the reduction of cloud emissivity and life-time (compared with background air). In addition, since themedian NLSP of Asian AN air was only 6.2 cm−3 in summer,cloud formation and precipitation processes (if we assume acase with supersaturated conditions) could be limited by theavailable CCN concentration, as proposed byMauritsen et al.[2011]. This cloud regime may cause higher supersaturation,increase precipitation efficiency, cause a positive feedback onthe aerosol by increased wet deposition, and produce loweraerosol concentrations in the Arctic [Mauritsen et al., 2011].Therefore, Asian AN may have additional cleansing effectsby this aerosol‐cloud‐precipitation interaction in the Arctic ifthis effect could be applied to the UT.
6. Summary
[38] We have evaluated the impacts of transport of mid-latitude air on aerosol number concentrations in the accumu-lation mode (light scattering particles (LSP) with diameters>180 nm, NLSP) in the Arctic during the ARCTAS aircraftcampaign conducted in April and June–July 2008.We focusedon air parcels transported from anthropogenic sources in EastAsia (Asian AN) and biomass burning sources in Russia and
Figure 10. Medians and 25th–75th percentiles of normalized size distribution of NLSP (red) and VLSP
(black) for (a) Asian AN, (b) Russian BB, and (c) background air parcels in spring. Normalized numberand volume size distributions are the size distribution normalized by the total number and volume con-centrations of LSP, respectively, and are calculated for individual one‐min data.
MATSUI ET AL.: LONG‐RANGE TRANSPORT OF CN TO THE ARCTIC D20217D20217
11 of 14

Kazakhstan (Russian BB). Most Asian AN air parcels weretransported from lower latitudes (30°–40°N) and had fairlyhigh relative humidity. They experienced rapid ascent bywarm conveyor belts (WCBs) with heavy precipitation, whileRussian BB air parcels were transported almost isentropicallyfrom higher latitudes (50°–70°N) and encountered lessprecipitation.[39] Due to these differences in transport processes, we
found marked differences in the number concentration (NLSP),transport efficiency (TEN_LSP), size distribution, and chem-ical composition of aerosols between Asian AN and RussianBB air. Asian AN air had lower NLSP and TEN_LSP (25 cm
−3
and 18% in spring and 6.2 cm−3 and 3.0% in summer) thanRussian BB air (280 cm−3 and 97% in spring and 36 cm−3
and 7.6% in summer) due to more intense wet scavengingduring transport from Asia. NLSP and TEN_LSP in summerwere much lower than those in spring for both sources.Russian BB air had nearly a single lognormal distribution ofaerosol volume concentrations (VLSP) with a peak diameterof 250 nm, while Asian AN air had a two‐mode lognormaldistribution with peak diameters of 250 and 530 nm. Thesize distribution was narrow (standard deviation of 1.2–1.3)for both Russian BB and Asian AN air. The second peak ofVLSP in Asian AN air is likely droplet‐mode aerosols, whichare consistent with WCB transport with efficient cloud andprecipitation processes. Sulfate and organic aerosols weredominant in Asian AN and Russian BB air, respectively,reflecting emission sources. The chemical compositions ofbackground air parcels suggest that they were mainlyinfluenced by AN sources in spring and both AN and BBsources in summer. This result implies that BB emissionsfrom spring to summer alter aerosol concentrations andchemical compositions in the Arctic.[40] NLSP, VLSP, and number and mass concentrations of
BC and their TE values were tightly correlated, indicatingthat LSP and BC were sufficiently processed and hadexperienced similar levels of removal processes duringtransport from their sources to the Arctic. Within the source‐identified data, Russian BB in spring was the largest andmost important source of accumulation‐mode aerosols forboth LSP and BC and for both number and volume con-centrations during the ARCTAS campaign (60–70% of totalaccumulation‐mode aerosols). On the other hand, the trans-port of Asian AN air contributed little to both LSP and BC inthe Arctic in spring and summer (less than 10% of totalaccumulation‐mode aerosols). The contribution from BB andAN sources to all the data (both source‐identified and source‐unidentified data) in spring was estimated to be 42–48% and25–27%, respectively, for NLSP, VLSP, NBC, and MBC, sug-gesting that BB emissions were the primary source of aerosol(for both LSP and BC and for both number and volumeconcentrations) in the North American Arctic in spring 2008.[41] The median NLSP of Russian BB air were factors of
4.7 and 2.3 higher than those of background air in springand summer, respectively, while those of Asian AN air werefactors of 2.4 and 2.6 lower than those of background air inspring and summer, respectively. The latter was due to wetremoval during WCB transport and indicates that Asian ANair can reduce aerosol concentrations in the Arctic (cleansingeffect). Since WCBs are a common synoptic‐scale transportmechanism over the midlatitudes, it is expected that thetransport of midlatitude air can be a source of clean air (in
terms of aerosols) in the Arctic in spring and summer.Further studies are needed to quantify this effect on theclimate of the Arctic.
[42] Acknowledgments. The ARCTAS campaign was supported byNASA. We are indebted to all the ARCTAS participants for their cooper-ation and support. Special thanks are due to the flight and ground crews ofthe NASA DC‐8 aircraft. We thank M. Osuka for his assistance with thefield measurements. This work was supported in part by the Ministry ofEducation, Culture, Sports, Science, and Technology (MEXT), the strategicinternational cooperative program of the Japan Science and TechnologyAgency (JST), and the global environment research fund of the JapaneseMinistry of the Environment (A1101). Y.Z. was supported in part byNASA’s Tropospheric Chemistry Program (USP‐SMD‐08‐009). CH3CNmeasurements were supported by the Austrian Research Promotion Agency(FFG‐ALR) and the Tiroler Zukunftstiftung and were carried out withthe help/support of T. Mikoviny, M. Graus, A. Hansel, and T. D. Maerk.M.J.C. and J.L.J. were supported by NASA NNX08AD39G.
ReferencesAdler, R. F., et al. (2003), The Version 2 Global Precipitation Clima-tology Project (GPCP) monthly precipitation analysis (1979‐Present),J. Hydrometeorol., 4, 1147–1167, doi:10.1175/1525-7541(2003)004<1147:TVGPCP>2.0.CO;2.
Alterskjær, K., J. E. Kristjánsson, and C. Hoose (2010), Do anthropogenicaerosols enhance or suppress the surface cloud forcing in the Arctic?,J. Geophys. Res., 115, D22204, doi:10.1029/2010JD014015.
Anderson, B. E., W. R. Cofer, D. R. Bagwell, J. W. Barrick, C. H. Hudgins,and K. E. Brunke (1998), Airborne observations of aircraft aerosolemissions: 1. Total and nonvolatile emission indices, Geophys. Res. Lett.,25(10), 1689–1692, doi:10.1029/98GL00063.
Barrie, L. A. (1986), Arctic air pollution: An overview of current knowledge,Atmos. Environ., 20, 643–663, doi:10.1016/0004-6981(86)90180-0.
Blake, N. J., et al. (2003), NMHCs and halocarbons in Asian continentaloutflow during the Transport and Chemical Evolution over the Pacific(TRACE‐P) field campaign: Comparison with PEM‐West B, J. Geophys.Res., 108(D20), 8806, doi:10.1029/2002JD003367.
Brock, C. A., L. F. Radke, and P. V. Hobbs (1990), Sulfur in particles in Arctichazes derived from airborne in situ and lidar measurements, J. Geophys.Res., 95(D13), 22,369–22,387, doi:10.1029/JD095iD13p22369.
Brock, C. A., et al. (2004), Particle characteristics following cloud‐modifiedtransport from Asia to North America, J. Geophys. Res., 109, D23S26,doi:10.1029/2003JD004198.
Brock, C. A., et al. (2011), Characteristics, sources, and transport of aerosolsmeasured in spring 2008 during the aerosol, radiation, and cloud processesaffecting Arctic Climate (ARCPAC) Project, Atmos. Chem. Phys., 11,2423–2453, doi:10.5194/acp-11-2423-2011.
Carrió, G. G., H. Jiang, and W. R. Cotton (2005a), Impact of aerosol intru-sions on Arctic boundary layer clouds, part I: 4 May 1998 case, J. Atmos.Sci., 62, 3082–3093, doi:10.1175/JAS3454.1.
Carrió, G. G., H. Jiang, andW. R. Cotton (2005b), Impact of aerosol intrusionson Arctic boundary layer clouds, part II: Sea ice melting rates, J. Atmos.Sci., 62, 3094–3105, doi:10.1175/JAS3558.1.
Chen, M., R. Talbot, H. Mao, B. Sive, J. Chen, and R. J. Griffin (2007), Airmass classification in coastal New England and its relationship to mete-orological conditions, J. Geophys. Res., 112, D10S05, doi:10.1029/2006JD007687.
Cubison, M. J., et al. (2011), Effects of aging on organic aerosol from openbiomass burning smoke in aircraft and lab studies, Atmos. Chem. Phys.Discuss., 11, 12,103–12,140, doi:10.5194/acpd-11-12103-2011.
DeCarlo, P. F., et al. (2006), Field‐deployable, high‐resolution, time‐of‐flight aerosol mass spectrometer, Anal. Chem., 78, 8281–8289,doi:10.1021/ac061249n.
Dunlea, E. J., et al. (2009), Evolution of Asian aerosols during transpacifictransport in INTEX‐B, Atmos. Chem. Phys., 9, 7257–7287, doi:10.5194/acp-9-7257-2009.
Eckhardt, S., A. Stohl, S. Beirle, N. Spichtinger, P. James, C. Forster,C. Junker, T. Wagner, U. Platt, and S. G. Jennings (2003), The NorthAtlantic Oscillation controls air pollution transport to the Arctic, Atmos.Chem. Phys., 3(5), 1769–1778, doi:10.5194/acp-3-1769-2003.
Engvall, A.‐C., R. Krejci, J. Ström, A. Minikin, R. Treffeisen, A. Sthol, andA. Herber (2008a), In‐situ airborne observations of the microphysicalproperties of the Arctic tropospheric aerosol during late spring and summer,Tellus, Ser. B, 60, 392–404.
Engvall, A.‐C., R. Krejci, J. Ström, R. Treffeisen, R. Scheele, O. Hermansen,and J. Paatero (2008b), Changes in aerosol properties during spring‐
MATSUI ET AL.: LONG‐RANGE TRANSPORT OF CN TO THE ARCTIC D20217D20217
12 of 14
summer period in the Arctic troposphere, Atmos. Chem. Phys., 8, 445–462,doi:10.5194/acp-8-445-2008.
Flanner, M. G., C. S. Zender, J. T. Randerson, and P. J. Rasch (2007), Present‐day climate forcing and response from black carbon in snow, J. Geophys.Res., 112, D11202, doi:10.1029/2006JD008003.
Flanner, M. G., C. S. Zender, P. G. Hess, N. M. Mahowald, T. H. Painter,V. Ramanathan, and P. J. Rasch (2009), Springtime warming andreduced snow cover from carbonaceous particles, Atmos. Chem. Phys.,9(7), 2481–2497, doi:10.5194/acp-9-2481-2009.
Fuelberg, H. E., D. L. Harrigan, and W. Sessions (2010), A meteorologicaloverview of the ARCTAS 2008 mission, Atmos. Chem. Phys., 10(2),817–842, doi:10.5194/acp-10-817-2010.
Garrett, T. J., and C. Zhao (2006), Increased Arctic cloud longwave emis-sivity associated with pollution from mid‐latitudes, Nature, 440(7085),787–789, doi:10.1038/nature04636.
Hansen, J., and L. Nazarenko (2004), Soot climate forcing via snow and icealbedos, Proc. Natl. Acad. Sci. U. S. A., 101(2), 423–428, doi:10.1073/pnas.2237157100.
Harrigan, D. L., H. E. Fuelberg, I. J. Simpson, D. R. Blake, G. R. Carmichael,and G. S. Diskin (2011), Transport of anthropogenic emissions duringARCTAS‐A: A climatology and regional case studies, Atmos. Chem.Phys. Discuss., 11, 5435–5491, doi:10.5194/acpd-11-5435-2011.
Heintzenberg, J., C. Leck, W. Birmili, B. Wehner, M. Tjernström, andA. Wiedensohler (2006), Aerosol number‐size distributions during clearand fog periods in the summer high Arctic: 1991, 1996, and 2001, Tellus,Ser. B, 58, 41–50, doi:10.1111/j.1600-0889.2005.00171.x.
Huang, L., S. L. Gong, C. Q. Jia, and D. Lavoué (2010), Relative contri-butions of anthropogenic emissions to black carbon aerosol in the Arctic,J. Geophys. Res., 115, D19208, doi:10.1029/2009JD013592.
Huffman, G. J., R. F. Adler, M. M. Morrissey, D. T. Bolvin, S. Curtis,R. Joyce, B. McGavock, and J. Susskind (2001), Global precipitation atone‐degree daily resolution from multisatellite observations, J. Hydro-meteorol. , 2 , 36–50, doi:10.1175/1525-7541(2001)002<0036:GPAODD>2.0.CO;2.
Jacob, D. J., et al. (2010), The Arctic Research of the Composition of theTroposphere from Aircraft and Satellites (ARCTAS) mission: Design,execution, and first results, Atmos. Chem. Phys., 10(11), 5191–5212,doi:10.5194/acp-10-5191-2010.
Jiang, H., G. Feingold, W. R. Cotton, and P. G. Duynkerke (2001), Large‐eddy simulations of entrainment of cloud condensation nuclei into theArctic boundary layer:May 18, 1998, FIRE/SHEBAcase study, J. Geophys.Res., 106(D14), 15,113–15,122, doi:10.1029/2000JD900303.
Klonecki, A., P. Hess, L. Emmons, L. Smith, J. Orlando, and D. Blake(2003), Seasonal changes in the transport of pollutants into the Arctictroposphere‐model study, J. Geophys. Res., 108(D4), 8367, doi:10.1029/2002JD002199.
Koch, D., et al. (2009), Evaluation of black carbon estimations in globalaerosol models, Atmos. Chem. Phys., 9, 9001–9026, doi:10.5194/acp-9-9001-2009.
Kondo, Y., L. Sahu, N. Moteki, F. Khan, N. Takegawa, X. Liu, M. Koike,and T. Miyakawa (2010), Consistency and traceability of black carbonmeasurements made by laser‐induced incandescence, thermal‐opticaltransmittance, and filter‐based photo‐absorption techniques, AerosolSci. Technol., 45, 295–312, doi:10.1080/02786826.2010.533215.
Kondo, Y., et al. (2011), Emissions of black carbon, organic, and inorganicaerosols from biomass burning in North America and Asia in 2008,J. Geophys. Res., 116, D08204, doi:10.1029/2010JD015152.
Law, K. S., and A. Stohl (2007), Arctic air pollution: Origins and impacts,Science, 315(5818), 1537–1540, doi:10.1126/science.1137695.
Leaitch, W. R., R. M. Hoff, and J. I. MacPherson (1989), Airborne andlidar measurements of aerosol and cloud particles in the troposphere overAlert Canada in April 1986, J. Atmos. Chem., 9, 187–211, doi:10.1007/BF00052832.
Leaitch, W. R., L. A. Barrie, J. W. Bottenheim, S. M. Li, P. B. Shepson,K. Muthuramu, and Y. Yokouchi (1994), Airborne observationsrelated to ozone depletion at polar sunrise, J. Geophys. Res., 99(D12),25,499–25,517, doi:10.1029/94JD02750.
Leaitch, W. R., et al. (2009), Evidence for Asian dust effects from aerosolplume measurements during INTEX‐B 2006 near Whistler, BC, Atmos.Chem. Phys., 9, 3523–3546, doi:10.5194/acp-9-3523-2009.
Lubin, D., and A. M. Vogelmann (2006), A climatologically significantaerosol longwave indirect effect in the Arctic, Nature, 439(7075),453–456, doi:10.1038/nature04449.
Lubin, D., and A. M. Vogelmann (2010), Observational quantification of atotal aerosol indirect effect in the Arctic, Tellus, Ser. B, 62, 181–189,doi:10.1111/j.1600-0889.2010.00460.x.
Matsui, H., et al. (2011), Seasonal variation of the transport of black carbonaerosol from the Asian continent to the Arctic during the ARCTAS aircraftcampaign, J. Geophys. Res., 116, D05202, doi:10.1029/2010JD015067.
Mauritsen, T., et al. (2011), An Arctic CCN‐limited cloud‐aerosol regime,Atmos. Chem. Phys., 11, 165–173, doi:10.5194/acp-11-165-2011.
McKendry, I., et al. (2011), Californian forest fire plumes over SouthwesternBritish Columbia: Lidar, sunphotometry, and mountaintop chemistryobservations, Atmos. Chem. Phys., 11, 465–477, doi:10.5194/acp-11-465-2011.
Moteki, N., and Y. Kondo (2007), Effects of mixing state on black carbonmeasurements by laser‐induced incandescence, Aerosol Sci. Technol.,41(4), 398–417, doi:10.1080/02786820701199728.
Moteki, N., and Y. Kondo (2010), Dependence of laser‐induced incan-descence on physical properties of black carbon aerosols: Measure-ments and theoretical interpretation, Aerosol Sci. Technol., 44(8),663–675, doi:10.1080/02786826.2010.484450.
Oshima, N., et al. (2004), Asian chemical outflow to the Pacific in latespring observed during the PEACE‐B aircraft mission, J. Geophys.Res., 109, D23S05, doi:10.1029/2004JD004976.
Petters, M. D., and S. M. Kreidenweis (2007), A single parameter represen-tation of hygroscopic growth and cloud condensation nucleus activity,Atmos. Chem. Phys., 7, 1961–1971, doi:10.5194/acp-7-1961-2007.
Quinn, P. K., T. L. Miller, T. S. Bates, J. A. Ogren, E. Andrews, andG. E. Shaw (2002), A 3‐year record of simultaneously measured aerosolchemical and optical properties at Barrow, Alaska, J. Geophys. Res.,107(D11), 4130, doi:10.1029/2001JD001248.
Radke, L. F., J. H. Lyons, D. A. Hegg, and P. V. Hobbs (1984), Airborneobservations of Arctic aerosols, I: Characteristics of Arctic haze, Geophys.Res. Lett., 11, 393–396, doi:10.1029/GL011i005p00393.
Sachse, G. W., G. F. Hill, L. O. Wade, and M. G. Perry (1987), Fast‐response, high precision carbon monoxide sensor using a tunable diodelaser absorption technique, J. Geophys. Res., 92, 2071–2081,doi:10.1029/JD092iD02p02071.
Schnell, R. C., and W. E. Raatz (1984), Vertical and horizontal character-istics of Arctic haze during AGASP: Alaskan Arctic, Geophys. Res.Lett., 11, 369–372, doi:10.1029/GL011i005p00369.
Sessions, W. R., H. F. Fuelberg, R. A. Kahn, and D. M. Winker (2010), Aninvestigation of methods for injecting emissions from boreal wildfiresusing WRF‐Chem during ARCTAS, Atmos. Chem. Phys. Discuss., 10,26,551–26,606, doi:10.5194/acpd-10-26551-2010.
Shaw, G. E. (1995), The Arctic haze phenomenon, Bull. Am. Meteorol.Soc., 76(12), 2403–2413, doi:10.1175/1520-0477(1995)076<2403:TAHP>2.0.CO;2.
Shindell, D., and G. Faluvegi (2009), Climate response to regional radiativeforcing during the twentieth century, Nat. Geosci., 2(4), 294–300,doi:10.1038/ngeo473.
Shindell, D. T., et al. (2008), A multi‐model assessment of pollution trans-port to the Arctic, Atmos. Chem. Phys., 8(17), 5353–5372, doi:10.5194/acp-8-5353-2008.
Staebler, R. M., G. den Hartog, B. Georgi, and T. Düsterdiek (1994), Aero-sol size distributions in Arctic haze during the Polar Sunrise Experiment1992, J. Geophys. Res., 99, 25,429–25,437, doi:10.1029/94JD00520.
Staebler, R. M., D. Toom‐Sauntry, L. Barrie, U. Langendörfer, E. Lehrer,S.‐M. Li, and H. Dryfhout‐Clark (1999), Physical and chemical charac-teristics of aerosols at Spitsbergen in the spring of 1996, J. Geophys.Res., 104(D5), 5515–5529, doi:10.1029/1998JD100056.
Stocks, B. J., et al. (1998), Climate change and forest fire potential inRussian and Canadian boreal forests, Clim. Change, 38(1), 1–13,doi:10.1023/A:1005306001055.
Stohl, A. (2001), A 1‐year Lagrangian “climatology” of airstreams in theNorthern Hemisphere troposphere and lowermost stratosphere, J. Geophys.Res., 106(D7), 7263–7279, doi:10.1029/2000JD900570.
Stohl, A. (2006), Characteristics of atmospheric transport into the Arctic tropo-sphere, J. Geophys. Res., 111, D11306, doi:10.1029/2005JD006888.
Streets, D. G., et al. (2003), An inventory of gaseous and primary aerosolemissions in Asia in the year 2000, J. Geophys. Res., 108(D21), 8809,doi:10.1029/2002JD003093.
Ström, J., J. Umegård, K. Tørseth, P. Tunved, H.‐C. Hansson, K. Holmén,V. Wismann, A. Herver, and G. König‐Langlo (2003), One year of par-ticle size distribution and aerosol chemical composition measurements atthe Zeppelin station, Svalbard, March 2000–2001, Phys. Chem. Earth,28, 1181–1190.
Warneke, C., et al. (2006), Biomass burning and anthropogenic sources ofCO over New England in the summer 2004, J. Geophys. Res., 111,D23S15, doi:10.1029/2005JD006878.
Warneke, C., et al. (2009), Biomass burning in Siberia and Kazakhstanas an important source for haze over the Alaskan Arctic in April 2008,Geophys. Res. Lett., 36, L02813, doi:10.1029/2008GL036194.
Warneke, C., et al. (2010), An important contribution to springtime Arcticaerosol from biomass burning in Russia, Geophys. Res. Lett., 37,L01801, doi:10.1029/2009GL041816.
MATSUI ET AL.: LONG‐RANGE TRANSPORT OF CN TO THE ARCTIC D20217D20217
13 of 14
Weber, R. J., et al. (2003), New particle formation in anthropogenic plumesadvecting from Asia observed during TRACE‐P, J. Geophys. Res.,108(D21), 8814, doi:10.1029/2002JD003112.
Wisthaler, A., A. Hansel, R. R. Dickerson, and P. J. Crutzen (2002),Organic trace gas measurements by PTR‐MS during INDOEX 1999,J. Geophys. Res., 107(D19), 8024, doi:10.1029/2001JD000576.
Yamanouchi, T., et al. (2005), Arctic Study of Tropospheric Aerosol andRadiation (ASTAR) 2000: Arctic haze case study, Tellus, Ser. B, 57(2),141–152, doi:10.1111/j.1600-0889.2005.00140.x.
Yum, S. S., and J. G. Hudson (2001), Vertical distributions of cloud con-densation nuclei spectra over the springtime Arctic Ocean, J. Geophys.Res., 106(D14), 15,045–15,052, doi:10.1029/2000JD900357.
Zhang, Q., et al. (2009), Asian emissions in 2006 for the NASA INTEX‐Bmission, Atmos. Chem. Phys., 9, 5131–5153, doi:10.5194/acp-9-5131-2009.
B. E. Anderson and G. Diskin, Chemistry and Dynamics Branch, NASALangley Research Center, MS 483, Hampton, VA 23681‐2199, USA.
D. R. Blake, Department of Chemistry, University of California, Irvine,570 Rowland Hall, Irvine, CA 92697‐2025, USA.M. J. Cubison and J. L. Jimenez, CIRES, University of Colorado at
Boulder, UCB 216, Boulder, CO 80309, USA.H. E. Fuelberg and W. R. Sessions, Department of Meteorology, Florida
State University, 404 Love Bldg., MC 4520, Tallahassee, FL 32306‐4520,USA.M. Koike, Y. Kondo, H. Matsui, and N. Moteki, Department of Earth and
Planetary Science, Graduate School of Science, University of Tokyo, Hongo7‐3‐1 Bunkyo‐ku, Tokyo 113‐0033, Japan. ([email protected]‐tokyo.ac.jp)L. K. Sahu, Department of Space, Physical Research Laboratory,
Ahmedabad 380009, India.N. Takegawa, Research Center for Advanced Science and Technology,
University of Tokyo, 4‐6‐1 Komaba Meguro‐ku, Tokyo 153‐8904, Japan.A. Wisthaler, Institute of Ion Physics and Applied Physics, University of
Innsbruck, Technikerstrasse 25, A‐6020 Innsbruck, Austria.Y. Zhao, Air Quality Research Center, University of California, Davis,
2132 Bainer Hall, One Shields Ave., Davis, CA 95616, USA.
MATSUI ET AL.: LONG‐RANGE TRANSPORT OF CN TO THE ARCTIC D20217D20217
14 of 14