Accounting for Spatial Variation of Land Prices in Hedonic … · Accounting for Spatial Variation...
26
Accounting for Spatial Variation of Land Prices in Hedonic Imputation House Price Indexes Jan de Haan* and Yunlong Gong** * Statistics Netherlands / Delft University of Technology ** Delft University of Technology EMG Workshop 2014
Transcript of Accounting for Spatial Variation of Land Prices in Hedonic … · Accounting for Spatial Variation...

Accounting for Spatial Variation of Land Prices in
Hedonic Imputation House Price Indexes
Jan de Haan* and Yunlong Gong**
* Statistics Netherlands / Delft University of Technology
** Delft University of Technology
EMG Workshop 2014
2
Outline
• Background
• A simplification of the ‘builder’s model’
– Basic ideas
– Adding characteristics and linearizing
• Location and spatial nonstationarity of land prices
– Two models
– The MWGR method
• Hedonic imputation price indexes
• Empirical results
• Conclusions
– Fancy econometric methods are unnecessary ….
3
Background
Uniqueness of properties mainly due to location
Location usually included in hedonic models at some
aggregate level (postcode dummies), not at individual
property level – location bias?
Land typically not included – bias?
Aim of this paper
Show how to account for spatial variation of land prices in
hedonic house price indexes using geospatial information
(longitude/latitude)
Not covered in RPPI Handbook

4
A simplification of the ‘builder’s model’
Builder’s model (Diewert, de Haan and Hendriks, 2015):
value of property is sum of value of land and value of
structure:
: plot size in square meters
: living space in square meters
: price of land per square meter
: price of structure (living space) per square meter
t
i
t
iS
tt
iL
tt
i uzzp
t
ip
t
iLzt
iSz
tt
5
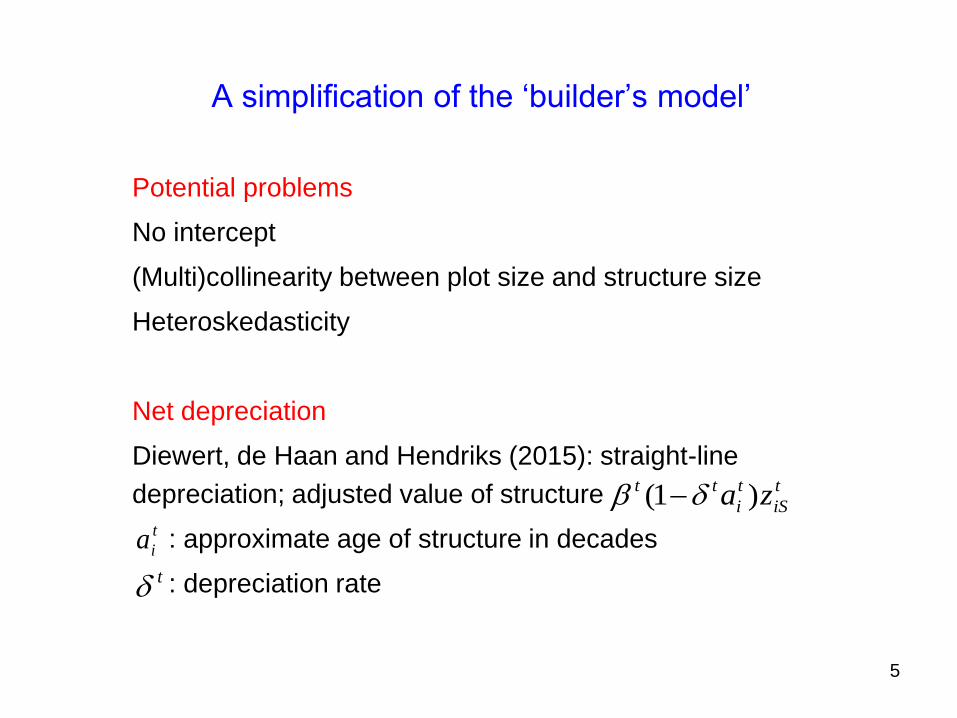
A simplification of the ‘builder’s model’
Potential problems
No intercept
(Multi)collinearity between plot size and structure size
Heteroskedasticity
Net depreciation
Diewert, de Haan and Hendriks (2015): straight-line
depreciation; adjusted value of structure
: approximate age of structure in decades
: depreciation rate
t
iS
t
i
tt za )1( t
ia
t
6
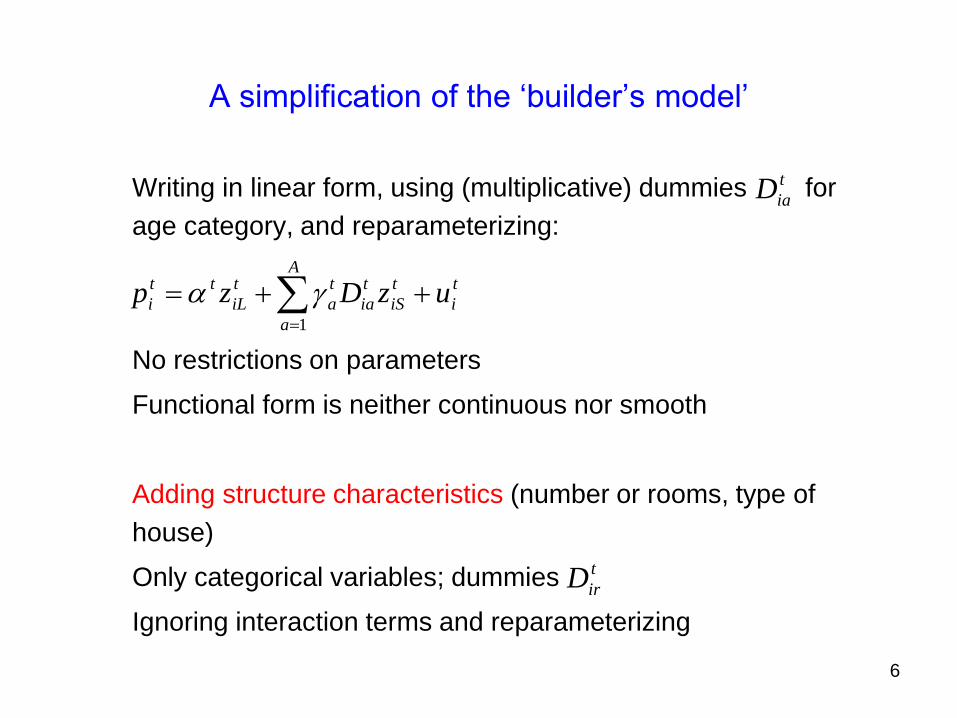
A simplification of the ‘builder’s model’
Writing in linear form, using (multiplicative) dummies for
age category, and reparameterizing:
No restrictions on parameters
Functional form is neither continuous nor smooth
Adding structure characteristics (number or rooms, type of
house)
Only categorical variables; dummies
Ignoring interaction terms and reparameterizing
t
i
A
a
t
iS
t
ia
t
a
t
iL
tt
i uzDzp 1
t
iaD
t
irD
7
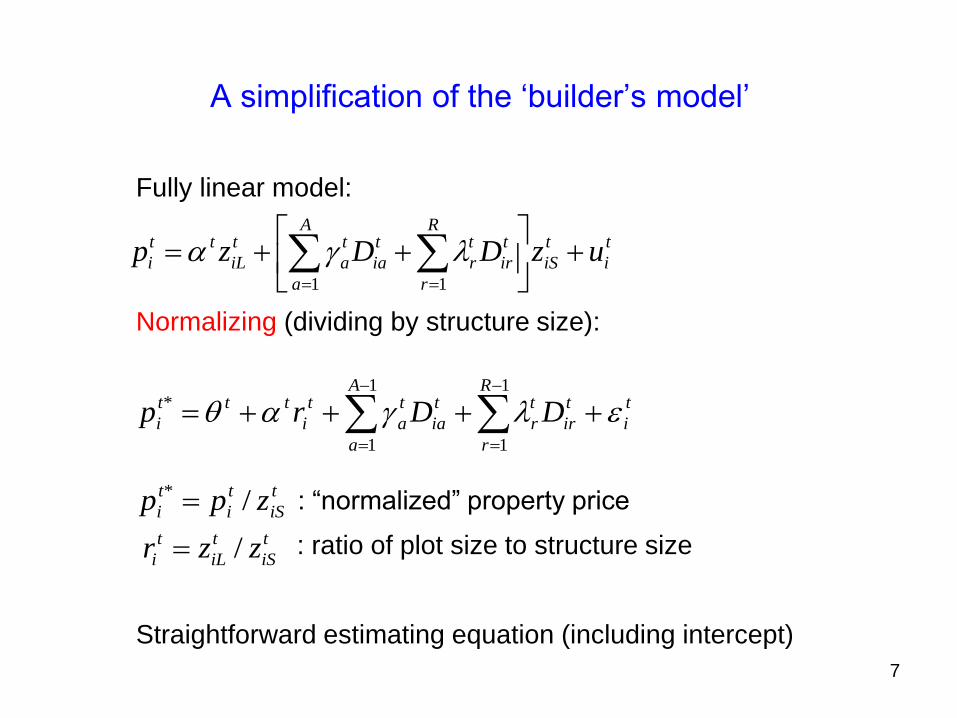
A simplification of the ‘builder’s model’
Fully linear model:
Normalizing (dividing by structure size):
: “normalized” property price
: ratio of plot size to structure size
Straightforward estimating equation (including intercept)
t
i
t
iS
R
r
t
ir
t
r
A
a
t
ia
t
a
t
iL
tt
i uzDDzp
11
t
iS
t
i
t
i zpp /*
t
iS
t
iL
t
i zzr /
t
i
A
a
R
r
t
ir
t
r
t
ia
t
a
t
i
ttt
i DDrp
1
1
1
1
*
8
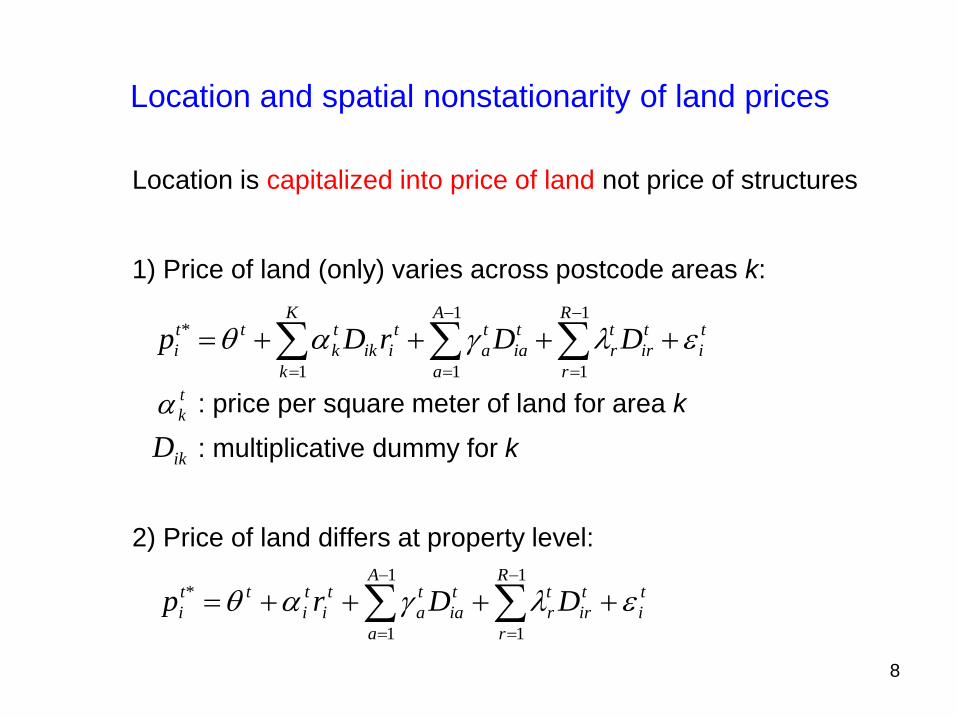
Location and spatial nonstationarity of land prices
Location is capitalized into price of land not price of structures
1) Price of land (only) varies across postcode areas k:
: price per square meter of land for area k
: multiplicative dummy for k
2) Price of land differs at property level:
t
i
A
a
R
r
t
ir
t
r
t
ia
t
a
K
k
t
iik
t
k
tt
i DDrDp
1
1
1
11
*
t
i
A
a
R
r
t
ir
t
r
t
ia
t
a
t
i
t
i
tt
i DDrp
1
1
1
1
*
ikD
t
k
9
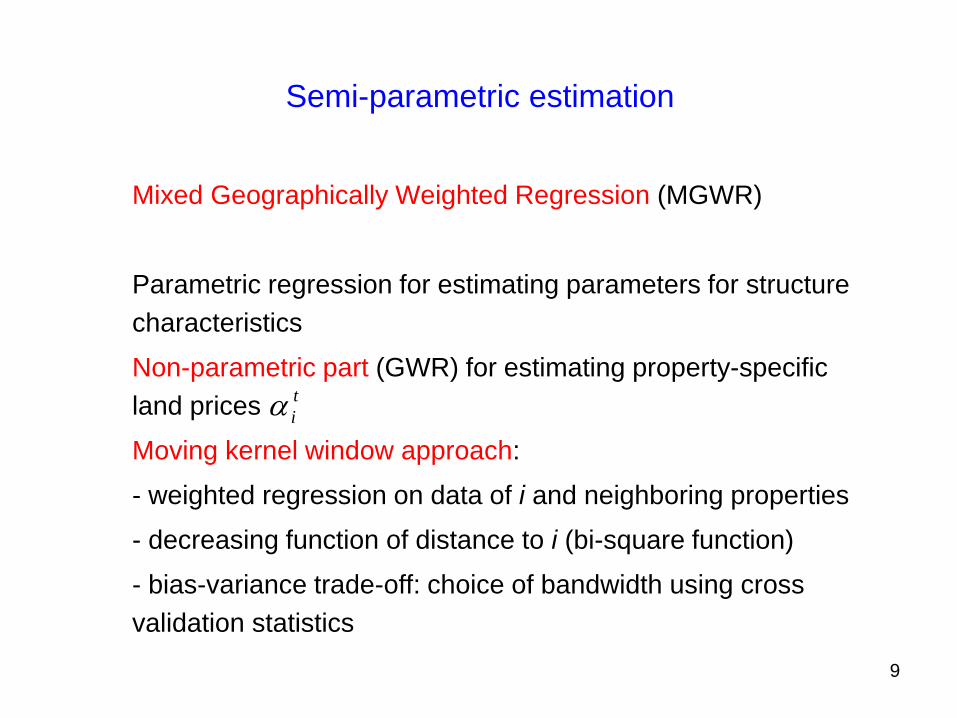
Semi-parametric estimation
Mixed Geographically Weighted Regression (MGWR)
Parametric regression for estimating parameters for structure
characteristics
Non-parametric part (GWR) for estimating property-specific
land prices
Moving kernel window approach:
- weighted regression on data of i and neighboring properties
- decreasing function of distance to i (bi-square function)
- bias-variance trade-off: choice of bandwidth using cross
validation statistics
t
i

10
Hedonic imputation price indexes
Hedonic double imputation house price indexes: Laspeyres,
Paasche and Fisher
(defined on base period sample)
Predicted prices:
Estimated quality-adjusted prices:
0
0
0
)0(
0
ˆ
ˆ
Si
i
Si
t
i
t
Laspeyresp
p
P
1
1
001
1
00)0( ]ˆˆˆ[ˆˆR
r iSir
t
r
A
a ia
t
a
t
iL
t
i
t
i zDDzp
1
1
0001
1
000000*00 ]ˆˆˆ[ˆˆˆR
r iSirr
A
a iaaiLiiSii zDDzzpp
11
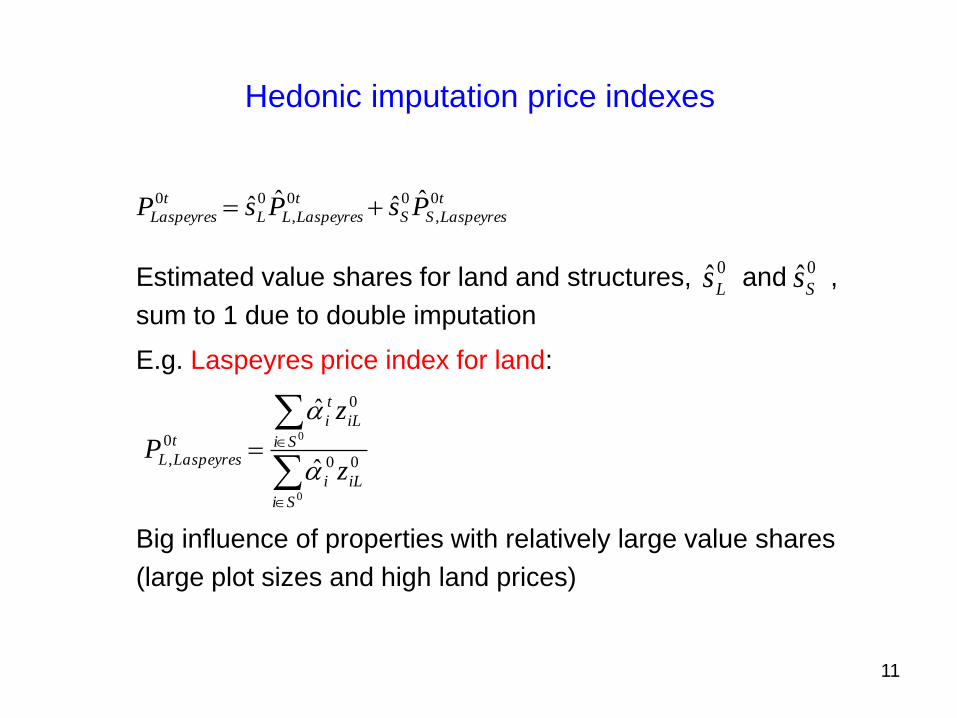
Hedonic imputation price indexes
Estimated value shares for land and structures, and ,
sum to 1 due to double imputation
E.g. Laspeyres price index for land:
Big influence of properties with relatively large value shares
(large plot sizes and high land prices)
t
LaspeyresSS
t
LaspeyresLL
t
Laspeyres PsPsP 0
,
00
,
00 ˆˆˆˆ
0
0
00
0
0
,ˆ
ˆ
Si
iLi
Si
iL
t
i
t
LaspeyresLz
z
P
0ˆLs 0ˆ
Ss
12
Empirical results
Data set
City of “A” in northeastern part of the Netherlands (population
around 60,000)
Annual data for 1998-2007
Total of 6,397 sales, excluding apartments and
condominiums
Geocoded by Statistics Netherlands
Many characteristics but we only used plot size, living space,
building period, type of house
44 observations removed (missing values, outliers)
13
Empirical results
Three models estimated, separately for each year:
1) No variation in land prices allowed (“OLS”)
2) Variation across postcodes (“OLSD”)
3) Variation across individual properties (“MWGR”)
[60 neighboring properties used in MWGR estimations]
According to (corrected) AICc as well as RMSE:
OLSD performs better than OLS
MWGR performs better than OLSD
for each year
14
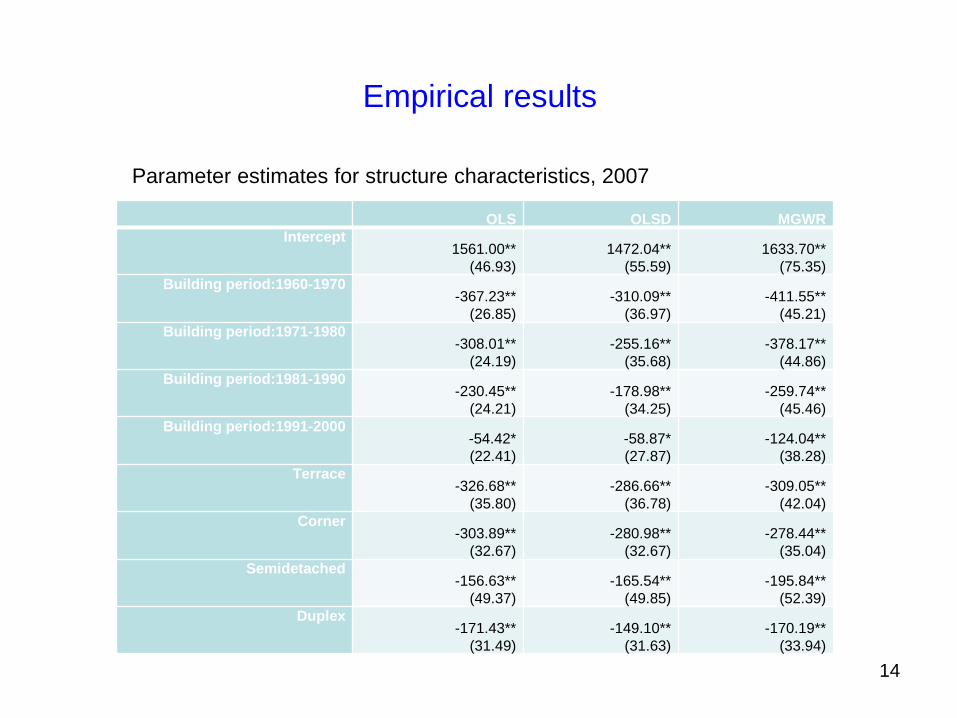
Empirical results
Parameter estimates for structure characteristics, 2007
OLS OLSD MGWR
Intercept 1561.00**
(46.93)
1472.04**
(55.59)
1633.70**
(75.35)
Building period:1960-1970 -367.23**
(26.85)
-310.09**
(36.97)
-411.55**
(45.21)
Building period:1971-1980 -308.01**
(24.19)
-255.16**
(35.68)
-378.17**
(44.86)
Building period:1981-1990 -230.45**
(24.21)
-178.98**
(34.25)
-259.74**
(45.46)
Building period:1991-2000 -54.42*
(22.41)
-58.87*
(27.87)
-124.04**
(38.28)
Terrace -326.68**
(35.80)
-286.66**
(36.78)
-309.05**
(42.04)
Corner -303.89**
(32.67)
-280.98**
(32.67)
-278.44**
(35.04)
Semidetached -156.63**
(49.37)
-165.54**
(49.85)
-195.84**
(52.39)
Duplex -171.43**
(31.49)
-149.10**
(31.63)
-170.19**
(33.94)
15
Empirical results
Intercept measures price of living space per square meter for
detached houses built after 2000
Large difference between intercepts for MWGR and OLSD
Structures become less expensive as they get older
Detached houses are more expensive than other types of
houses
All coefficients differ significantly from zero
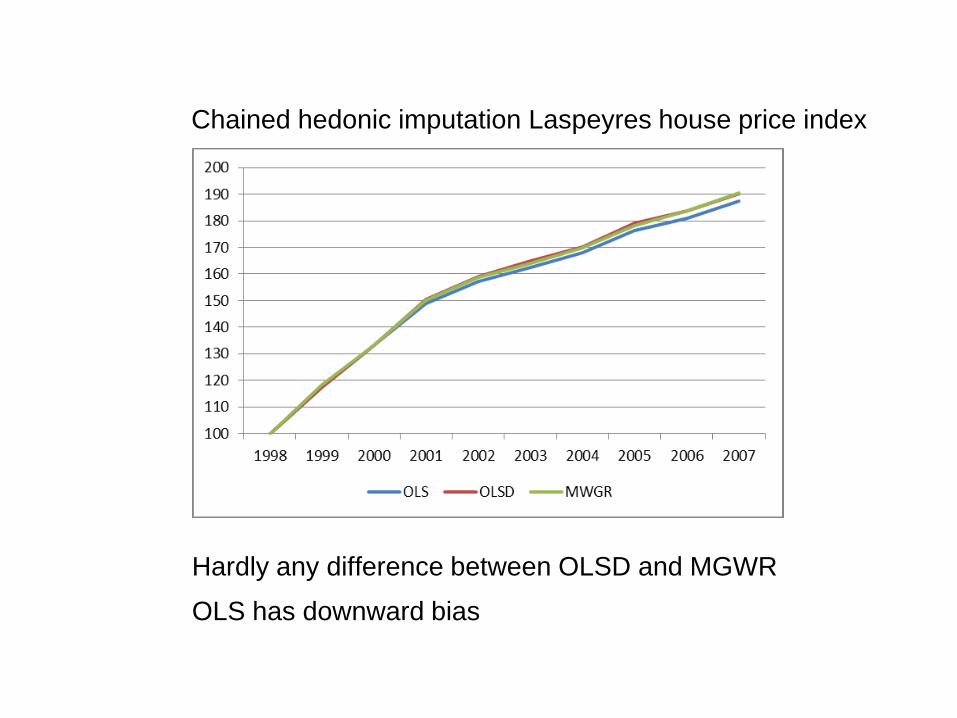
Chained hedonic imputation Laspeyres house price index
Hardly any difference between OLSD and MGWR
OLS has downward bias
17
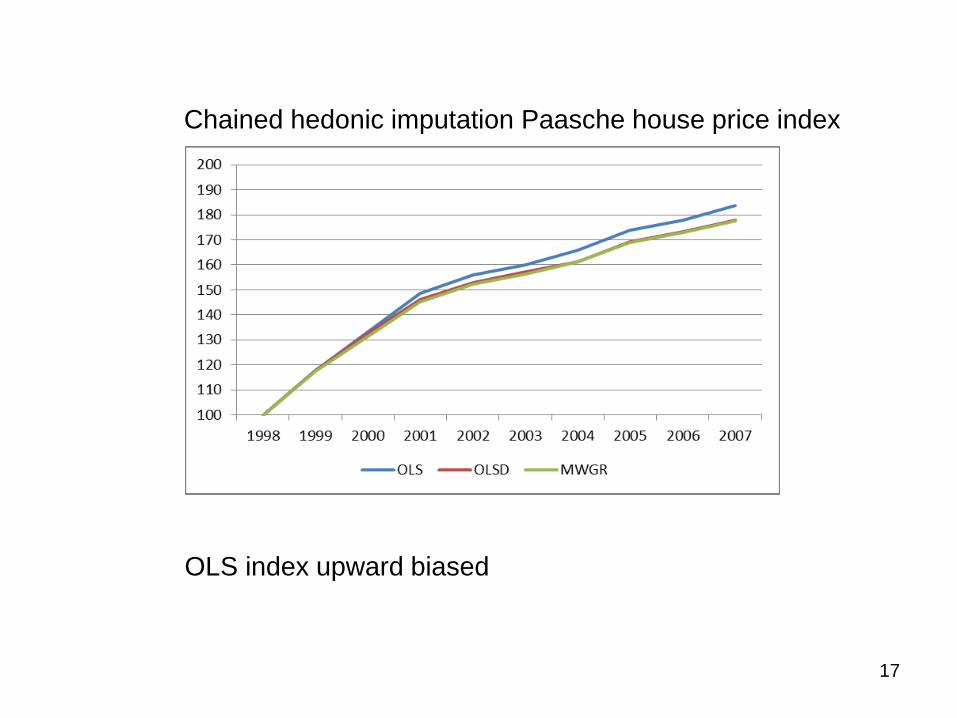
Chained hedonic imputation Paasche house price index
OLS index upward biased
18
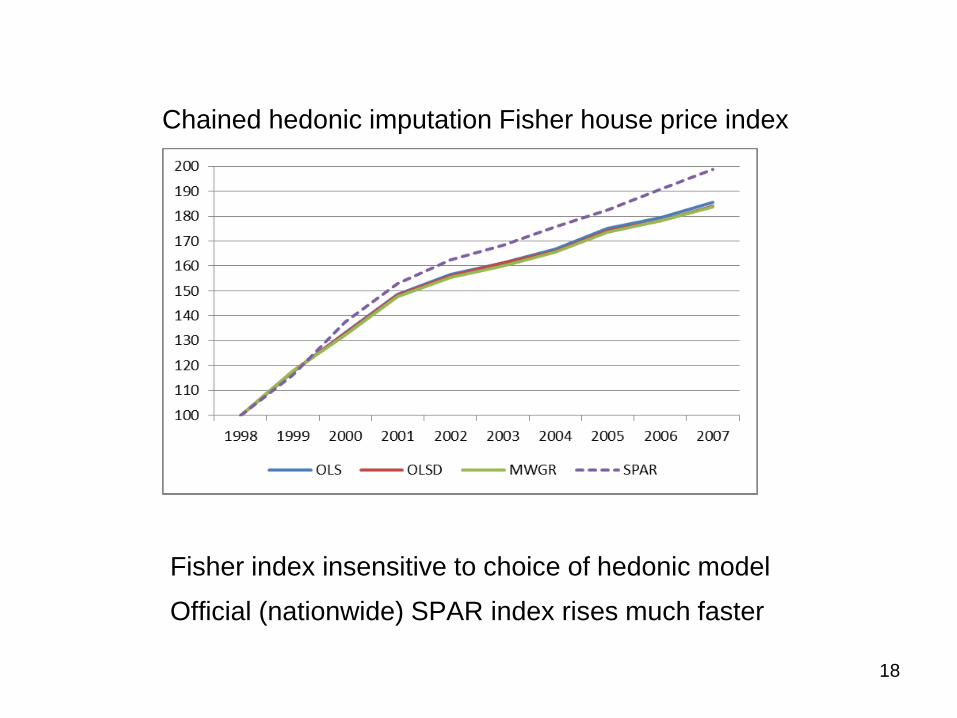
Chained hedonic imputation Fisher house price index
Fisher index insensitive to choice of hedonic model
Official (nationwide) SPAR index rises much faster
19
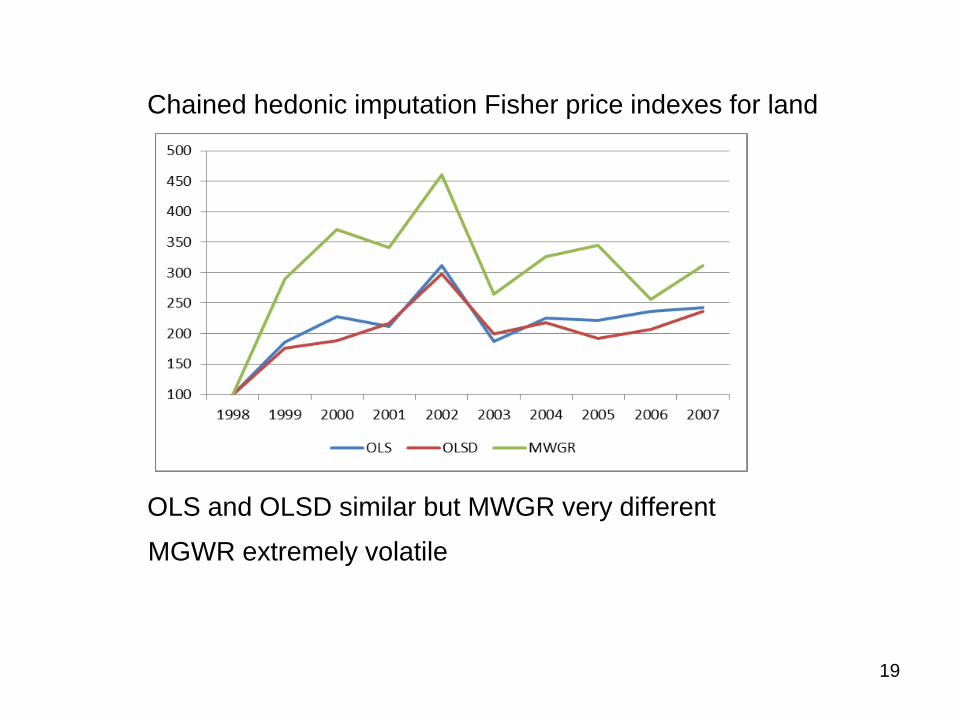
Chained hedonic imputation Fisher price indexes for land
OLS and OLSD similar but MWGR very different
MGWR extremely volatile
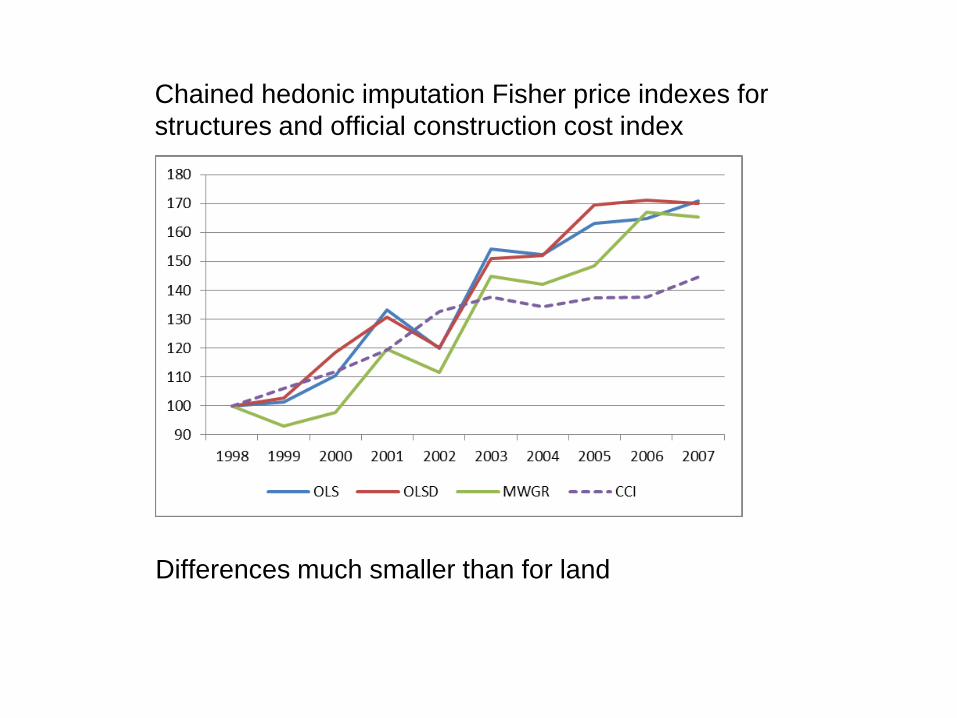
Chained hedonic imputation Fisher price indexes for
structures and official construction cost index
Differences much smaller than for land
21
Empirical results
Are the trends on indexes for land and structures plausible?
No benchmark available for land
For structures: official (nationwide) construction cost index
- flattens during second half of sample period; price indexes
for structures keep rising
- bias in construction cost index?
- house prices were still rapidly rising while construction
cost index increased by only 4.9% during 2003-2007 (CPI:
5.8%)
22
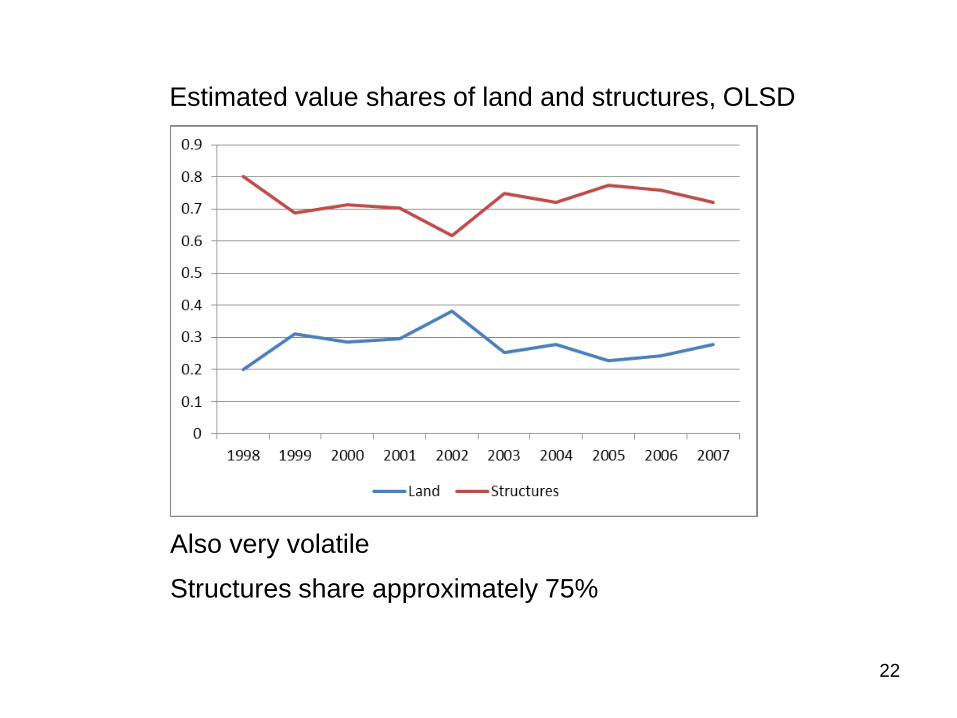
Estimated value shares of land and structures, OLSD
Also very volatile
Structures share approximately 75%

23
Empirical results
Potential causes of volatility of the land and structure indexes
1) Small number of observations
2) Multicollinearity
Land and structure price changes do not consistently show
opposite signs; VIF for ratio of plot size to structures size is low
3) Heteroskedasticity
Yes (Breusch-Pagan test for OLS and OLSD)
4) Non-linear relation between normalized property price and
‘ratio’, and outliers
24
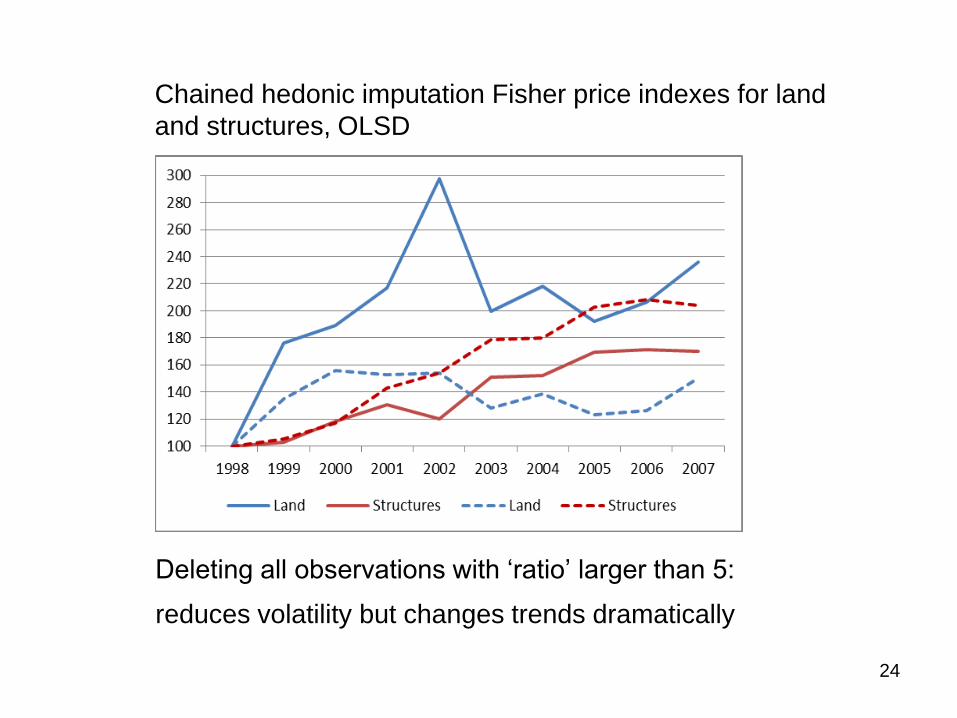
Chained hedonic imputation Fisher price indexes for land
and structures, OLSD
Deleting all observations with ‘ratio’ larger than 5:
reduces volatility but changes trends dramatically
25
Conclusions
• The linearization and ‘normalization’ of the builder’s model is
useful for estimating (overall) house price indexes
• Double imputation Fisher house price index is insensitive to
choice of hedonic model, so …
• … no need to use spatial econometrics for estimating overall
price index; postcode dummies will suffice
(see also Hill and Scholz, 2014)
• Land and structure price indexes are very volatile due to
outliers and nonlinear relation between normalized property
price and land size to structure size ratio
(and heteroskedasticity; multicollinearity not a big problem)

26
Conclusions
• Underlying cause: price of land depends on plot size
(Diewert, de Haan and Hendriks, 2015: linear splines)
• Problems with MWGR method? Possibly inherently unstable
results
• Doubts about official (SPAR) house price index and
construction cost index
• Future work: data for bigger city, nonlinear relation, more
structure characteristics, impact of chaining, other semi-
parametric method?