Accounting for Model Uncertainty and Natural Trading Partner Effects Trade Creation and Diversion...
39
Accounting for Model Uncertainty and Natural Trading Partner Effects Trade Creation and Diversion Revisited: Christian Henn Theo S. Eicher Chris Papageorgiou IMF University of Washington IMF
-
date post
22-Dec-2015 -
Category
Documents
-
view
219 -
download
2
Transcript of Accounting for Model Uncertainty and Natural Trading Partner Effects Trade Creation and Diversion...

Accounting for Model Uncertainty and Natural Trading Partner
Effects
Trade Creation and Diversion Revisited:
Christian Henn
Theo S. Eicher Chris Papageorgiou
IMF University of Washington
IMF

2
Road Map Reexamine PTAs’ impacts on trade flows
Introduce New Methodology: Address Model Uncertainty Allow for Natural Trading Partners
Generate New Results: Identify PTAs’ tangible benefits Identify individual PTA’s trade
creation/diversion Highlight relevance of comprehensive
approach

3
A Brief History of Trade Flow Determinants
Ricardo (Technology) Heckscher / Ohlin (Factor Endowments) Brander / Spencer / Krugman (IRS, Market
Structure) Rivera Batiz / Romer / Young (Endogenous
Growth) Melitz/Antras (Intra-Industry Cost
Heterogeneity)
4
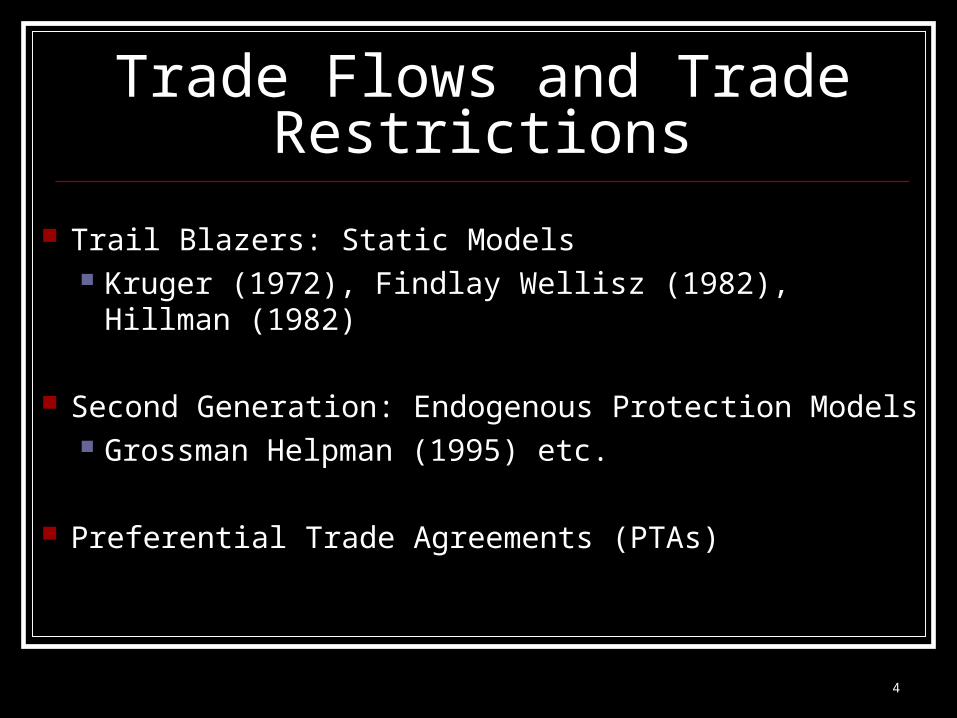
Trade Flows and Trade Restrictions
Trail Blazers: Static Models Kruger (1972), Findlay Wellisz (1982), Hillman
(1982)
Second Generation: Endogenous Protection Models Grossman Helpman (1995) etc.
Preferential Trade Agreements (PTAs)
5
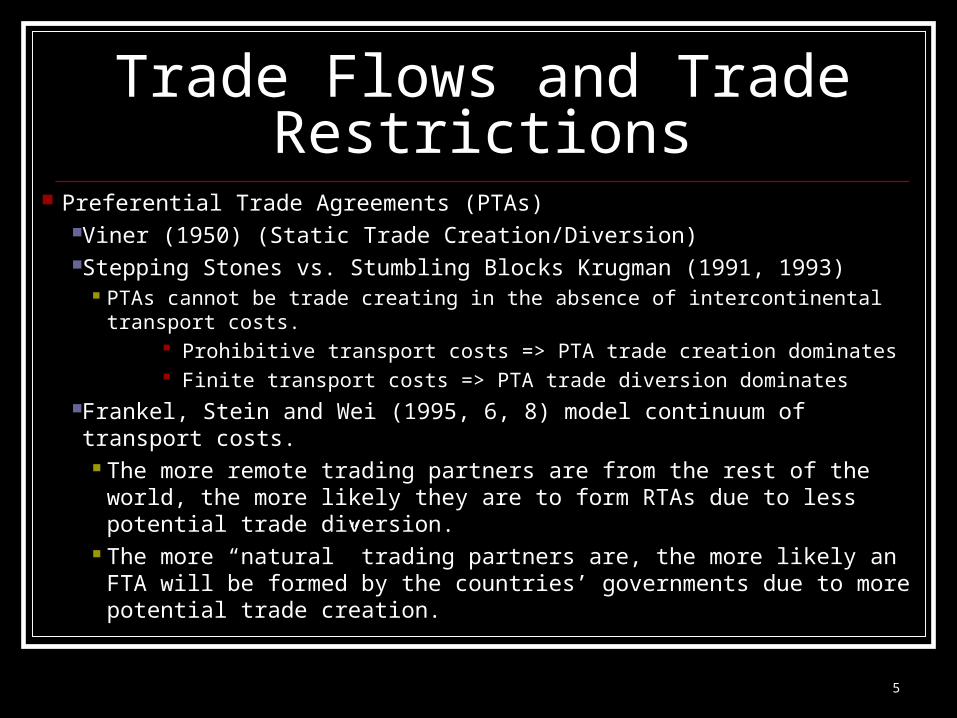
Trade Flows and Trade Restrictions
Preferential Trade Agreements (PTAs) Viner (1950) (Static Trade Creation/Diversion)Stepping Stones vs. Stumbling Blocks Krugman (1991, 1993)
PTAs cannot be trade creating in the absence of intercontinental transport costs.
Prohibitive transport costs => PTA trade creation dominates Finite transport costs => PTA trade diversion dominates
Frankel, Stein and Wei (1995, 6, 8) model continuum of transport costs.
The more remote trading partners are from the rest of the world, the more likely they are to form RTAs due to less potential trade diversion.
The more “natural” trading partners are, the more likely an FTA will be formed by the countries’ governments due to more potential trade creation.
6
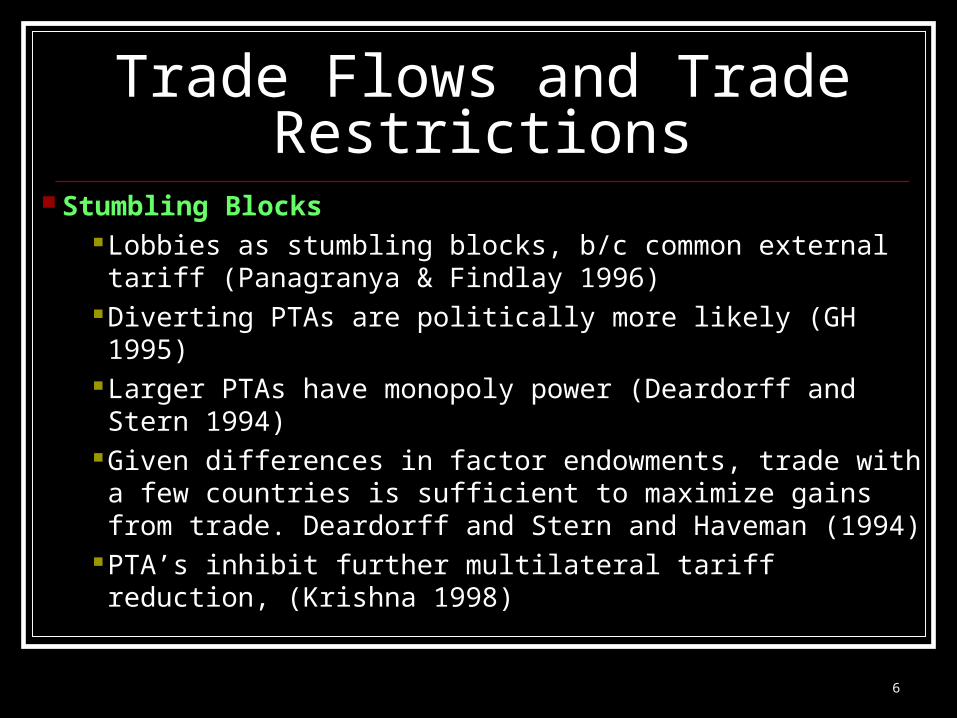
Trade Flows and Trade Restrictions
Stumbling BlocksLobbies as stumbling blocks, b/c common external tariff (Panagranya & Findlay 1996)
Diverting PTAs are politically more likely (GH 1995)Larger PTAs have monopoly power (Deardorff and Stern 1994)
Given differences in factor endowments, trade with a few countries is sufficient to maximize gains from trade. Deardorff and Stern and Haveman (1994)
PTA’s inhibit further multilateral tariff reduction, (Krishna 1998)

7
Trade Flows and Trade Restrictions
Stepping Stones (“complementary effect of pref. tariffs Bagwell Staiger 1998)preferential tariff induces trade diversion, which is costly, so external tariffs declines to compensate and shift imports back to their original source)
PTAs allow lower external tariff b/c (tariff revenue competition, PTA free trade benefits allow for lower tariff revenues, so external tariff falls. RTA may promote external liberalization, Richardson 1993)
Baldwin (1993, 1995, 1997) & Levy (1996) Non-member exporters lobby forces joining if diversion is
large Larger PTAs shifts more power to the export lobby Larger PTA even more attractive to join (more trade
creation) PTA induced harmonization, allows new revenues that overcome
trade fixed costs Freund (2000)

8
PTA Effects Can Have Many Sources
That Are Difficult to Disentangle
Possible Scenarios: Among members: Trade Creation / Trade Diversion Between members: Trade Diversion / Open Block Between Non Members: Trade Diversion /Open
Block
Which Theory is Empirically Relevant? Which Effect(s) Dominate? How do we sift through the many models for
evidence??

9
PTA Effects Can Have Many Sources
That Are Difficult to Disentangle
Possible Scenarios: Among members: Trade Creation / Trade Diversion Between members: Trade Diversion / Open Block Between non members: Trade Diversion /Open Block
Which Theory is Empirically Relevant? Which effect(s) dominate? How do we sift through the many models for evidence??
This is the DEFINITION of Models Uncertainty
10
Model Uncertainty: Why do we care?
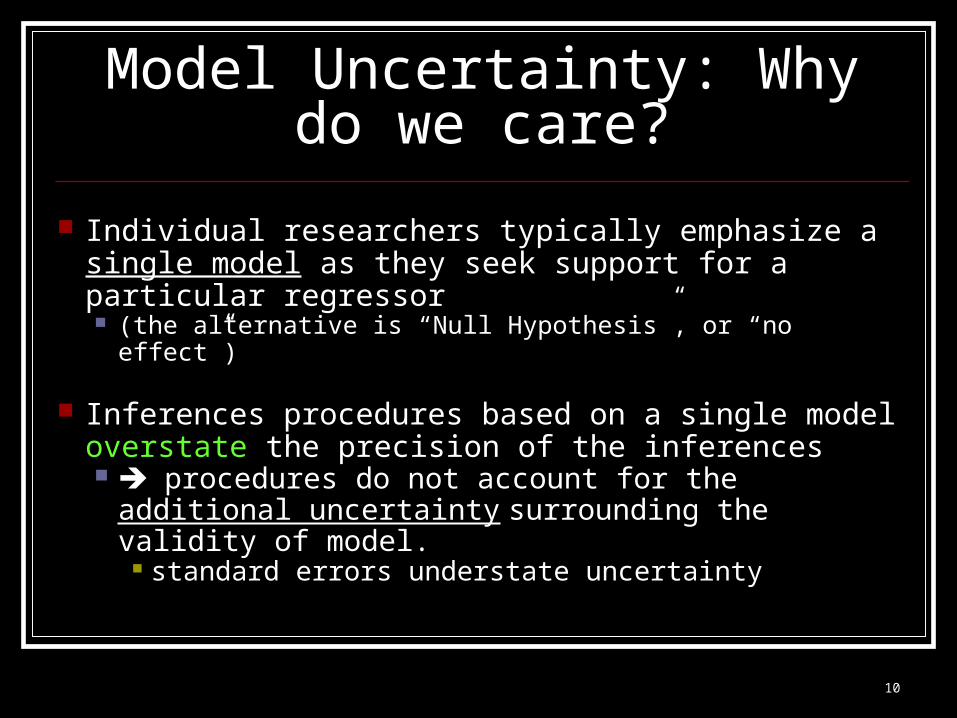
Individual researchers typically emphasize a single model as they seek support for a particular regressor (the alternative is “Null Hypothesis”, or “no effect”)
Inferences procedures based on a single model overstate the precision of the inferences procedures do not account for the
additional uncertainty surrounding the validity of model.
standard errors understate uncertainty


Est. relationship, past studies Positive None Negative
AFTAij 3 2 ANZCERTAij 1 APECij 3 APij 3 2 CACMij 4 2 CARICOMij EEAij EFTAij 3 5 EUij 9 9 LAIAij 4 2 MERCOSURij 2 3
Trade Creation
NAFTAij 1 3 AFTAi 2 1 1 ANZCERTAi APECj APj 1 2 CACMj 2 2 CARICOMi EEAi EFTAi 1 1 EUi 2 1 LAIAi 2 2 MERCOSURi 2 2
Trade Diversion / Open Bloc
NAFTAi 1 2 1

13
Previous Approach To Model Uncertainty In Trade Flow Empirics
Ghosh and Yamarik (2004, JIE) First (and to date only) attempt to
account for model uncertainty in trade flow / PTA estimation
Use Extreme Bounds Analysis (EBA) (Leamer 1978, 1983, 1985)

14
Previous Approach To Model Uncertainty In Trade Flow Theory
Ghosh and Yamarik (2004, JIE) First (and to date only) attempt to account
for model uncertainty in trade flow / PTA estimation
Use Extreme Bounds Analysis (EBA) (Leamer 1978, 1983, 1985)
Conclusion: No evidence of trade creation or diversion for any PTA! Relaxed extreme bounds pick up only trade diverting PTAs!!

15
Extreme Bound Analysis-- Assessment --
Lack of Statistical Theory Backbone Reduce model space artificially to avoid running all
regressions. (Why?) Why has each model (no matter how terrible) equal
weight…? What is the robustness criterion? (see growth theory) How relevant is the analysis if the model space holds
billions of models and the researcher searches only over less than 0.0000001% of the model space?
Severe omitted variable bias
Could be (and has been) considered data mining…
16
Bayesian Model Averaging (BMA)
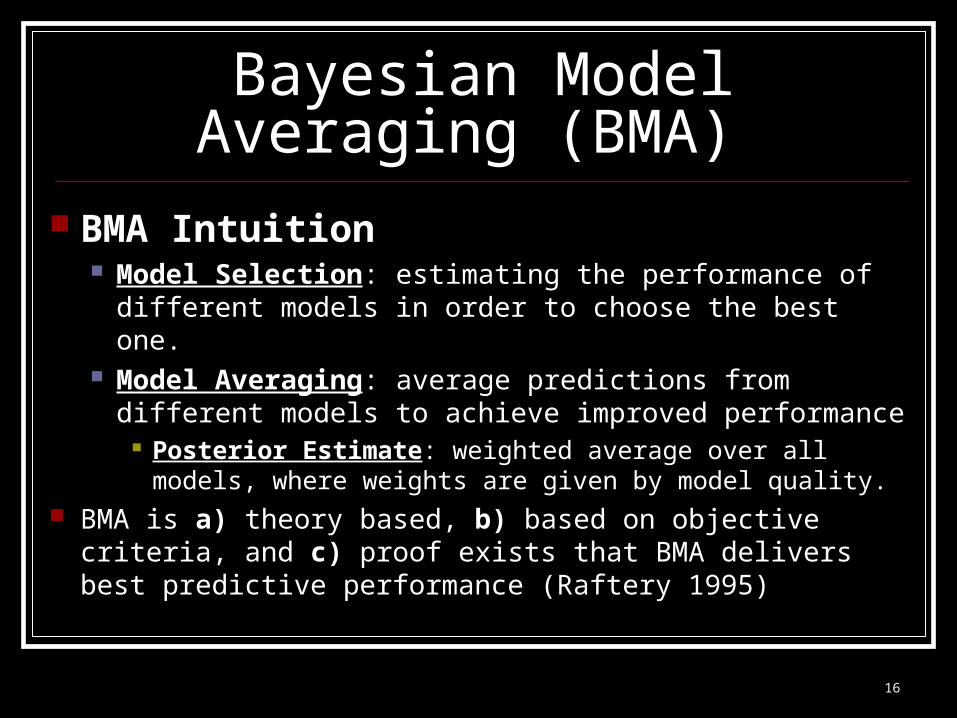
BMA Intuition Model Selection: estimating the performance of
different models in order to choose the best one. Model Averaging: average predictions from
different models to achieve improved performance Posterior Estimate: weighted average over all
models, where weights are given by model quality. BMA is a) theory based, b) based on objective
criteria, and c) proof exists that BMA delivers best predictive performance (Raftery 1995)

17
Bayesian Model Averaging:Quick details for the math hungry
1
( | ) ( )( | )
( | ) ( )k k
k K
l ll
p D M p Mp M D
p D M p M
( | ) ( | , ) ( | )k k k k k kp D M p D M p M d
D is the data, Mk is a model in some model space M, K is number of models, is a quantity of interest
Nice: priors largely wash out with 15000 observations
• posterior probability for model Mk (the “weight”) is
• is the integrated likelihood (over all regressors)
• Posterior Mean
DMpMDEDE k
K
k K |,||0
18
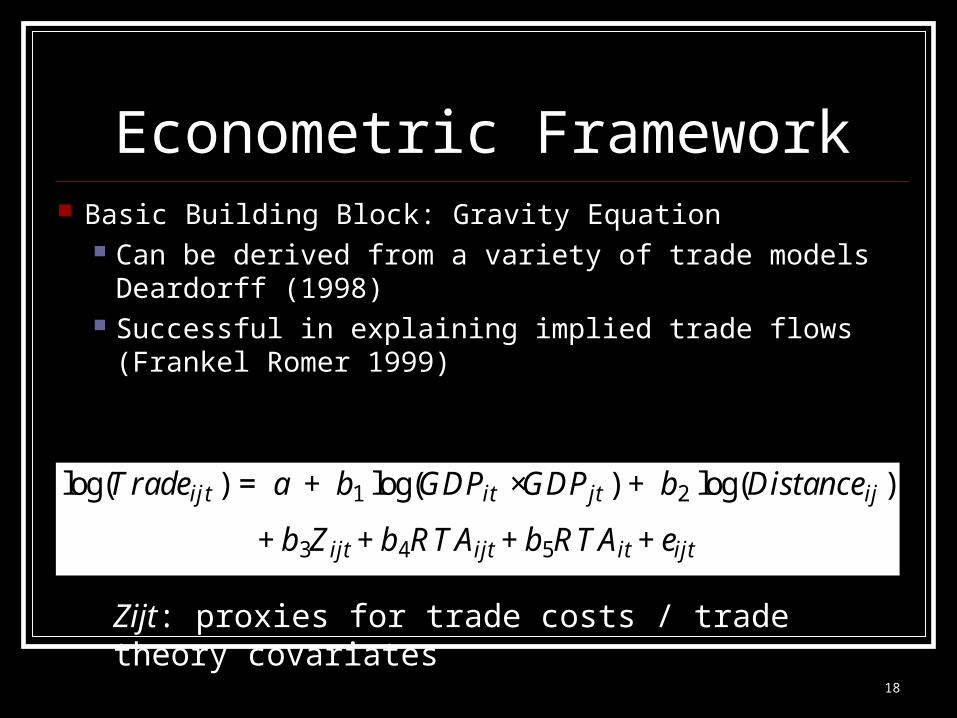
Econometric Framework Basic Building Block: Gravity Equation
Can be derived from a variety of trade models Deardorff (1998)
Successful in explaining implied trade flows (Frankel Romer 1999)
1 2
3 4 5
log( ) log( ) log( )
+ + + +
ijt it jt ij
ijt ijt it ijt
Trade GDP GDP Distance
Z RTA RTA
a b b
b b b e
= + × +
Zijt: proxies for trade costs / trade theory covariates
19
Definition of PTA Dummies
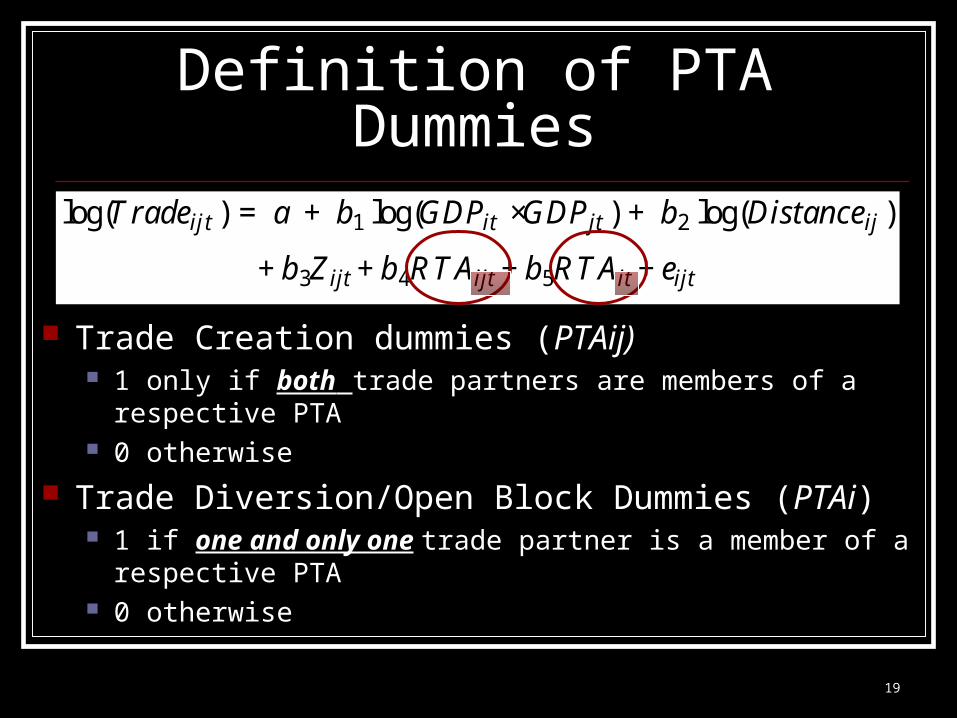
Trade Creation dummies (PTAij) 1 only if both trade partners are members of a
respective PTA 0 otherwise
Trade Diversion/Open Block Dummies (PTAi) 1 if one and only one trade partner is a member of a
respective PTA 0 otherwise
1 2
3 4 5
log( ) log( ) log( )
+ + + +
ijt it jt ij
ijt ijt it ijt
Trade GDP GDP Distance
Z RTA RTA
a b b
b b b e
= + × +
20
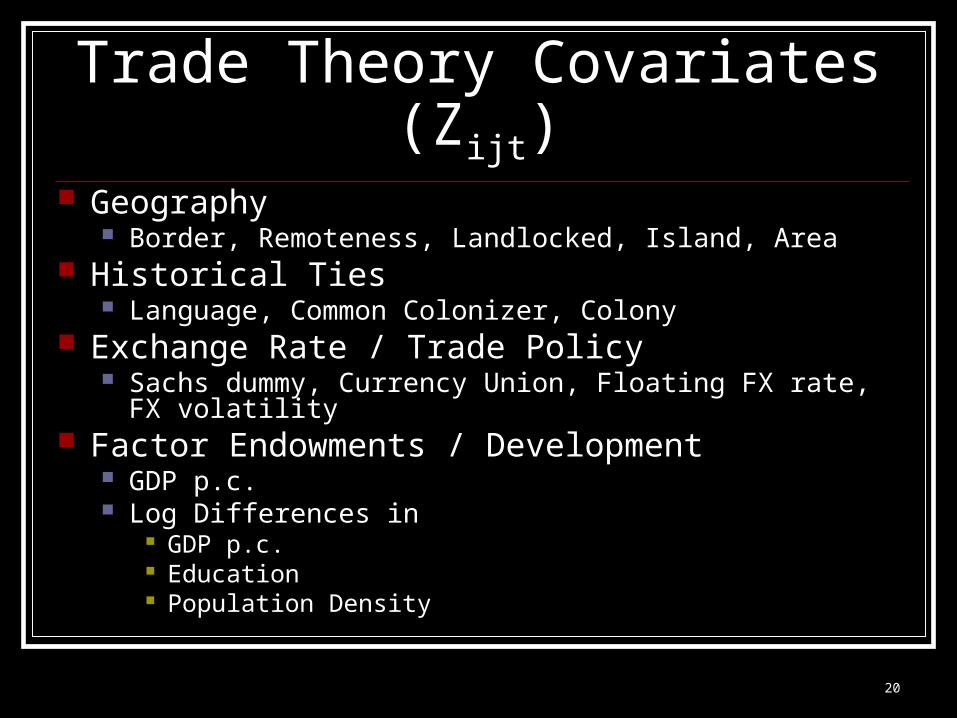
Trade Theory Covariates (Zijt)
Geography Border, Remoteness, Landlocked, Island, Area
Historical Ties Language, Common Colonizer, Colony
Exchange Rate / Trade Policy Sachs dummy, Currency Union, Floating FX rate, FX
volatility Factor Endowments / Development
GDP p.c. Log Differences in
GDP p.c. Education Population Density

21
Data Identical to “no effect” data of Ghosh and Yamarik
(2004) Avg Bilateral Trade Flows, 186 countries, 14,522
observations, 3,420 bilateral trade pairs, five-year intervals (1970-1995)
12 major PTAs: Europe: EU, EFTA, EEA Pacific Rim: APEC, ASEAN, NAFTA, ANZCERTA Latin America: CACM, CARICOM, LAIA, AP
(Andean Pact), MERCOSUR
22
European PTA MembersAbbreviation Name of RTA Start Member countries EEA European Economic
Area 1994 Austria, Belgium, Denmark, Finland, France, Germany,
Greece, Luxembourg, Iceland, Italy, Ireland, Liechtenstein, Netherlands, Norway, Portugal, Spain, Sweden, United Kingdom.
EFTA European Free Trade Arrangement
1960 Iceland, Liechtenstein (1991), Norway (1986), Switzerland Former: Denmark (1960-72), United Kingdom (1960-72), Portugal (1960-85), Austria (1960-94), Sweden (1960-94), Finland (1986-94).
EU European Union 1958 Austria (1995), Belgium, Denmark (1973), Finland (1995), France, Germany, Greece (1981), Luxembourg, Ireland (1973), Italy, Netherlands, Portugal (1986), Spain (1986), Sweden (1995), United Kingdom (1973).
23
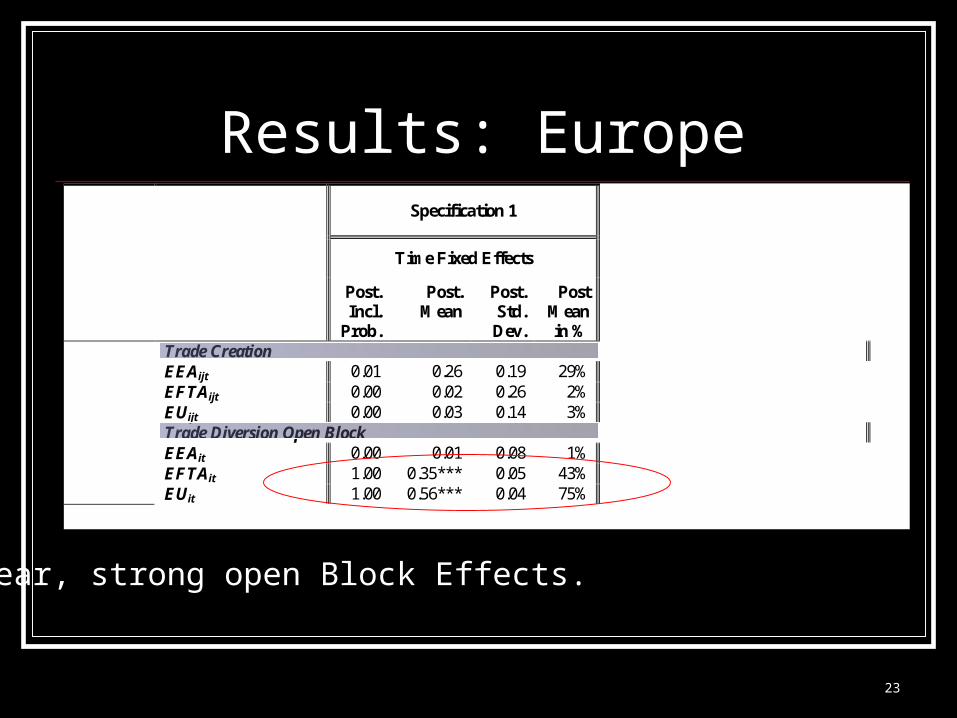
Results: Europe Specification 1
Time Fixed Effects
Post. Incl.
Prob.
Post. Mean
Post. Std. Dev.
Post Mean in %
Trade Creation EEAijt 0.01 0.26 0.19 29% EFTAijt 0.00 0.02 0.26 2% EUijt 0.00 0.03 0.14 3% Trade Diversion Open Block EEAit 0.00 0.01 0.08 1% EFTAit 1.00 0.35*** 0.05 43%
EUit 1.00 0.56*** 0.04 75%
Clear, strong open Block Effects.

24
Pacific Rim PTA membersAbbreviation Name of RTA Start Member countries ANZCERTA Australia – New
Zealand Closer Economic Relations Trade Agreement
1983 Australia, New Zealand
APEC Asia Pacific Economic Community
1989 Australia, Brunei, Canada, China (1991), Chile (1994), Taiwan (1991), Hong Kong (1991), Indonesia, Japan, South Korea, Malaysia, Mexico (1993), New Zealand, Papua New Guinea (1993), Peru (1998), Philippines, Singapore, Thailand, United States, Vietnam (1998).
ASEAN Association of South East Asian Nations
1967 Brunei (1984), Cambodia (1998), Indonesia, Laos (1997), Malaysia, Myanmar (1997), the Philippines, Singapore, Thailand, Vietnam (1995).
NAFTA Canada-US Free Trade Arrangement / North America Free Trade Agreement
1988 Canada, United States, Mexico (1994).

25
Results: Pacific Rim
Specification 1
Time Fixed Effects
Post. Incl.
Prob.
Post. Mean
Post. Std. Dev.
Post Mean in %
Trade Creation AFTAijt 0.00 -0.22 0.54 -20% ANZCERTAijt 0.01 0.89 0.96 144% APECijt 1.00 1.48*** 0.15 338% NAFTAijt 0.01 -0.89 0.84 -59% Trade Diversion, Open Bloc AFTAit 0.03 0.17 0.11 19% ANZCERTAit 1.00 -0.47*** 0.10 -37% APECit 1.00 0.55*** 0.06 73%
NAFTAit 1.00 -0.63*** 0.10 -47%
Now significant trade creation and diversion and open block
PTA’s matter a lot!
Puzzling high APEC…
Large Trade Diversion for Nafta!

26
Latin American PTA Membership
Abbreviation Name of RTA Start Member countries AP Andean Community /
Andean Pact 1969 Bolivia, Colombia, Ecuador, Peru, Venezuela (1973),
Former: Chile (1969-76) CACM Central American
Common Market 1960 Costa Rica (1963), El Salvador, Guatemala, Honduras,
Nicaragua. CARICOM Caribbean
Community/ Carifta 1968 Antigua and Barbuda, Bahamas (1983), Barbados, Belize
(1995), Dominica (1974), Guyana (1995), Grenada (1974), Jamaica, Montserrat (1974), St. Kitts and Nevis, St. Lucia (1974), St. Vincent and the Grenadines, Suriname (1995), Trinidad and Tobago.
LAIA Latin America Integration Agreement
1960 Argentina, Bolivia (1967), Brazil, Chile, Colombia (1961) Ecuador (1961), Mexico, Paraguay, Peru, Uruguay, Venezuela (1966).
MERCOSUR Mercado Comun Del Sur
1991 Argentina, Brazil, Paraguay, Uruguay

27
Results: Latin America
Time Fixed Effects
Post. Incl.
Prob.
Post. Mean
Post. Std. Dev.
Post Mean in %
Trade Creation APijt 0.01 -0.05 0.27 -5% CACMijt 1.00 2.25*** 0.23 848% CARICOMijt 1.00 2.08*** 0.41 702% LAIAijt 0.91 0.46*** 0.13 58%
MERCOSURijt 0.12 1.66 0.70 424% Trade Diversion, Open Bloc APit 0.52 -0.19* 0.06 -17% CACMit 0.85 -0.18** 0.05 -17% CARICOMit 1.00 -0.74*** 0.07 -52% LAIAit 1.00 -0.40*** 0.07 -33%
MERCOSURit 0.79 0.42** 0.12 52%
Orthodox results ofStrong trade creationAnd trade diversionIn Latin America

28
Summary part I Using:
identical data statistically sound approach to model uncertainty considers all possible models (including best
model) Derive quality-weighted averaged estimates
We overturn the bleak “PTAs don’t matter“ results and show that several have trade creating, trade diverting and open block effects.
29
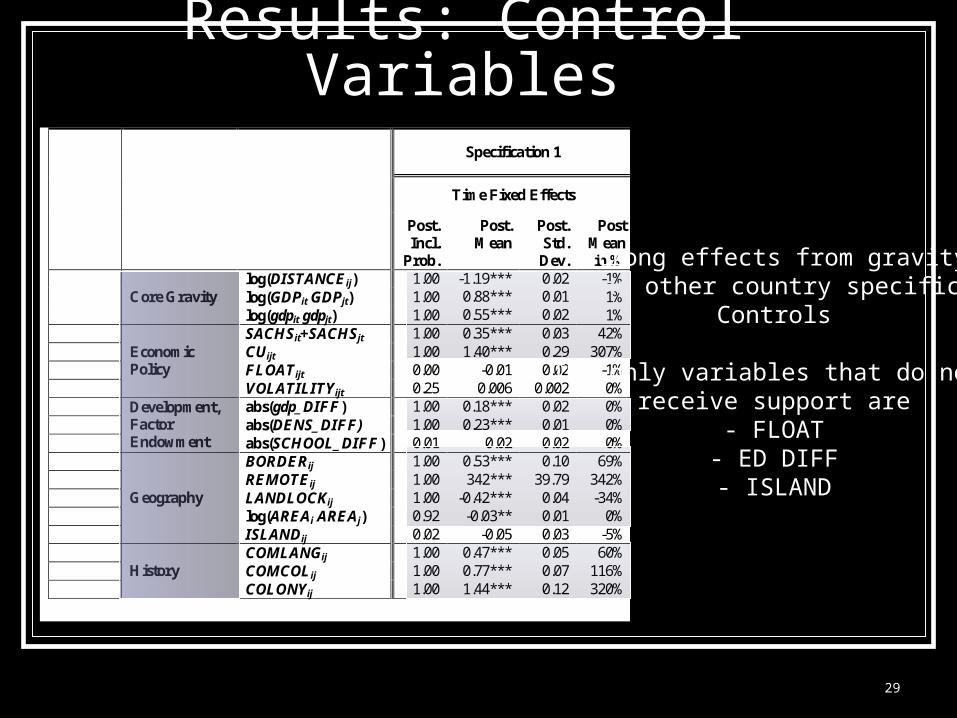
Results: Control Variables
Specification 1 Specification 2
Time Fixed Effects
Time & Country-Pair Fixed Effects
Post. Incl.
Prob.
Post. Mean
Post. Std. Dev.
Post Mean in %
Post. Incl.
Prob.
Post. Mean
Post. Std. Dev.
Post Mean in %
log(DISTANCEij) 1.00 -1.19*** 0.02 -1% 0% log(GDPit GDPjt) 1.00 0.88*** 0.01 1% 1.00 1.13*** 0.05 1%
Core Gravity log(gdpit gdpjt) 1.00 0.55*** 0.02 1% 0.02 0.16 0.10 0%
SACHSit+SACHSjt 1.00 0.35*** 0.03 42% 1.00 0.13*** 0.03 14% CUijt 1.00 1.40*** 0.29 307% 0.01 -0.64 0.67 -47% FLOATijt 0.00 -0.01 0.02 -1% 0.20 -0.05 0.02 -5%
Economic Policy
VOLATILITYijt 0.25 0.006 0.002 0% 0.01 -0.002 0.002 0% abs(gdp_DIFF) 1.00 0.18*** 0.02 0% 1.00 -0.31*** 0.05 0% abs(DENS_DIFF) 1.00 0.23*** 0.01 0% 0.75 0.25** 0.09 0%
Development, Factor Endowment abs(SCHOOL_DIFF) 0.01 0.02 0.02 0% 0.03 -0.06 0.04 0%
BORDERij 1.00 0.53*** 0.10 69% REMOTEij 1.00 342*** 39.79 342% LANDLOCKij 1.00 -0.42*** 0.04 -34% log(AREAi AREAj) 0.92 -0.03** 0.01 0%
Geography
ISLANDij 0.02 -0.05 0.03 -5% COMLANGij 1.00 0.47*** 0.05 60% COMCOLij 1.00 0.77*** 0.07 116%
History COLONYij 1.00 1.44*** 0.12 320%
Strong effects from gravityand other country specific
Controls
The only variables that do not receive support are
- FLOAT- ED DIFF- ISLAND

30
The Importance of Fixed Effects
(Natural Trading Partners) Hummels and Levinsohn (1995)
Trade is largely specific to country-pairs We may not know why, or cannot account for it
with our covariates, no matter how many controls we include.
We introduce country pair fixed effects Isolate whether countries trade a lot with each
other because of PTA’s or because they are natural trading partners
Cheng and Wall, 1999 (EU, Nafta, Mercsur); Egger and Pfaffermayr, 2003 (gravity only)

31
The Importance of Fixed Effects
(Natural Trading Partners) Introduce Country Pair Fixed Effects
Example: similarities in economic and social institutions, such as corruption or rule of law, or simple economic infrastructure such as telecommunications.
A concrete example would be France-Germany, with excellent transport links (unobserved) and a PTA (observed), vs. Afghanistan-Kazakhstan, with bad transport links (unobserved) and no PTA (observed).
ij
ijtitijtijtjtitijtijt PTAPTAZYYT 5431
~loglog
ijtitijtijtjtitijtijt PTAPTAZYYT 5431
~loglog
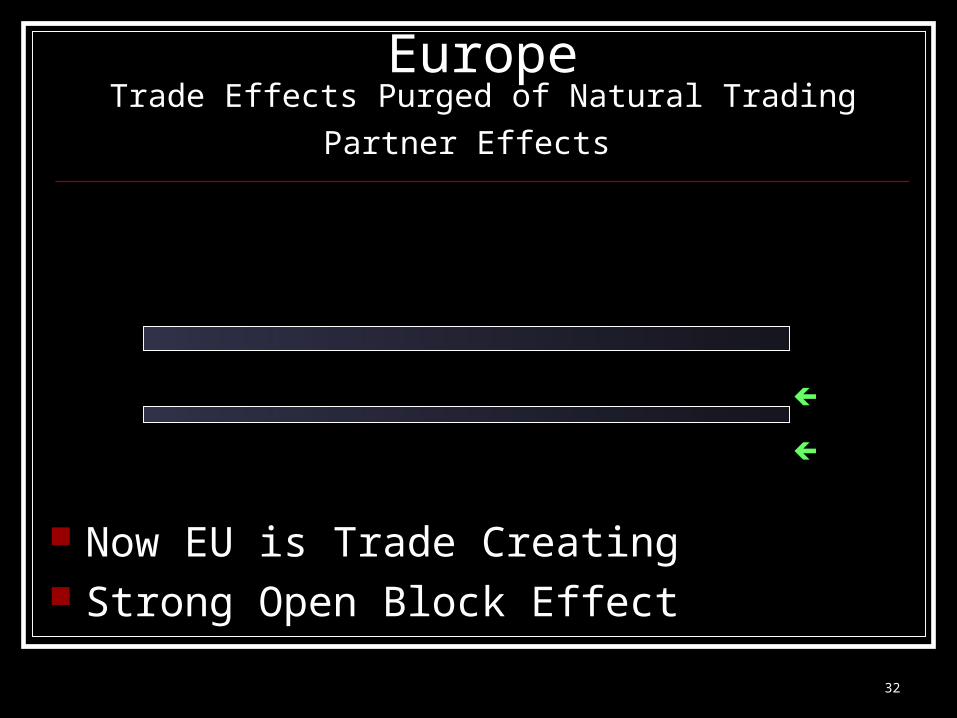
32
EuropeTrade Effects Purged of Natural Trading Partner Effects
Now EU is Trade Creating Strong Open Block Effect
Specification 1 Specification 2
Time Fixed Effects Time & Country-Pair Fixed
Effects
Post. Incl.
Prob.
Post. Mean
Post. Std. Dev.
Post Mean in %
Post. Incl.
Prob.
Post. Mean
Post. Std. Dev.
Post Mean in %
Trade Creation EEAijt 0.01 0.26 0.19 29% 0.00 0.06 0.17 6% EFTAijt 0.00 0.02 0.26 2% 0.03 0.52 0.32 69% EUijt 0.00 0.03 0.14 3% 1.00 0.66*** 0.17 93% Trade Diversion Open Block EEAit 0.00 0.01 0.08 1% 0.20 -0.14 0.06 -13% EFTAit 1.00 0.35*** 0.05 43% 0.98 0.26** 0.08 29%
EUit 1.00 0.56*** 0.04 75% 0.21 0.16 0.07 17%

33
EuropePTA Flows Purged of Natural Trading Partner Effects
Only after controlling for natural trading pairs, the EU is Trade Creating EU countries naturally under-trade relative
to the prediction of the standard gravity model. This “missing trade” is a standard feature of the basic gravity model, see e.g. Pollak (1996) or Rose (2004).
EU Open Block Trade Creation does not survive but is simply due to similarities among trading partners
34
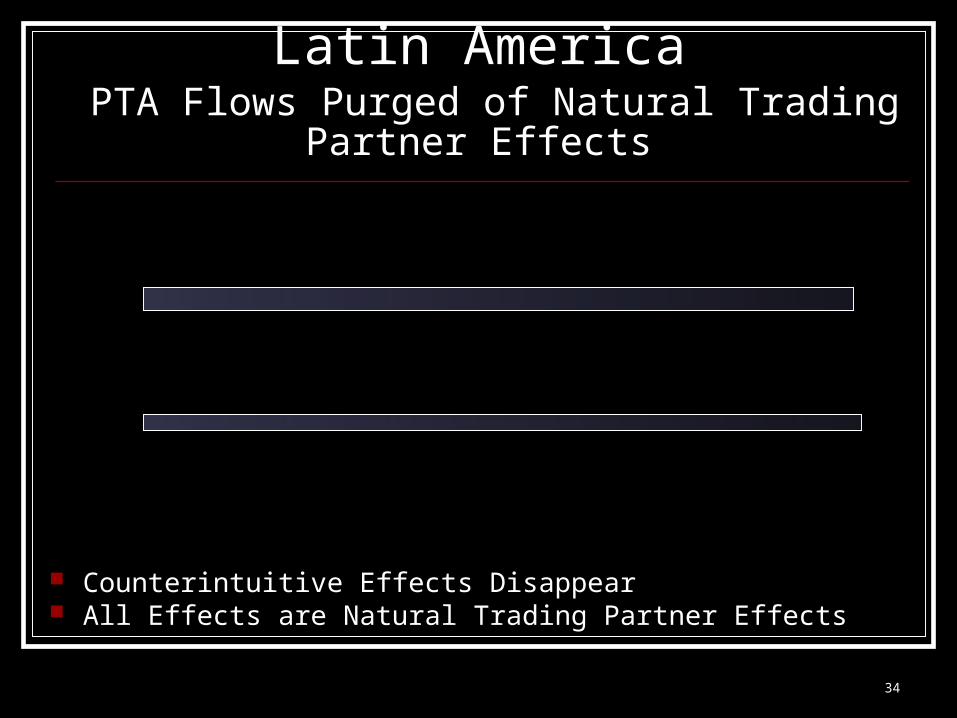
Time Fixed Effects Time & Country-Pair Fixed
Effects
Post. Incl.
Prob.
Post. Mean
Post. Std. Dev.
Post Mean in %
Post. Incl.
Prob.
Post. Mean
Post. Std. Dev.
Post Mean in %
Trade Creation APijt 0.01 -0.05 0.27 -5% 0.02 0.56 0.37 74% CACMijt 1.00 2.25*** 0.23 848% 0% CARICOMijt 1.00 2.08*** 0.41 702% 0.00 0.12 0.71 13% LAIAijt 0.91 0.46*** 0.13 58% 0%
MERCOSURijt 0.12 1.66 0.70 424% 0.00 0.37 0.51 45% Trade Diversion, Open Bloc APit 0.52 -0.19* 0.06 -17% 0.03 -0.17 0.10 -15% CACMit 0.85 -0.18** 0.05 -17% 0% CARICOMit 1.00 -0.74*** 0.07 -52% 0.39 -0.29 0.11 -25% LAIAit 1.00 -0.40*** 0.07 -33% 0%
MERCOSURit 0.79 0.42** 0.12 52% 0.01 0.11 0.09 11%
Latin America PTA Flows Purged of Natural Trading Partner Effects
Counterintuitive Effects Disappear All Effects are Natural Trading Partner Effects

35
Pacific Rim PTA Flows Purged of Natural Trading Partner Effects
Time Fixed Effects Time & Country-Pair Fixed
Effects
Post. Incl.
Prob.
Post. Mean
Post. Std. Dev.
Post Mean in %
Post. Incl.
Prob.
Post. Mean
Post. Std. Dev.
Post Mean in %
Trade Creation AFTAijt 0.00 -0.22 0.54 -20% 0.00 -0.22 0.39 -19% ANZCERTAijt 0.01 0.89 0.96 144% 0.00 0.30 0.92 35% APECijt 1.00 1.48*** 0.15 338% 0.01 0.14 0.12 16% NAFTAijt 0.01 -0.89 0.84 -59% 0.00 0.60 0.65 81% Trade Diversion, Open Bloc AFTAit 0.03 0.17 0.11 19% 1.00 0.40*** 0.08 49% ANZCERTAit 1.00 -0.47*** 0.10 -37% 0.10 -0.18 0.09 -17% APECit 1.00 0.55*** 0.06 73% 1.00 0.23*** 0.05 26%
NAFTAit 1.00 -0.63*** 0.10 -47% 0.99 -0.31*** 0.08 -26%
Counter Intuitive APEC Trade Creation vanishesAFTA and APEC Trade Creation confirmed
NAFTA Trade Creation is maintained but smaller
!

36
Pacific Rim PTA Flows Purged of Natural Trading Partner Effects
NAFTA 26% trade diversion?

37
Trade Creation/Diversion Importance of Comprehensive Approach
Most PTA Studies estimate Trade Creation for one/a few PTAs Marginal Effects (too diverse to average) vs Global Effects
Most studies don’t distinguish Trade Creation/Open Block
Example1: Two countries are in two different PTAs: what matters for trade flows is the Open Block effect / Trade Diversion of BOTH PTAs (70 countries, most high income countries are in PTAs)
Example2: All countries (PTA or not) get open block effects from all other PTA’s. So: pairwise trade diversion may turn into multilateral trade creation!

38
Trade Creation/Diversion
Most PTA interactions are Trade Creating EVEN NAFTA trade can be trade creating with Nafta non members
NAFTA/APEC ANZCERTA/APEC AFTA/APEC APEC EU EFTA
NAFTA 0%
ANZCERTA -26% 0%
AFTA 10%
=((1+49%)*(1-26%))-1 49% 0%
Rest of APEC -26% 0% 49% 0%
EU -7%
=((1+26%)*(1-26%))-1 0%
87%
=((1+26%)*(1+49%))-1 26% 93%
EFTA 20%
=((1+29%)*(1+26%)* (1-26%))-1
63%
=((1+26%)*(1+29%))-1
142%
=((1+26%)* (1+49%)*(1+29%))-1
63%
=((1+26%)*(1+29%))-1 29% 0%
Rest of the World -7%
=((1+26%)*(1-26%))-1 26%
87%
=((1+26%)*(1+49%))-1 26% 0% 29%

39
Conclusions 1) Address Model Uncertainty:
obtain correct PTA’s effects: PTA’s do matter (!) 2) Purge Natural Trading Partner contamination.
Eliminate Counterintuitive Results (!) Isolate actual PTA effects: (most PTA effects
smaller) 3) Comprehensive Approach
Identifies crucial interactions that can overcome “false trade diversion” (US / ASIA)
Overwhelmingly, PTAs are stepping stones to freer trade