Accounting for Business Income in Measuring Top Income ...wk2110/bin/InequalityConsolidated.pdf ·...
41
Accounting for Business Income in Measuring Top Income Shares: Integrated Accrual Approach Using Individual and Firm Data from Norway 1 Annette Alstadsæter, Martin Jacob, Wojciech Kopczuk 2 and Kjetil Telle NMBU, WHU, Columbia University and Statistics Norway June 28, 2017 1 We benefited from comments from Rolf Aaberge, Alan Auerbach, Richard Burkhauser, Patrick Driessen, Roger Gordon, Agnar Sandmo, David Seim, Joel Slemrod, Jan Södersten, and Thor Olav Thoresen, as well as from seminar participants at the Institut d’Economia de Barcelona Workshop on Taxation, Conference on Taxation, Household Behavior, and the Distribution of Incomes and Wealth in Berlin, Workshop on Individual and Small Business Taxation in Warsaw, ETI workshop in Mannheim, Skatteforum in Bergen, LMU Munich, and at WHU and Statistics Norway. Financial support from the Research Council of Norway, grant 239225/H20 is gratefully acknowledged. 2 Corresponding author: [email protected]
Transcript of Accounting for Business Income in Measuring Top Income ...wk2110/bin/InequalityConsolidated.pdf ·...
Accounting for Business Income in Measuring Top Income Shares:
Integrated Accrual Approach Using Individual and Firm Data
from Norway1
Annette Alstadsæter, Martin Jacob, Wojciech Kopczuk2 and Kjetil Telle
NMBU, WHU, Columbia University and Statistics Norway
June 28, 2017
1We benefited from comments from Rolf Aaberge, Alan Auerbach, Richard Burkhauser, Patrick Driessen,
Roger Gordon, Agnar Sandmo, David Seim, Joel Slemrod, Jan Södersten, and Thor Olav Thoresen, as well
as from seminar participants at the Institut d’Economia de Barcelona Workshop on Taxation, Conference
on Taxation, Household Behavior, and the Distribution of Incomes and Wealth in Berlin, Workshop on
Individual and Small Business Taxation in Warsaw, ETI workshop in Mannheim, Skatteforum in Bergen,
LMU Munich, and at WHU and Statistics Norway. Financial support from the Research Council of Norway,
grant 239225/H20 is gratefully acknowledged.2Corresponding author: [email protected]
Abstract
Using linked individual and firm data from Norway, we attribute business income to owners at
accrual rather than realization. The effect on measured top income shares varies dramatically
depending on the tax regime. After the 2005 tax reform that incentivized retention of earnings
within businesses, top 0.1% share more than doubles in some years. Adjusting for retained earnings
stabilizes the composition of the top income groups. On the other hand, an alternative approach of
imputing retained earnings based on realized dividends performs poorly. These effects are driven
by majority owners in closely held firms and facilitated through indirect ownership. We discuss
implications of our findings for levels and trends in top income shares observed in other countries.
1 Introduction
Studies of income inequality and, especially, studies of top income shares routinely rely on admin-
istrative tax data (for example Piketty, 2003; Piketty and Saez, 2003; Atkinson, Piketty and Saez,
2011; Aaberge and Atkinson, 2010). This is usually the only type of information that can provide
detailed coverage of the very top of the distribution — the crucial advantage given indications that
high incomes have been growing more rapidly than the rest of the distribution in many countries.
Naturally though, administrative tax data sources reflect the design of the tax system by including
only information that is collected by tax authorities. Furthermore, such data are also affected
by reporting behavior of taxpayers. As the result, reliance on administrative data influences the
concept of income that researchers can measure and may result in non-comparability over time as
incentives change. In this paper, we focus on perhaps the most important threat to comparability
across tax regimes: observability of income related to business activity. Using data from Norway,
we demonstrate the enormous sensitivity of measures of top shares derived from administrative in-
dividual income tax data to changes in the tax regime. Constructively, we implement an alternative
accrual-based approach of accounting for business incomes, which is less sensitive to tax incentives
in place. In the Norwegian case, this adjustment affects both the level and the observed direction
of changes in measured inequality.
In developed countries business income is generally taxed in one of two main ways.1 One form
of taxation of business income is based on the pass-through concept: income of a firm is allocated
to its owners and reported on individual income tax returns. This is the usual treatment of self-
employed individuals and partnerships without limited liability. In some countries, the pass-through
approach also applies to some firms with limited liability. Most notably, in the United States this is
the approach that is applied to S-corporations and limited liability partnerships.2 The alternative
form of taxation of business income involves entity level taxation of firm profits using corporate
taxation and, subsequently and separately, taxation of dividends or capital gains on the individual
level at the time of payout or capital gains realization. Usually, even with administrative data,
researchers cannot directly assign corporate profits to shareholders so that allocating income to
owners in a way comparable to the pass-through approach is in practice not possible. Since capital1Some countries also have (usually optional) alternative forms of taxation of certain types of small businesses that
are based on revenue or other characteristics of a firm (“presumptive taxation”).2See Clarke and Kopczuk (2016a) for a discussion of changes in the structure of business taxation in the United
States over time, and Cooper et al. (2015) for in depth evidence on the structure and importance of partnerships inthe United States.
1
gains and dividends are taxable on the individual level, they are usually observable and the only
feasible way of allocating corporate income to owners. We will refer to this dominant approach to
measuring income as “realization approach.”
As the result, in the applied work business income is usually captured through dividends and
capital gains, but this involves many conceptual difficulties for the purpose of inequality measure-
ment. First, dividends and capital gains are observed when paid or realized, which is, in general,
at a different point in time than when profits accrue.3 Hence, income derived from immediately
taxable sources such as wages, interest or pass-through entities and income derived from (non-
pass-through) corporate tax base, are in general observed at different points in time — potentially
resulting in different patterns over time. Second, realization of income influences ranking of indi-
viduals in any particular year and hence interacts with measurement of inequality. For example, it
is well-known that capital gains tend to be realized in a lumpy manner (for example, corresponding
to sales of businesses or life events that result in portfolio changes) and hence individuals move tem-
porarily up the distribution in the year when capital gains are realized without substantial changes
in their underlying economic position.4 Third, some of the corporate income may never show up on
individual tax returns. Gains that are followed by subsequent losses would correspond to positive
and then negative income under a pass-through approach, while only the net amount shows up
under a (non-pass-through) realization approach.5 Unrealized capital gains held until death may
not be taxed at all (step-up approach in place in the United States and Norway) or be taxed as
beneficiaries’ income (carry-over basis).6 Fourth, tax incentives influence realization decisions and
the choice of organizational form (e.g., Gordon and MacKie-Mason, 1994; Gordon and Slemrod,
2000; Romanov, 2006). Hence, changes in tax incentives can potentially affect measurement of
inequality by modifying the mix of realization and accrual sources of income that researchers rely3This also naturally generates deferral tax incentives that affect the timing of realizations. Some theoretical
solutions for addressing this issue within a realization-based system have been proposed (Auerbach, 1991; Auerbachand Bradford, 2004) but have not been tried in practice.
4In particular, there is substantial churning among the top income taxpayers. For example, among 4474 taxpayerswho were among 400 returns with highest adjusted gross income in the United States in one of the years between1992 and 2013, 3213 were on the list just once and only 129 were on the list for 10 years or more (Internal RevenueService, 2015).
5Relatedly, corporate spending that benefits owners (see Alstadsæter, Kopczuk and Telle, 2014, for indications ofsuch behavior) would also lead to realized income understating the underlying economic income of owners. However,such spending corresponds to mis-measurement of corporate income as well by inflating costs, so this is not necessarilyaddressed by our approach (although, it may be reflected to some extent if temporal patterns of profits and inflatedcosts are not perfectly aligned).
6It has been the leading alternative proposal in the United States (it was enacted but never implemented andultimately repealed in the late 1970s, and then briefly in effect during the 2010 “repeal” of the estate tax). Analternative is “constructive realization” that is used in Canada — under that approach, capital gains are deemedrealized at the time of death of the taxpayer and show up as a single lump-sum income realization at that time.
2
on.
In this paper, we use data from Norway to illustrate implications and importance of these
issues. We take advantage of the existence of a shareholder register that allows us to connect
information for all corporations to individual tax returns for all adult residents of Norway, and
construct comprehensive measures of income that include both individual and corporate incomes.
In particular, we allocate corporate earnings to shareholders as they are earned and retained.7 The
period that we study includes reforms that changed tax treatment of capital gains and dividends
and organizational form incentives.8 Two prior papers were able to directly allocate profits to
shareholders in Canada (Wolfson et al., 2016) and in Chile (Fairfield and Jorratt De Luis, 2016)
and document implications for the level of inequality and effective tax rates. We do so as well, but
crucially the tax reform in the middle of our sample period allows us to demonstrate sensitivity to
changing tax regime and characterize compositional shifts that are behind the effects on inequality.
As the result, we can show — what believe is an important point — not just that the level of
inequality is mis-measured but also that the trend over time is affected and that the impact persists
for at least eight years after the reform with no evidence of abating even with capital gains (delayed
realizations) accounted for. Additionally, we can show that a simple imputation approach of relying
on dividends to impute corresponding profits performs poorly as a way of addressing these issues.
Our main results for Norway are illustrated in Figures 1 and 2. Relying on individual income
tax reports only and excluding capital gains (the red line), as is commonly done in the literature,
implies that the top 1% share (Figure 1) is growing before 2005, spikes up in that year to almost
14%, only to drop in 2006 to under 7% where it stays until the end of the decade, and in the latter
period it is similar to the income measure (blue line) that excludes dividends altogether. This
corresponds to massive dividend payouts in 2005 (and to some extent even before) in response to
the announced tax reform (Alstadsæter and Fjærli, 2009). Under our integrated accrual approach
where we allocate corporate income to shareholders (in black), the top 1% share is larger — 8 to
17% — and with a stronger cyclical component and a different temporal pattern. In particular, the7Three earlier papers adjust individual income for unallocated corporate profits in Norway. Fjærli and Aaberge
(1999) study the development in income inequality in Norway after a tax reform in 1992, Aaberge and Atkinson(2010) study top-income shares all the way back to 1875, and Thoresen et al. (2012) study redistributive impacts ofthe 2005 tax reform. Related to shareholder income, Fjærli and Aaberge (1999) and Aaberge and Atkinson (2010)replace observed dividends with imputed total returns to shares, where returns to shares are based on an estimatedmarked value of the household’s stocks multiplied by a common long-run average rate of return on the NorwegianStock Exchange; and Thoresen et al. (2012) replace owners’ dividends and net capital gains with the proportion ofthe directly owned firms’ after-tax income.
8The reform modified incentives to choose different organizational forms for firms and promoted indirect ownershipthat allows for more flexibility in taxation of dividends and capital gains on the individual level (see Alstadsæter,Kopczuk and Telle, 2012, for discussion of these changes).
3
correction for corporate income has very little effect on the share of the top group before 2005, when
exemption of dividends from taxation allowed for free pass-through of available corporate income.
After 2005, however, the dividend tax provided strong incentives to retain earnings in the firm,
introducing a substantial difference between individual income measured under the traditional
realization approach and under our integrated accrual approach.9,10 Figure 2 shows that these
effects are even bigger for the top 0.1% group. In neither of the cases, capital gains make much of
a difference.11
The reader may wonder why would retained earnings increase already in 2005. This is because
dividends are legally restricted not to exceed the accumulated retained earnings in the publicly
available balance sheet of the previous year. As the result, it limits the ability to pay out profits as
dividends in the same year when they are earned, so that a portion of high (for cyclical reasons) 2005
profits effectively could not be distributed in the preferential tax regime. We show in Appendix B
that firms very aggressively attempted to maximize dividend payouts in 2005, but due to legal
constraints dividends still fell short of accounting for all profits in that year.
We also are interested in understanding what types of businesses are important for these changes.
While it is tempting to think here of large publicly traded firms, we show that these large changes
in inequality are accounted for by the behavior of closely held firms with relatively few owners
and, correspondingly, by major shareholders in such firms. We also document that most of the
post-2005 increase in retained earnings at the top happens through firms that are not owned
directly, illustrating that allocating business profits to individuals critically requires the ability
to see through multiple layers of ownership.12 Finally, we also show that our preferred measure
stabilizes the composition of the top group so that the reform itself does not have a major impact
on the identity of individuals in the top income group.9Moreover, under our integrated accrual approach, the top income share is largely of similar magnitude over the
whole period (both before and after 2005), suggesting that the approach is more robust to the tax regime in place.However, the figures also suggest that allocating corporate profits as they accrue actually induces top shares to bemore volatile.
10There are two main limitations of our integrated accrual approach. First, there may still be re-timing of corporateprofits, and a non-announced tax exemption on corporate capital gains from mid 2004 may thus contribute toexplaining some of the high dividends and retained earnings in 2005. Such re-timing is a potential issue for pass-through entities as well. Second, capital gain may reflect expectations of future profits before they accrue so thatallocation based on capital gains realization amounts to accounting for profits early and (potentially) to a differentparty than under the corporate profits based accrual approach. However, as seen in Figures 1 and 2, capital gainsin Norway were quite small during the period we consider, so that the way of accounting for capital gains does nothave large quantitative implications.
11Capital gains in Norway have not been generally preferentially treated relative to other types of income. Before2006, they were taxed at ordinary rates. After 2006, they are taxed in the same way as dividends.
12See Cooper et al. (2015) for evidence that it is also the case in the United States.
4
While we use Norwegian data, we believe the main points apply broadly. To illustrate, Figure 3
shows top income shares in the United States (Piketty and Saez, 2003). Until 1986, there were
strong tax incentives to be organized as a C-corporation — effectively, the equivalent approach
to the dominant current organizational form in Norway. Hence, inequality in the United States
until 1986 was measured in a way that was comparable to the uncorrected Norwegian data. In
particular, given high top personal income tax rates that applied to dividend income, there were
strong incentives against explicitly paying out dividends and toward alternative uses of fund such
as retaining earnings, similarly as in Norway after 2005. Reduction of personal income tax rates
introduced by the Tax Reform Act of 1986 led to a massive conversion from C- to S-corporate form,
the latter being subject to the pass-through treatment (Auerbach and Slemrod, 1997; Gordon and
Slemrod, 2000) and, since then, there has been a strong trend toward establishing new firms as
pass-through entities (either S-corporations or, more recently, limited liability partnerships; see
Clarke and Kopczuk, 2016a for a description of these trends). Hence, after 1986, reporting of
income in the United States is effectively closer to our corrected approach.
Focusing on the series that excludes capital gains, the striking feature of the overall trend in the
United States is that the top income shares jumped dramatically from 1986 to 1988. To be more
precise: measured income share of the top 1% jumped between 1986 and 1988 by 4.1 percentage
points about equal to the whole change between 1988 and 2010 (4.2 percentage points).13 A non-
trivial part of the 1986 jump is believed to reflect shifting between income and corporate base (Saez,
Slemrod and Giertz, 2012). Our Norwegian results indicate that this jump is likely to correspond
to a permanent difference in how top income shares are measured under a realization based (C-13Mindful of this one-time jump, Piketty and Saez (2003) point to the series that includes capital gains as corrob-
orating evidence of a secular growth in inequality. However, we will show that at least in the Norwegian case, thereis little correspondence between realized capital gains and accrual income. As Figure 3 demonstrates, the growthin the importance of capital gains at the top in the United States begins in 1979, after top capital gains tax ratereduction from almost 40% to 28%. The importance of capital gains appears to be reinforced after 1982, followingthe Economic Recovery Tax Act of 1981 that reduced the capital gains tax rate from 28% to 20% and exhibits verystrong reaction to the Tax Reform Act 1986 that brought rates back to 28%. Together, this suggests that realizationincentives played an important role (see Lindsey, 1987; Feldstein, 1995, for evidence of reported income responseto the 1980s reforms that accounts for capital gains). Hence, the evolution of capital gains over the late 1970s and1980s is consistent with changing incentives to realize, and thus need not reflect a secular trend. The contribution ofcapital gains to the top income shares in Figure 3 shows that the early 1980s — the period of changing incentives— is only comparable to the period of very strong stock market dynamics in the late 1990s and mid-2000s. The roleof capital gains during this era again highlights that the approach to allocating corporate profits to individuals isbound to matter. A more compelling alternative to realized capital gains is to use accrued capital gains. Armour,Burkhauser and Larrimore (2014) study implications of imputing accrual for the evolution of inequality in the UnitedStates since 1989 and Burkhauser, Hahn and Wilkins (2015) do so for Australia. Figure 3 also shows a measure ofthe aggregate retained earnings — income net of deductions and dividends — of the United States corporate sector(other than S-corporations). It is clear that capital gains at the top of the distribution do not co-move with thisaccrual measure of non-realized corporate income. While not all of corporate retained earnings belong at the top ofthe distribution, their magnitude is large relative to changes in top income shares.
5
corporations) and an accrual based (S-corporations and partnerships) system, so that the level of
inequality before 1987 is likely to be understated relative to that afterwards.14 We show that the
approach relied on in a recent paper by Piketty, Saez and Zucman (2016) to address this issue by
imputing retained earnings using dividends continues to severely underestimate inequality when
retained earnings are large. The rationale for that is simple to understand once one realizes that
ceteris paribus within a firm retained earnings and dividends move in the opposite directions, so
that those who choose to realize dividends have low rather than high retained earnings.
The rest of the paper is organized as follows. In the next section we describe the Norwegian tax
system and provide details of the data. In section 3, we discuss different approaches to measuring
incomes, their use in the literature, and our ability to implement them. We then present our results
in Section 4. The final section concludes by comparing the results to an alternative imputation
method and drawing implications for other countries.
2 Background and Data
2.1 The Norwegian tax system and the 2006 reform
The Norwegian dual income tax system levied a proportional tax of 28% on all income, both on
individual level and corporate level, and an additional progressive surtax on individuals’ wage
income. Net capital gains were also included in taxable income until 2006, but dividends were tax-
exempt in the same period.15 To protect creditors from owners excessively extracting assets from
the corporation, the dividends that could be paid in a calendar year was restricted, among other
things, by the accumulated retained earnings in the (publicly available) balance sheet of the previous
calendar year — implying that profits accruing within a calendar year could not be distributed
before the next calendar year (this restriction was largely lifted in 2013). The shareholder income
tax was introduced on January 1, 2006, and levies capital income tax on all personal shareholders’
return to shares, both dividends and capital gains, exceeding the after-tax risk-free interest rate.16
14Furthermore, because the shift toward pass-through treatment continued after 1986 as new firms were increasinglyestablished to benefit from lower personal income tax rates, this raises the possibility that part of the post-1986increase further reflects that more of the corporate income is passed-through and measured in the individual taxreports. See Auten and Splinter (2016) and Clarke and Kopczuk (2016b) for recent attempts to systematically adjustthe top income shares in the US for corporate retained earnings.
15In order to prevent tax minimizing income shifting by re-labeling wage income as capital income in owner-managedfirms, the so-called Split model (abolished 2005 for corporations) imputed a return to the capital in the firm, whichwas taxed as dividend income. The remainder was taxed as wage income.
16A so-called rate of return allowance (RRA), is tax exempt (but observable as dividends when utilized), and it iscalculated as the price of the share (face value if not traded) times the after-tax interest rate on government bonds.
6
Dividends paid to corporations as well as corporations’ capital gains from realization of shares
are tax exempt.17 This means that by holding shares through a holding company, a person may
defer capital gains and dividend tax until income is distributed to the personal level. A special
regulation during 2005 actually allowed individuals to transfer their shares to a holding company,
without triggering capital gains taxes that would otherwise apply. As documented by Alstadsæter,
Kopczuk and Telle (2012), more than 8% of Norwegian shareholders transferred their shares to new
holding companies during the last months of 2005. In addition, the tax-preferred way to organize a
new corporation after 2006 is to establish indirect ownership structure with the main corporation
responsible for the economic activity and a holding company that owns the individual owner’s
shares of the main corporation. Such ownership allows for both deferral of recognizing dividends
and capital gains on the individual level, while permitting flexibility to disburse dividends and make
changes to ownership of the main firm. We account for this in our empirical analysis by seeing
through multiple layers of indirect ownership when distributing firm level earnings to the personal
owner.
The 2006 dividend tax reform was already announced in late 2004 and led to widespread timing
effects in dividend payments as documented by Alstadsæter and Fjærli (2009), Thoresen et al.
(2012), and Alstadsæter, Kopczuk and Telle (2014). Figure 4 illustrates that there was a strong
timing effects in dividend payments to individual owners around the reform, with large dividend
receipts in the years leading up to the reform and very low in the years after. It also illustrates
that dividends paid to individual owners are much smaller than dividends that are distributed by
firms. Overall distributions actually do not plummet after 2005 (or at least not permanently): firms
still pay out substantial dividends after the reform, but they do so to non-individual owners such
as holding companies and institutional owners rather than to ultimate owners (who are personal
income tax payers).18
2.2 Data
We use very detailed administrative data from Statistics Norway covering the universe of Nor-
wegian corporations, self-employed, and adult individuals (aged 16 and above) over the period
If received dividends/gains are less than the RRA, the remaining is carried forward with interest and added to theimputed RRA in the following year.
17Also, corporations no longer get tax deduction for capital losses from shares. In order to prevent large behavioraleffects in timing of the realization of gains/losses by corporations, this tax exemption of capital gains was implementedwithout warning on March 26, 2004.
18The dip in dividend receipts by households in 2001 is due to a temporary dividend tax that was in place for thatone year.
7
2000-2013. Every resident in Norway is assigned a unique personal identifier that is present in all
databases, enabling us to follow every individual over time and across datasets. The same holds
for corporations. Our data further contain detailed income information from compulsory annual
tax reports for individuals and self-employed firms (covering calendar year). Corporate level data
contain income tax statements, as well as information about taxes paid and detailed balance sheet
information with asset and debt structure. We also have data on the identity of every shareholder
of every Norwegian corporation, both private and public, both widely and closely held, and we
know everyone’s exact ownership shares in each corporation at the end of the calendar year. See
Appendix A for further details.
3 Income Concepts
The standard Haig-Simons approach to personal income is to define it as the sum of a person’s
consumption and the increase in his/her consumption opportunities over a time period. Some
elements of consumption and consumption opportunities are inherently difficult or even impossible
to measure, so that applied work typically relies on an equivalence of the change in ability to
consume and the sum of labor income and the change in net wealth over a calendar year (Simons,
1938). This is often operationalized as the sum of earnings (return to labor) and return on assets.
However, income from business remains a prominent example of an income flow that is difficult to
measure adequately and timely in available data, especially under the common realization-based
tax regime.19 It is also a prominent example of an income flow that blurs the line between capital
and labor income — the distinction that needs not to be made when the conceptual approach is
based on the Haig-Simons definition, which is an important empirical advantage of this approach.
The advantage of our approach is that we can allocate business income on a timely basis. To
do so, we allocate corporate level income to each personal shareholder according to his/her total
ownership share in the corporation in the year when the corporate income is earned. The total
ownership share is the sum of direct and indirect ownership shares. The indirect ownership is
calculated as the product of the shareholder’s direct ownership share in firm A and firm A’s total
direct and indirect ownership share in firm B. In the simple case of two layers illustrated in the
picture,19Another wealth-related income flow that is hard to measure, is consumption of housing. Unless realized in
the calendar year (and not reinvested in the same year) and thus captured as capital gain (see below), we are notmeasuring this in our data. But net income flow from renting of real estate that is not the home, will typically bemeasured.
8
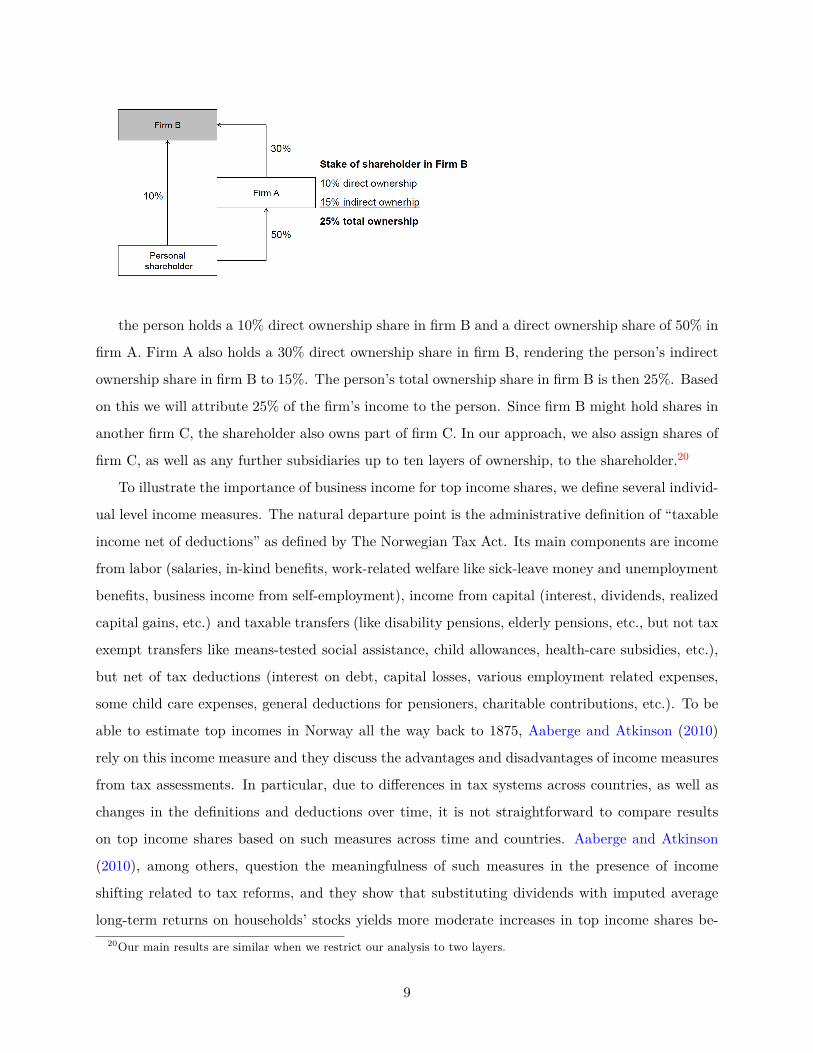
the person holds a 10% direct ownership share in firm B and a direct ownership share of 50% in
firm A. Firm A also holds a 30% direct ownership share in firm B, rendering the person’s indirect
ownership share in firm B to 15%. The person’s total ownership share in firm B is then 25%. Based
on this we will attribute 25% of the firm’s income to the person. Since firm B might hold shares in
another firm C, the shareholder also owns part of firm C. In our approach, we also assign shares of
firm C, as well as any further subsidiaries up to ten layers of ownership, to the shareholder.20
To illustrate the importance of business income for top income shares, we define several individ-
ual level income measures. The natural departure point is the administrative definition of “taxable
income net of deductions” as defined by The Norwegian Tax Act. Its main components are income
from labor (salaries, in-kind benefits, work-related welfare like sick-leave money and unemployment
benefits, business income from self-employment), income from capital (interest, dividends, realized
capital gains, etc.) and taxable transfers (like disability pensions, elderly pensions, etc., but not tax
exempt transfers like means-tested social assistance, child allowances, health-care subsidies, etc.),
but net of tax deductions (interest on debt, capital losses, various employment related expenses,
some child care expenses, general deductions for pensioners, charitable contributions, etc.). To be
able to estimate top incomes in Norway all the way back to 1875, Aaberge and Atkinson (2010)
rely on this income measure and they discuss the advantages and disadvantages of income measures
from tax assessments. In particular, due to differences in tax systems across countries, as well as
changes in the definitions and deductions over time, it is not straightforward to compare results
on top income shares based on such measures across time and countries. Aaberge and Atkinson
(2010), among others, question the meaningfulness of such measures in the presence of income
shifting related to tax reforms, and they show that substituting dividends with imputed average
long-term returns on households’ stocks yields more moderate increases in top income shares be-20Our main results are similar when we restrict our analysis to two layers.
9
tween 1986-2005; and, similarly, Thoresen et al. (2012) also find that income inequality increases
more moderately when dividends and capital gains are replaced by profits of directly owned firms.
To pursue systematic analysis, we rely on a number of alternative measures that single out specific
income components and disallow transfers and deductions.21 The four definitions are as follows:
1. ICGB = Income from labor (including self-employment) + income from capital (including div-
idends and capital gains)
2. IB= ICGB – capital gains
3. IC= IB – dividends
4. ID= IC + individual’s share (s) of corporate income (π)
We proceed as follows to capture the individual’s share of corporate income. Denote a corporation’s
profits in a given year t by πt and an individual’s (combined direct and indirect) share of those
profits by s. We are going to focus on after corporate-tax profits. We would like to assign sπt
to an individual as income. In the case of a pass-through approach, like for self-employed or
for partnerships or S-corporations in the United States, this is exactly what is going to happen
by default. When the business-source income is not subject to the pass-through treatment, a
corporation may pay a dividend of dt (and an individual’s share of it is sdt). Assuming for the
moment a direct ownership of the firm, an approach that relies on income realization (ICGB ) will
account for income of sdt in year t and will reflect (at least to some extent and augmented by
return) the remainder of year t profits sπt − sdt if and when additional dividends are paid in the
future or when capital gains are realized. Note in particular that the level of dividend in year t
does not have to bear any direct relationship to profits in that particular year: it purely reflects
realization decisions, and dividends in any particular year may reflect current profits, past profits
or (within some legal limitations) future expected profits.
Conceptually, we would like to allocate sπt directly to the individual. We do observe profits so
this would be a straightforward task in case of direct ownership. However, since individuals could
own firms through other firms, we need to ensure that we do not count the same profits more than
one time. For example, if a firm B pays dividend to its corporate owner firm A, this dividend
will comprise a part of firm A’s profits (which will again contribute to the change in firm A’s21Consequently, we will also rely on before tax individual income measures. See Appendix A for details on our
income measure.
10
accumulated retained earnings). To handle this, we rely on the (Norwegian) accounting concept of
“earned equity”, which we will refer to as accumulated retained earnings. The accumulated stock
of retained earnings in year t, Rt, is equal to Rt = Rt−1 + πt − dt, i.e additional accumulation
reflects this year’s profits (or losses) with deduction for any dividends. Hence, the change in
accumulated retained earnings, ∆Rt = πt − dt, captures the income component that would have
been passed-through to the owning individual(s) in a pass-through regime (S-corporation or self-
employed). Aggregating changes in accumulated retained earnings across all firms corresponds
to aggregating profits net of dividends to non-corporate shareholders. As a result, the sum of
changes in accumulated retained earnings and dividends to non-corporate shareholders is equal
to the economic profits of the corporate sector. We proceed by implementing this approach: an
individual’s share of corporate profits is equal to his/her ownership share of the year’s change in
accumulated retained earnings (through direct and indirect ownership) and any dividends received
on the personal level.22
We also considered constructing an additional measure of income “IE= ID+ capital gains net of
previously allocated corporate income” that would partially account for capital gains while retaining
the virtues of accrual-based approach when possible. However, this measure cannot be constructed
unless accrued income over the whole holding period is observed. In practice, we can only observe it
for assets that were purchased during the coverage of our data. Given small quantitative importance
of capital gains for the top shares in Norway visible on Figures 1 and 2, we opted against pursuing
a, necessarily imperfect, implementation of this type of approach.23
22While this use of balance sheet information on accumulated corporate earnings handles the problem of doublecounting dividends to corporate owners, it involves some drawbacks. Norwegian corporate finance law prescribescorporate holding of listed shares to be valued at stock market prices and not at costs of acquisition in the balancesheet. As illustrated in the following, this implies that an increase in the value of holdings of listed shares might bedouble counted. Assume that a holding firm H, which is fully owned by a person P, holds s percent of the shares in alisted firm L. Further, assume that the listed firm L has profits of A during the year, and — to simplify — that theprofits are exactly reflected in the stock market value, i.e. that the value of L increases by A during the year. We willthen first count P’s share of the change in accumulated retained earnings of L (sA). However, because of the financelaw valuation prescription, the accumulated retained earnings of H will also increase by sA, implying that we countsA twice when calculating P’s corporate income. However, since retained earnings from large or listed companiesonly comprise a small fraction of total retained earnings of top incomes (see Figure 11 and related discussion at endof Section 4.2), the potential measurement error might not be large. Indeed, we created the top income share plotsexcluding accumulated retained earnings of listed firms, and the results are barely distinguishable by eye from thosein Figures 1 and 2.
23It is still useful to note though how capital gains might be accounted for in principle. Capital gains give rise to anadditional set of problems. The value of the firm Vt reflects expectations of future profits (let us denote discountedvalue of future profits as πE) and the market value of any marketable assetsMt such as cash or other tradeable assets(in particular, the value of non-tangibles is reflected in the future profit component and — to the extent that theymight be traded beyond its value of generating future profits — the remaining part should be included in Mt). Thecapital gain Vt+j − Vt = ∆πE,t+j
t + ∆M t+jt over holding period j > 0 represents the change in the value of these
two components. For non-publicly traded firms, we have no ability to observe changes in prices, and we can onlyobserve changes in ownership and capital gains at the time of realization, so that we cannot assign capital gains to
11
4 Results
Our main results, showing the income of the top 0.1 and 1% as a share of the total income (sum of the
same income measure for everyone aged 16 and above), are presented in Figures 1 and 2. In the post-
2005 tax regime, when incentives to pay dividends were weak and firms instead retained earnings
(as we will illustrate shortly), allocating corporate earnings to shareholders (accrual approach)
has dramatic impact on the level of top income shares, more than doubling them (relative to
realization-based approach) when one looks at the top 0.1% of the distribution. In contrast, the
effect of accounting for retained earnings is minor in the pre-2006 period (with the exception
of 2005 that already reflects the impact of the reform, as discussed below). Hence, our results
strongly suggest that the tax regime in place has a major effect on the inequality measures when
using realization-based information from personal income tax returns.
One unexpected feature of our results is that despite strong incentives to pay dividends in
2005 (in fact, they were at the all time high, Figure 4), we see that the retained earnings already
contributed to the top income share in that year. This is because the legal restrictions in the
Norwegian tax system imply that dividends generally can only reflect profits in prior years and
cannot be paid out of current profits.24 As the result, most of the 2005 profits were effectively
subject to the post-reform taxation on personal income tax returns. Aggregate profits were in
fact very high in 2005 (see Figure 7 and discussion below) and hence, as the result of the legal
restrictions, both dividends and retained earnings were major contributors to top shares in that
year. Nevertheless, we document in Appendix B that taxpayers were in fact aggressively maximizing
dividends paid out in 2005, subject to legal limits that they faced.
Our results also show that capital gains from individuals’ tax reports play a relatively minor role
individuals on an accrual basis. However, our approach to allocating corporate profits actually does account for partof the capital gain by allocating earnings as they accrue. If instead earnings were paid out as dividends at the time ofaccrual, the value of the firm would have been reduced and future capital gains would be lower. Naturally, the value offunds within and outside of the firm is not the same, but evaluating it is the question of use (similarly as consumptionor investment decisions of an individual) rather than income. Hence, our preferred approach to incorporating capitalgains would be to adjust them for earnings that have been already assigned to individuals over the holding period —effectively, adjusting capital gains for unpaid dividends so that the remaining component would reflect the increasein value of the firm beyond mechanical effect of past earnings. Under such an approach, actual realized capital gainsare very likely to be adjusted downward for individuals who are at the top of the distribution (upward adjustmentwould correspond to losses).
24To protect creditors from owners’ excessively extracting assets from the corporation, the dividends that could bepaid in a calendar year was legally restricted, primarily by the accumulated retained earnings in the publicly availablebalance sheet of the previous year. This means that in most cases corporations could not pay more dividends in2005 than what the balance sheet of 2004 allowed. Indeed, our data show that the share of corporations that did infact maximize dividends according to the limits following from the balance sheet of the previous year peaked at 73percent in 2005. In Appendix B, we discuss evidence on dividend maximization in more details and, in particular,Figure A.1 shows that it was widespread at the top percentile just before the reform.
12
in shaping measurement of top income shares in Norway.25 When included in the realization-based
measure of top income shares (ICGB ), they shift up both the top 0.1% and top 1% measures by
between 0.2 and 1.4 percentage points, with elevated values in 2000 and 2006-7, but otherwise with
no clear temporal pattern and no important qualitative effect on the overall evolution over the time.
In particular, whether or not they are accounted for makes little difference for the comparison of
the inequality patterns arising from the accrual- and realization-based approaches.
4.1 Relationship to aggregate changes
In order to understand these adjustments to inequality, it is useful to first illustrate the behavior
of aggregate series. Figure 5 shows that the Norwegian economy was generally growing during
this period although with more pronounced fluctuations when the very important oil sector is
included than when it is not. The 2003-2008 period was a rapid expansion followed by a short-
lived recession. The figure also shows the accumulated retained earnings aggregated over all the
corporations in our data set and Figure 6 shows it as a share of GDP. There are two important
points here. First, the stock of accumulated retained earnings grows rapidly after 2005, increasing
from about 50% to 80% of total GDP. Second, we deliberately contrast the stock of accumulated
retained earnings with GDP (flow). Accumulated retained earnings are unpaid dividends held in
the corporate sector that correspond to past earnings and their stock can in principle be converted
to the flow of dividends. They are massive relative to the overall income and hence the pattern
and changes in their realizations are bound to confuse realization-based inequality statistics, as is
evident in the contrast between realization-based income and accrual-based income in Figures 1
and 2.
It can also be confusing to use aggregate series of profits and dividends to try to reason on
inequality. Figure 7 shows three series: total after-tax profits, aggregate dividend payouts and
aggregate change in accumulated retained earnings. We construct these series by aggregating our
micro data. Total profits were volatile over the period and, in particular, they rapidly increased
between 2003 (pre-reform) and 2007 (post-reform). This effect partially reflects a booming economy.
Nevertheless, the profit series is in an important sense misleading. It reflects profits of all firms
including corporate owners; as the result, dividends to corporate owners effectively induce double-25Corporate capital gains in Norway have not been generally tax advantaged — they were taxed as ordinary
income before 2006 and at the same rate as dividends after the reform. As the result, the Norwegian shareholdersof privately held firms may simply realize dividends instead of pursuing strategies to convert them into capital gainsfor tax purposes. Another reason is that capital gains on privately owned and used real estate are tax exempt inNorway, and thus not captured in our data. This is not so in e.g. Sweden (Roine and Waldenström, 2012).
13
counting. Total dividend payouts fluctuate much less than profits and show no decline after 2005.
As we have already illustrated in Figure 4, total dividend payouts also correspond to massive
double-counting of income because of the importance of corporate dividends. The flow of retained
earnings is the main component of the difference between profits and dividends. The annual change
in aggregate accumulated retained earnings fluctuated much more than aggregate dividend payouts
over the period. It was small before 2006, generally increased afterwards but behaved in a volatile
fashion. In particular, it briefly fell close to the negative territory during the 2008 recession.
These aggregate patterns should be contrasted with the effect that accounting for the change
in accumulated retained earnings has on the top shares in Figures 1 and 2. The volatility of the
change in accumulated retained earnings does translate to some extent into volatility of top shares,
but the effect is not mechanical and it is quite subtle. In particular, in the post-reform period,
accounting for corporate profits has a massive effect on top shares throughout, even though the
change in aggregate accumulated retained earnings in some of the years (2008 and 2011) was very
small: the aggregate over the whole corporate sector masks substantial inequality across firms since
some firms have large losses while others are successful. In particular, it suggests that imputation
approaches based on allocating aggregate retained earnings or profits are unlikely to accurately
capture distribution unless heterogeneity in profitability can be accounted for. We will compare
our approach to an imputation approach in Section 5.
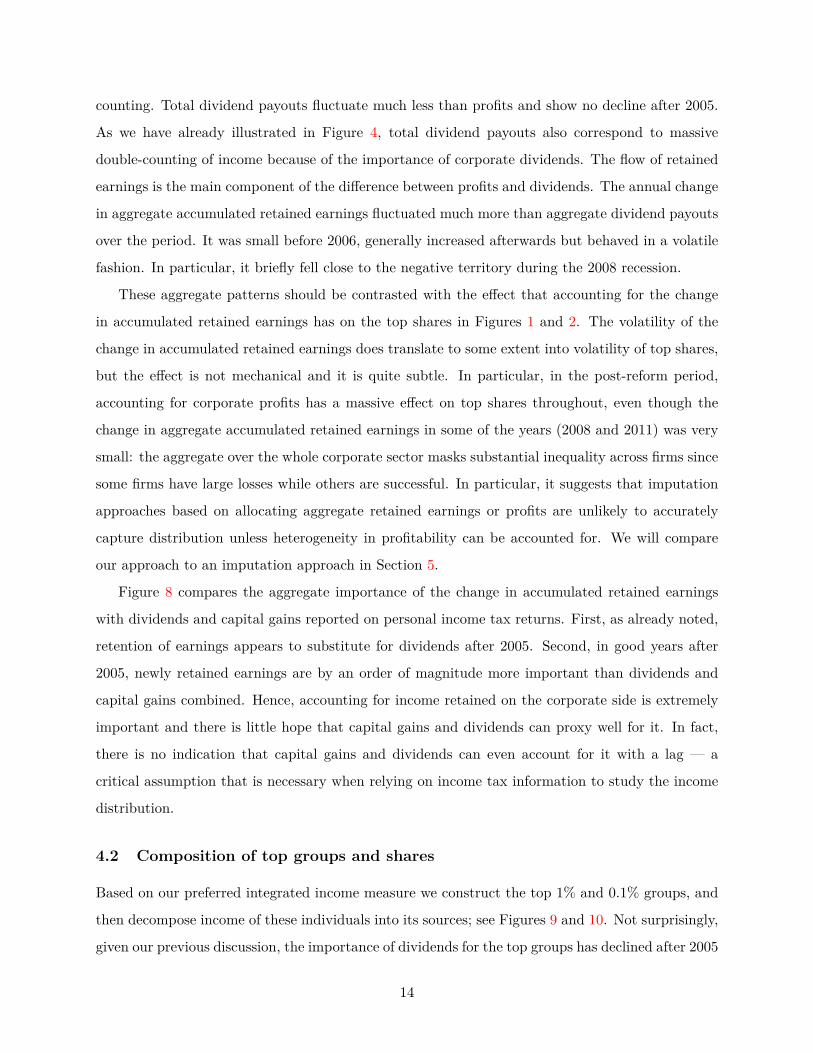
Figure 8 compares the aggregate importance of the change in accumulated retained earnings
with dividends and capital gains reported on personal income tax returns. First, as already noted,
retention of earnings appears to substitute for dividends after 2005. Second, in good years after
2005, newly retained earnings are by an order of magnitude more important than dividends and
capital gains combined. Hence, accounting for income retained on the corporate side is extremely
important and there is little hope that capital gains and dividends can proxy well for it. In fact,
there is no indication that capital gains and dividends can even account for it with a lag — a
critical assumption that is necessary when relying on income tax information to study the income
distribution.
4.2 Composition of top groups and shares
Based on our preferred integrated income measure we construct the top 1% and 0.1% groups, and
then decompose income of these individuals into its sources; see Figures 9 and 10. Not surprisingly,
given our previous discussion, the importance of dividends for the top groups has declined after 2005
14
and the importance of accumulated retained earnings increased — in fact, the relative importance of
realized and unrealized dividends has flipped. Supporting our approach to measuring income and its
usefulness in accounting for inequality patterns, the overall contribution of corporate income from all
sources (dividends and retained earnings) to the income share of the top groups has remained fairly
stable. In particular, smoothness of the combined share of corporate income provides no indication
that this integrated way of accounting for corporate source income might be systematically affected
by the tax regime in place.
It is also worth noting that dividends and the change in accumulated retained earnings are by
far the most important component of top income at the very top. For the top 0.1%, they generally
account for about 80% of top incomes, with wages accounting for at most 15%.
Figure 11 documents that the adjustment for retained earnings is driven by closely-held firms.
For each firm, we know both the retained earnings and the number of individual owners, and we
can thus separately attribute retained earnings from firms with up to 10 owners and more than 10
owners. Virtually all of the retained earnings that we allocate at the top of the distribution have
their source in firms with 10 or fewer owners. This result is consistent with Jacob, Michaely and
Alstadsæter (2015) who show that payout of firms held by few owners is more sensitive to changes
in dividend taxation than firms with dispersed ownership. Figure 12 further shows the bulk of
adjustment is attributable to owners that have large ownership share in their businesses.
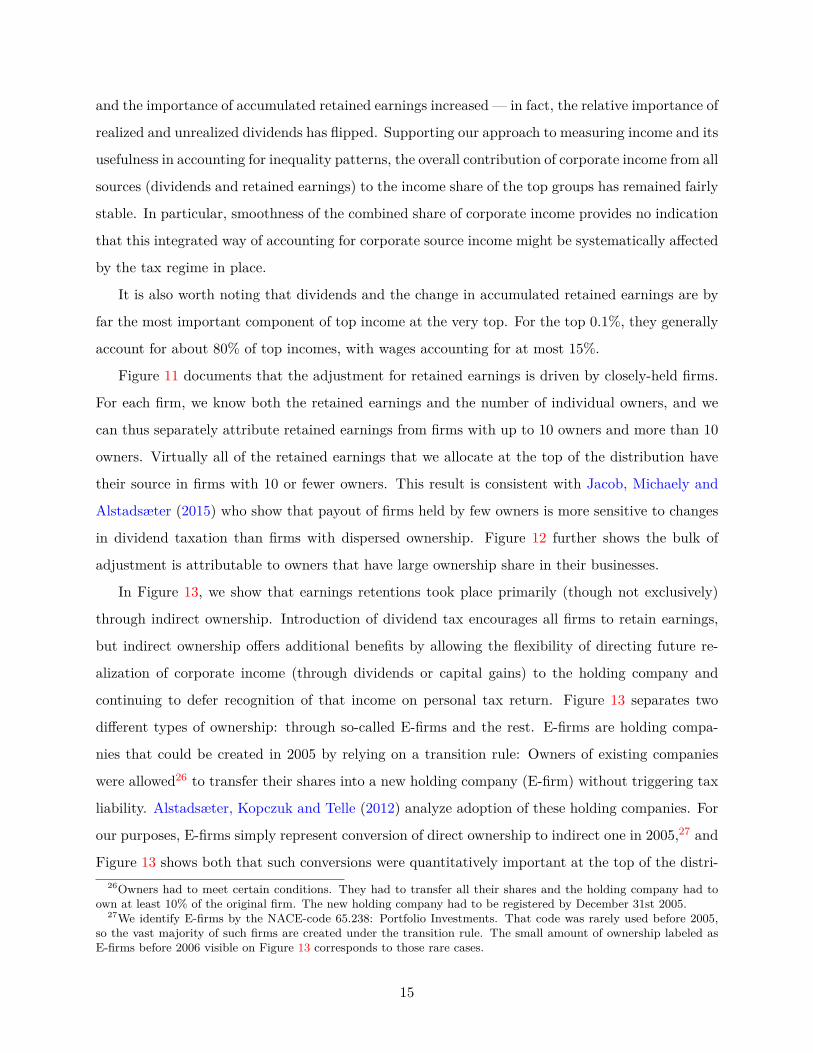
In Figure 13, we show that earnings retentions took place primarily (though not exclusively)
through indirect ownership. Introduction of dividend tax encourages all firms to retain earnings,
but indirect ownership offers additional benefits by allowing the flexibility of directing future re-
alization of corporate income (through dividends or capital gains) to the holding company and
continuing to defer recognition of that income on personal tax return. Figure 13 separates two
different types of ownership: through so-called E-firms and the rest. E-firms are holding compa-
nies that could be created in 2005 by relying on a transition rule: Owners of existing companies
were allowed26 to transfer their shares into a new holding company (E-firm) without triggering tax
liability. Alstadsæter, Kopczuk and Telle (2012) analyze adoption of these holding companies. For
our purposes, E-firms simply represent conversion of direct ownership to indirect one in 2005,27 and
Figure 13 shows both that such conversions were quantitatively important at the top of the distri-26Owners had to meet certain conditions. They had to transfer all their shares and the holding company had to
own at least 10% of the original firm. The new holding company had to be registered by December 31st 2005.27We identify E-firms by the NACE-code 65.238: Portfolio Investments. That code was rarely used before 2005,
so the vast majority of such firms are created under the transition rule. The small amount of ownership labeled asE-firms before 2006 visible on Figure 13 corresponds to those rare cases.
15
bution, and that they result in indirect ownership accounting for majority of business income of the
well-off. As the result, the ability to see through such indirect structure is critical for appropriately
allocating business income to the ultimate owners.
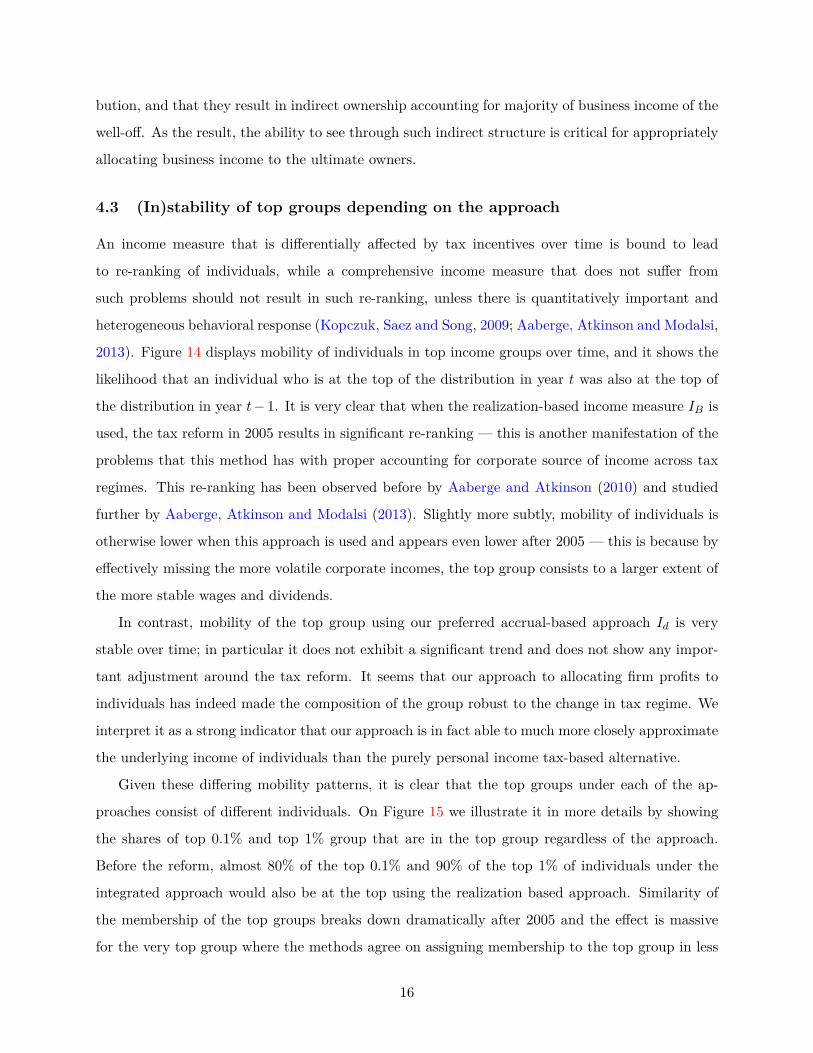
4.3 (In)stability of top groups depending on the approach
An income measure that is differentially affected by tax incentives over time is bound to lead
to re-ranking of individuals, while a comprehensive income measure that does not suffer from
such problems should not result in such re-ranking, unless there is quantitatively important and
heterogeneous behavioral response (Kopczuk, Saez and Song, 2009; Aaberge, Atkinson and Modalsi,
2013). Figure 14 displays mobility of individuals in top income groups over time, and it shows the
likelihood that an individual who is at the top of the distribution in year t was also at the top of
the distribution in year t− 1. It is very clear that when the realization-based income measure IB is
used, the tax reform in 2005 results in significant re-ranking — this is another manifestation of the
problems that this method has with proper accounting for corporate source of income across tax
regimes. This re-ranking has been observed before by Aaberge and Atkinson (2010) and studied
further by Aaberge, Atkinson and Modalsi (2013). Slightly more subtly, mobility of individuals is
otherwise lower when this approach is used and appears even lower after 2005 — this is because by
effectively missing the more volatile corporate incomes, the top group consists to a larger extent of
the more stable wages and dividends.
In contrast, mobility of the top group using our preferred accrual-based approach Id is very
stable over time; in particular it does not exhibit a significant trend and does not show any impor-
tant adjustment around the tax reform. It seems that our approach to allocating firm profits to
individuals has indeed made the composition of the group robust to the change in tax regime. We
interpret it as a strong indicator that our approach is in fact able to much more closely approximate
the underlying income of individuals than the purely personal income tax-based alternative.
Given these differing mobility patterns, it is clear that the top groups under each of the ap-
proaches consist of different individuals. On Figure 15 we illustrate it in more details by showing
the shares of top 0.1% and top 1% group that are in the top group regardless of the approach.
Before the reform, almost 80% of the top 0.1% and 90% of the top 1% of individuals under the
integrated approach would also be at the top using the realization based approach. Similarity of
the membership of the top groups breaks down dramatically after 2005 and the effect is massive
for the very top group where the methods agree on assigning membership to the top group in less
16
than 50% of cases.
Concluding, the integrated approach induces an important re-ranking of individuals at the top
of the distribution. By doing so, it stabilizes the measures of year-to-year mobility of the top
groups and corrects tax-reform driven swings in measurement of top income shares. Coupled with
the conceptual rationale for this approach that highlights consistent treatment of earnings as they
accrue, we conclude that this approach provides a much more realistic picture of the evolution of
top income shares over time.
5 Concluding remarks
We show that accounting for retained earnings is important both for measuring the level and —
when tax incentives evolve — changes in inequality. Doing so also indicates that re-ranking due
to changes in observability of income was quantitatively important, but a comprehensive income
measure that accounts for retention does not suffer from the same problems. We make use of
complete business register information that allows us to see through multiple layers of ownership
— this is important because it turns out that retained earnings hidden behind indirect ownership
account for half of incomes of the top 0.1% after 2005.
The problem with retained earnings is not limited to measurement of inequality. Driessen (2014)
notes that the approach that ignores retained corporate income is nowadays common in estimating
distributional consequences of tax policy.28 However, absent ownership information, addressing this
issue requires some imputation-based approach to assigning corporate side income to shareholders.
One can imagine various imputation methods that can address the lack of precise information about
ownership. For example, Armour, Burkhauser and Larrimore (2014) use asset information from
the SCF and rates of returns across broad asset classes to impute accruing capital gains at various
points across the distribution. Alternatively, one can rely on observed capital gains or dividends
to infer ownership. Saez and Zucman (2016) follow this path in order to allocate ownership of
corporate equities in their wealth distribution estimates, Piketty, Saez and Zucman (2016) do so to
adjust US income inequality series in Piketty and Saez (2003), and Thoresen et al. (2012) rely on
a related approach to understand distributional implications of the 2006 Norwegian reform.28The objections to it have been recognized for a long time. For example, the celebrated 1984 United States Treasury
tax proposal that paved the way for the Tax Reform Act of 1986 (Department of the Treasury, 1984) accounted forcorporate income in its distributional analysis noting that “Economic income reflects the view that corporations arenot separate from their stockholders, but that the income of corporations is income of its stockholders; therefore,economic income allocates pre-tax corporate profits both to individuals who own stock directly and to those who ownstock indirectly (...)” (page 58).
17
We investigate whether imputations based on dividends can account for retained earnings ad-
equately, see Figure 16. To do so, we simply assign ownership of aggregate retained earnings that
belong to individuals (calculated from micro data) according to observed received dividends. In
general, this way of imputing results in understatement of retained earnings at the top of the dis-
tribution, with the exception of 2005 when both retentions and dividends were large. Mechanically,
the approach does particularly poorly in years when aggregate retained earnings of households were
negative because it cannot discriminate between losses to the general public and gains at the top.29
However, even in other years, such imputations can account for only between 20 and 60% of retained
earnings that should be allocated to the top 0.1%. This is driven by the combination of losses and
the imperfect correlation of dividends and retained earnings (in fact, note that ceteris paribus for
a particular firm, dividends and retained earnings have to move in the opposite directions).
To sum up, imputing retained earnings based on dividends still leads to a significant understate-
ment of inequality and that is despite the fact that our use of micro data (rather than assigning
imputed income to groups) allows for re-ranking of individuals. Furthermore, our previous analysis
highlights that it is closely held firms that are important and we have seen that the possibility of
negative retained earnings (and more generally losses) makes the imputations difficult (and also
casts doubt on relying on average rate of return to impute income based on asset values). By
relying on precise ownership information, we can avoid these pitfalls.
While our approach was implemented on Norwegian data, our findings are relevant for other
countries as well. As shown in Figure 3, the United States Tax Reform Act of 1986, which strongly
encouraged pass-through treatment of top incomes, resulted in a massive adjustment of top income
shares. Furthermore, Figure 3 also illustrates that total corporate retained earnings are very large
relative to changes in inequality. If the whole 4.1% percentage point increase between 1986 and
1988 was due to increased reporting of corporate source incomes on individual tax returns, it is
easy to see from Figure 3 that such “corrected” top income shares would show no upward trend
between the 1970s and the mid-1990s, significantly altering our understanding of the evolution of
top income inequality in recent decades. A more recent series in Piketty, Saez and Zucman (2016)
that partially accounts for retained earnings shows a smaller but still sizable jump in 1986, but
as we have just seen, the imputation approach that they rely on performs poorly in Norwegian
data leaving open the possibility that that most of the 1986 discontinuity is in fact explained by29One can of course imagine a simple adjustment to this procedure if aggregate profits and losses are observed
separately. Note though that negative retained earnings do not necessarily correspond to losses.
18
systematically underestimating top incomes in years before 1987.
Alternatively, the Tax Reform Act of 1986 may also have had an effect on reported incomes
through behavioral response and not just reporting. A large body of work on tax responsiveness of
taxable incomes was recently surveyed by Saez, Slemrod and Giertz (2012). This literature usually
focuses on reported incomes — stripped of S-corporation source income and capital gains — to
analyze the effect on the remaining “stable” component. To illustrate the potential of behavioral
response here, the top 1% share in 1986 according to Piketty and Saez (2003) data was 0.091 in
1986 and 0.132 by 1988. The top marginal tax rate changed from 50% to 28%, corresponding to
the change in the log net-of-tax rate of log(1 − 0.5) − log(1 − 0.28) = −0.364. This net-of-tax rate
change multiplied by the estimate of taxable income elasticity (which is customarily computed with
respect to the net-of-tax rate) yields the implied percentage change in top income share for the
given strength of behavioral response. According to Saez, Slemrod and Giertz (2012), the upper
bound of their preferred range of estimates of elasticity of responsiveness is about 0.4, which would
then imply an increase in top 1% income share from 0.091 to 0.105 — explaining only about 1/3 of
the observed increase between 1986 and 1988. The higher end of the estimates in the literature is
about 1 — such large responsiveness could in fact explain all of the increase (it implies an increase
from 0.091 to 0.131). In fact, the most prominent of such estimates (Feldstein, 1995) effectively does
amount to interpreting the 1986-1988 increase as the response to tax rate changes. It is important
to note that the reporting and behavioral response explanations are in fact not distinct because
behavioral response measured in the literature may in fact be reflecting reporting rather than real
effects.
More broadly, this discussion suggests that simultaneous claims of a large increase in inequality
before the 1990s and low behavioral responses are mutually inconsistent. If behavioral responses
are small, then almost the whole increase in inequality took place immediately after 1986. Absent
real response to taxation, one would be left with either the belief that inequality somehow happened
to experience a one time jump right after 1986 — a very arbitrary explanation — or that the effect
is due to the effective shift from realization-based toward accrual-based approach that the reform
corresponded to, so that top income shares before and after 1986 are measured in a different way.
Our Norwegian evidence suggests that such a shift has potential to have large effects. Alternatively,
the behavioral response may have also played a role, but one would need massive real responses
to tax rates in order to explain this change without appealing to problems with measurement of
inequality. Furthermore, capital gains do little to correct realization-based measurement problems
19
in Norway, because they are small relative to changes in accumulated retained earnings (both in
aggregate — Figure 8 — and at the top — Figures 1 and 2) and show little correlation with that
volatile series. There is definitely much more action involving capital gains in the United States
around 1986, but it seems unlikely that they correspond to profits as they accrue, rather than
reflecting profits over longer holding periods realized at opportune timing.
The key advantage of our Norwegian data is ability to allocate profits to shareholders. We
are not able to do the same for other countries. One may still, though, shed some light on the
importance of these types of issues by evaluating the importance of accumulated retained earnings
(undistributed profits) relative to dividends as well as the importance of pass-through entities
elsewhere. This exercise is still limited by data availability: in the Norwegian case, we observe
balance sheets of all firms while the evidence that follows is based only on large publicly traded
firms with — naturally — dispersed ownership.
Firm level profits that are retained in the corporation and not distributed to owners are con-
siderable in most developed economies. Firms retain earnings, for example, to fund investments
internally (Auerbach and Hassett, 2002) and, thus, a substantial part of profits is not distributed as
dividends. Figure 17 illustrates trends in changes in accumulated retained earnings and dividends
that are conceptually similar to series presented on our Figure 8 for Norwegian firms, although
rely on a different set of firms. The bulk of the corrections in the Norwegian case was driven by
closely-held businesses. Here, we instead use data on listed firms for nine large economies from
Worldscope and include all listed firms that had i) information on accumulated retained earnings
in the current and previous year, and ii) information on dividends.30 We then sum changes in
accumulated retained earnings, as well as dividends, over all firms in a year and convert to nominal
billion USD.
We see that the two series are of the same order of magnitude so that not accounting for retained
earnings is likely to be problematic everywhere. For instance, for 1998 in the United States, the
listed firms distributed about 200 billion USD to shareholders, but about the same amount was
retained in the firms. As this paper indicates, this is income earned by the same shareholders, but
not registered in the personal income statistics, leading to underestimation of their income, and
disproportionately so compared to lower income individuals if not explicitly accounted for in some
other fashion. Furthermore, dividends are very smooth (consistently with conventional wisdom in30We include the countries that had sufficient coverage of the listed firms included in the database, unfortunately
that was not the case for Norway.
20
the literature), while accumulated retained earnings are much more volatile, similar to what we
have seen in the Norwegian case and suggesting that the personal income tax based approach may
have problems accounting for business-cycle changes in inequality. Finally, the relative importance
of dividends and retained earnings varies across countries — dividends appear particularly small
in Japan and more important elsewhere, suggesting that cross-sectional comparisons of inequality
across countries may be sensitive to these types of issues as well. In addition, the tax system
in these countries can have large effects on the measurement of inequality because dividend and
capital gains taxation has not only large effects on the level and channel of payout, but also on the
fraction of cash flows that is paid as dividends (Jacob and Jacob, 2013a,b).
This is of particular importance because there is substantial cross-country variation in the
importance of unincorporated and corporate businesses (roughly, a proxy for pass-through vs cor-
porate tax treatment, although S-corporations in the United States are an important example that
does not fit in that classification). Table 1 presents statistics on the importance of different or-
ganizational forms based on Eurostat data for 2011. The share of employment is concentrated in
the corporate sector in countries such as Sweden, Norway, or the United Kingdom. Other coun-
tries such as France, Italy, Germany or Hungary have substantial employment in unincorporated
businesses. Of course, unincorporated firms may have their own issue for measuring inequality, for
example if they are more prone to tax evasion. To summarize, the importance of corporate-source
unrealized income for inequality measurement differs across countries which substantially reduces
comparability of inequality statistics across countries and the Norwegian evidence makes it clear
that issues of comparability are important even within a country. A careful evaluation of the im-
portance of corporate income for inequality in other countries is an important direction for future
work.
21
References
Aaberge, Rolf, and Anthony B. Atkinson. 2010. “Top Incomes in Norway.” In Top Incomes.
A Global Perspective. , ed. Tony Atkinson and Thomas Piketty, Chapter 9, 448–82. Oxford
University Press.
Aaberge, Rolf, Anthony B. Atkinson, and Jørgen Modalsi. 2013. “The Ins and Outs of
Top Income Mobility.” Statistics Norway Research Department Discussion Paper 762.
Alstadsæter, Annette, and Erik Fjærli. 2009. “Neutral Taxation of Shareholder Income?
Corporate Responses to an Announced Dividend Tax.” International Tax and Public Finance,
16(4): 571–64.
Alstadsæter, Annette, Wojciech Kopczuk, and Kjetil Telle. 2012. “Social networks and tax
avoidance: Evidence from a well-defined Norwegian tax shelter.” Statistics Norway and Columbia.
Alstadsæter, Annette, Wojciech Kopczuk, and Kjetil Telle. 2014. “Are Closely-Held Firms
Tax Shelters?” Tax Policy and the Economy, 28: 1–32.
Armour, Philip, Richard V. Burkhauser, and Jeff Larrimore. 2014. “Levels And Trends
in United States Income and Its Distribution: A Crosswalk from Market Income Towards a
Comprehensive Haig-Simons Income Measure.” Southern Economic Journal, 81(2): 271–293.
Atkinson, Anthony B., Thomas Piketty, and Emmanuel Saez. 2011. “Top Incomes in the
Long Run of History.” Journal of Economic Literature, 49(1): 3–71.
Auerbach, Alan J. 1991. “Retrospective Capital Gains Taxation.” American Economic Review,
81(1): 167–178.
Auerbach, Alan J., and David F. Bradford. 2004. “Generalized Cash Flow Taxation.” Journal
of Public Economics, 88(5): 957–80.
Auerbach, Alan J., and Joel Slemrod. 1997. “The Economic Effects of the Tax Reform Act
of 1986.” Journal of Economic Literature, 35(2): 589–632.
Auerbach, Alan J., and Kevin A. Hassett. 2002. “On the marginal source of investment
funds.” Journal of Public Economics, 87(1): 205–232.
22
Auten, Gerald, and David Splinter. 2016. “Using Tax Data to Measure Long-Term Trends in
U.S. Income Inequality.” mimeo.
Burkhauser, Richard V., Markus H. Hahn, and Roger Wilkins. 2015. “Measuring top
incomes using tax record data: a cautionary tale from Australia.” The Journal of Economic
Inequality, 13(2): 181–205.
Clarke, Conor, and Wojciech Kopczuk. 2016a. “Business Income and Business Taxation in
the United States since the 1950s.” Tax Policy and the Economy. Forthcoming.
Clarke, Conor, and Wojciech Kopczuk. 2016b. “Income Inequality and the Corporate Sector:
1913-2012.” Yale Law School and Columbia University, mimeo.
Cooper, Michael, John McClelland, James Pearce, Richard Prisinzano, Joseph Sulli-
van, Danny Yagan, Owen Zidar, and Eric Zwick. 2015. “Business in the United States:
Who Owns it and How Much Tax Do They Pay?” National Bureau of Economic Research
Working Paper 21651.
Department of the Treasury. 1984. “Tax Reform for Fairness, Simplicity, and Economic Growth.
Volume 1: Overview.” The Treasury Department Report to the President.
Driessen, Patrick. 2014. “Corporate Tax Fate May Hinge on Modeling Omission.” Tax Notes,
1043–1048.
Fairfield, Tasha, and Michel Jorratt De Luis. 2016. “Top Income Shares, Business Profits,
and Effective Tax Rates in Contemporary Chile.” Review of Income and Wealth, 62: S120–S144.
Feldstein, Martin S. 1995. “The Effect of Marginal Tax Rates on Taxable Income: A Panel
Study of the 1986 Tax Reform Act.” Journal of Political Economy, 103(3): 551–572.
Fjærli, Erik, and Rolf Aaberge. 1999. “Tax Reforms, Dividend Policy and Trends in Income
Inequality. Empricial Evidence Based on Norwegian Data.” Discussion Papers, 284.
Gordon, Roger H., and Jeffrey K. MacKie-Mason. 1994. “Tax Distortions to the Choice of
Organizational Form.” Journal of Public Economics, 55(2): 279–306.
Gordon, Roger H., and Joel Slemrod. 2000. “Are “Real” Responses to Taxes Simply Income
Shifting Between Corporate and Personal Tax Bases?” In Does Atlas Shrug? The Economic
23
Consequences of Taxing the Rich. , ed. Joel Slemrod. New York:Harvard University Press and
Russell Sage Foundation.
Internal Revenue Service. 2015. “The 400 Individual Income Tax Returns Reporting the Largest
Adjusted Gross Incomes Each Year, 1992–2013.” https: // www. irs. gov/ pub/ irs-soi/
13intop400. pdf .
Jacob, Marcus, and Martin Jacob. 2013a. “Taxation and the cash flow sensitivity of dividends.”
Economics Letters, 118: 168–188.
Jacob, Marcus, and Martin Jacob. 2013b. “Taxation, Dividends, and Share Repurchases:
Taking Evidence Global.” Journal of Financial and Quantitative Analysis, 48: 1241–1269.
Jacob, Martin, Roni Michaely, and Annette Alstadsæter. 2015. “Taxation and Dividend
Policy: The Muting Effect of Diverse Ownership Structure.” SSRN Working Paper.
Kopczuk, Wojciech, Emmanuel Saez, and Jae Song. 2009. “Earnings Inequality and Mobility
in the United States: Evidence from Social Security Data since 1937.” Quarterly Journal of
Economics, 125(1): 91–128.
Lindsey, Lawrence. 1987. “Individual Taxpayer Response to Tax Cuts: 1982-1984, with Impli-
cations for the Revenue Maximizing Tax Rate.” Journal of Public Economics, 33(2): 173–206.
Piketty, Thomas. 2003. “Income Inequality in France, 1901-1998.” Journal of Political Economy,
111(5): 1004–42.
Piketty, Thomas, and Emmanuel Saez. 2003. “Income Inequality in the United States, 1913-
1998.” Quarterly Journal of Economics, 118: 1–39.
Piketty, Thomas, Emmanuel Saez, and Gabriel Zucman. 2016. “Distributional National
Accounts: Methods and Estimates for the United States.” National Bureau of Economic Research
Working Paper 22945.
Roine, Jesper, and Daniel Waldenström. 2012. “On the role of capital gains in the Swedish
income inequality.” Review of Income and Wealth, 58(3): 569–587.
Romanov, Dmitri. 2006. “Corporation as a Tax Shelter: Evidence from Recent Israeli Tax
Changes.” Journal of Public Economics, 90(10-11): 1939–54.
24
Saez, Emmanuel, and Gabriel Zucman. 2016. “Wealth Inequality in the United States
since 1913: Evidence from Capitalized Income Tax Data.” Quarterly Journal of Economics,
131(2): 519–78.
Saez, Emmanuel, Joel B. Slemrod, and Seth H. Giertz. 2012. “The Elasticity of Taxable
Income with Respect to Marginal Tax Rates: A Critical Review.” Journal of Economic Literature,
50(1): 3–50.
Simons, H. C. 1938. Personal Income Taxation. Chicago Univ. Press.
Steinkellner, Alice. 2003. “Inntektsstatistikk for personer og familier 1999-2001.” Statistics Nor-
way 72.
Thoresen, Thor O., Erlend E. Bø, Erik Fjærli, and Elin Halvorsen. 2012. “A Suggestion
for Evaluating the Redistributional Effects of Tax Changes: With an Application to the 2006
Norwegian Tax Reform.” Public Finance Review, 40(3): 303–338.
Wolfson, Michael, Michael Veall, Neil Brooks, and Brian B. Murphy. 2016. “Piercing
the Veil – Private Corporations and the Income of the Affluent.” Canadian Tax Journal/Revue
Fiscale Canadienne, 64(1).
25
A Description of Data
Our individual-level data to which we have merged corporation information, are based on adminis-
trative registers maintained by Statistics Norway. We use three main data sources. First, we have
individual income tax information (Individual Data). Second, we have information on all businesses
(Corporation Data). Finally, we have the full shareholder register (Ownership Data). Each indi-
vidual can be identified over time and across registers by the same unique personal identification
number provided all Norwegians at birth or upon immigration, and each corporation can also be
identified over time and across registers by one unique firm identifier.
Our first data source (Individual Data) covers all Norwegian residents (about 5.1 million) for
each calendar year 2000-2013. It is mandatory for adult Norwegian residents to submit a tax
statement every year, and we have all these statements (information originating from the Norwegian
Tax Authorities). Individual tax information comprise income, e.g., labor income, business income,
and capital income (including dividends). Our main income measure (ICGB ) includes i) income
from labor, i.e. earnings and other benefits from employers (like private use of employer’s car,
newspapers, phone, child care), as well as net income from self-employment; ii) capital income,
i.e. interest, dividends, capital gains and losses, net income from renting of real estate, etc.; and
iii) taxable transfers, like unemployment benefits, sick leave benefits and pensions (see Steinkellner
2003 p. 40 for details). From the original dataset, we exclude individual-year observations where
the individual’s age is below 16. In total, our statistics are based on 54,423,145 observations and
4,930,201 individuals.
The second data source (Corporation Data) comprises of all businesses incorporated and taxable
in Norway over the 1999-2013 period (including also corporations like banks, insurance companies
and financial holding companies, but not public mutual funds). This data cover the balance sheet
with detailed equity and debt information as well as the profit and loss statement of each corporation
(information originating from the Norwegian Tax Authorities). Using these data, we construct a
panel of 313,249 corporations for which we can compute the change in accumulated retained earnings
for the period 2000-2013. In total, we have 2,059,972 corporation-year observations with changes
in accumulated retained earnings that can be attributed to individual income tax statements.
To link retained corporate earnings from the Corporation Data to the Individual Data, we use
the shareholder register (Ownership Data). These data cover every shareholding of each corporate
and individual shareholder (also originating from the Norwegian Tax Authorities). For example, in
26
2011, we have 2,051,354 unique shareholder-corporation pairs for 213,484 corporations, with 689,050
(direct) individual shareholders and 90,590 corporate shareholders.31 The retained earnings are
attributed to the corporate and individual shareholders. As individuals can indirectly hold shares
in a firm, we account for 10 layers of indirect ownership. The final individual shareholding of
each individual in each firm accounts for such indirect shareholdings. We then sum the change
in accumulated retained earnings across all shareholdings for an individual and then merge this
information to the Individual Data.
B Maximizing Dividends
We expect corporations to maximize dividends in the last years before the tax reform in 2005, and
to check this we follow the approach of Alstadsæter, Kopczuk and Telle (2014). To define dividend
maximizers, we operationalize the two main legal restrictions on dividends. First, only accumulated
earned equity from the balance sheet of the previous year can be distributed in the given year. Our
operationalization of earned equity is a proxy, since there are additional factors (which we do not
have data to incorporate) that should be deducted from our measure of earned equity to find the
exact legal limit on dividends. Second, remaining equity after dividend payments needs to be at
least 10% of total assets, again as stated in the balance sheet of the previous year. To be able to
illustrate the patterns before 2004 we use ordinary rather than distributed dividends (data on the
latter not available before 2004).
Some corporations have no earned equity (because they have paid it out in the past or have
accumulated losses) or their equity level is below 10% of assets. Such corporations have no ability to
legally pay any dividends. The remaining corporations can pay dividends. We define as maximizers
corporations that have the equity/asset ratio of between 0.09 and 0.11 after proposing the positive
dividend or that propose a dividend exceeding 95% of its earned equity.
In all years, about 40% of the corporations had no earned equity or their equity level is below
10% of assets. Such firms have no ability to legally pay any dividends. In 2005 nearly half of the
corporations that have the ability to pay dividends decide to maximize their payouts. Overall,
39% of firms pay any dividends in 2005 and 62% of those maximize their payout — the median
corporation that pays dividends in 2005 does so to the maximum extent possible (see Alstadsæter,31Note that we also have information on foreign ownership, but the information is limited to the country of the
direct owner. There are no other identifying information. On average, foreign shareholders account for about 11% ofaggregated accumulated retained earnings in Norway.
27
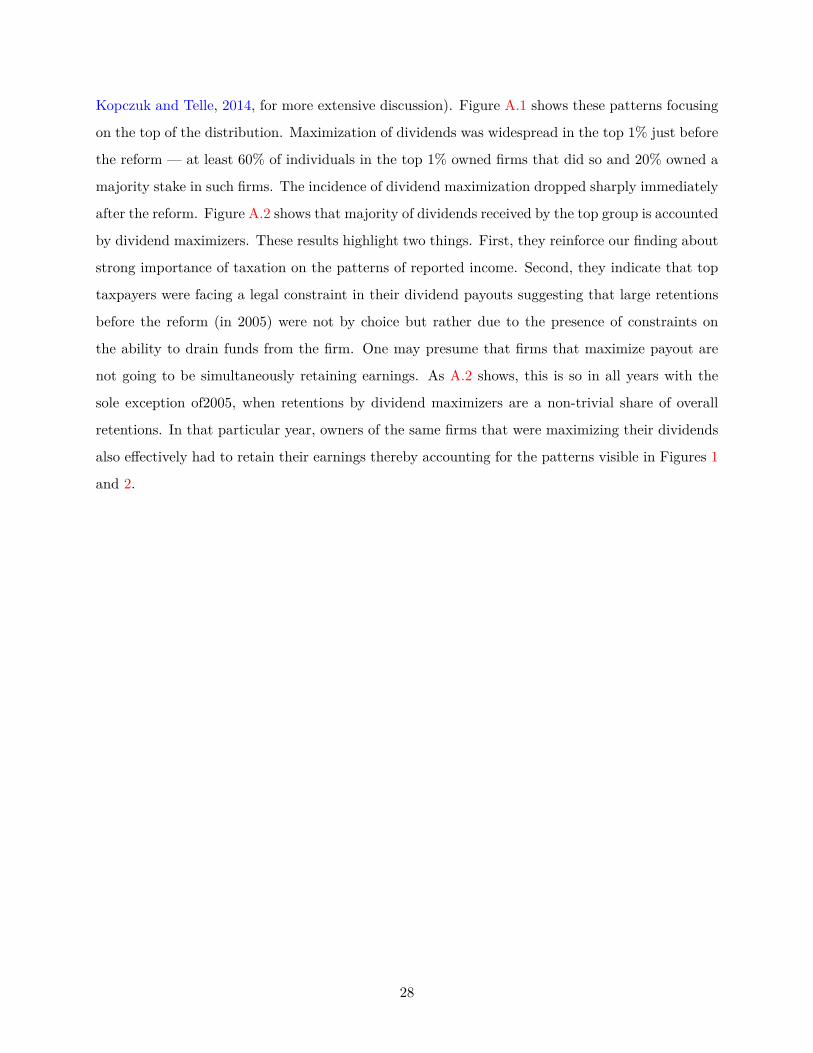
Kopczuk and Telle, 2014, for more extensive discussion). Figure A.1 shows these patterns focusing
on the top of the distribution. Maximization of dividends was widespread in the top 1% just before
the reform — at least 60% of individuals in the top 1% owned firms that did so and 20% owned a
majority stake in such firms. The incidence of dividend maximization dropped sharply immediately
after the reform. Figure A.2 shows that majority of dividends received by the top group is accounted
by dividend maximizers. These results highlight two things. First, they reinforce our finding about
strong importance of taxation on the patterns of reported income. Second, they indicate that top
taxpayers were facing a legal constraint in their dividend payouts suggesting that large retentions
before the reform (in 2005) were not by choice but rather due to the presence of constraints on
the ability to drain funds from the firm. One may presume that firms that maximize payout are
not going to be simultaneously retaining earnings. As A.2 shows, this is so in all years with the
sole exception of2005, when retentions by dividend maximizers are a non-trivial share of overall
retentions. In that particular year, owners of the same firms that were maximizing their dividends
also effectively had to retain their earnings thereby accounting for the patterns visible in Figures 1
and 2.
28
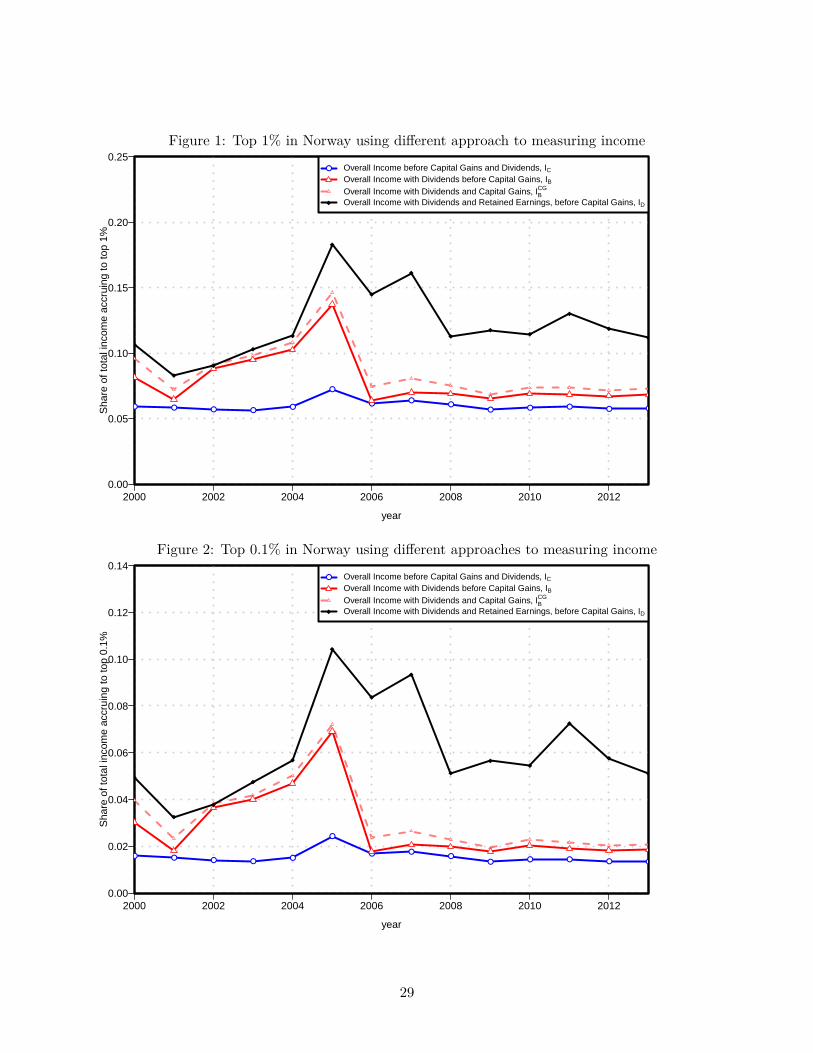
Figure 1: Top 1% in Norway using different approach to measuring income
2000 2002 2004 2006 2008 2010 20120.00
0.05
0.10
0.15
0.20
0.25
year
Sha
re o
f tot
al in
com
e ac
crui
ng to
top
1%
● ● ● ●●
●
●●
●● ● ● ● ●
● Overall Income before Capital Gains and Dividends, ICOverall Income with Dividends before Capital Gains, IBOverall Income with Dividends and Capital Gains, IB
CG
Overall Income with Dividends and Retained Earnings, before Capital Gains, ID
Figure 2: Top 0.1% in Norway using different approaches to measuring income
2000 2002 2004 2006 2008 2010 20120.00
0.02
0.04
0.06
0.08
0.10
0.12
0.14
year
Sha
re o
f tot
al in
com
e ac
crui
ng to
top
0.1%
● ● ● ●●
●
● ●●
● ● ● ● ●
● Overall Income before Capital Gains and Dividends, ICOverall Income with Dividends before Capital Gains, IBOverall Income with Dividends and Capital Gains, IB
CG
Overall Income with Dividends and Retained Earnings, before Capital Gains, ID
29
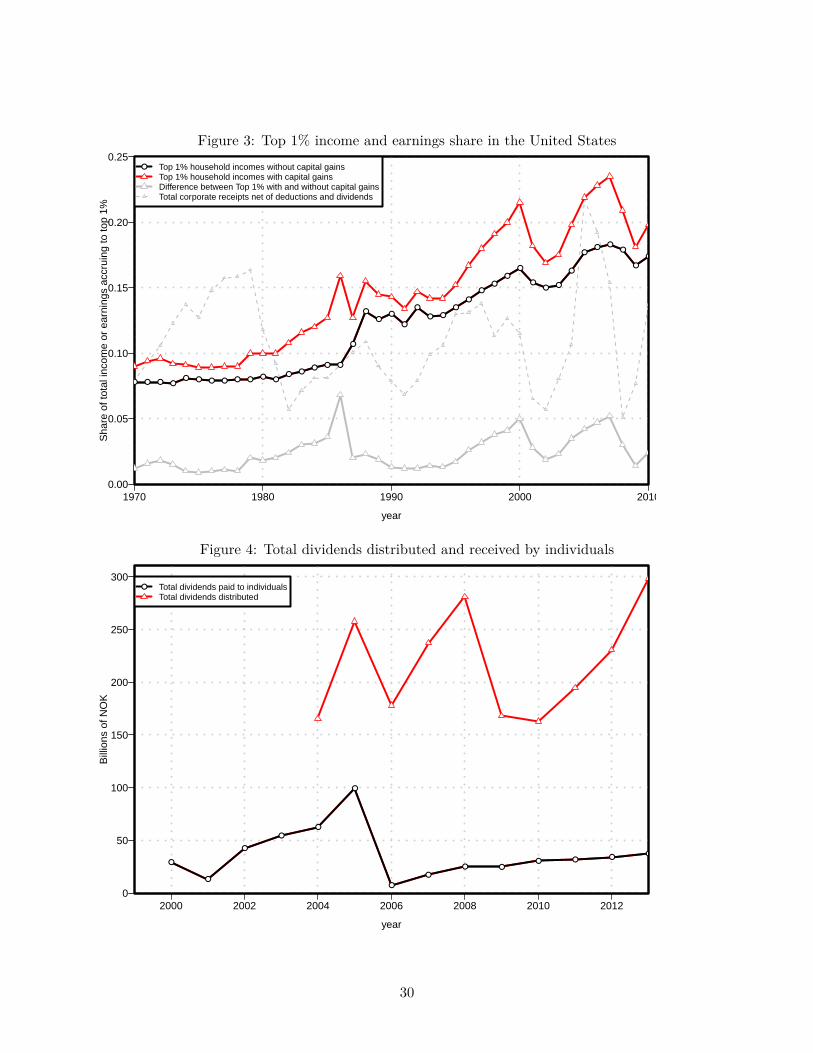
Figure 3: Top 1% income and earnings share in the United States
1970 1980 1990 2000 20100.00
0.05
0.10
0.15
0.20
0.25
year
Sha
re o
f tot
al in
com
e or
ear
ning
s ac
crui
ng to
top
1%
● ●● ● ● ● ●
● ● ● ● ● ● ● ●● ●
● ● ●
●
●
●●
●
●
● ●
●
●
●●
●
●
●● ●
●
●● ●
●
●
●
● Top 1% household incomes without capital gainsTop 1% household incomes with capital gainsDifference between Top 1% with and without capital gainsTotal corporate receipts net of deductions and dividends
Figure 4: Total dividends distributed and received by individuals
2000 2002 2004 2006 2008 2010 20120
50
100
150
200
250
300
year
Bill
ions
of N
OK
●
●
●
●
●
●
●
●
● ●● ● ●
●
● Total dividends paid to individualsTotal dividends distributed
30
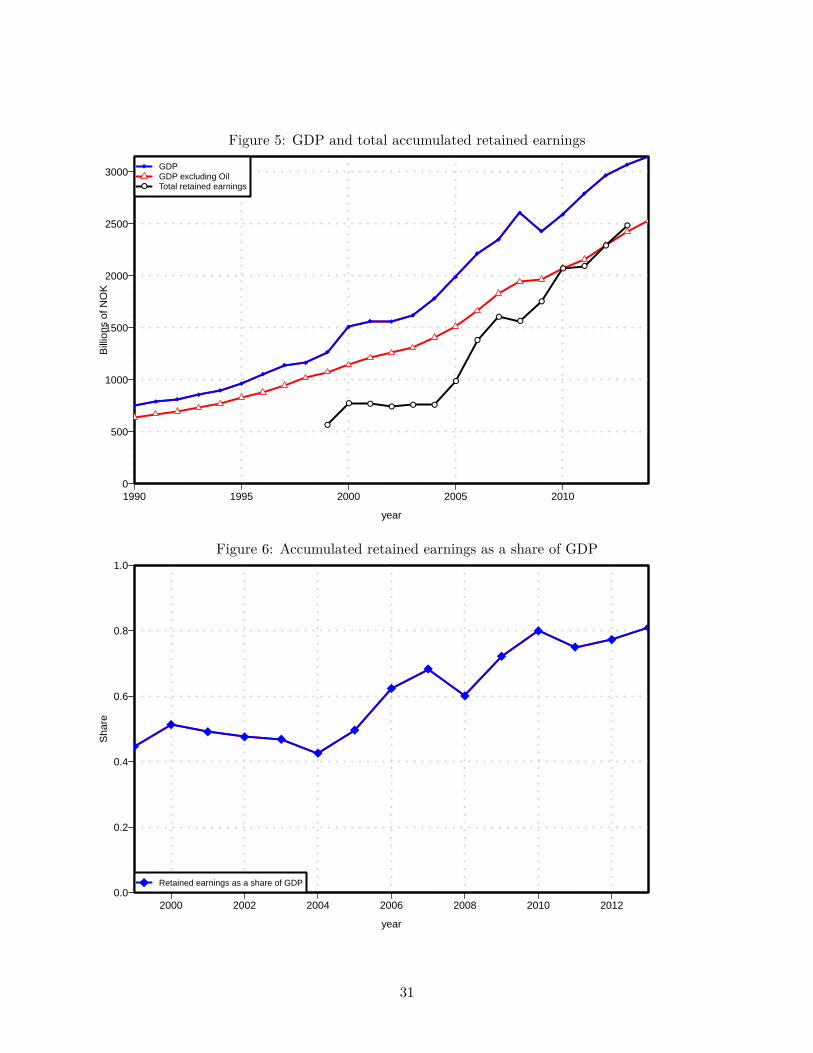
Figure 5: GDP and total accumulated retained earnings
1990 1995 2000 2005 20100
500
1000
1500
2000
2500
3000
year
Bill
ions
of N
OK
●
● ● ● ● ●
●
●
●●
●
● ●
●
●
●
GDPGDP excluding OilTotal retained earnings
Figure 6: Accumulated retained earnings as a share of GDP
2000 2002 2004 2006 2008 2010 20120.0
0.2
0.4
0.6
0.8
1.0
year
Sha
re
Retained earnings as a share of GDP
31
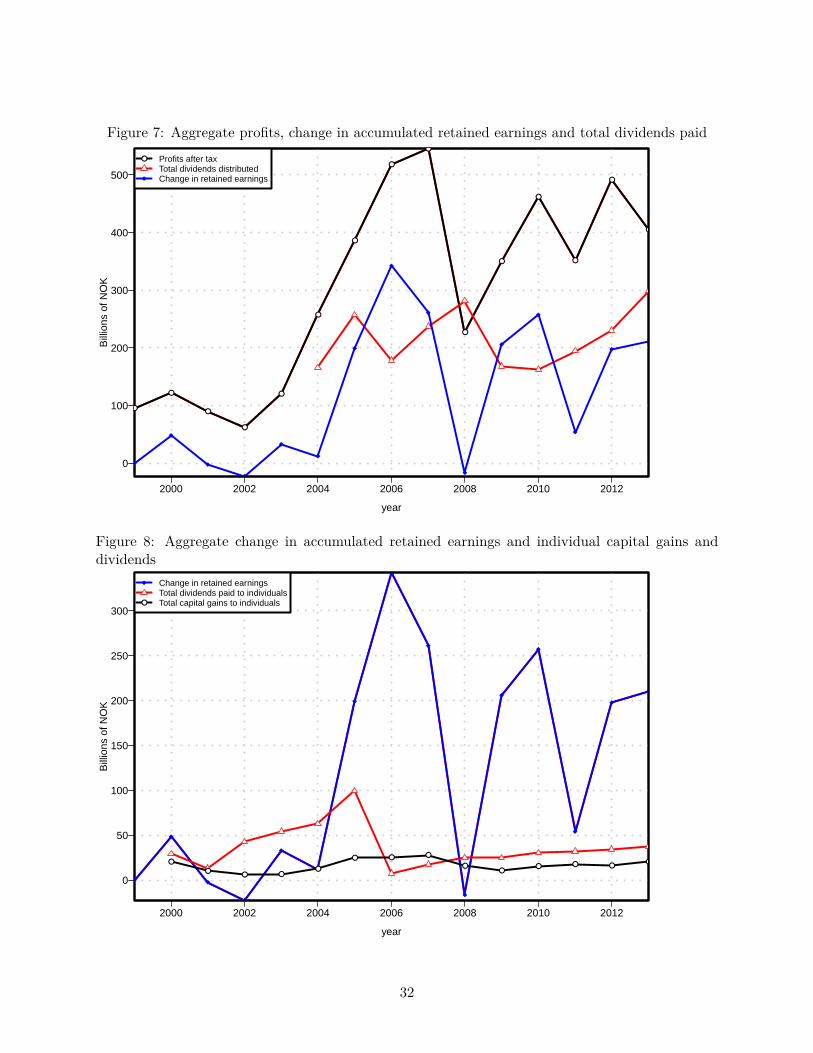
Figure 7: Aggregate profits, change in accumulated retained earnings and total dividends paid
2000 2002 2004 2006 2008 2010 2012
0
100
200
300
400
500
year
Bill
ions
of N
OK
●
●
●
●
●
●
●
●
●
●
●
●
●
●
●
● Profits after taxTotal dividends distributedChange in retained earnings
Figure 8: Aggregate change in accumulated retained earnings and individual capital gains anddividends
2000 2002 2004 2006 2008 2010 2012
0
50
100
150
200
250
300
year
Bill
ions
of N
OK
●
●● ●
●
● ● ●
●●
● ● ●●
●
Change in retained earningsTotal dividends paid to individualsTotal capital gains to individuals
32
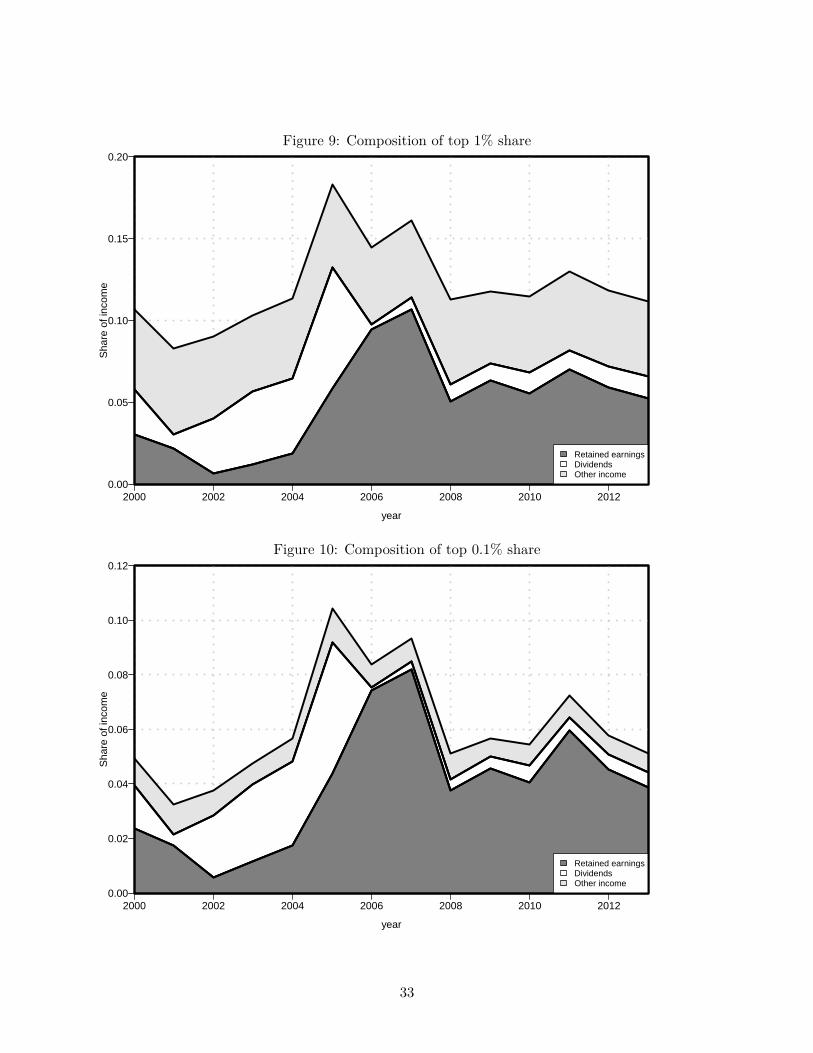
Figure 9: Composition of top 1% share
2000 2002 2004 2006 2008 2010 20120.00
0.05
0.10
0.15
0.20
year
Sha
re o
f inc
ome
Retained earningsDividendsOther income
Figure 10: Composition of top 0.1% share
2000 2002 2004 2006 2008 2010 20120.00
0.02
0.04
0.06
0.08
0.10
0.12
year
Sha
re o
f inc
ome
Retained earningsDividendsOther income
33
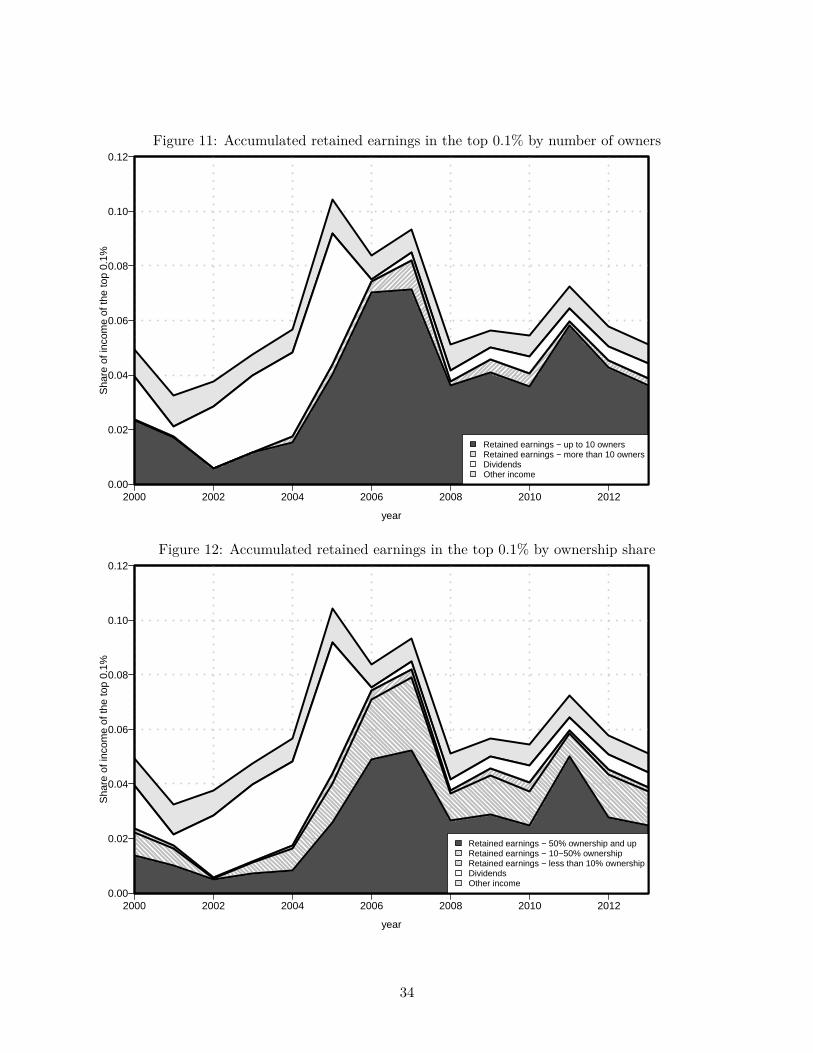
Figure 11: Accumulated retained earnings in the top 0.1% by number of owners
2000 2002 2004 2006 2008 2010 20120.00
0.02
0.04
0.06
0.08
0.10
0.12
year
Sha
re o
f inc
ome
of th
e to
p 0.
1%
Retained earnings − up to 10 ownersRetained earnings − more than 10 ownersDividendsOther income
Figure 12: Accumulated retained earnings in the top 0.1% by ownership share
2000 2002 2004 2006 2008 2010 20120.00
0.02
0.04
0.06
0.08
0.10
0.12
year
Sha
re o
f inc
ome
of th
e to
p 0.
1%
Retained earnings − 50% ownership and upRetained earnings − 10−50% ownershipRetained earnings − less than 10% ownershipDividendsOther income
34
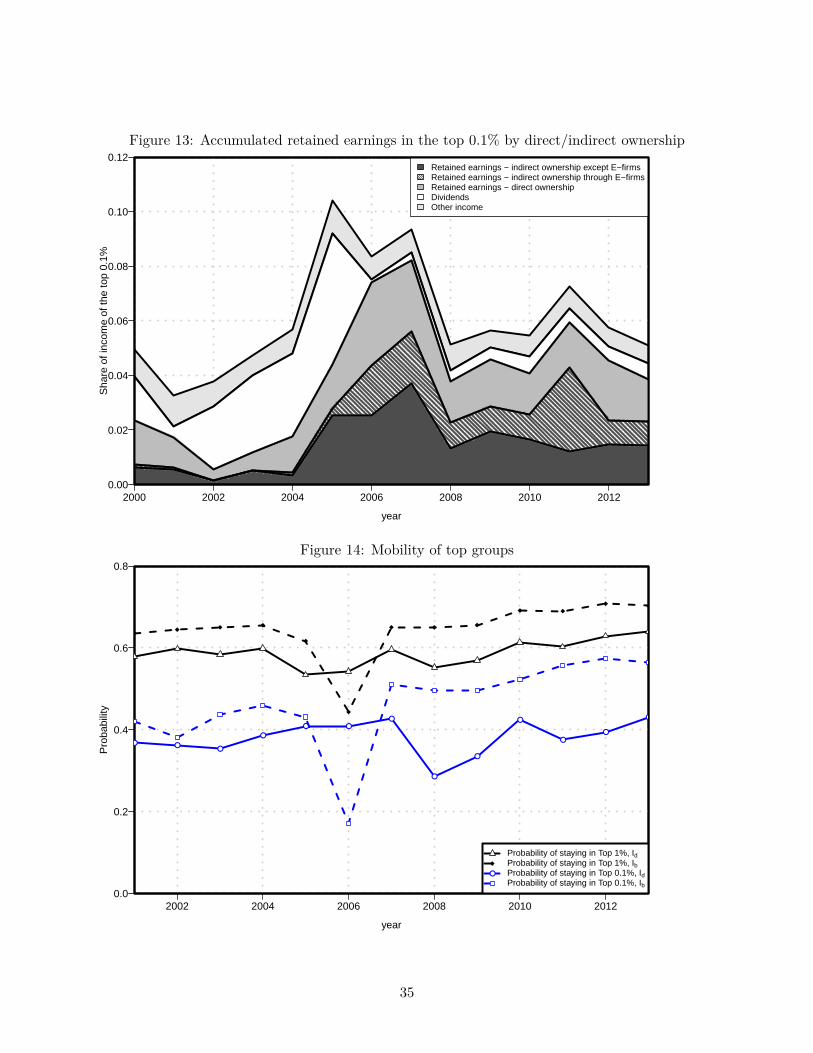
Figure 13: Accumulated retained earnings in the top 0.1% by direct/indirect ownership
2000 2002 2004 2006 2008 2010 20120.00
0.02
0.04
0.06
0.08
0.10
0.12
year
Sha
re o
f inc
ome
of th
e to
p 0.
1%
Retained earnings − indirect ownership except E−firmsRetained earnings − indirect ownership through E−firmsRetained earnings − direct ownershipDividendsOther income
Figure 14: Mobility of top groups
2002 2004 2006 2008 2010 20120.0
0.2
0.4
0.6
0.8
year
Pro
babi
lity
● ●●
●
● ●●
●
●
●
●
●
●
●
Probability of staying in Top 1%, IdProbability of staying in Top 1%, IbProbability of staying in Top 0.1%, IdProbability of staying in Top 0.1%, Ib
35
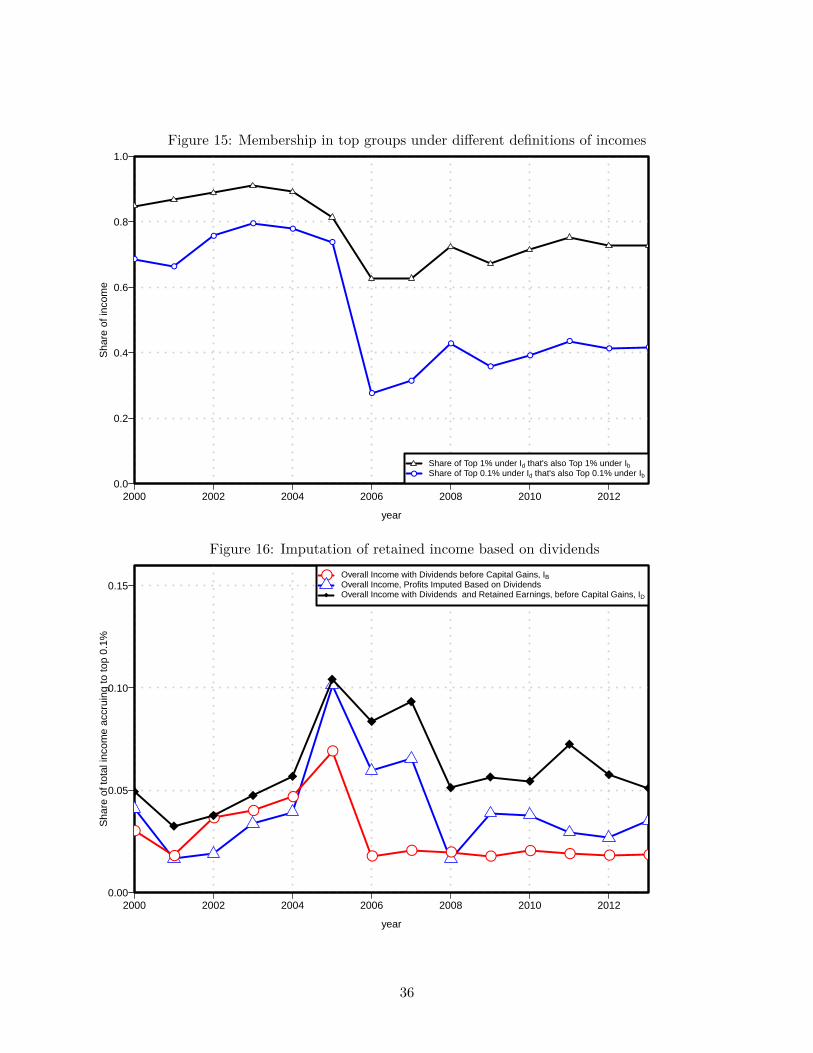
Figure 15: Membership in top groups under different definitions of incomes
2000 2002 2004 2006 2008 2010 20120.0
0.2
0.4
0.6
0.8
1.0
year
Sha
re o
f inc
ome
●●
●
●●
●
●
●
●
●
●
●● ●
●
Share of Top 1% under Id that's also Top 1% under IbShare of Top 0.1% under Id that's also Top 0.1% under Ib
Figure 16: Imputation of retained income based on dividends
2000 2002 2004 2006 2008 2010 20120.00
0.05
0.10
0.15
year
Sha
re o
f tot
al in
com
e ac
crui
ng to
top
0.1%
●
●
●●
●
●
● ● ● ● ● ● ● ●
● Overall Income with Dividends before Capital Gains, IBOverall Income, Profits Imputed Based on DividendsOverall Income with Dividends and Retained Earnings, before Capital Gains, ID
36
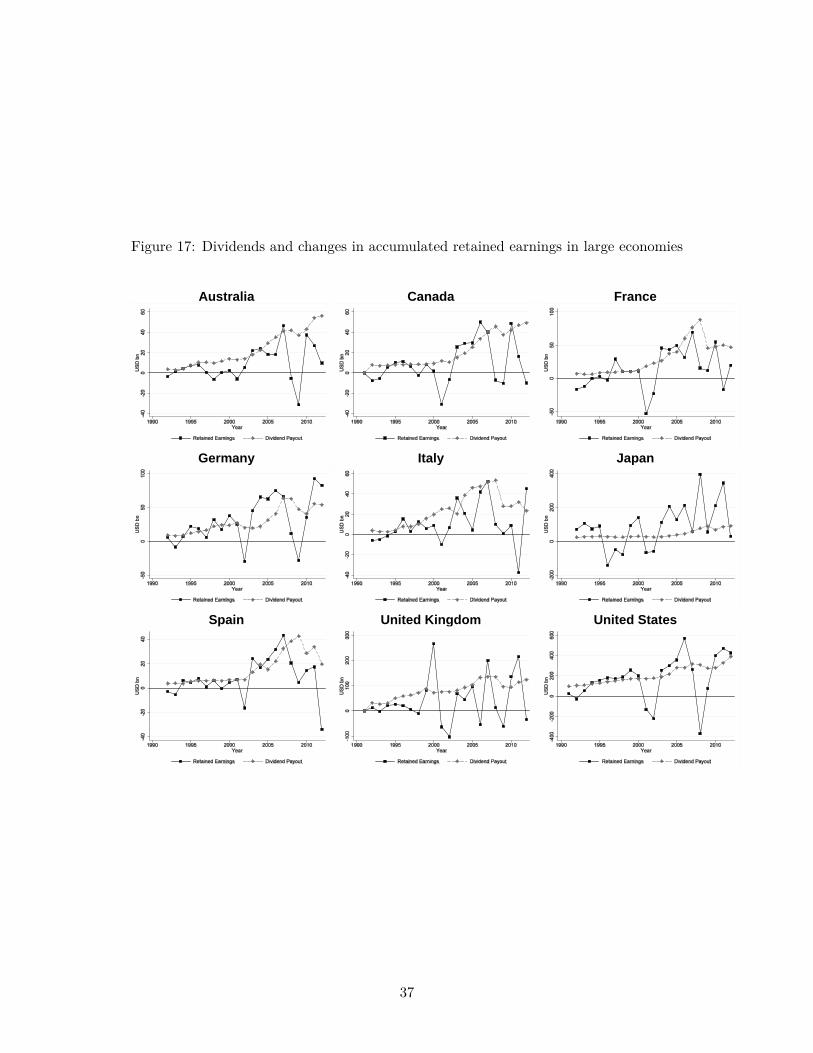
Figure 17: Dividends and changes in accumulated retained earnings in large economies
Australia Canada France
Germany Italy Japan
Spain United Kingdom United States
37
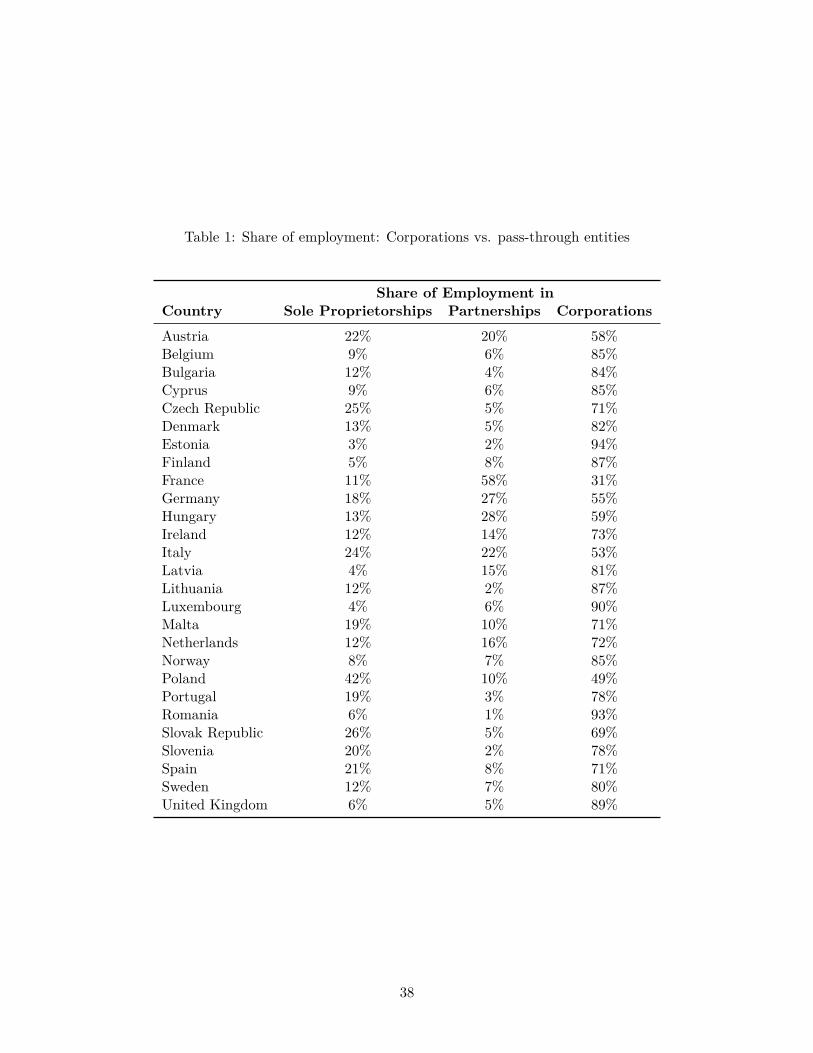
Table 1: Share of employment: Corporations vs. pass-through entities
Share of Employment inCountry Sole Proprietorships Partnerships CorporationsAustria 22% 20% 58%Belgium 9% 6% 85%Bulgaria 12% 4% 84%Cyprus 9% 6% 85%Czech Republic 25% 5% 71%Denmark 13% 5% 82%Estonia 3% 2% 94%Finland 5% 8% 87%France 11% 58% 31%Germany 18% 27% 55%Hungary 13% 28% 59%Ireland 12% 14% 73%Italy 24% 22% 53%Latvia 4% 15% 81%Lithuania 12% 2% 87%Luxembourg 4% 6% 90%Malta 19% 10% 71%Netherlands 12% 16% 72%Norway 8% 7% 85%Poland 42% 10% 49%Portugal 19% 3% 78%Romania 6% 1% 93%Slovak Republic 26% 5% 69%Slovenia 20% 2% 78%Spain 21% 8% 71%Sweden 12% 7% 80%United Kingdom 6% 5% 89%
38
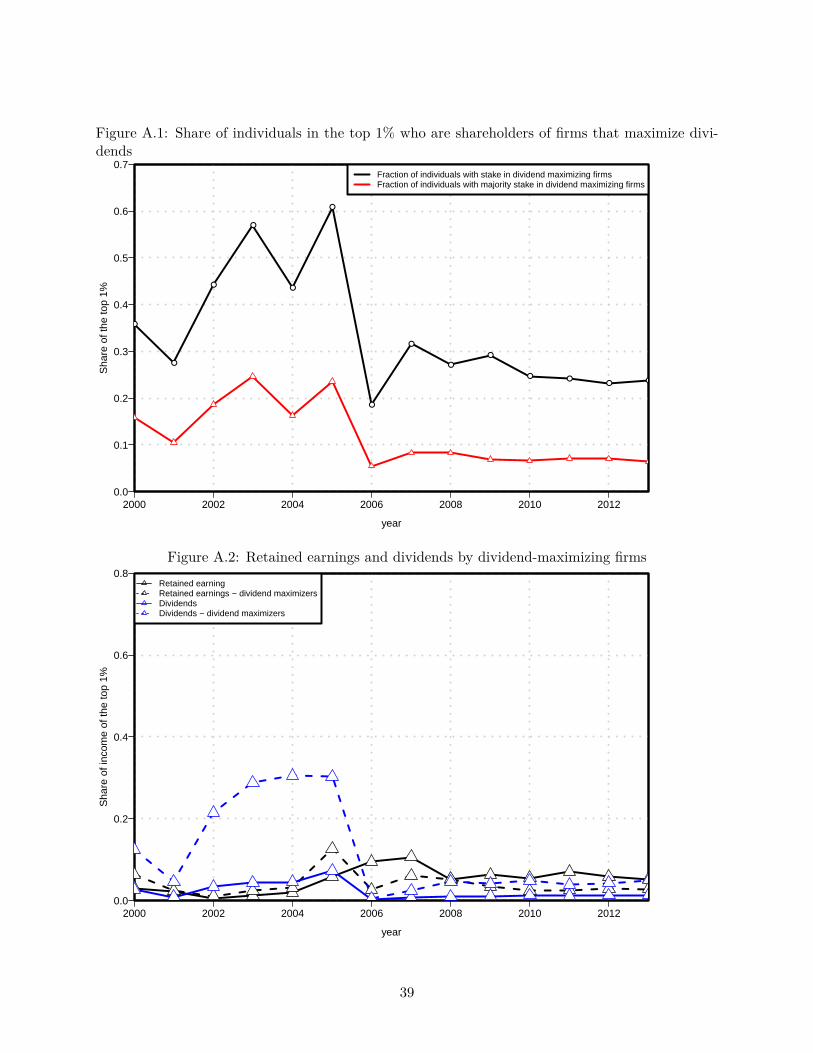
Figure A.1: Share of individuals in the top 1% who are shareholders of firms that maximize divi-dends
2000 2002 2004 2006 2008 2010 20120.0
0.1
0.2
0.3
0.4
0.5
0.6
0.7
year
Sha
re o
f the
top
1%
●
●
●
●
●
●
●
●
●
●
● ●● ●
Fraction of individuals with stake in dividend maximizing firmsFraction of individuals with majority stake in dividend maximizing firms
Figure A.2: Retained earnings and dividends by dividend-maximizing firms
2000 2002 2004 2006 2008 2010 20120.0
0.2
0.4
0.6
0.8
year
Sha
re o
f inc
ome
of th
e to
p 1%
Retained earningRetained earnings − dividend maximizersDividendsDividends − dividend maximizers
39