Accounting assignment
17
Page 1 SCHOOL OF ARCHITECTURE, BUILDING AND DESIGN THE DESIGN SCHOOL FOUNDATION IN NATURAL AND BUILD ENVIRONMENTS GROUP MEMBERS : LOH PEY MUN ( 0318572 ) MICHAEL CHANG VUI LOONG (031998) SIM SI KAI (0318609) COURSE : BASIC ACCOUNTING COURSE CODE : ACC30205 TITLE : FINANCIAL RATIO ANALYSIS LECTURER : MR.CHANG JAU HO SUBMISSION DATE : 16 JAN 2015
-
Upload
michael-chang -
Category
Education
-
view
40 -
download
7
Transcript of Accounting assignment
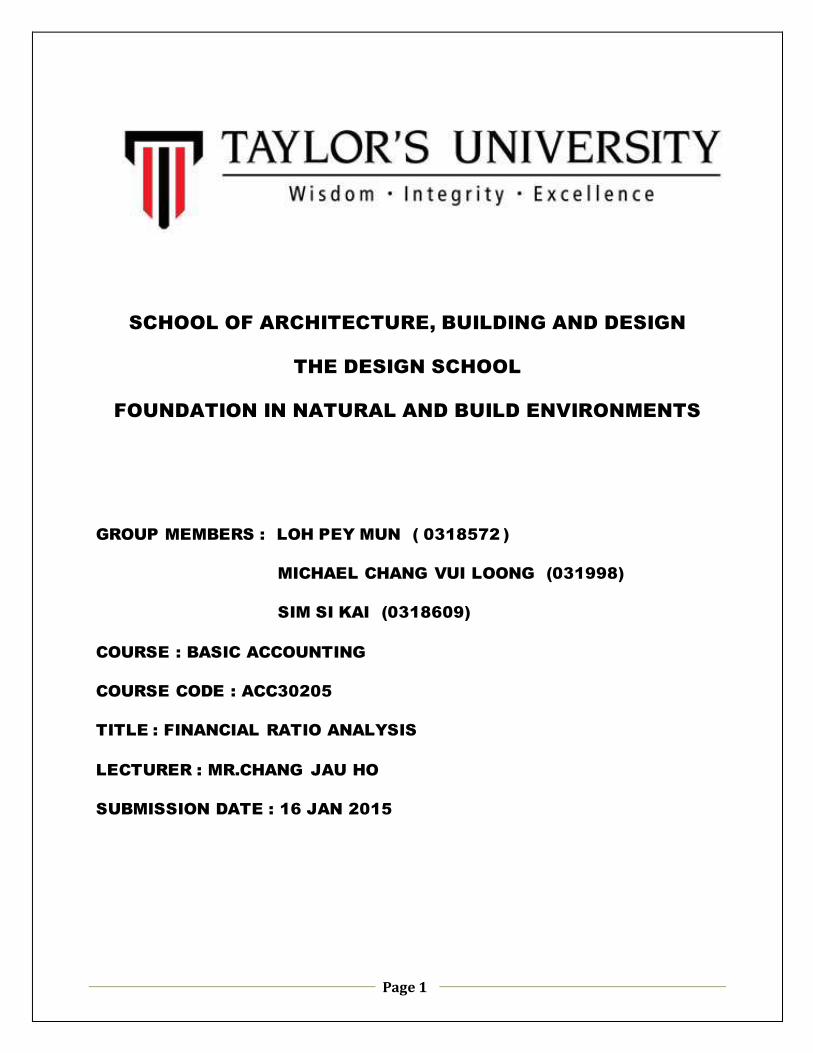
Page 1
SCHOOL OF ARCHITECTURE, BUILDING AND DESIGN
THE DESIGN SCHOOL
FOUNDATION IN NATURAL AND BUILD ENVIRONMENTS
GROUP MEMBERS : LOH PEY MUN ( 0318572 )
MICHAEL CHANG VUI LOONG (031998)
SIM SI KAI (0318609)
COURSE : BASIC ACCOUNTING
COURSE CODE : ACC30205
TITLE : FINANCIAL RATIO ANALYSIS
LECTURER : MR.CHANG JAU HO
SUBMISSION DATE : 16 JAN 2015
Page 2
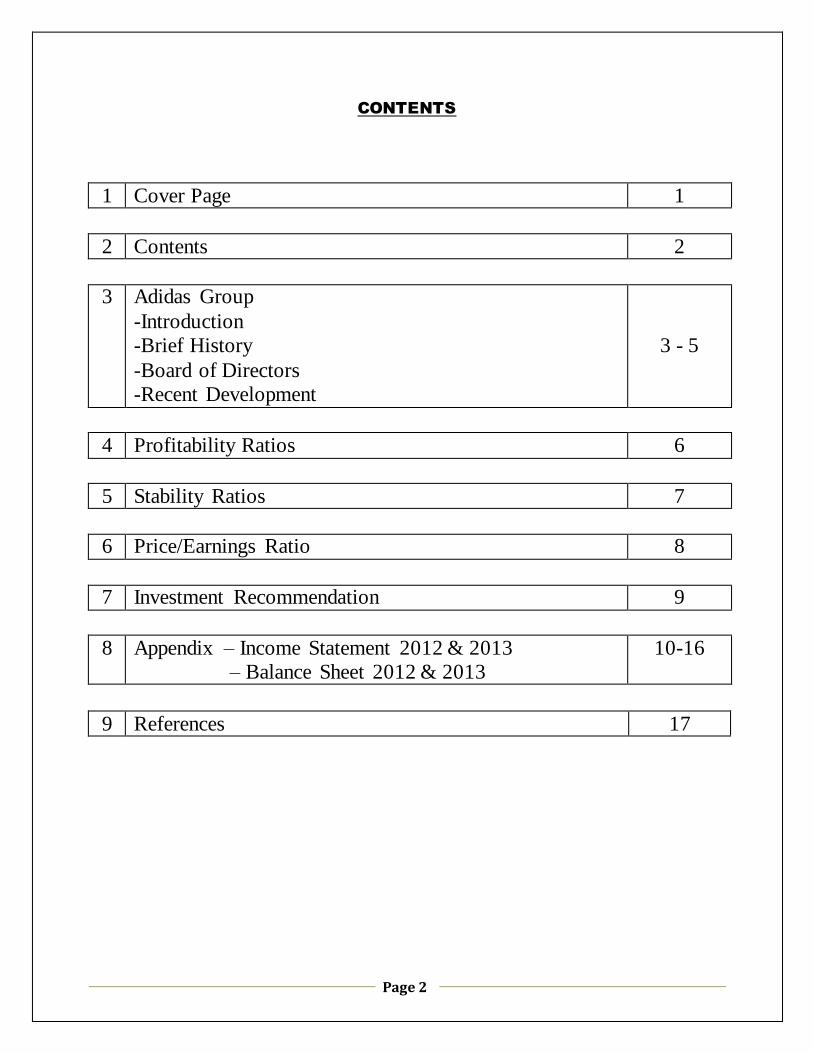
CONTENTS
1 Cover Page 1
2 Contents 2
3 Adidas Group
-Introduction
-Brief History
-Board of Directors
-Recent Development
3 - 5
4 Profitability Ratios 6
5 Stability Ratios 7
6 Price/Earnings Ratio 8
7 Investment Recommendation 9
8 Appendix – Income Statement 2012 & 2013
– Balance Sheet 2012 & 2013
10-16
9 References 17
Page 3
ADIDAS GROUP
INTRODUCTION
Adidas is a German multinational corporation that design and manufactures sports clothing and
accessories. The company is based in Herzogenaurach, Bararia, Germany. It is the holding
company for the Adidas Group which consists of the Reebook, TaylorMade-Adidas, Rockport,
FC Bayern Munich and Ashworth. Adidas is the biggest sport-wear manufacturer in Europe and
the second largest sport-wear manufacturer in the world, after Nike. The company’s products
designs classically feature 3 parallel bars, and the same motif is incorporated into Adidas’s
current official logo (below). The company revenue for 2013 was listed at 14.88 billion.
BRIEF HISTORY
Adidas was found by Adolf Dassler. On 1 July 1924, Adolf with his brother, Rudolf Dassler
which become Dassler Brothers Shoe Factory. By 1936 Summer Olympic, Adolf Dassler
persuaded U.S. sprinter Jesse Owens to use his product. It was the first sponsorship for an
African American. After that, both brothers joined the Nazi Party, but Rudolf more closely to the
party. After the war, Rudolf was chosen up by American soldiers and became the member of the
Waffen SS, he was felt that his brother betrayed him. 1947, the brothers split up. Rudolf formed
a new firm called Ruda (Puma).On August 18, 1949, Adolf registered the “Adi Dassler Adidas
Sportschunfabrik” and the famous Adidas 3-sreipes logo in Herzogenaurach. In 2005, Adidas
introduced the Adidas 1 , the first production shoe to use the microprocessor capable to perform
5 million calculations per second. On 11 April 2006, Adidas announced an 11-year deal to
become the official NBA clothes provider. For many years, Adidas has branded range of male
and female deodorants, perfumes, aftershave, lotions and other accessories.“Impossible is
Nothing ”become the slogan of Adidas. Nowadays, Adidas is one of the world’s popular brands.
Adolf Dassler
Page 4
BOARD OF DIRECTORS
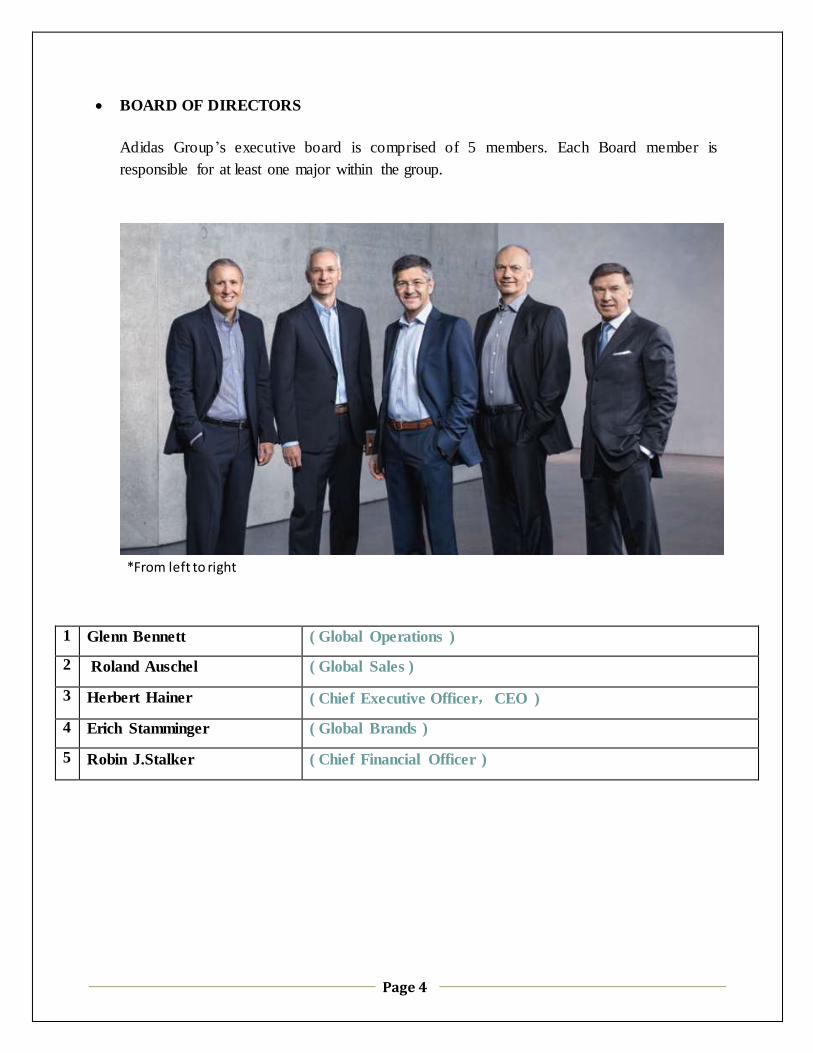
Adidas Group’s executive board is comprised of 5 members. Each Board member is
responsible for at least one major within the group.
*From left to right
1 Glenn Bennett ( Global Operations )
2 Roland Auschel ( Global Sales )
3 Herbert Hainer ( Chief Executive Officer,CEO )
4 Erich Stamminger ( Global Brands )
5 Robin J.Stalker ( Chief Financial Officer )
Page 5
RECENT DEVELOPMENT
Adidas Group attempts to be a global leader in the sporting goods industry with brand built upon
a passion for sports and sporting lifestyle. The developments of Adidas Group include Taylor
Made-Adidas Golf, Rockport and Reebook-CCM Hockey segments. All of these segments have
its own policy in place in order to address its specific target groups directly and further expand
its market share. As follows, they contribute together to our Group’s overall aim: to be the global
leader in the sporting industry.
Besides that, the ambition of the Adidas Group is to have a sustainable company. Their
company’s sustainability strategy is too entrenched in the Group’s value which is performance,
passion, integrity, and diversity. There have four pillars o f Adidas Group’s strategy are people,
product, planet and partnership. People, they hope that all workers will have a good
communication in order for their business to be presence in the market. For Product, they
increase the use sage of more sustainable materials. Other than that will be planet, they decrease
the environmental footmark of both their actions and their suppliers’ factories. Finally,
partnership, they involve their critical shareholders and cooperate with partners to improve the
industry.
Page 6
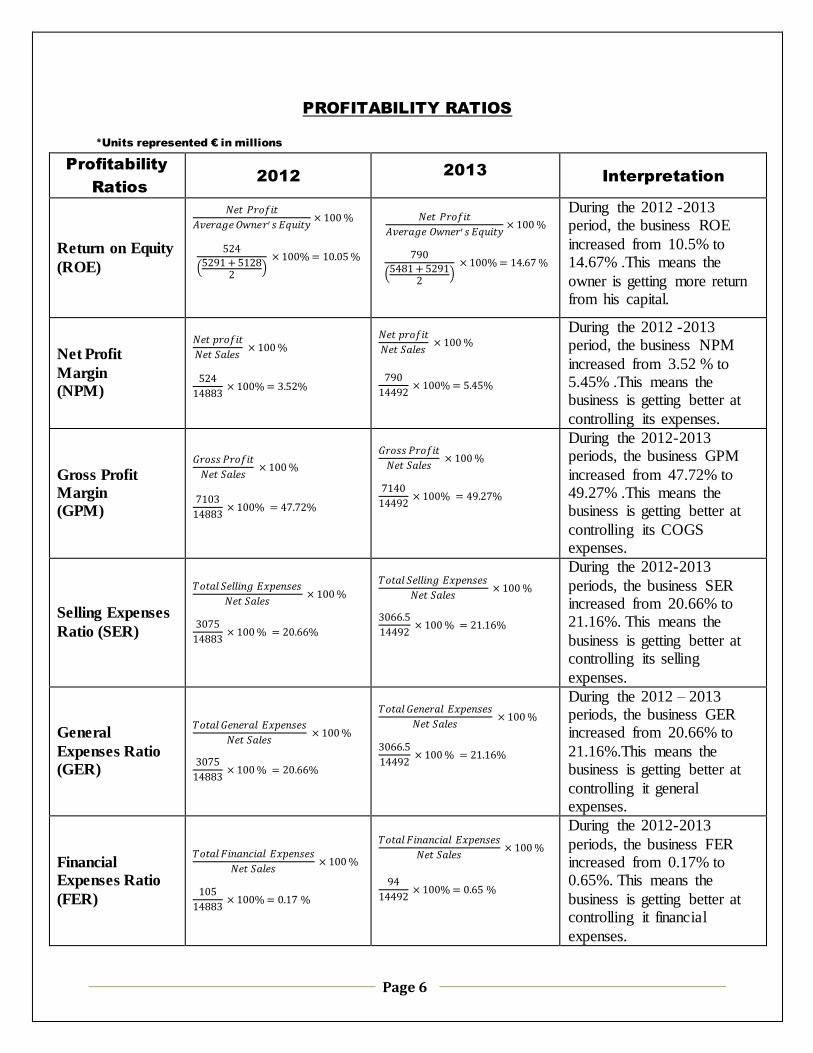
PROFITABILITY RATIOS
*Units represented € in millions
Profitability
Ratios
2012 2013
Interpretation
Return on Equity
(ROE)
𝑁𝑒𝑡 𝑃𝑟𝑜𝑓𝑖𝑡
𝐴𝑣𝑒𝑟𝑎𝑔𝑒 𝑂𝑤𝑛𝑒𝑟′ 𝑠 𝐸𝑞𝑢𝑖𝑡𝑦× 100 %
524
(5291 + 51282
) × 100% = 10.05 %
𝑁𝑒𝑡 𝑃𝑟𝑜𝑓𝑖𝑡
𝐴𝑣𝑒𝑟𝑎𝑔𝑒 𝑂𝑤𝑛𝑒𝑟′ 𝑠 𝐸𝑞𝑢𝑖𝑡𝑦× 100 %
790
(5481 + 52912
) × 100% = 14.67 %
During the 2012 -2013 period, the business ROE
increased from 10.5% to 14.67% .This means the
owner is getting more return from his capital.
Net Profit
Margin
(NPM)
𝑁𝑒𝑡 𝑝𝑟𝑜𝑓𝑖𝑡
𝑁𝑒𝑡 𝑆𝑎𝑙𝑒𝑠 × 100 %
524
14883 × 100% = 3.52%
𝑁𝑒𝑡 𝑝𝑟𝑜𝑓𝑖𝑡
𝑁𝑒𝑡 𝑆𝑎𝑙𝑒𝑠 × 100 %
790
14492 × 100% = 5.45%
During the 2012 -2013 period, the business NPM
increased from 3.52 % to 5.45% .This means the business is getting better at
controlling its expenses.
Gross Profit
Margin
(GPM)
𝐺𝑟𝑜𝑠𝑠 𝑃𝑟𝑜𝑓𝑖𝑡
𝑁𝑒𝑡 𝑆𝑎𝑙𝑒𝑠 × 100 %
7103
14883 × 100% = 47.72%
𝐺𝑟𝑜𝑠𝑠 𝑃𝑟𝑜𝑓𝑖𝑡
𝑁𝑒𝑡 𝑆𝑎𝑙𝑒𝑠 × 100 %
7140
14492 × 100% = 49.27%
During the 2012-2013 periods, the business GPM
increased from 47.72% to 49.27% .This means the business is getting better at
controlling its COGS expenses.
Selling Expenses
Ratio (SER)
𝑇𝑜𝑡𝑎𝑙 𝑆𝑒𝑙𝑙𝑖𝑛𝑔 𝐸𝑥𝑝𝑒𝑛𝑠𝑒𝑠
𝑁𝑒𝑡 𝑆𝑎𝑙𝑒𝑠 × 100 %
3075
14883 × 100 % = 20.66%
𝑇𝑜𝑡𝑎𝑙 𝑆𝑒𝑙𝑙𝑖𝑛𝑔 𝐸𝑥𝑝𝑒𝑛𝑠𝑒𝑠
𝑁𝑒𝑡 𝑆𝑎𝑙𝑒𝑠 × 100 %
3066.5
14492 × 100 % = 21.16%
During the 2012-2013
periods, the business SER increased from 20.66% to 21.16%. This means the
business is getting better at controlling its selling
expenses.
General
Expenses Ratio
(GER)
𝑇𝑜𝑡𝑎𝑙 𝐺𝑒𝑛𝑒𝑟𝑎𝑙 𝐸𝑥𝑝𝑒𝑛𝑠𝑒𝑠
𝑁𝑒𝑡 𝑆𝑎𝑙𝑒𝑠 × 100 %
3075
14883 × 100 % = 20.66%
𝑇𝑜𝑡𝑎𝑙 𝐺𝑒𝑛𝑒𝑟𝑎𝑙 𝐸𝑥𝑝𝑒𝑛𝑠𝑒𝑠
𝑁𝑒𝑡 𝑆𝑎𝑙𝑒𝑠 × 100 %
3066.5
14492 × 100 % = 21.16%
During the 2012 – 2013 periods, the business GER increased from 20.66% to
21.16%.This means the business is getting better at
controlling it general expenses.
Financial
Expenses Ratio
(FER)
𝑇𝑜𝑡𝑎𝑙 𝐹𝑖𝑛𝑎𝑛𝑐𝑖𝑎𝑙 𝐸𝑥𝑝𝑒𝑛𝑠𝑒𝑠
𝑁𝑒𝑡 𝑆𝑎𝑙𝑒𝑠 × 100 %
105
14883 × 100% = 0.17 %
𝑇𝑜𝑡𝑎𝑙 𝐹𝑖𝑛𝑎𝑛𝑐𝑖𝑎𝑙 𝐸𝑥𝑝𝑒𝑛𝑠𝑒𝑠
𝑁𝑒𝑡 𝑆𝑎𝑙𝑒𝑠 × 100 %
94
14492 × 100% = 0.65 %
During the 2012-2013
periods, the business FER increased from 0.17% to 0.65%. This means the
business is getting better at controlling it financial
expenses.
Page 7
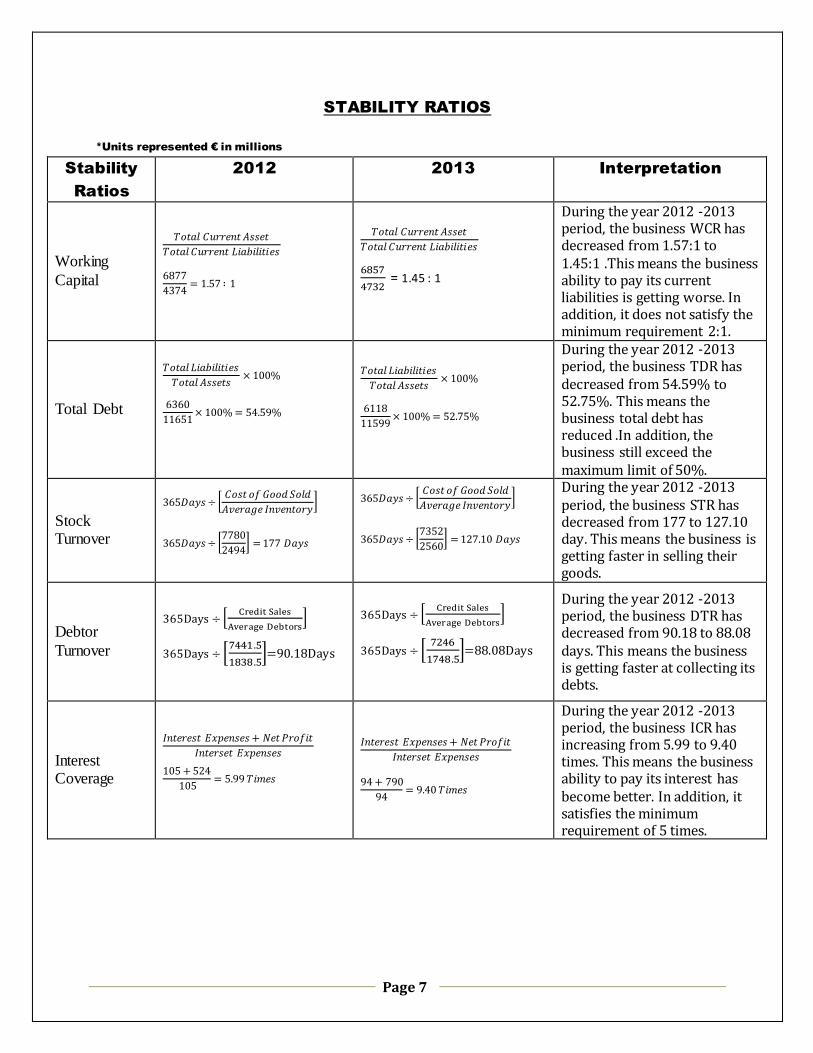
STABILITY RATIOS
*Units represented € in millions
Stability
Ratios
2012 2013 Interpretation
Working
Capital
𝑇𝑜𝑡𝑎𝑙 𝐶𝑢𝑟𝑟𝑒𝑛𝑡 𝐴𝑠𝑠𝑒𝑡
𝑇𝑜𝑡𝑎𝑙 𝐶𝑢𝑟𝑟𝑒𝑛𝑡 𝐿𝑖𝑎𝑏𝑖𝑙𝑖𝑡𝑖𝑒𝑠
6877
4374= 1.57 ∶ 1
𝑇𝑜𝑡𝑎𝑙 𝐶𝑢𝑟𝑟𝑒𝑛𝑡 𝐴𝑠𝑠𝑒𝑡
𝑇𝑜𝑡𝑎𝑙 𝐶𝑢𝑟𝑟𝑒𝑛𝑡 𝐿𝑖𝑎𝑏𝑖𝑙𝑖𝑡𝑖𝑒𝑠
6857
4732 = 1.45 : 1
During the year 2012 -2013 period, the business WCR has decreased from 1.57:1 to 1.45:1 .This means the business ability to pay its current liabilities is getting worse. In addition, it does not satisfy the minimum requirement 2:1.
Total Debt
𝑇𝑜𝑡𝑎𝑙 𝐿𝑖𝑎𝑏𝑖𝑙𝑖𝑡𝑖𝑒𝑠
𝑇𝑜𝑡𝑎𝑙 𝐴𝑠𝑠𝑒𝑡𝑠× 100%
6360
11651× 100% = 54.59%
𝑇𝑜𝑡𝑎𝑙 𝐿𝑖𝑎𝑏𝑖𝑙𝑖𝑡𝑖𝑒𝑠
𝑇𝑜𝑡𝑎𝑙 𝐴𝑠𝑠𝑒𝑡𝑠× 100%
6118
11599× 100% = 52.75%
During the year 2012 -2013 period, the business TDR has decreased from 54.59% to 52.75%. This means the business total debt has reduced .In addition, the business still exceed the maximum limit of 50%.
Stock Turnover
365𝐷𝑎𝑦𝑠 ÷ [𝐶𝑜𝑠𝑡 𝑜𝑓 𝐺𝑜𝑜𝑑 𝑆𝑜𝑙𝑑
𝐴𝑣𝑒𝑟𝑎𝑔𝑒 𝐼𝑛𝑣𝑒𝑛𝑡𝑜𝑟𝑦]
365𝐷𝑎𝑦𝑠 ÷ [7780
2494] = 177 𝐷𝑎𝑦𝑠
365𝐷𝑎𝑦𝑠 ÷ [𝐶𝑜𝑠𝑡 𝑜𝑓 𝐺𝑜𝑜𝑑 𝑆𝑜𝑙𝑑
𝐴𝑣𝑒𝑟𝑎𝑔𝑒 𝐼𝑛𝑣𝑒𝑛𝑡𝑜𝑟𝑦]
365𝐷𝑎𝑦𝑠 ÷ [7352
2560] = 127.10 𝐷𝑎𝑦𝑠
During the year 2012 -2013 period, the business STR has decreased from 177 to 127.10 day. This means the business is getting faster in selling their goods.
Debtor
Turnover
365Days ÷ [Credit Sales
Average Debtors]
365Days ÷ [7441.5
1838.5]=90.18Days
365Days ÷ [Credit Sales
Average Debtors]
365Days ÷ [7246
1748.5]=88.08Days
During the year 2012 -2013 period, the business DTR has decreased from 90.18 to 88.08 days. This means the business is getting faster at collecting its debts.
Interest Coverage
𝐼𝑛𝑡𝑒𝑟𝑒𝑠𝑡 𝐸𝑥𝑝𝑒𝑛𝑠𝑒𝑠 + 𝑁𝑒𝑡 𝑃𝑟𝑜𝑓𝑖𝑡
𝐼𝑛𝑡𝑒𝑟𝑠𝑒𝑡 𝐸𝑥𝑝𝑒𝑛𝑠𝑒𝑠
105 + 524
105= 5.99 𝑇𝑖𝑚𝑒𝑠
𝐼𝑛𝑡𝑒𝑟𝑒𝑠𝑡 𝐸𝑥𝑝𝑒𝑛𝑠𝑒𝑠 + 𝑁𝑒𝑡 𝑃𝑟𝑜𝑓𝑖𝑡
𝐼𝑛𝑡𝑒𝑟𝑠𝑒𝑡 𝐸𝑥𝑝𝑒𝑛𝑠𝑒𝑠
94 + 790
94= 9.40 𝑇𝑖𝑚𝑒𝑠
During the year 2012 -2013 period, the business ICR has increasing from 5.99 to 9.40 times. This means the business ability to pay its interest has become better. In addition, it satisfies the minimum
requirement of 5 times.
Page 8
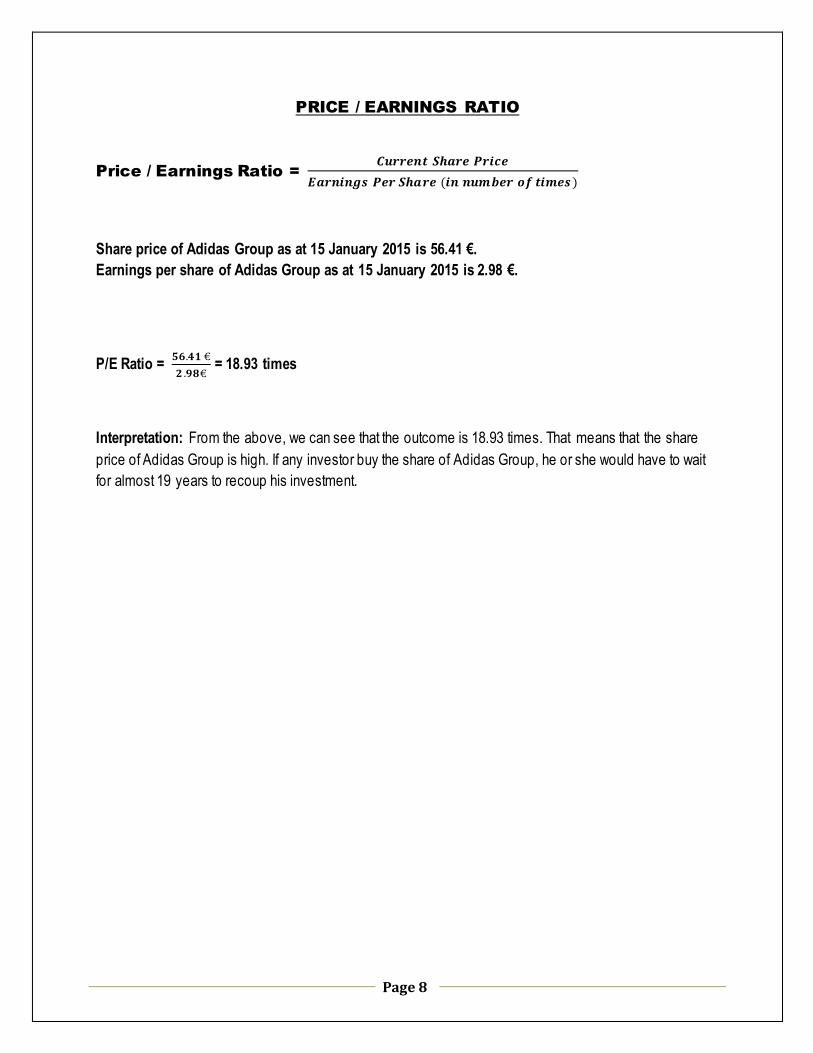
PRICE / EARNINGS RATIO
Price / Earnings Ratio = 𝑪𝒖𝒓𝒓𝒆𝒏𝒕 𝑺𝒉𝒂𝒓𝒆 𝑷𝒓𝒊𝒄𝒆
𝑬𝒂𝒓𝒏𝒊𝒏𝒈𝒔 𝑷𝒆𝒓 𝑺𝒉𝒂𝒓𝒆 (𝒊𝒏 𝒏𝒖𝒎𝒃𝒆𝒓 𝒐𝒇 𝒕𝒊𝒎𝒆𝒔 )
Share price of Adidas Group as at 15 January 2015 is 56.41 €.
Earnings per share of Adidas Group as at 15 January 2015 is 2.98 €.
P/E Ratio = 𝟓𝟔.𝟒𝟏 €
𝟐 .𝟗𝟖€ = 18.93 times
Interpretation: From the above, we can see that the outcome is 18.93 times. That means that the share
price of Adidas Group is high. If any investor buy the share of Adidas Group, he or she would have to wait
for almost 19 years to recoup his investment.
Page 9
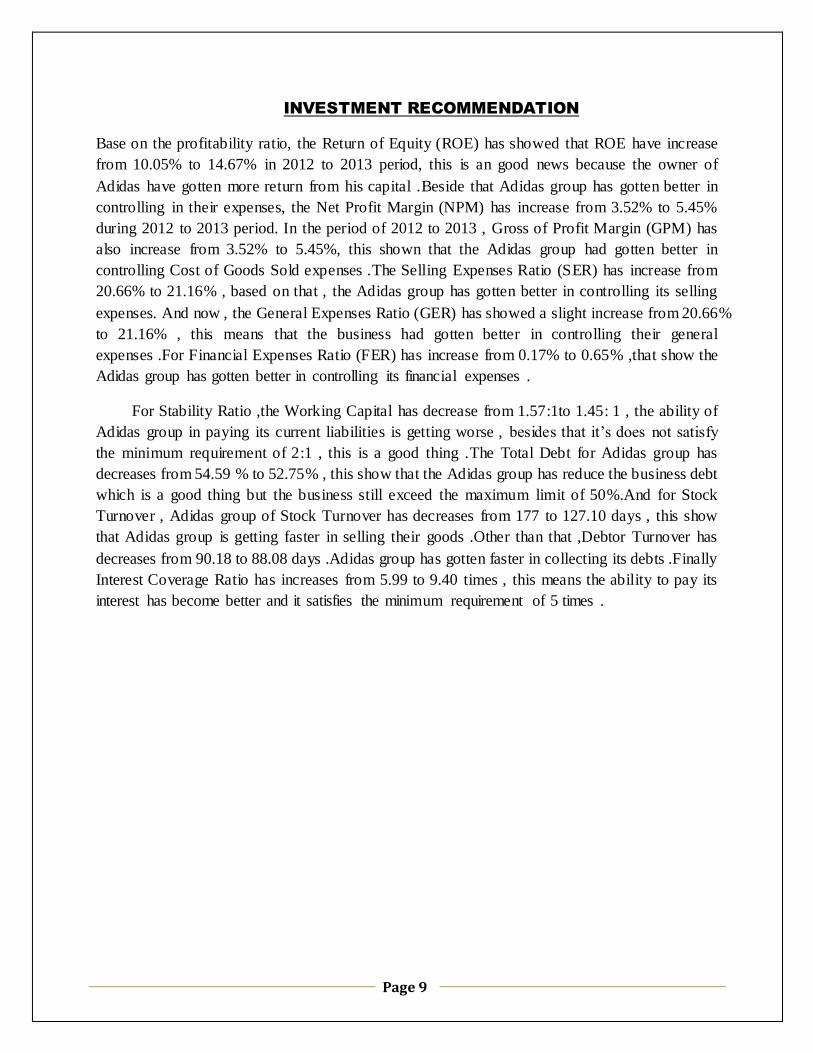
INVESTMENT RECOMMENDATION
Base on the profitability ratio, the Return of Equity (ROE) has showed that ROE have increase
from 10.05% to 14.67% in 2012 to 2013 period, this is an good news because the owner of
Adidas have gotten more return from his capital .Beside that Adidas group has gotten better in
controlling in their expenses, the Net Profit Margin (NPM) has increase from 3.52% to 5.45%
during 2012 to 2013 period. In the period of 2012 to 2013 , Gross of Profit Margin (GPM) has
also increase from 3.52% to 5.45%, this shown that the Adidas group had gotten better in
controlling Cost of Goods Sold expenses .The Selling Expenses Ratio (SER) has increase from
20.66% to 21.16% , based on that , the Adidas group has gotten better in controlling its selling
expenses. And now , the General Expenses Ratio (GER) has showed a slight increase from 20.66%
to 21.16% , this means that the business had gotten better in controlling their general
expenses .For Financial Expenses Ratio (FER) has increase from 0.17% to 0.65% ,that show the
Adidas group has gotten better in controlling its financial expenses .
For Stability Ratio ,the Working Capital has decrease from 1.57:1to 1.45: 1 , the ability of
Adidas group in paying its current liabilities is getting worse , besides that it’s does not satisfy
the minimum requirement of 2:1 , this is a good thing .The Total Debt for Adidas group has
decreases from 54.59 % to 52.75% , this show that the Adidas group has reduce the business debt
which is a good thing but the business still exceed the maximum limit of 50%.And for Stock
Turnover , Adidas group of Stock Turnover has decreases from 177 to 127.10 days , this show
that Adidas group is getting faster in selling their goods .Other than that ,Debtor Turnover has
decreases from 90.18 to 88.08 days .Adidas group has gotten faster in collecting its debts .Finally
Interest Coverage Ratio has increases from 5.99 to 9.40 times , this means the ability to pay its
interest has become better and it satisfies the minimum requirement of 5 times .
Page 10
APPENDIXES
Page 11
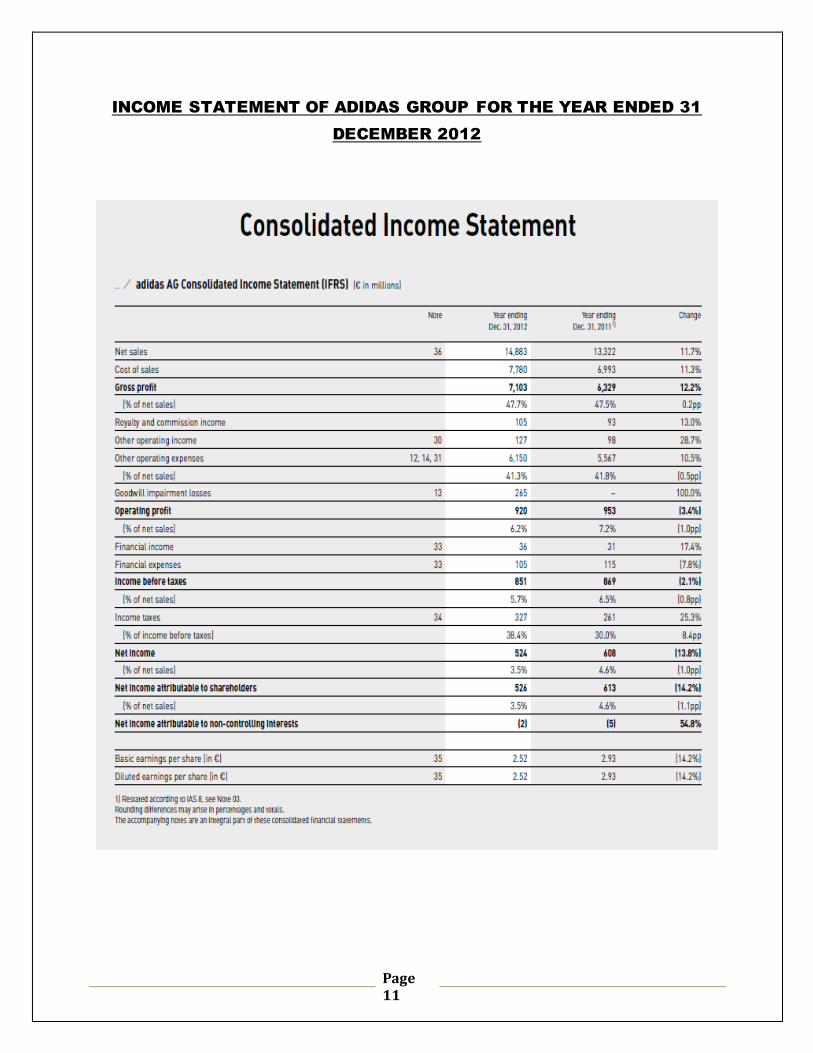
INCOME STATEMENT OF ADIDAS GROUP FOR THE YEAR ENDED 31
DECEMBER 2012
Page 12
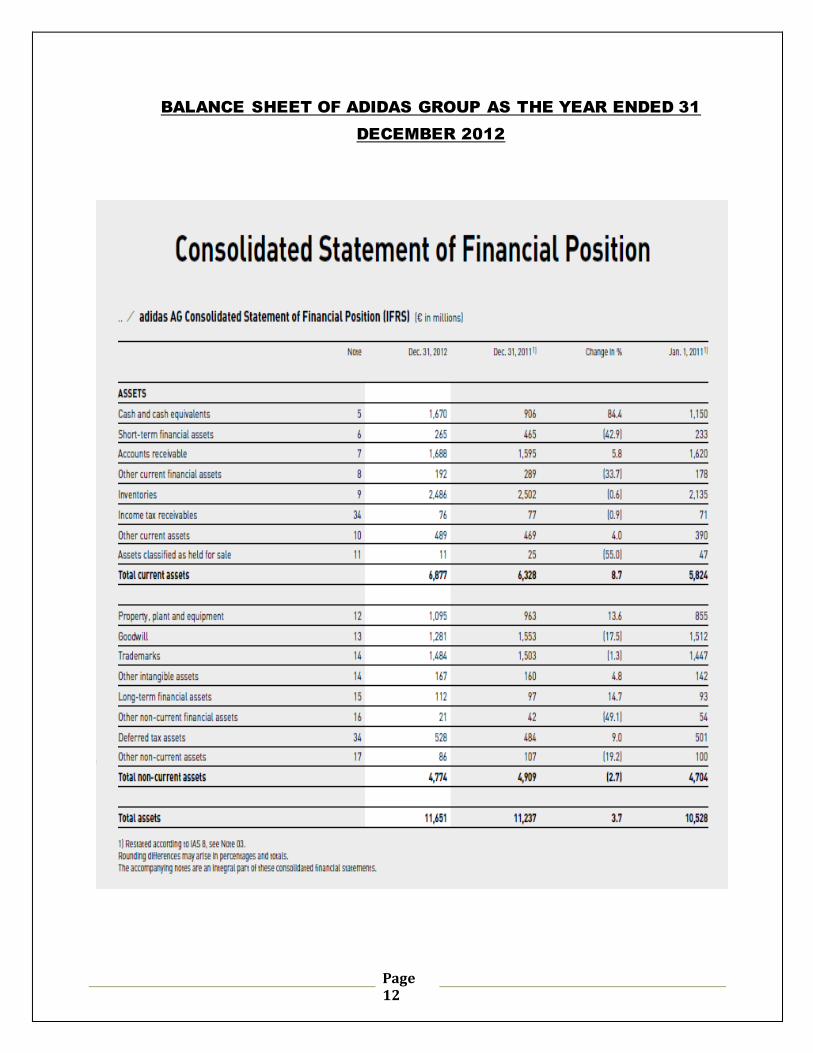
BALANCE SHEET OF ADIDAS GROUP AS THE YEAR ENDED 31
DECEMBER 2012
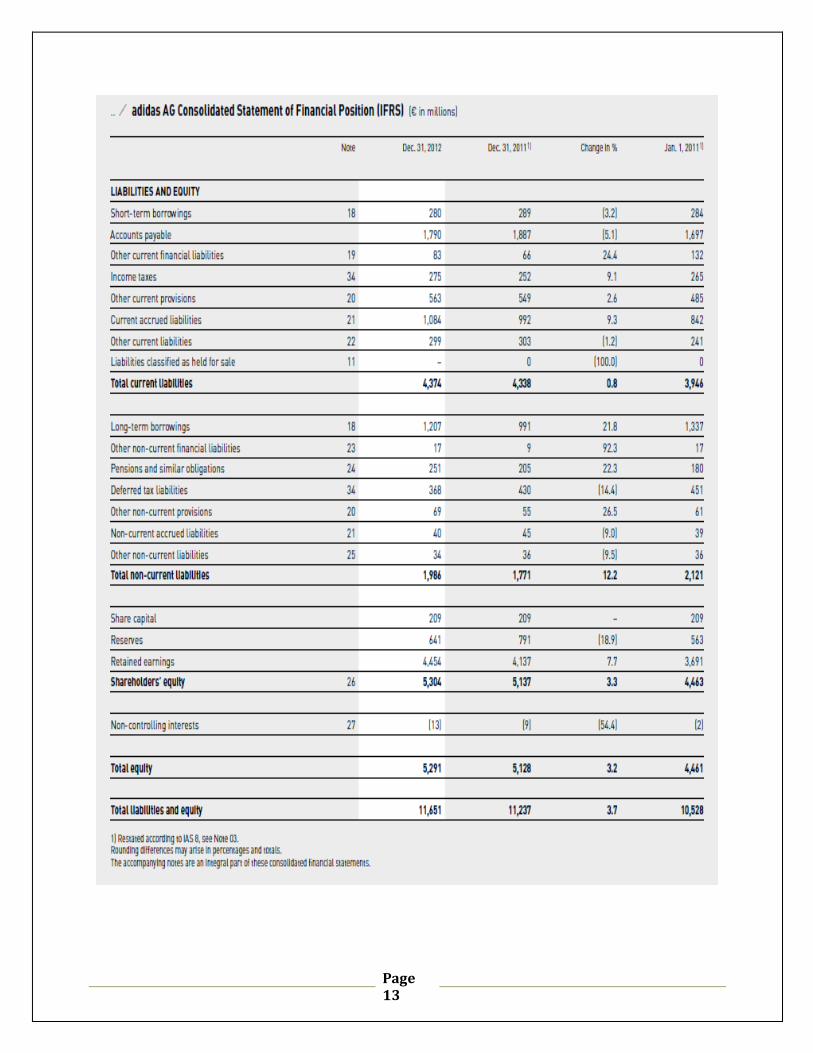
Page 13
Page 14
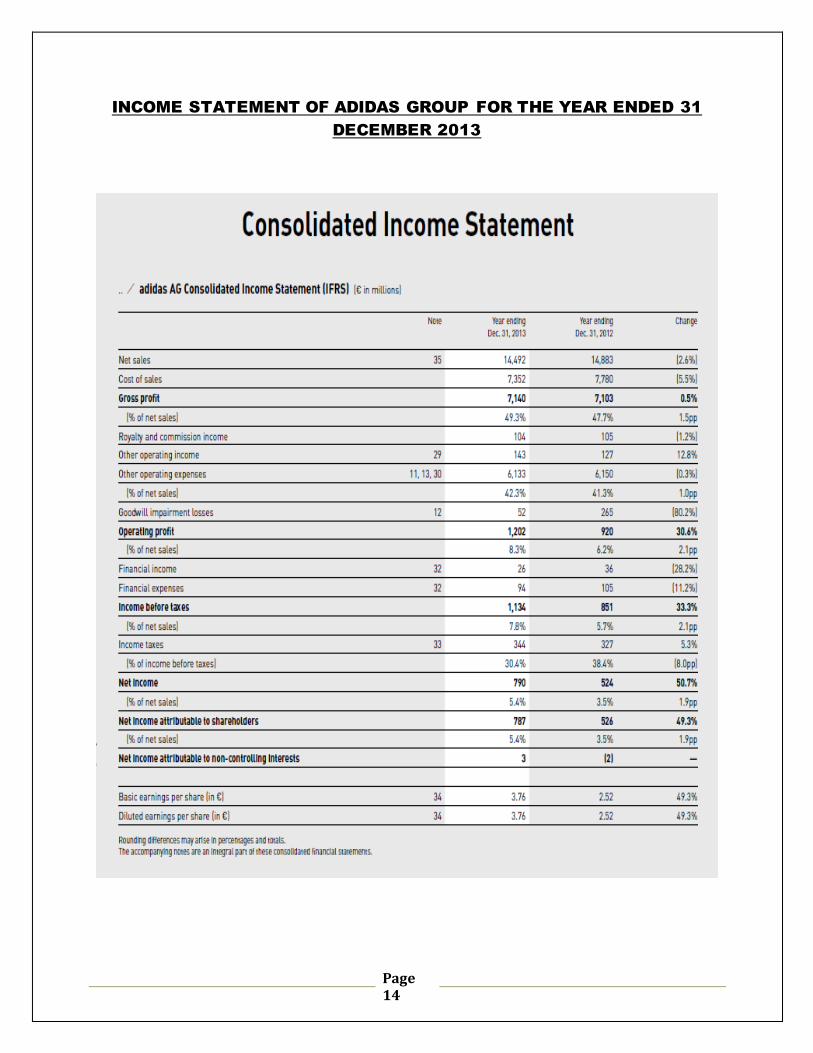
INCOME STATEMENT OF ADIDAS GROUP FOR THE YEAR ENDED 31
DECEMBER 2013
Page 15
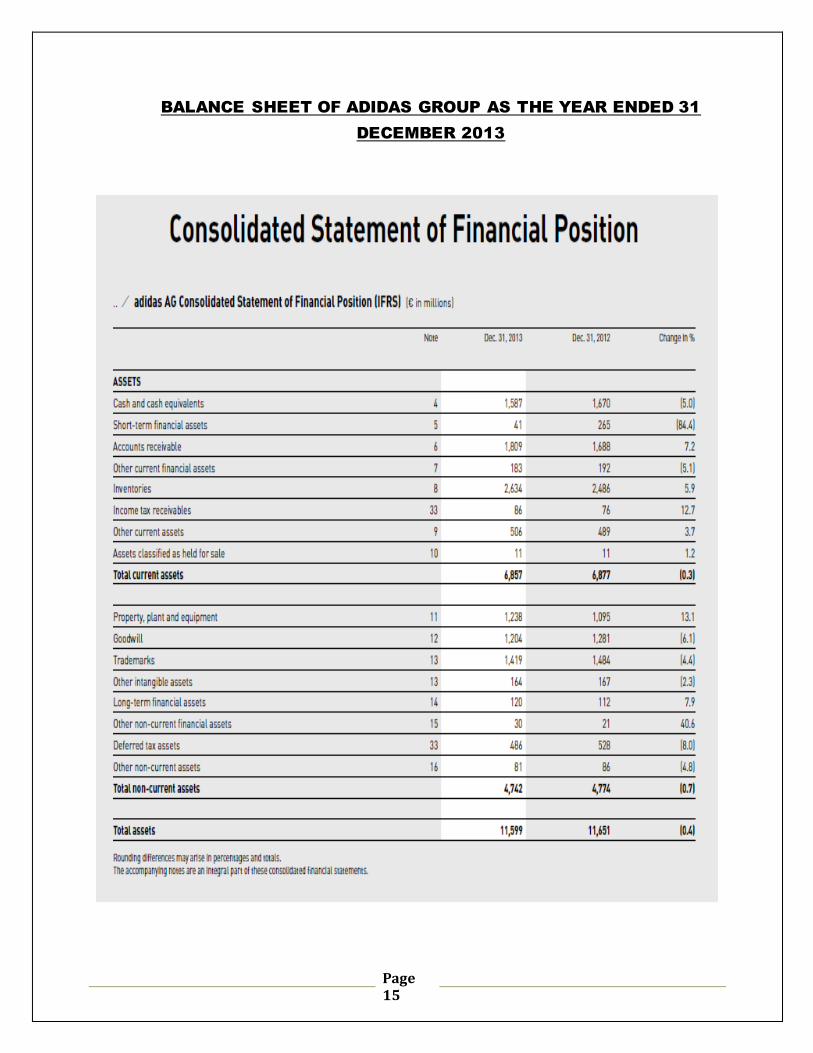
BALANCE SHEET OF ADIDAS GROUP AS THE YEAR ENDED 31
DECEMBER 2013

Page 16

Page 17
REFERENCES
1. Adidas Group Annual Report 2011
-http://www.adidas-group.com/media/filer_public/2014/03/05/adidas-
group_gb_2013_en.pdf
2. Adidas Group Annual Report 2012
-http://www.adidas-group.com/media/filer_public/2013/07/31/ gb_201
2_en.pdf
3. Brief Bio of Adidas Group
-http://www.adidas-group.com/en/group/history/
-http://www.adidas-group.com/en/group/profile/
-http://www.adidasuk.co.uk/Adidas_History
-http://taylorsadidas.blogspot.com/2013/04/history-of-addidas.html
-http://en.wikipedia.org/wiki/Adidas
4. Adidas Share Price and Financial Information
- http://www.adidas-group.com/en/investors/share/share-price/
- http://www.reuters.com/finance/stocks/analyst?symbol=ADSGn.DE
- http://data.cnbc.com/quotes/ADS-DE/tab/1