AccountAbility Sector
76
ACCOUNTABILITY SECTOR SEMI-ANNUAL BUDGET MONITORING REPORT FINANCIAL YEAR 2019/20 APRIL 2020 #DoingMore MOFPED
Transcript of AccountAbility Sector

AAccountability Sector: Semi-Annual Budget Monitoring Report - FY 2019/20
AccountAbility Sector
SEMI-ANNUAL BUDGET MONITORING
REPORT
FINANCIAL YEAR 2019/20
APRIL 2020
#DoingMoreMOFPED


APRIL 2020
#DoingMoreMOFPED
AccountAbility Sector
SEMI-ANNUAL BUDGET MONITORING
REPORT
FINANCIAL YEAR 2019/20

Ministry of Finance, Planning and Economic Development
iAccountability Sector: Semi-Annual Budget Monitoring Report - FY 2019/20
TABLE OF CONTENTS
Acronyms .................................................................................................................................................................... ii
Foreword .................................................................................................................................................................... iv
Executive Summary ............................................................................................................................................... v
Chapter 1: Background ......................................................................................................................................... 1
1.1 Accountability Sector Mandate ...................................................................................................................................2
1.2 Accountability Sector Outcomes, Objectives And Priorities .................................................................2
Chapter 2: Methodology ......................................................................................................................................4
2.1 Scope ..............................................................................................................................................................................................4
2.4 Limitations Of The Report ................................................................................................................................................4
Chapter 3: Sector Performance ........................................................................................................................6
3.1 Overall Sector Performance ......................................................................................................................................... 6
3.2 Vote 008 – Ministry Of Finance, Planning And Economic Development ................................... 6
3.2.1 Programme 1411 -Financial Sector Development .........................................................................................7
3.2.2 Financial Performance Of Central And Local Governments ..............................................................29
3.3: Vote 141: Uganda Revenue Authority ...................................................................................................................45
3.4: Vote 153: Public Procurement And Disposal Of Public Assets (PPDA) Authority ................52
Chapter 4: Conclusions And Recommendations ................................................................................... 58
4.1: Conclusion .............................................................................................................................................................................. 58
4.2: Recommendations ........................................................................................................................................................... 59
References...............................................................................................................................................................60
Annex ..........................................................................................................................................................................61

Ministry of Finance, Planning and Economic Development
ii Accountability Sector: Semi-Annual Budget Monitoring Report - FY 2019/20
ACRONYMS
AIA Appropriations in Aid
ASJAR Accountability Sector Joint Annual Review
BPED Budget Policy and Evaluation Department
BFP Budget Framework Paper
BMAU Budget Monitoring and Accountability Unit
BoU Bank of Uganda
CAO Chief Administrative Officer
CFO Chief Finance Officer
DDEG District Discretionary and Equalization Grant
DLG District Local Government
E-GP Electronic Government Procurement
FY Financial Year
GDP Gross Domestic Product
GoU Government of Uganda
IFMS Integrated Financial Management System
IG Inspectorate of Government
IPFs Indicative Planning Figures
IPPS Integrated Payroll and Pension System
KCCA Kampala Capital City Authority
LGA Local Government Act, CAP 243
LG Local Government
LGMSD Local Government Management and Service Delivery
MAAIF Ministry of Agriculture Animal Industry and Fisheries
MDAs Ministries, Departments and Agencies
MEMD Ministry of Energy and Mineral Development
MFPED Ministry of Finance Planning and Economic Development
MoES Ministry of Education and Sports
MOH Ministry of Health
MoICT Ministry of Information and Communications Technology
MoLG Ministry of Local Government
MoPS Ministry of Public Service
MoSTI Ministry of Science, Technology and Innovation
MoTIC Ministry of Trade, Industry and Cooperatives
MoWE Ministry of Water and Environment
MoWT Ministry of Works and Transport
NAADS National Agricultural Advisory Services Secretariat

Ministry of Finance, Planning and Economic Development
iiiAccountability Sector: Semi-Annual Budget Monitoring Report - FY 2019/20
NDP II Second National Development Plan
NITA National Information Technology Authority
NPA National Planning Authority
NTR Non-Tax Revenue
OAG Office of the Auditor General
OPM Office of prime Minister
PAR Portfolio at Risk
PBB Programme Based Budgeting
PBS Programme Based Budgeting System
PFM Public Financial Management
PFMA Public Financial Management Act
PHC Primary Health care
PPDA Public Procurement and Disposal of Public Assets Authority
PSM Public Sector Management
Q1 Quarter One
Q2 Quarter Two
Q3 Quarter Three
Q4 Quarter Four
REA Rural Electrification Agency
RFS Rural Financial Services
RMSP Rural Microfinance Support Project
SACCO Savings and Credit Cooperative Organization
SMEs Small and Medium Enterprises
TSA Treasury Single Account
UCSCU Uganda Cooperative Savings and Credit Union
Ug Shs Uganda Shillings
UNRA Uganda National Road Authority
URA Uganda Revenue Authority
URF Uganda Road Fund
VAT Value Added Tax

Ministry of Finance, Planning and Economic Development
iv Accountability Sector: Semi-Annual Budget Monitoring Report - FY 2019/20
FOREwORD
The Government strategy this Financial Year 2019/20 is to promote import substitution and
export promotion, and incentivize private sector development. It is envisioned that this will
be achieved through industrialization anchored on agriculture and agro-industrialization,
manufacturing, and mineral potential. This will also ensure inclusive growth and the creation
of jobs, while promoting development of other key primary growth sectors.
According to findings shared by the Budget Monitoring and Accountability Unit (BMAU), majority
of the sectors monitored got over 50% of their budget releases, however fair performance was
noted in terms of service delivery. This is attributed to the persistent challenges of delayed
procurement and poor planning which must be dealt with as the country moves to implement
the third National Development Plan.
This report is produced at time when the whole world is affected by the novel coronavirus
disease (COVID-19). It is prudent that the sectors devise cost effective means to ensure that
their stakeholders will still benefit from the government programmes/projects.
Keith Muhakanizi
Permanent Secretary and Secretary to the Treasury

Ministry of Finance, Planning and Economic Development
vAccountability Sector: Semi-Annual Budget Monitoring Report - FY 2019/20
ExECUTIvE SUMMARY
This report reviews performance of selected key Vote Functions and Programmes in the
Accountability Sector by 31st December, 2019. Monitoring was restricted to votes and
programmes whose interventions supported the Public Financial Management functions in
the Ministries, Departments, Agencies and Local Government (MDALGS).
Overall performance
Financial Sector Development Programme
The Microfinance Support Centre (MSC) contributes to the Accountability Sector thematic
area of Economic Management and serves the objective of increasing equitable access to
finance. Overall, the MSC achieved good performance at 75%. MSC disbursed loans worth Ug
shs 51.18bn against a target of Ug shs 35bn (146% performance) compared to Ug shs 18.03bn
disbursed at half year in the FY 2018/19.
The MSC offered lower interest rates to its clients ranging from: 9% per annum for Savings and
Credit Cooperative Organizations (SACCOs) agricultural loans, 11% for Teachers’ SACCO, 13% to
Small and Medium Enterprises (SMEs), and 17% for Commercial loans. This interest rate was
satisfactory as compared to the commercial rates that were on average at 23%.
The outstanding portfolio1 as at 31st December 2019 was Ug shs 134.7bn, an increase from Ug
shs 117.3bn registered at the end of FY 2018/19. This was mainly due to improved performance
of loan recovery, more rigorous follow-up campaign, and a reduction in written off loans. The
MSC built strategic partnerships to further deepen the uptake of the loan products.
Performance was hampered by: the long lead time (almost three months against a one month
target) it takes for clients to access loans, and applicants only receive a percentage of their
application; Subjecting repeat applicants taking follow on loans to the same requirements
earlier fulfilled is tedious; Groups and SACCOs were not focused around the same objective,
for example agriculture, fishing, and trade. This affects ability of their members to pay back
funds borrowed.
It is recommended that the MSC improves the duration for loan processing and terms for
follow-on clients.
Budget Preparation, Execution and Reporting Programme
The Programme Based Budgeting System (PBS) was rolled out in government to 100% of
the MDA& LGs. The PBS was in use and improved the planning and budgeting process in
government. The interfaces with the Integrated Financial Management System (IFMS) and
Integrated Payroll and Pension System (IPPS) were developed. The procurement plan was also
maintained on the PBS. Although the PBS was in use the reporting is on outputs, not outcomes
as is envisioned under Programme Based Budgeting.
1 Funds disbursed and held out in loans at given time.

Ministry of Finance, Planning and Economic Development
vi Accountability Sector: Semi-Annual Budget Monitoring Report - FY 2019/20
The timeliness of accessing funds (involves issuing cash limits, warranting and approval of
warrants) was timely, however the supplementary and/or reallocations of LG budgets were
delayed, and in 90% of the cases not granted within a given quarter. This affects budget
performance.
It is recommended that the Ministry of Finance, Planning and Economic Development (MFPED)
issues timelines for approval of supplementary budgets, and the related cash limits especially
those arising from the LGs.
vote 153: Public Procurement and Disposal of Public Assets
The Public Procurement and Disposal of Public Assets Authority (PPDA) falls under the thematic
area of Budget Execution and Accountability with the objective to enhance public contract
management and performance.
Overall the PPDA achieved 70.31% of its semi-annual targets which was good. Through the
PPDA three regional offices in Gulu, Mbale and Mbarara, the Procuring and Disposal Entities
(PDEs) in MDAs and LGs were regularly supported in the development of procurement plans
and reviewing quarterly performance. The use of a register of providers to offer reliable and
updated information to entities also contributed to a greater performance and efficiency.
A total of 2,030 service providers were registered, of which 937 were new. The PPDA obtained and
tracked procurement plans from at least 75% central government PDEs. The implementation
status of the E-Government Procurement was at 67%, but integration with the IFMS and PBS
was not yet achieved.
It was noted that the PPDA-Hybrid method used for procurement of contractors for the
construction of seed schools and Health Centre IIIs under the Inter Government Fiscal Transfer
Project delayed completion of construction works.
It is recommended that the PPDA advisory function should give guidance on the efficient
implementation of the Hybrid method to avoid delays in execution of some contracts.
vote 141: Uganda Revenue Authority
The Uganda Revenue Authority (URA) contributes to the thematic area of resource mobilization
and allocation, and to the objective of increasing the tax to gross domestic product (GDP) ratio.
Overall there was good performance by URA at 90% attainment of targets.
The tax register grew by 63,979 new taxpayers representing 40% of the target. A net revenue of
Ug shs 9,042.01bn was realised during the half year period against a target of Ug shs 9,739.39bn
(93% performance), and was 9% of the GDP to tax ratio. There are six Ones Stop Boarder
Posts (OSBP) that include Malaba, Busia, Mutukula, Mirama Hills, Katuna and Elegu. Through
these, URA is able to clear goods faster, carry out joint border control and collaboration with
other states on tax initiatives. Goods from Uganda to Rwanda were suspended thus affecting
collections at the Mirama border. The drive through scanner at Mutukula was not yet in use,

Ministry of Finance, Planning and Economic Development
viiAccountability Sector: Semi-Annual Budget Monitoring Report - FY 2019/20
while at Mirama Hills, installation of scanners was not yet done. From the regions, access to
E-tax services was satisfactory. There were 11 unplanned system down times, but the average
system recovery was less than two hours.
It was noted that LGs issued licenses to businesses/individuals without Tax Identification
Numbers (TINS) which contributed to low collections. Although outreaches were conducted,
some business communities in Arua and Masaka districts complained about the inadequate
time availed for the outreaches, and failure to address their concerns.
Challenges
• Failure to address the business community concerns raised in outreaches.
• The requirement to file returns for periods prior to registration of businesses arising in the
middle of a financial year discourages voluntary registration.
• Inadequate collaboration between government institutions and business communities.
Recommendations
• The URA should review engagements with stakeholders with a possibility of giving
responses to concerns raised.
• The URA should support the newly registered businesses to complete returns for periods
prior to registration within a financial year.
• The URA should strengthen collaborations with the MDAs and LGs through sensitizations.

Ministry of Finance, Planning and Economic Development
viii Accountability Sector: Semi-Annual Budget Monitoring Report - FY 2019/20

Ministry of Finance, Planning and Economic Development
1Accountability Sector: Semi-Annual Budget Monitoring Report - FY 2019/20
ChAPTER 1: BACkGROUND
The mission of the Ministry of Finance, Planning and Economic Development (MFPED) is, “To
formulate sound economic policies, maximize revenue mobilization, and ensure efficient allocation
and accountability for public resources so as to achieve the most rapid and sustainable economic
growth and development”. It is in this regard that the ministry gradually enhanced resource
mobilization efforts and stepped up funds’ disbursement to Ministries, Departments, Agencies
and Local Governments in the past years to improve service delivery.
Although some improvements have been registered in citizens’ access to basic services,
their quantity and quality remains unsatisfactory, particularly in the sectors of health,
education, water and environment, agriculture and roads. The services being delivered are
not commensurate to the resources that have been disbursed, signifying accountability and
transparency problems in the user entities.
The Budget Monitoring and Accountability Unit (BMAU) was established in FY2008/09 in
MFPED to provide comprehensive information for removing key implementation bottlenecks.
The BMAU is charged with tracking implementation of selected government programmes or
projects and observing how values of different financial and physical indicators change over
time against stated goals and targets (how things are working). This is achieved through semi-
annual and annual field monitoring exercises to verify receipt and application of funds by the
user entities. Where applicable, beneficiaries are sampled to establish their level of satisfaction
with the public service.
The BMAU prepares semi-annual and annual monitoring reports of selected government
programmes and projects. The monitoring is confined to levels of inputs, outputs and
intermediate outcomes in the following areas:
• Accountability
• Agriculture
• Infrastructure (Energy and Roads)
• Industrialization
• Information and Communication Technology
• Science, Technology and Innovation
• Social Services (Education, Health, and Water and Environment); and
• Public Sector Management
This report presents the findings from field monitoring of selected Votes and Programmes in
the Accountability Sector for the budget execution period of July to December 2019. The field
exercises were conducted during January to February 2020.

Ministry of Finance, Planning and Economic Development
2 Accountability Sector: Semi-Annual Budget Monitoring Report - FY 2019/20
1.1 Accountability Sector Mandate
The Accountability sector contributes to the fourth objective of the Second National
Development Plan (NDP II). Which is to Strengthen Mechanisms for Quality, Effective and
Efficient Service Delivery. The sector is concerned with the mobilization, management and
fostering accountability for the utilization of public resources to facilitate the delivery of quality
and equitable services.
The sector is composed of two sub-sectors of i) Economic and Financial Management Services
and ii) Audit, these are further categorized in four thematic areas that include: Economic
Management; Resource Mobilization and Allocation; Budget Execution and Accounting; and
Audit and Anti-Corruption.
1.2 Accountability Sector Outcomes, Objectives and Priorities
The Accountability Sector focuses on three main outcomes i.e Sustainable Macroeconomic
Stability; Fiscal credibility and Sustainability; and Value for Money in the Management of Public
Resources. In accordance with the NDP II, the outcomes and thematic areas, the sector aims
to achieve the following objectives.
No Outcomes Accountability Sector Objectives
1. Fiscal Credibility and Sustainability
Resource Mobilization and Allocation Thematic Area1. Increase the tax to GDP ratio2. Improve public financial management and consistency in
the economic development framework
2. Value for Money in the Management of Public Resources
Budget Execution and Accountability Thematic Area1. Enhance public contract management and performance2. Improve compliance with accountability rules and
regulations3. Increase public demand for accountabilityAudit/Anti-Corruption Thematic Area1. Enhance the prevention detection and elimination of
corruption2. Improve collaboration and networking amongst
development institutions
3. Sustainable Macro Economic Stability
Economic Management Thematic Area1. Increase equitable access to finance2. Increase private investments3. Reduce interest rates4. Increase insurance penetration5. Increase national savings to GDP ratio6. Increase the level of capitalization and widen investment
opportunities in the capital markets7. Improve statistical data production and policy research8. Protect financial systems and the broader economy
from the threats of money laundering and the financing terrorism
The sector objectives are achieved through financing undertaken through ten votes, namely:
i) Vote 008 Ministry of Finance, Planning and Economic Development, ii) Vote 103 Inspectorate
of Government(IG),iii)Vote 112 Ethics and Integrity, iv) Vote 129 Financial Intelligence Authority,
v) Vote 131 Office of the Auditor General , vi) Vote 141 Uganda Revenue Authority vii) Vote 143

Ministry of Finance, Planning and Economic Development
3Accountability Sector: Semi-Annual Budget Monitoring Report - FY 2019/20
Uganda Bureau of Statistics, viii)Vote 153 Public Procurement and Disposal of Public Assets
Authority, ix) Vote 310 Uganda Investment Authority. x) Vote 130 Treasury operations.
Other sector institutions include; Bank of Uganda, National Planning Authority, Ministry of
Public Service (Inspectorate), Ministry of Local Government (Inspectorate), Kampala Capital
City Authority (Revenue Directorate), Local Government Finance Commission, Private Sector
Foundation of Uganda, Capital Markets Authority, Uganda Retirements Benefits Regulatory
Authority, National Social Security Fund, Economic Policy and Research Centre, Insurance
Regulatory Authority, Uganda Development Bank Limited, Uganda Free Zones Authority,
Uganda Microfinance Regulatory Authority, Uganda National Lotteries and Gaming Board and
Microfinance Support Centre.

Ministry of Finance, Planning and Economic Development
4 Accountability Sector: Semi-Annual Budget Monitoring Report - FY 2019/20
ChAPTER 2: METhODOLOGY
2.1 Scope
This report is based on selected programmes that encompass three out of the four thematic
areas of the Accountability Sector. The thematic areas covered include: resource mobilization
and allocation, budget execution and accounting, and economic management.
The selected areas focus on mainly four of the second National Development Plan (NDP II)
objectives: Increase in equitable access to finance, reduce interest rates; increase the tax
to GDP ratio; improve the public financial management and consistency in the economic
development frameworks; and enhance public contract management and performance.
Annex 1 shows the votes and programmes monitored under the sector.
2.2 Methodology
Physical performance of planned outputs was assessed through monitoring a range of
indicators and linking the progress to the reported expenditure. Performance objectives and
targets were as well considered.
2.3 Sampling
Purposive sampling was used in determining the regions monitored and in turn random
sampling applied to select the institutions especially the LGs. Priority was given to monitoring
verifiable outputs.
2.4 Data Collection
Data was collected from various sources through a combination of approaches
• Review of secondary data sources including: Ministerial Policy Statements for FY
2019/20. Quarterly performance reports from the Programme Budgeting System (PBS),
Accountability sector reports, the Microfinance Support Centre Strategic Plan (2014-19).
Approved Estimates of Revenue and Expenditure FY 2019/20.
• Review and analysis of data from the integrated Financial Management System (IFMS) and
the MSC Solomon system.
• Key informant interviews with Accounting Officers and Heads of Sections/Units.
• Field visits to MSC zonal offices institutions and groups and LGs URA and PPDA zonal offices
for primary data collection, observation and photography.
• Call-backs in some cases to triangulate information.
• Analysis of financial performance the 11 priority sectors2 based on the budget, release and
expenditure for sector votes that are on the Integrated Financial Management (IFMS). The
Budget Operations Table (BOT) and the Programme Budgeting System (PBS) for the FY
2019/20 were reviewed for the triangulation of data.
2 Accountability, Agriculture, Education, Energy, Health, Information and Communications Technology, Trade and industry, Public Sector Management, Roads sub-sector, Science Technology and Innovations, Water and Environment.

Ministry of Finance, Planning and Economic Development
5Accountability Sector: Semi-Annual Budget Monitoring Report - FY 2019/20
• Integrated Financial Management System (IFMS) data showing releases, payments and
commitments, interviews with the respective responsible officers and observations on site.
2.5 Data Analysis
The data was analysed using both qualitative and quantitative approaches. Comparative
analysis was done from prior year reports FY 2018/19. Relative importance of given outputs
monitored and its relative contribution to an objective.
The approved annual budget for each output was considered were applicable divided by the
total annual budgets for all outputs of a particular programme/project. The weight of output
and percentage achieved for each output were multiplied to derive the weighted physical
performance. A summation of the weighted scores was then taken for the programme.
Performance of monitored projects and programmes was rated based on the following criteria.
Table 2.1: Assessment guide to measure performance of projects monitored in FY 2019/20
Score Comment
90% and above very Good (Most of the set targets achieved and funds absorbed)
70%-89% Good (Some core set targets achieved, and funds absorbed to 70%-89%)
50%- 69% Fair (Few targets achieved, and funds absorption is 50%-69%)
Less than 50% Poor (No targets achieved and or funds absorption is less than 50%)
2.6 Limitations of the report
i. Absence of some respondents during monitoring yet appointments were made.
ii. Inconsistences between the information provided by respondents and that given in reports.

Ministry of Finance, Planning and Economic Development
6 Accountability Sector: Semi-Annual Budget Monitoring Report - FY 2019/20
ChAPTER 3: SECTOR PERFORMANCE
3.1 Overall Sector Performance
GoU half Year Financial Performance
The overall GoU approved budget for FY2019/20 was Ug shs 40,487bn, which was revised to
Ug shs 41,530bn on account of a supplementary budget of Ug shs 1,043bn.
The GoU approved budget excluding external financing, arrears and Appropriation in Aid (AIA)
was Ug shs 30,404bn, of which the allocation to Ministries, Departments, Agencies, and Local
Governments (MDA and LGs) was Ug shs 20,083bn (49.6% of the GoU approved budget), and
debt payments Ug shs 10,739bn (25% of the GoU approved budget).
The GoU release performance to the MDALGs as at 31st December 2019 was 56% (Ug shs
11,203bn) of the approved budget to MDALGs and, 88% (9,836bn) was absorbed by 31st
December 2019 - which was good performance.
Debt and treasury operations performed at Ug shs 4,887bn representing 46% of the approved
budget.
Accountability Sector Financial Performance
The Government of Uganda (GoU) approved budget for the Accountability Sector3 (excluding
treasury operations, Local Governments (LGs) and Kampala Capital City Authority (KCCA) for
the FY 2019/20 is Ug shs 1,431bn. The sector budget was revised to Ug shs 1,455bn through
a supplementary budget of Ug shs 24.146bn, representing 2% of the sector approved budget.
The revisions were towards; sub-programme 1521-Resource Enhancement and Accountability
Programme (REAP) (Ug shs 5bn) for consultancy services, sub-programme 54- Support to
MFPED (Ug shs 7.625bn) towards IFMS recurrent costs and sub-programme 52-Uganda
Retirement Benefits Regulatory Authority Services (Ug shs 7.236bn) under other government
transfers.
The overall release for the sector was 44% (Ug shs 636.015bn) of the approved budget, of
which 91% (Ug shs 576.607bn) was spent by 31st December 2019.
3.2 vote 008 – Ministry of Finance, Planning and Economic Development
The Ministry of Finance, Planning and Economic Development (MFPED) is mandated to
formulate policies that enhance stability and development; mobilize local and external financial
resources for public expenditure; regulate financial management and ensure efficiency in public
expenditure; oversee national planning and strategic development initiatives for economic
growth. The MFPED plays a critical role in fulfilling the Accountability Sector’s outcomes and
objectives
3 For Accountability Sector votes with funding/releases on the IFMS in the FY 2018/19.

Ministry of Finance, Planning and Economic Development
7Accountability Sector: Semi-Annual Budget Monitoring Report - FY 2019/20
3.2.1 Programme 1411 -Financial Sector Development
Following the restructuring of the MFPED, the Microfinance Vote Function was reclassified
as Financial Sector Development Programme with a broader mandate to promote financial
sector development and ensure financial stability. Under this programme, the Microfinance
Support Center Ltd was monitored.
The Microfinance Support Centre Limited
Background
The Microfinance Support Centre (MSC) was established by the Government of Uganda in
2001 as the main vehicle for delivering affordable finance to communities to enable them
to increase their employment levels, production and incomes. Specifically, the institution
manages microfinance funds on behalf of Government, both micro-credit and micro-grants.
As a manager of Government microfinance funds, the MSC operates 12 regional offices and
4 Satellite Offices covering the entire country supported by over 129 Agency Savings and
Credit Cooperative Organizations (SACCOs)/institutions and works in partnership with other
collaborative and implementing organisations.
The main function of MSC is to identify, appraise, select, disburse and monitor both micro-credit
and grant funds to target beneficiaries aimed at enhancing rural income and employment
creation. A Board of Directors appointed by Government governs the company. It has so far
executed its mandate through the implementation of five-year strategic plans, during which
credit and capacity building services were extended to 2,540 partner organizations/clients
countrywide ultimately reaching over 2.5 million beneficiaries out of which 52% are women
and youth.
The Strategic Plan 2014-19 identified the following strategic objectives4:
1. To mobilize enough resources so as to effectively deliver rural financial development
services
2. Establish reference institutions in every district in Uganda
3. To increase loan portfolio by 10% per annum
4. To maintain portfolio at risk (P.A.R) past 365 days at 5%
5. To identify and fill capacity building gaps of clients
6. To achieve 30 days lead time for loan processing
7. Achieve interest rates below commercial lending rates
8. To develop at least one product for each client segment over the next five years
In doing its work, MSC is guided by the national priorities as stipulated in the National
Development plans, the 23 Presidential Strategic Guidelines (2019-21) in particular social
economic transformation through support to the Agriculture sector through provision of
affordable financing. MSC has established agency SACCOs to bring services closer to the
4 These formed the basis of assessment of the performance of the MSC

Ministry of Finance, Planning and Economic Development
8 Accountability Sector: Semi-Annual Budget Monitoring Report - FY 2019/20
people which are also model SACCOs at each district for learning purposes and practical
technical support to other SACCOs in the area.
The MSC targets the provision of affordable financial services to SACCOs/institutions, Micro
Finance Institutions (MFIs), Small Medium Enterprises (SMEs), Groups and more importantly
the provision of financing of agricultural chains including assets, inputs, and purchase of crop
and other produce.
In order to take services nearer to the communities, the company offers its services through
12 zonal offices across the country, with each office serving an average of 10 districts. The MSC
offers a number of products administered through its offices to the clients and these include;
Agricultural loans, Environmental loans, Special interest group loans, Islamic Financing,
Commercial loans and SME loans for trade and commerce and agriculture.
Monitoring Scope
The semi-annual review involved conducting monitoring visits to the MSC headquarters
and zonal offices of Arua, Jinja, Hoima, Lira, Kampala, Kabale, Lira, Ngoma Satellite Office in
Nakaseke, Masaka, Mbale, Mbarara and Soroti in January 2020.
Three institutions and two group beneficiary were sampled and district commercial officers
of Amuru, Bukedea, Gulu, Kagadi, Kikuube, Kabale, Kayunga, Kibaale, Kumi, Kyankwanzi, Lira,
Mayuge, Mbale, Nakaseke, Ntungamo, Rwampara, Tororo and Wakiso.
The performance of the MSC was monitored to assess;
1. The provision of financial services to the poor through SACCOs, Groups, Small and Medium
Enterprises (SMEs) and Teachers’ SACCOs.
2. Mobilization of resources to effectively deliver rural financial development services.
3. The level of financial inclusiveness to the population through affordability and accessibility.
4. The performance of various MSC products that include; Agricultural loans, Commercial
loans, Special interest group loans and Environment loans.
5. The level and effect of business development services provided by the MSC to the clients.
6. Linkages and collaborations formed between the MSC and other institutions to enhance
MSC interventions.

Ministry of Finance, Planning and Economic Development
9Accountability Sector: Semi-Annual Budget Monitoring Report - FY 2019/20
Findings
(a) MSC headquarters
Assessment of MSC Funding
Credit Performance
In FY 2019/20, MSC was allocated Ug shs 61.29bn, of which Ug shs 3.57bn was operational
budget (for salaries of contract staff, social security contributions and gratuity payment), while
Ug shs 54.72bn was credit funds for on lending, and Ug shs 3bn for mobilization and revival of
cooperatives throughout the country.
Table 3.1: Sources of funding for MSC for the FY 2019/20
Particulars Planned FY 2019/20 (Ug shs)
Actual Ug 2019/20 (Ug shs)
%ge Release Performance against
target
Allocations for operations 3,570,000,000 3,570,000,000 100
Reflows 39,720,000,000 39,720,000,000 100
Allocations for Mobilization of Cooperatives
3,000,000,000 3,000,000,000 100
Other income (GoU Credit funds) 15,000,000,000 15,000,000,000 100
Total Funds Available 61,290,000,000 61,290,000,000 100
Source: MSCL Headquarters
Interest rates
The MSC continued to offer the lowest interest rates to its clients ranging from 9% per annum
for SACCOs- agricultural loans, 13% to SMEs, 17% for the commercial loans, and 11% for the
Teachers’ SACCO. This interest rate performance was satisfactory compared to the commercial
rates that were on average 23%.
Credit Disbursement
During the period July to December 2019, MSC disbursed loans worth Ug shs 51.18bn against
a target of Ug shs 35bn (146% performance) compared to Ug shs 18.03bn disbursed by the
company in July to December 2018. This was a great improvement compared to the previous
year. Ug shs 43.1bn (84%) was from conventional financing, while Ug shs 8.04bn (16%) was
funded under Islamic Financing.
The MSC continued to market all loan products to different client categories. As at 31st
December 2019, the company had a 14.8% increase in outstanding portfolio to Ug shs 134.7bn
from Ug shs 117.3bn at 30th June 2019.
A total of 544 loans/facilities were disbursed. Growth in disbursements was partly attributed
to intensified initiatives by the company to reach out to the youth and women through rural
mobilization, sensitization and training, projects in regional offices and collaboration with
partners, local government, CBOs and favourable loan conditions.

Ministry of Finance, Planning and Economic Development
10 Accountability Sector: Semi-Annual Budget Monitoring Report - FY 2019/20
Table 3.2: Disbursement by Loan Product Q1 & Q2 FY 2019/20
Half Year Disbursements per Loan Product
Product Number Amount (Ug. shs)
Islamic Finance 31 8,042,421,500
Teachers’ Loan 11 1,423,000,000
Special Interest Group loans 302 10,820,923,000
Commercial loan 76 10,023,576,416
Agricultural loans 124 20,875,400,000
TOTAL 544 51,185,320,916
Source: MSCL Headquarters
Figure 1: Disbursements by client category as at 31st December 2019
Source: MSC Head Office
Zonal Disbursements
Kampala Zone with the biggest region had Ug shs11.2bn disbursed, the highest in value of
regional loans disbursed. This performance was better than the half year performance in FY
2018/19 of Ug shs 5.070bn. The poorest performing zone was Moroto that disbursed loans
valued at Ug shs 421 million, less than the half year performance of 2018/19 of Ug shs 460m.
Details of the performance per zone is shown in table 3.3.

Ministry of Finance, Planning and Economic Development
11Accountability Sector: Semi-Annual Budget Monitoring Report - FY 2019/20
Table 3.3 Analysis of Disbursements per Zone as at 31st December 2018 and 2019
Zone FY 2018/19(July-Dec)Amount Disbursed
FY 2019/2020(July-Dec) Amount Disbursed
Increase/Decrease
Arua 361,000,000 1,242,810,899 -881,810,899
Gulu/Lira 3,082,000,000 1,048,733,000 2,033,267,000
Hoima 1,515,000,000 1,084,400,000 430,600,000
Jinja/Iganga 640,000,000 1,177,000,000 -537,000,000
Kabale 1,205,000,000 1,740,000,000 -535,000,000
Kabarole 1,639,000,000 2,062,500,000 -423,500,000
Kampala 5,070,000,000 11,226,700,000 -6,156,700,000
Masaka 2,005,000,000 3,974,490,000 -1,969,490,000
Mbale 716,000,000 1,641,300,000 -925,300,000
Mbarara 2,210,000,000 7,371,000,000 -5,161,000,000
Moroto 460,000,000 421,000,000 39,000,000
Soroti 178,000,000 1,385,265,962 -1207,265.962
Head office 0 16,810,121,055 -16,810,121,055
Total 19,081,000,000 51,185,320,916 -32,104,320,916
Source: MSC Head office
Growth in Portfolio
The outstanding portfolio5 as at 31st December 2019 was Ug shs 134.7bn, an increase from
Ug shs 117.3bn registered at the end of FY 2018/19. This was mainly due to the improved
performance of the loan recovery, a more rigorous follow-up campaign and a reduction in
written off loans. Partnerships were strengthened and improved BDS impact as more reference
SACCOs and extension workers were established across the country.
Quality of Portfolio
Portfolio at Risk (PAR)6 greater than 30 days- was 22% by December 2019 compared to 21% in
December 2018.
Growth in Clientele and Number of Loans
Under the pillar, Client Coverage and Product Development, there are 2 strategic objectives;
1. Increase coverage of MSC services & products, and
2. Enhance product development
Performance of “Increase coverage of MSC services and products”
The company intensified the engagement and support to create reference SACCOs across
all the zones in order to improve information dissemination and create awareness about
MSC products and services, provide technical assistance and share good practice to support
weaker SACCOs.
5 Funds disbursed and held out in loans at given time.6 Measures loan portfolio with outstanding instalments

Ministry of Finance, Planning and Economic Development
12 Accountability Sector: Semi-Annual Budget Monitoring Report - FY 2019/20
As at 31st December 2019, 71% of districts had at least one Reference SACCOs/institutions (115
institutions) indicating a slight decline compared to 77% as at end of the previous FY. The
SACCOs identified were undergoing capacity building to meet criteria for Reference SACCOs.
However, this is expected to increase as the new strategic plan considers other institutions
not only SACCOs as reference institutions.
Through community mobilizations, a total of 8,121 individuals were reached in Luwero, Kyotera
and Lira districts. Individuals were offered guidance on relevance of saving culture, formation
of groups and Village Savings and Lending Associations (VSLAs) methodology, record
keeping, governance, registration, compliance and this resulted in increased disbursements
as individuals formed viable groups and accessed affordable financing from MSC.
Revival of cooperatives commenced for two (2) SACCOs in Kampala and Kasese districts
through MSC Business Development Services.
Business Development Services (BDS)
The company provided BDS support to 320 client institutions against the target of 150
representing 213% performance achievement. A total of 4,400 individuals were trained
comprising of 2,110 women and 2,290 male, of which 40% were youth.
The total number of individual members reached/supported were 25,284 (comprising of 11,178
women, 12,110 men and 1,996 youth) in partner organizations, thus surpassed the target of
reaching 10,000 beneficiaries, representing 252% performance.
Partnerships building continues to be core to MSC’s interventions, reflecting commitment
to business growth in terms of clients, resource mobilization, product development and
sustainability.
The MSC through its partnerships development agenda, engaged 9 partners: Goal Global
(Uganda) to implement a two-year irrigation technology based initiative for facilitating over
1,875 youths engagement in agribusiness; International Fertilizer Development Centre (IFDC)
to ensure that farmer groups and service providers have better access to financial products
and services; Integrated Community, Agriculture and Nutrition (ICAN) a USAID project to
enhance a skills training scheme for over 500 adolescent girls and young women in Kisoro
District; United Nations High Commissioner for Refugees (UNHCR) to implement economic
livelihood projects especially for refugees and host communities; Mgahinga Cultural and
Crafts Centre; Management Training and Advisory Centre (MTAC); AlHuda Centre of Islamic
Banking & Economics; Savings Banks Foundation for International Cooperation (SBFIC); and
HABITAT Uganda all tailored to support social-economic development.
In order to scale up Islamic micro financing, through a collaboration between the Imams
Development Forum and Operation Wealth Creation, the UMC trained 429 Imams in all the
divisions of Kampala. These efforts are aimed at creating more awareness, strengthening the
Kampala District Imams SACCO, which was registered on 3rd September 2019, and delivering
more inclusive financial services.

Ministry of Finance, Planning and Economic Development
13Accountability Sector: Semi-Annual Budget Monitoring Report - FY 2019/20
The Centre partnered with Ministry of Local Government to implement the Local Economic
Growth Support (LEGS). District project orientation and revalidation of sites was conducted
in 177 LEGS districts and 41 out of the 98 profiled projects were appraised. Technical capacity
requirements for the profiled projects were also mapped and an action plan to close the gaps
developed. Some of the critical needs identified relate to governance, financial management,
record keeping & MIS, enterprise management, VSLA methodology, marketing, business and
strategic planning, risk management, auditing, interpretation of financial reports among other
aspects.
Challenges
The MSC has focused on increasing outreach of rural financial services; member savings
growth and development particularly through SACCOs and cooperatives; employment
enhancement and the provision of affordable credit through innovative product development.
In has encountered the following challenges.
1. Loan default by some client institutions mainly due to failed businesses, fraud and
inadequate policy framework to enforce recovery.
2. Inadequate credit financing compared to the annual demand. In the last 10 years, MSC has
disbursed loans averaging Ug shs 26bn annually (at interest rates of 13% per annum (p.a.)
for SMEs and 9% for SACCOs in the agricultural value chains). This is against an average
annual demand of Ug shs 167bn.
3. Limited outreach centres to effectively cover the entire country. The company operates 12
regional offices, 4 satellite offices countrywide and has directly supported the establishment
of demonstration or reference SACCOs in various districts to improve services delivery.
Expansion of the structure is limited by operational fund.
Zonal Offices Monitored
The MSC’s 12 zonal offices include; Arua, Hoima, Jinja, Kabale, Kabarole, Kampala, Lira, Masaka,
Mbale, Mbarara, Moroto and Soroti. For the semi-annual review, the zonal offices of Arua, Jinja,
Hoima, Lira, Kampala, Kabale, Mbale, Masaka, Mbarara, Ngoma Statelite Office and Soroti were
visited.
The objective was to;
Confirm products and services offered to clients and assess the performance of zonal offices
from the clients served and obtain details of clients served.
The products offered to clients include;
1. Agricultural loan: Funds are extended to support activities along the agricultural value
chain such as productivity enhancement, asset acquisition, bulk purchasing, collective
marketing and construction of farm housing. Funding is also extended to support
environmental and clean energy products.
7 Adjumani, Alebtong, Buikwe, Bunyangabu, Buyende, Gomba, Kabalore, Katakwi, Kibuku, Kumi, Kyenjojo, Luwero, Nakaseke, Ntoroko, Nwoya, Rukungiri, Tororo.

Ministry of Finance, Planning and Economic Development
14 Accountability Sector: Semi-Annual Budget Monitoring Report - FY 2019/20
2. Group Loan: Credit is extended through microfinance intermediaries/partner organizations:
and where necessary directly to registered groups. The intermediaries may be SACCO,
Microfinance Institutions and NGOs.
3. Commercial loan: This targets SMEs and financial institutions for on lending to members
engaged in trade, small scale manufacturing, home improvement and service industry.
4. Asset Financing Loan: Extended to clients who require assets especially for value addition
and production enhancement. Funding is provided for 80% for the asset cost. The client is
expected to meet the remaining 20%.
5. Teacher’s SACCO Fund: Extended to registered Teachers’ SACCO for on-lending to their
members.
6. Common User Facility/Community Asset: The MSC leases assets in form of machinery
or equipment to target beneficiaries at an agreed rental fee for an agreed period of time,
after which legal ownership of the asset is transferred to the beneficiaries. It also targets
special interest groups such as youth, artisans (metal fabricators, brick makers, welders,
carpenters, salon operators, tailors, among others) that may in need of equipment or
machinery commonly used by the group but unaffordable to them.
7. Islamic Microfinance administered through five mode; Musharaka (equity financing
partnership), Murabaha (cost plus sharing), Mudaraba (profit sharing), Salam (forward sale),
Istisna (is a long-term contract to be delivered at a future date for an agreed fixed price).
(b) Arua MSC Zonal Office
Arua zone covers 11 districts of West Nile i.e. Arua, Maracha, Koboko, Yumbe, Moyo, Adjumani,
Nebbi, Pakwach, Zombo, Obongi and Okollo
From July to December 2019, the zonal office disbursed Ug shs 1.24bn against a target of Ug
shs 975 million (127% performance) with an outstanding loan portfolio of Ug shs 2.25bn against
a target of Ug shs 2.5bn. The cumulative repayment rate was 40% compared to 31% as at June
2019, pointing to inefficiencies in recovery of loans. The zonal office maintained 6 districts with
at least a reference8 SACCO out of 11 districts. Two new districts were created under the zone’s
coverage. A total of 16 client institutions and prospective clients were trained against a target
of 38.
There were 579 beneficiaries (355 female, 182 male, 2 persons with disability and 40 youths)
and employment opportunities created for 213 individuals i.e. 101 female and 112 male within
the region.
During the period under review, the zonal office engaged the district local government officials
to foster collaborations. Also Honey Pride Company limited continued to implement the
partnership with MSC. The performance of the zone is summarized in table 3.4.
8 Model SACCO is expected to be supported develop for each District served
Ministry of Finance, Planning and Economic Development
15Accountability Sector: Semi-Annual Budget Monitoring Report - FY 2019/20
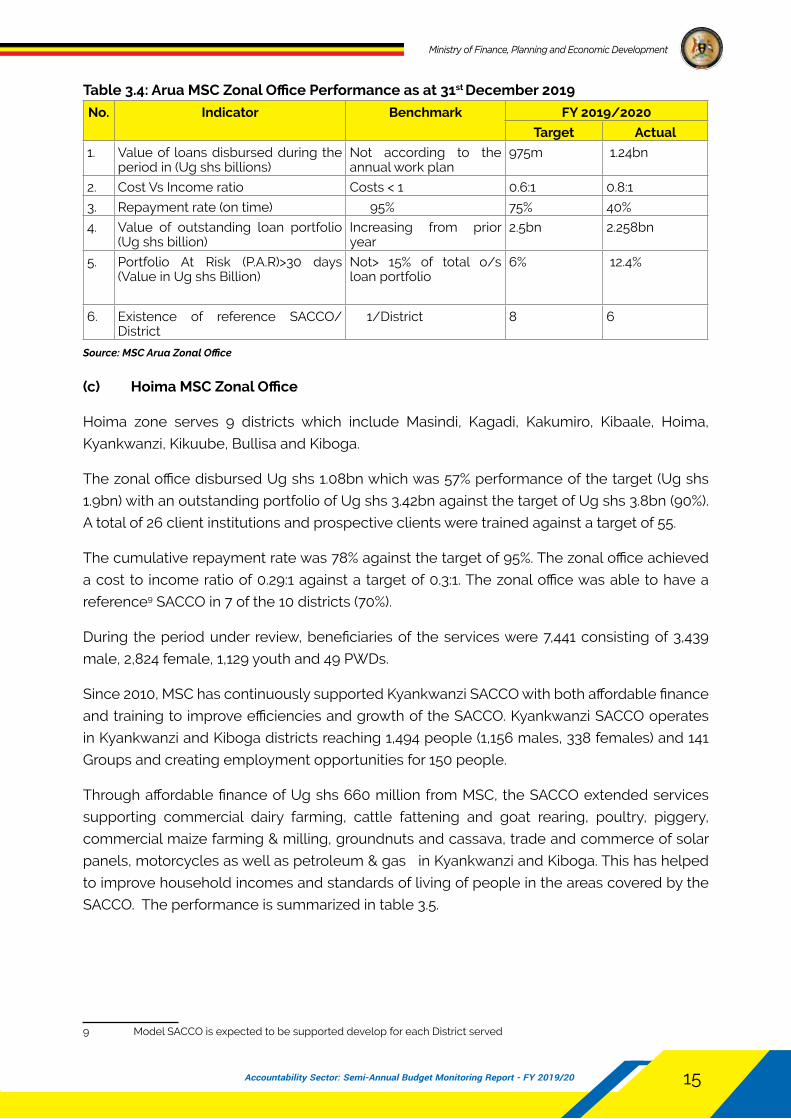
Table 3.4: Arua MSC Zonal Office Performance as at 31st December 2019
No. Indicator Benchmark FY 2019/2020
Target Actual
1. Value of loans disbursed during the period in (Ug shs billions)
Not according to the annual work plan
975m 1.24bn
2. Cost Vs Income ratio Costs < 1 0.6:1 0.8:1
3. Repayment rate (on time) 95% 75% 40%
4. Value of outstanding loan portfolio (Ug shs billion)
Increasing from prior year
2.5bn 2.258bn
5. Portfolio At Risk (P.A.R)>30 days (Value in Ug shs Billion)
Not> 15% of total o/s loan portfolio
6% 12.4%
6. Existence of reference SACCO/ District
1/District 8 6
Source: MSC Arua Zonal Office
(c) Hoima MSC Zonal Office
Hoima zone serves 9 districts which include Masindi, Kagadi, Kakumiro, Kibaale, Hoima,
Kyankwanzi, Kikuube, Bullisa and Kiboga.
The zonal office disbursed Ug shs 1.08bn which was 57% performance of the target (Ug shs
1.9bn) with an outstanding portfolio of Ug shs 3.42bn against the target of Ug shs 3.8bn (90%).
A total of 26 client institutions and prospective clients were trained against a target of 55.
The cumulative repayment rate was 78% against the target of 95%. The zonal office achieved
a cost to income ratio of 0.29:1 against a target of 0.3:1. The zonal office was able to have a
reference9 SACCO in 7 of the 10 districts (70%).
During the period under review, beneficiaries of the services were 7,441 consisting of 3,439
male, 2,824 female, 1,129 youth and 49 PWDs.
Since 2010, MSC has continuously supported Kyankwanzi SACCO with both affordable finance
and training to improve efficiencies and growth of the SACCO. Kyankwanzi SACCO operates
in Kyankwanzi and Kiboga districts reaching 1,494 people (1,156 males, 338 females) and 141
Groups and creating employment opportunities for 150 people.
Through affordable finance of Ug shs 660 million from MSC, the SACCO extended services
supporting commercial dairy farming, cattle fattening and goat rearing, poultry, piggery,
commercial maize farming & milling, groundnuts and cassava, trade and commerce of solar
panels, motorcycles as well as petroleum & gas in Kyankwanzi and Kiboga. This has helped
to improve household incomes and standards of living of people in the areas covered by the
SACCO. The performance is summarized in table 3.5.
9 Model SACCO is expected to be supported develop for each District served

Ministry of Finance, Planning and Economic Development
16 Accountability Sector: Semi-Annual Budget Monitoring Report - FY 2019/20
Table 3.5: Hoima MSC Zonal Office Performance as at 31st December 2019
No Indicator Benchmark FY 2019/20
Target Actual
1. Value of loans disbursed during the period in (Ug shs billions)
According to the annual work plan
1.9 bn 1.08 bn
2. Cost Vs Income ratio Costs < 1 0.30:1 0.29:1
3. Repayment rate (on time) 95% 95% 78%
4. Value of outstanding loan portfolio (Ug shs billion)
Increasing from prior year
3.8 bn 3.42 bn
5. Portfolio At Risk (P.A.R)>30 days (Value in Ug shs Billion)
Not> 15% of total o/s loan portfolio
1.25% 9.13 %
6. Existence of reference SACCO/ District 1/District 10 7
7. Client institutions trained Strengthening institutional capacity
55 26
Source: Hoima Zonal Office
(d) Jinja MSC Zonal Office
Jinja zonal office covers Busoga sub-region which consists of 11 districts, namely: Jinja, Kamuli,
Iganga, Luuka, Bugiri, Namutumba, Mayuge, Namayingo, Kaliro, Buyende, and Bugweri.
The zonal office disbursed Ug shs 1.17bn which was 69% performance of the target (Ug shs
1.7bn) with an outstanding loan portfolio of Ug shs 3.51bn against a target of Ug shs 2.8bn (125%
performance). A total of 32 client institutions and prospective clients were trained against a
target of 20.
The cumulative repayment rate achieved was 71% against the target of 85% indicating improved
performance compared to 53% as at 30th June 2019. The zonal office was able to maintain a
reference10 SACCO in 10 of the 11 districts. The zonal office is profitable with a cost to income
ratio of 0.5:1.
During the period under review beneficiaries were 9,008 consisting of 3,342 male, 3,313
female, 2,317 youth and 36 PWDs. The zone continued to engage district officials and SESECO
Company Ltd to extend services in the communities. The performance of the zonal office is
shown in table 3.6.
10 Model SACCO is expected to be supported develop for each District served

Ministry of Finance, Planning and Economic Development
17Accountability Sector: Semi-Annual Budget Monitoring Report - FY 2019/20
Table 3.6: Jinja MSC Zonal Office Performance as at 31st December 2019
No. Indicator Benchmark 2019/20
Target Actual
1. Value of loans disbursed during the period in (Ug shs billions)
According to the annual work plan
1.7 bn 1.17 bn
2. Cost Vs Income ratio Costs < 1 0.7:1 0.5:1
3. Repayment rate (on time) 95% 85% 71%
4. Value of outstanding loan portfolio (Ug shs billion)
Increasing from prior year 2.8 bn 3.51 bn
5. Portfolio At Risk (P.A.R)>30 days (Value in Ug shs Billion)
Not> 15% of total o/s loan portfolio
3% 18.07 %
6. Existence of reference SACCO/ District
1/District 11 10
7. Client institutions trained Strengthening institutional capacity
20 32
Source: MSC Jinja Zone
(e) Lira/Gulu MSC Zonal Office
The zone serves 17 districts covering Acholi and Lango regions, these include; Lira, Dokolo,
Amoltar, Kole, Apac, Kwania, Alebtong, Otuke, Oyam, Gulu, Nwoya, Amuru, Lamwo, Kitgum,
Pader, Omoro and Agago.
The zonal office disbursed Ug shs. 1.04bn against a target of Ug shs 1.6bn (65% performance).
Portfolio outstanding attained was Ug shs 4.16bn against a target of Ug shs 4.3bn (97%
performance). 24 client institutions and prospective clients were trained against a target of
30. The cumulative repayment rate achieved was 32% against a target of 85%. The zonal office
was able to maintain a reference11 SACCO in 6 of the 17 districts (35%). During the period under
review, the region registered 4,389 beneficiaries consisting of; 3,157 Female, 1,214 Youth and
18 PWDs.
Talanta Finance Limited is one of MSC’s client’s (Microfinance Institution). The MFI acquired
an agricultural loan of Ug. Shs 370m for onward lending to purchase (oxen and ploughs) for
smallholder farmer groups. As a result of MSC’s support to Talanta Finance, smallholder farmer
groups were able to access oxen and ploughs cheaply and took up commercial farming in line
with the National Government agenda of agricultural commercialization. Over 200 farmers
were trained in good Agronomic practices, created employment rural unemployed youths in
the rural areas and increased in farming acreages and production which has led to improved
food security at household level and the communities. The performance of the zone is
summarized in table 3.7.
11 Model SACCO is expected to be supported develop for each District served

Ministry of Finance, Planning and Economic Development
18 Accountability Sector: Semi-Annual Budget Monitoring Report - FY 2019/20
Table 3.7: Lira MSC Zonal Office Performance as at 31st December 2019
No. Indicator Benchmark FY 2019/20
Target Actual
1. Value of loans disbursed during the period in (Ug shs billions)
Not according to the annual work plan
1.6 bn 1.04 bn
2. Cost Vs Income ratio Costs < 1 1:1 1.17:1
3. Repayment rate (on time) 95% 60% 32%
4. Value of outstanding loan portfolio (Ug shs billion)
Increasing from prior year 4.3 bn 4.16 bn
5. Portfolio At Risk (P.A.R)>30 days (Value in Ug shs Billion)
Not> 15% of total o/s loan portfolio
10% 51.2%
6. Existence of reference SACCO/ District
1/District 17 6
Source: MSC Lira Zonal Office
(f) Kampala MSC Zonal Office
Kampala Zone covers 13 districts including Kampala (Makindye, Rubaga, Kawempe, Nakawa
and Central Divisions), Wakiso, Mukono, Luwero, Kayunga, Buikwe, Mityana, Mpigi, Nakaseke,
Nakasongola, Gomba, Butambala and Buvuma. The zone also has a satellite office in Ngoma
supporting people of Nakaseke district.
The zonal office disbursed Ug shs 11.4 bn which was 114% performance of the target (Ug shs
10 bn). Portfolio outstanding attained was Ug shs 28.85bn against a target of Ug shs 31bn (93%
performance). The zonal office was able to have a reference12 SACCO in 12 of the 13 districts
(90%). 104 client institutions and prospective clients were trained against a target of 100.
The cumulative repayment rate achieved was 57% against the target of 80%. This was attributed
to bulk debtors who failed to clear their arrears in a long period. However, the zonal office was
profitable with a cost to income ratio of 0.17:1. During the period the beneficiaries were 70,519
i.e. consisting of 30% Female and 58% Youth.
The zone continued to engage District officials in Buikwe, Wakiso, Kampala and Luwero district
through massive mobilisations, sensitization, training and affordable financing to Cooperatives,
Groups and Markets.
Under the Imams development forum and in collaboration with the Operation Wealth Creation
the MSC implemented training for 429 Moslem Imams in all the divisions of Kampala, these
efforts are aimed at more awareness, strengthening the Kampala District Imams SACCO and
delivering more inclusive financial services.
MSC in partnership with Ministry of Local Government to implement Local Economic Growth
Support (LEGS) assessment was undertaken and rural finance and value chain development
was enhanced. The performance of the zonal office is shown in table 3.8.
12 Model SACCO is expected to be supported develop for each District served

Ministry of Finance, Planning and Economic Development
19Accountability Sector: Semi-Annual Budget Monitoring Report - FY 2019/20
Table 3.8: Kampala MSC Zonal Office Performance as at 31st December 2019
No Indicator Benchmark FY 2019/20
Target Actual
1. Value of loans disbursed during the period in (Ug shs billions)
According to the annual work plan
10 bn 11.4 bn
2. Cost Vs Income ratio Costs < 1 0.5:1 0.17:1
3. Repayment rate (on time) 95% 80% 57%
4. Value of outstanding loan portfolio (Ug shs billion)
Increasing from prior year 31 bn 28.85 bn
5. Portfolio At Risk (P.A.R)>30days (Value in Ug shs Billion)
Not> 15% of total o/s loan portfolio
8% 32.2%
6. Existence of reference SACCO/ District
1/District 13 12
Source: MSC Kampala Zone
(g) Kabale MSC Zonal Office
Kabale Zonal office is in Southwestern Uganda and covers 6 districts in Kigezi sub region i.e.
Kabale, Kisoro, Kanungu, Rubanda, Rukiga and Rukungiri.
The zonal office disbursed Ug shs 1.74bn which was 67% above the target (Ug shs 2.6bn) with
an outstanding portfolio of Ug shs 7.63bn against the target of Ug shs 9bn (85%).
The cumulative repayment rate achieved was 53% against the target of 85%. 67 client institutions
and prospective clients were trained against a target of 80.
The zonal office was profitable with a cost to income ratio of 0.36:1 and maintained at least one
reference SACCO in every district of the zone achieving 100%.
During the period under review, the zone continued to engage District officials and Community
Health Empowerment groups. Through collaboration with Women Empowerment Institute
in Kabale, 19 groups were trained in preparation for financing. The detailed performance of
Kabale zonal office is shown in table 3.9.
Table 3.9: Kabale MSC Zonal Office Performance as at 31st December 2019
No Indicator Benchmark FY 2019/20
Target Actual
1. Value of loans disbursed during the period in (Ug shs billions)
According to the annual work plan
2.6 bn 1.74 bn
2. Cost Vs Income ratio Costs < 1 0.3:1 0.36:1
3. Repayment rate (on time) 95% 85% 53%
4. Value of outstanding loan portfolio (Ug shs billion)
Increasing from prior year 9 bn 7.63 bn
5. Portfolio At Risk (P.A.R)>30days (Value in Ug shs Billion)
Not> 15% of total o/s loan portfolio
5% 16.1%
6. Existence of reference SACCO/ District
1/District 6 9
Source: MSC Kabale Zone

Ministry of Finance, Planning and Economic Development
20 Accountability Sector: Semi-Annual Budget Monitoring Report - FY 2019/20
(h) Mbale MSC Zonal Office
Mbale zonal office serves 17 Districts of Busia, Tororo, Bududa, Manafwa, Namisindwa, Mbale,
Butaleja, Budaka, Kibuku, Pallisa, Bukedea, Sironko, Bulambuli, Kapchorwa, Kween, Bukwo
and Butebo
The zonal office disbursed Ug shs 1.64bn which was 173% performance of the target (Ug shs
950m) with an outstanding portfolio of Ug shs 5.92bn against the target of Ug shs 5.5bn (108%).
127 client institutions and prospective clients were trained against a target of 90.
The cumulative repayment rate was 65% against the annual target of 80%. The zonal office
achieved a cost to income ratio was 0.13:1 against a target of 1:1. The zonal office was able to
have a reference13 SACCO in 14 of the 17 districts (82%).
Kaleli Cooperative savings and Credit Society Limited (SACCO) located in Bukedea District
Eastern Uganda, is one of MSC’s clients in the region serving 42,630 people comprising of
1,633 male, 942 female, 152 youth and 31 Groups and 31 other Institutions among others.
The SACCO accessed an affordable commercial loan of Ug shs 40m from MSC for onward
lending to members engaged in agriculture, trade & commerce including boda boda business.
Mr Odele Tadeo a carpenter and a member of Kaleli SACCO accessed a loan of Ug shs 3.3m
from the SACCO. With this loan, he purchased carpentry tools, sewing machines and started
Odele Memorial vocational school in the trading center to skill the school dropouts and other
unemployed youth. The school enrolled 30 students who are undertaking courses such as
motor mechanics, carpentry and joinery, driving skills, hair dressing and tailoring. This has
greatly facilitated education and skilling of unemployed youth to start their own businesses
thus improved livelihoods in the community. The detailed performance of Mbale zonal office
is shown in table 3.10.
Table 3.10: Mbale MSC Zonal Office Performance as at 31st December 2019
No. Indicator Benchmark FY 2019/20
Target Actual
1. Value of loans disbursed during the period in (Ug shs billions)
According to the annual work plan
950 m 1.64 bn
2. Cost Vs Income ratio Costs < 1 1:1 0.13:1
3. Repayment rate (on time) 95% 80% 65%
4. Value of outstanding loan portfolio (Ug shs billion)
Increasing from prior year 5.5 bn 5.92 bn
5. Portfolio At Risk (P.A.R)>30 days (Value in Ug shs Billion)
Not> 15% of total o/s loan portfolio
12% 42.8%
6. Existence of reference SACCO/ District
1/District 17 14
7. Client institutions trained Strengthening institutional capacity
90 127
Source: MSC Mbale Zone
13 Model SACCO is expected to be supported develop for each District served

Ministry of Finance, Planning and Economic Development
21Accountability Sector: Semi-Annual Budget Monitoring Report - FY 2019/20
(i) Mbarara MSC Zonal Office
Mbarara zone serves 10 Districts which include; Rubirizi, Buhweju, Mitooma, Bushenyi, Sheema,
Ibanda, Kiruhura, Isingiro, Ntungamo and Mbarara
The zonal office disbursed Ug shs 7.37bn which was 105% performance of the target (Ug shs
7bn) with an outstanding portfolio of Ug shs 19.54bn against the target of Ug shs 18bn (109%).
The cumulative repayment rate was 56% against the annual target of 85%. 53 client institutions
and prospective clients were trained against a target of 70.
The cost to income ratio was 0.28:1 against a target of 0.3:1. The zonal office was able to have a
reference14 SACCO in each of the 10 districts achieving 100%.
During the period under review, the zone engaged District officials, Reference SACCOs and
Uganda Export Promotion Board (UEPB) to extend services in the communities. The detailed
performance of the zonal office is shown in table 3.11.
Table 3.11: Mbarara MSC Zonal Office Performance as at 31st December 2019
No Indicator Benchmark Q1 & Q2 FY 2019/20
Target Actual
1. Value of loans disbursed during the period in (Ug shs billions)
According to the annual work plan
7 bn 7.37 bn
2. Cost Vs Income ratio Costs < 1 0.3:1 0.28:1
3. Repayment rate (on time) 95% 85% 56%
4. Value of outstanding loan portfolio (Ug shs billion)
Increasing from prior year 18 bn 19.54 bn
5. Portfolio At Risk (P.A.R)>30days (Value in Ug shs Billion)
Not> 15% of total o/s loan portfolio
5% 26%
6. Existence of reference SACCO/ District
1/District 10 10
7. Client institutions trained Strengthening institutional capacity
70 53
Source: MSC Mbarara Zone
(j) Masaka MSC Zonal Office
Masaka zone serves 9 Districts of greater Masaka namely Bukomansimbi, Ssembabule,
Lyantonde, Lwengo, Kalangala, Kalungu, Kyotera, Rakai and Masaka Districts.
The zonal office disbursed Ug shs 3.97bn against the target of Ug shs 2.5bn (159% performance)
with an outstanding portfolio of Ug shs 10.32bn against the target of Ug shs 8.25bn (125%). The
cumulative repayment rate was 67%, which was a significant increase compared to 31% at 30th
June 2019, against the targets of 85%. The zonal office was profitable at a cost to income ratio
of 0.22:1 against the target of 0.5:1.
14 Model SACCO is expected to be supported develop for each District served

Ministry of Finance, Planning and Economic Development
22 Accountability Sector: Semi-Annual Budget Monitoring Report - FY 2019/20
The zonal office was able to have a reference15 SACCO in 8 of the 9 districts (89%). 56 client
institutions and prospective clients were trained against a target of 44.
During the period the beneficiaries were 2,142 i.e. 682 female, 693 youth, 80 PWDs and 687
male.
The zone engaged District officials and worked together with Kasolo Foundation to reach out
to people in rural areas through massive mobilisation, sensitization and training campaigns
to equip people with practical sustainable skills and affordable financing. The performance is
summarized in table 3.12.
Table 3.12: Masaka Zonal Office Performance as at 31st December 2019
No Indicator Benchmark Q1 & Q2 FY 2019/20
Target Actual
1. Value of loans disbursed during the period in (Ug shs billions)
According to the annual work plan
2.5 bn 3.97 bn
2. Cost Vs Income ratio Costs < 1 0.5:1 0.22:1
3. Repayment rate (on time) 95% 85% 67%
4. Value of outstanding loan portfolio (Ug shs billion)
Increasing from prior year 8.5 bn 10.32 bn
5. Portfolio At Risk (P.A.R)>30 days (Value in Ug shs Billion)
Not> 15% of total o/s loan portfolio
5% 22.1%
6. Existence of reference SACCO/ District
1/District 9 8
7. Client institutions trained Strengthening institutional capacity
44 56
Source: MSC Masaka Zone
(k) Soroti MSC Zonal Office
Soroti zonal office serves a total of 8 districts comprising of Soroti, Serere, Ngora, Kumi, Amuria,
Katakwi, Kaberamaido and Kapelebyong.
The zonal office disbursed Ug shs 1.38bn against the annual target of Ug shs 1.2bn (115%
performance) with an outstanding portfolio of Ug shs 2.21bn against the target of Ug shs 2.25bn
(98%). The cumulative repayment rate was 78%, which was a slight increase compared to 64%
at 30th June 2019, against the targets of 75%.
The cost to income ratio of 0.6:1 against the target of 0.75:1. The zonal office was able to have
a reference16 SACCO in 5 of the 8 districts (63%). A total of 76 client institutions and prospective
clients were trained against a target of 30.
During the period under review, employment opportunities created were 237. Beneficiaries
were 9,524 i.e. consisting of 4,008male, 4,349 female 997 youth & 170 PWDs. This was due
to massive interventions through partners reaching to the communities. The zone engaged
District officials and also worked together with Self-Help Africa to support VSLA groups in
Katakwi, Amuria, Kapelebyong, Ngora and Katakwi DLG to implement LEGS project.
15 Model SACCO is expected to be supported develop for each District served16 Model SACCO is expected to be supported develop for each District served

Ministry of Finance, Planning and Economic Development
23Accountability Sector: Semi-Annual Budget Monitoring Report - FY 2019/20
MSC entered a partnership with Self Help Africa- Soroti chapter to support communities that
were recently resettled after years of displacement, a result of ethnic violence and incursion
by Joseph Kony’s Lord’s Resistance Army (LRA). The partners are implementing the SHA and
TESO region project working with rural communities, women groups and small-scale farming
households to help them combat a range of challenges, including poverty, hunger, climate
change and high prevalence of HIV/AIDS.
As a result of this collaboration, a total of 72 farmer groups ( each consisting of 15 members)
were involved in various economic activities such as savings and credit, farming and trading
of farm produce for the betterment of their livelihoods in Teso region. The performance is
summarized in table 3.13.
Table 3.13: Soroti MSC Zonal Office Performance as at 31st December 2019
No Indicator Benchmark Q1 & Q2 FY 2019/20
Target Actual
1. Value of loans disbursed during the period in (Ug shs billions)
According to the annual work plan
1.2 bn 1.38 bn
2. Cost Vs Income ratio Costs < 1 0.75:1 0.6:1
3. Repayment rate (on time) 95% 75% 78%
4. Value of outstanding loan portfolio (Ug shs billion)
Increasing from prior year 2.25 bn 2.21bn
5. Portfolio At Risk (P.A.R)>30 days (Value in Ug shs Billion)
Not> 15% of total o/s loan portfolio
15% 15.8%
6. Existence of reference SACCO/ District
1/District 8 5
7. Client institutions trained Strengthening institutional capacity
30 76
Source: MSC Soroti Zone
Performance of SACCOs
The assessment of the performance of the MSC was extended to the SACCOs/institutions
with the objective of, Confirming if the SACCO/institutions
1. Obtained a loan (s) from the MSC.
2. Adequacy and relevancy of any other services received from the MSC.
3. Any support services received from the District Commercial officers (DCOs) of the respective
local governments.
4. Assess levels of financial inclusiveness.
Findings
Five institutions were monitored to assess the services received from MSC and the following
was noted: the average processing time for loans to be processed by the MSC was three
months against a target of 1 month, 64% of institutions had received business development
services-training, and 75% of the institutions had their activities supervised by the District
Commercial Officers from their respective LGs. Institutions visited included- Blessed women
of God in Hoima District, Kyankwanzi SACCO ltd in Kyankwanzi District, Kaleri SACCO in Mbale

Ministry of Finance, Planning and Economic Development
24 Accountability Sector: Semi-Annual Budget Monitoring Report - FY 2019/20
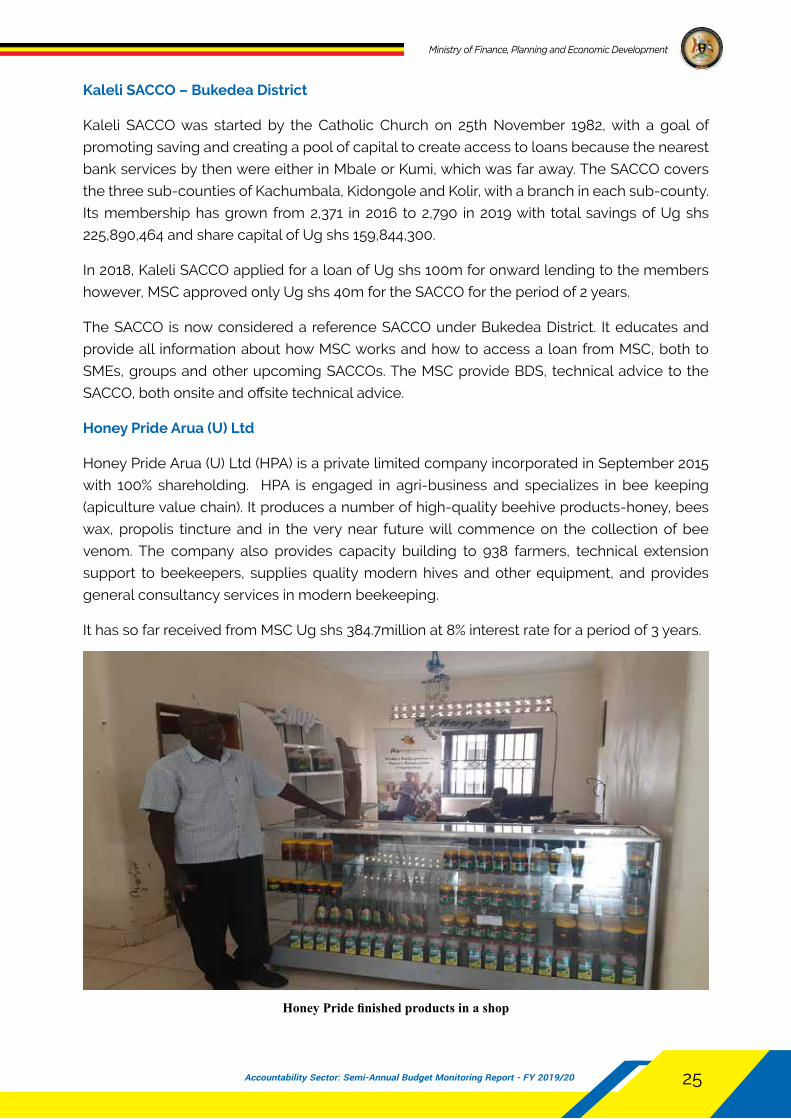
District, Honey Pride Arua (U) ltd in Arua and two beneficiary groups from Heifer International;
Gen-tici and Ribbe-aye-teko in the Lira Zonal Office.
Interviews were held with District Commercial Officers (DCOs) Bukedea, Gulu, Hoima, Kabale,
Kibale, Kikuube, Kayunga, Kole, Kumi, Kyankwanzi, Lira, Mayuge, Mbale, Tororo, Sironko, Soroti
and Wakiso. The DCOs pointed out the following issues: groups are more active than SACCOS
hence more emphasis should be put to support more groups, elective politics (democracy in
groups) has led to the dissolution of SACCOs, inadequate facilitation extended to commercial
officers which hampered their activities of monitoring and supervision.
The low number of SACCOs supported by MSC especially in the South-Western, East and
Northern regions was attributed to collapse of SACCOs due to poor saving culture, lack of
policies to guide SACCOs, managerial problems – board members connive with management,
political interference from leaders, founder member syndrome, multiple borrowing, stringent
requirements and need for large savings and capital for accessing a loan from MSC. Capacity
building and support from the Project for Financial Inclusion from Rural Areas (PROFIRA)
and MSC for existing and strong SACCOs has improved greatly. DLGs stepped up support
supervision and monitoring for groups.
Groups supported by heifer International Uganda17
Gen-tici and Ribbe-aye-teko groups
These two groups are found in Northern Uganda. They got heifers on credit through MSC
partnership with Heifer international. The MSC extends credit to the farmers to procure the
heifers, the loans are repayable over a period of two years with a grace period of six months.
Heifer International provides veterinary services and market for the milk. Both groups were in arrears due to the long dry spell.
Beneficiaries of Heifer International in Northern Uganda
17 Heifer International is a non-governmental organization involved in rural development around the world. Since inception in 1982, a total number of 5,101,350 groups in Northern, Central, Eastern and South Western Uganda in 39 districts have been reached. It provides grassroots communities with animals and trains organized local groups. They mobilize farmers and help them connect with cooperatives to share knowledge and access financial services.
Ministry of Finance, Planning and Economic Development
25Accountability Sector: Semi-Annual Budget Monitoring Report - FY 2019/20
kaleli SACCO – Bukedea District
Kaleli SACCO was started by the Catholic Church on 25th November 1982, with a goal of
promoting saving and creating a pool of capital to create access to loans because the nearest
bank services by then were either in Mbale or Kumi, which was far away. The SACCO covers
the three sub-counties of Kachumbala, Kidongole and Kolir, with a branch in each sub-county.
Its membership has grown from 2,371 in 2016 to 2,790 in 2019 with total savings of Ug shs
225,890,464 and share capital of Ug shs 159,844,300.
In 2018, Kaleli SACCO applied for a loan of Ug shs 100m for onward lending to the members
however, MSC approved only Ug shs 40m for the SACCO for the period of 2 years.
The SACCO is now considered a reference SACCO under Bukedea District. It educates and
provide all information about how MSC works and how to access a loan from MSC, both to
SMEs, groups and other upcoming SACCOs. The MSC provide BDS, technical advice to the
SACCO, both onsite and offsite technical advice.
honey Pride Arua (U) Ltd
Honey Pride Arua (U) Ltd (HPA) is a private limited company incorporated in September 2015
with 100% shareholding. HPA is engaged in agri-business and specializes in bee keeping
(apiculture value chain). It produces a number of high-quality beehive products-honey, bees
wax, propolis tincture and in the very near future will commence on the collection of bee
venom. The company also provides capacity building to 938 farmers, technical extension
support to beekeepers, supplies quality modern hives and other equipment, and provides
general consultancy services in modern beekeeping.
It has so far received from MSC Ug shs 384.7million at 8% interest rate for a period of 3 years.
Honey Pride finished products in a shop

Ministry of Finance, Planning and Economic Development
26 Accountability Sector: Semi-Annual Budget Monitoring Report - FY 2019/20
kyankwanzi SACCO LTD
The SACCO located in Kyankwanzi District started operations in 2009 and also serves Kiboga
District. The institution has 1,635 members (1,156 males, 338 females and 141 Groups), with
share capital contribution of Ug shs 230,218,053 at a nominal share value of Ug shs 10,000 as at
December 31, 2019. The SACCO has over 500 teachers as members. It has 9 direct employees.
The SACCO supports onward lending to its members, most of whom are engaged in agriculture
(dairy, bull fattening, and goat rearing), transport and micro businesses.
Impact to the community
The MSC has improved household incomes through different channels such as direct funding of
affordable finance to SMEs and skilling institutions (vocational institutions) as well as improving
access to financial services (financial inclusion).
The Centre supported cattle and dairy farmers along the cattle corridor (Kiboga and
Kyankwanzi districts) in value chain to a tune of Ug shs 660m. The beneficiaries were involved
in commercial dairy milk, cattle fattening, goat rearing, commerce and trade. The youth have
acquired employment through the 9 direct jobs created and 150 indirect jobs.
The MSC through Kyankwanzi SACCO served over 1,635 members. The members are mainly
in from the Districts of Kyankwanzi and Kiboga. With the loans beneficiaries where able to
engage in agricultural activities such as- poultry, piggery, commercial maize farming & milling,
groundnuts and cassava as well as dairy milk and cattle fattening. Other beneficiaries were
involved in trade and commerce-dealing in solar panels, motorcycles as well as petrol, diesel
and gas.
3.13: key Performance Indicator Trends over a Three Year Period
Item 31st Dec 2019 31st Dec 2018 31st Dec 2017 Comments
Membership 1635 1595 1475 Positive and increasing
Total Income 141,929,850 135,508,668 92,360,154 Positive and increasing
Loan portfolio 490,141,017 497,159,421 381,113,150 Slight decline due to seasonal changes (drought) and quarantine that affect the cattle farmers
Source: Kyankwanzi SACCO
Challenges
1. Poor governance and management in most SACCOs resulting in misappropriation of funds, theft, collusion, and fraud.
2. Low funding from the MSC, usually SACCOs access on average 70% of what is applied for which is insufficient to meet the requirements.
3. Unfavourable weather patterns that affect the agricultural yields and economic activities.
4. Multi-borrowing from different SACCOs and other lending institutions which has resulted in high default rate.
5. Delays by the MSC to issue loans to the successful groups and SACCOs affects the implementation of planned activities especially agricultural outputs.

Ministry of Finance, Planning and Economic Development
27Accountability Sector: Semi-Annual Budget Monitoring Report - FY 2019/20
Table 3.14: Analysis of MSC key Performance Indicatorsstrategic Ob-
jective (sindicators Baseline
2018/19Targets Actual weighting
%Remarks
Increase cov-erage of MSC services and products. (40)
% of districts with at least one reference institution
90% 80% 71% 10 There is a reference institution in every district served by MSC. MSC is trying to expand reference SACCOs/Institutions to parish and village level through onsite tech-nical assistance and community engagements.
% increase in outstanding Loan Portfolio
15% 15% 18% 5 There was a considerable growth in outstanding loan portfolio to Ug shs 183.4bn from Ug shs 83bn in 2018/19.
% increase in clients served (cumulative)
35% 45% 65% 5 This was attributed to rolling out the Group loan product that has captured the clientele.
Value of disburse-ments
19.8bn 35bn 51.18bn 20 There was significant increase in disbursements attributed to massive mobilization campaigns and trainings to support poten-tial clients. The company also continued to enhance marketing through mobilization drives in regional and satellite offices, and collaboration with partners, dis-trict commercial officers & other LG officials and CBOs.
Strengthen stra-tegic partner-ships.
Increase in number of Strategic Part-nerships
At least 2 p.a
2 p.a 9 part-ners en-gaged
15 Goal Global (Uganda, Internation-al Fertilizer Development Centre (IFDC), , Integrated Community, Agriculture and Nutrition (ICAN, United Nations High Commission-er for Refugees (UNHCR), Mga-hinga Cultural and Crafts Centre, Management Training and Advi-sory Centre (MTAC), AlHuda Cen-tre of Islamic Banking & Econom-ics, Savings Banks Foundation for International Cooperation (SBFIC) and HABITAT Uganda all tailored to support social-economic de-velopment.
Enhance organizational sustainability. (45)
Cost: In-come Ratio at least (1:1)
1:1 1:1 1:1 20 The company operated within its budget
Portfolio At Risk (PAR)
5% 15% 22% 0 The performance was not rated on account of low achievement
Overall Programme performance achieved 75%

Ministry of Finance, Planning and Economic Development
28 Accountability Sector: Semi-Annual Budget Monitoring Report - FY 2019/20
Conclusion
Overall, the Microfinance Support Centre greatly delivered against its expected output. This
was due to: increased sensitization and mobilization of communities, improved information
dissemination about MSC products and services, provide technical assistance and shared
good practices to support weaker SACCOs.
During the period under review, 75% of the planned outputs were fully achieved, 25% not
achieved the Microfinance Support Centre greatly delivered against its expected output. The
MSC disbursed Ug shs 51.18bn to clients compared to Ug shs 19.08bn as at December 2018.
The gross portfolio achieved was 114% (to Ug shs 134.7bn) from Ug shs 117.3bn at end of FY
2018/19. The Portfolio at Risk (PAR) greater than 30days was 22% which was above the target
of 15%.
The Centre extended various loan products of: agricultural-13%, commercial-14%, groups 56%
and teachers-2% and Islamic loans 6%, which were below the 23% issued by the commercial
banks.
The average lead time for the disbursement of loans to clients was on average 44days against
a target of 30days.
At least 71% of districts had at least one reference SACCOs/institutions (115 institutions) against
a target of 80%. A total of 639 client institutions and prospective clients were trained.
In terms of company sustainability, the Cost to Income ratio was 1:1 indicating that the company
operated within its budget/ annual target of 1:1 as compared to previous FY 2018/19 with Cost
to Income ratio of 0.8:1. Partnerships building continues to be core to MSC’s interventions,
reflecting commitment to business growth in terms of clients, resource mobilization, product
development and sustainability.
The MSC partnered with the Ministry of Local Government to implement the Local Economic
Growth Support (LEGS). District project orientation and revalidation of sites was conducted in 17
LEGS districts. The technical capacity requirements for the profiled projects were also mapped
and an action plan to close the gaps elaborated. Some of the critical needs identified relate
to governance, financial management, record keeping & a management information system,
enterprise management, VSLA methodology, Marketing, business and strategic planning, risk
management, auditing, interpretation of financial reports among other aspects.
Recommendations
1. The GoU should revisit its vision of SACCOs as the key financial inclusion tool in rural areas.
Other options, such as Community Savings and Credit Groups and/or registered NGO-
MFIs working with commercial banks could offer solutions in which the success and value
for money ratios are clearly better than has been the case with the SACCOs.
2. The PROFIRA should partner with MSC to effectively build capacity of SACCO members
in managing loan funds, ensuring timely repayments and recommend SACCOs trained to
MSC.

Ministry of Finance, Planning and Economic Development
29Accountability Sector: Semi-Annual Budget Monitoring Report - FY 2019/20
3. The SACCOs should mobilize savings, carry out member education and improve their loan applications to enable access to credit from the MSC.
4. In order to curb the problem of multiple borrowing, SACCOs at district levels should form unions and be able to monitor multiple borrowers. SACCO managers, loans officers and DCOs should share information on the loans taken by their members, this will eliminate multiple borrowing as it happened with the commercial banks.
3.2.2 Financial Performance of Central and Local Governments
Introduction
This section discusses the overall annual financial performance of the Government of Uganda (GoU) Budget for the FY 2019-20 and subsequently reviews the detailed budget performance of 11(61%)18 sectors that include; Accountability, Agriculture, Education, Energy, Health, Information and Communications Technology and National Guidance, Trade and Industry, Water and Environment, Public Sector Management, Works and Transport, and Science, Technology and Innovation.
Overall Financial Performance
The overall GoU approved budget for FY 2019/20 was Ug shs 40,487bn, the budget was revised to Ug shs 41,530bn on account of a supplementary budget of Ug shs 1,043bn.
The GoU approved budget excluding external financing, arrears and Appropriation in Aid (AIA) was Ug shs 30,404bn of which, the allocation to Ministries, Departments and Local Governments (MDA and LGs) was Ug shs 20,083bn (49.6% of the GoU approved budget) and debt payments Ug shs 10,739bn (25% of the GoU approved budget).
The GoU release performance to the MDALGs as at 31st December 2019 was 56% (Ug shs 11,203bn) of the approved budget to MDALGs and, 88% (Ug shs 9,836bn) was absorbed by 31st December 2019 which was good performance. Debt and treasury operations performed at Ug shs 4,887bn representing 46% of the approved budget.
The overall release and expenditure performance of the MDALGs excluding debt and external financing is shown in table 3.15.
Table 3.15: MDAs and LGs GoU Budget Performance (Ug shs) as at 31st December 2019MDA &
LGsApproved Budget Revised Budget Release Expenditure % of
approved Bdgt Rlsed
%ge of Release
Spent
Wage 4,672,950,606,324 4,674,138,798,408 2,405,999,476,173 2,135,494,258,607 51 89
N/Wage 7,539,096,690,323 7,741,533,752,499 4,311,460,150,459 3,658,862,112,602 57 85
Dev 7,870,540,654,906 7,974,205,997,830 4,486,470,604,730 4,041,181,888,616 57 90
Total 20,082,587,951,553 20,389,878,548,737 11,203,930,231,362 9,835,538,259,825 56 88
Source: IFMS19, Approved Estimates of Revenue and Expenditure FY 2019/20, BOT20 and PBS21
18 Sectors not monitored include-Justice, Law and Order, Public Administration, Legislature, Social Development, Security, Tourism, Lands Housing and Urban Development.
19 Integrated Financial Management System20 Budget Operations Table FY 2019/2021 Programme Budgeting System

Ministry of Finance, Planning and Economic Development
30 Accountability Sector: Semi-Annual Budget Monitoring Report - FY 2019/20
Financial Performance of 11 Priority Sectors, kCCA and LGs
The approved budgets of eight (73%) of the 11 priority sectors analyzed in detail were revised as
at 31st December 2019. The sectors with revised budgets included; Accountability, Agriculture,
Education, Health, Works and Transport, Public Sector Management, Trade and Industry, and
Science and Technology. The Local Governments (LGs) and Kampala Capital City Authority
(KCCA) similarly experienced revisions to their budgets in the form of supplementary budgets.
The development budget for the science and technology sector experienced the highest
revision in value of Ug shs 91.82bn (89% of sector budget).
The overall GoU financial performance for the 11 priority sectors, LGs and KCCA is shown in
table 3.16.
Table 3.16: Annual Budget Performance for Selected Sectors, LGs and kCCA at 31st
December 2019Sector Approved Budget Revised Budget Release Ug shs Expenditure %ge of
approved budget
Released
%ge of Re-lease Spent
Accountabil-ity1
1,181,735,831,919 1,205,882,034,902 636,015,104,648 372,716,045,594 54 91
Agriculture 591,059,007,615 594,659,007,615 340,641,582,875 270,052,550,640 58 79
Education 1,200,135,227,633 1,201,163,305,299 634,480,674,826 531,181,370,168 53 84
Energy 780,508,109,344 - 378,275,763,157 315,153,095,563 48 83
Health 912,730,161,782 - 546,315,656,375 399,553,798,174 60 73
Water and Environment
506,866,506,214 - 293,319,633,914 260,542,535,492 70 89
Information and Com-munications Technology
104,006,190,144 - 49,440,965,711 40,748,530,881 48 82
Works and Transport
3,291,886,839,366 3,295,973,839,366 2,000,487,113,347 1,936,790,794,320 61 97
Public Sector Management
350,476,197,719 3,295,973,839,366 200,823,987,826 149,013,770,522 57 74
Trade Industry and Coopera-tives
193,492,734,972 195,544,363,015 128,220,787,673 117,784,726,086 66 92
Science, Tech-nology and Innovation
103,491,402,608 195,311,402,608 144,378,693,671 134,810,961,775 140
93
Local Govern-ments
3,685,816,425,365 3,685,816,425,365 1,958,810,365,000 1,575,712,286,000 50 80
KCCA 294,931,823,989 294,931,823,989 190,314,319,635 127,845,004,303 65 67
Source: IFMS January 2020, Approved Estimates of Revenue and Expenditure FY 2019/20 and BOT2019/20

Ministry of Finance, Planning and Economic Development
31Accountability Sector: Semi-Annual Budget Monitoring Report - FY 2019/20
Accountability Sector
The GoU approved budget for the Accountability Sector22 (excluding treasury operations, LGs
and KCCA) for the FY 2019/20 is Ug shs 1,431bn. The sector budget was revised to Ug shs
1,455bn through a supplementary budget of Ug shs 24.146bn, representing 2% of the sector
approved budget.
The revisions were towards sub-programme 1521-Resource Enhancement and Accountability
Programme (REAP) (Ug shs 5bn) for consultancy services, sub-programme 54- Support to
MFPED (Ug shs 7.625bn) towards IFMS recurrent costs and sub-programme 52-Uganda
Retirement Benefits Regulatory Authority Services (Ug shs 7.236bn) under other government
transfers.
The overall release for the sector was 44% (Ug shs 636.015bn) of the approved budget of which
91% (Ug shs 576.607bn) was spent by 31st December 2019.
The detailed budget performance for the sector votes on the IFMS is shown in Table 3.17.
Agriculture Sector
The GoU approved budget for the Agriculture Sector for the FY 2019/20 is Ug shs 720.251bn
(excluding external financing). The central government votes share is Ug shs 591.059bn (88%)
and Ug shs 129.785bn (18%) to LGs and KCCA. The budget for the central votes was revised
to Ug shs 594.69bn, of which Ug shs 340.641bn (57%) was released. Highest percentage
release was registered under Vote 160 - Uganda Coffee Development Authority (UCDA) Ug
shs 77.79bn, while the lowest release was registered under Vote 142 - National Agriculture
Research Organization (NARO) Ug shs 36.713bn (46%) of the respective approved budget.
Overall, the central sector votes absorbed 79% (Ug shs 270.052bn) of the funds released,
with the highest absorption of 96% (Ug shs 75.064bn) registered under Vote 160 - UCDA 96%.
Others that registered high absorption performance included Vote 152 - NAADS Secretariat
93% (75.658bn) and Vote 142 NARO 83% (Ug shs 30.616bn).
The detailed budget performance for the sector votes on the IFMS is shown in Table 3.18.
Education Sector
The GoU approved budget for the Education Sector for the FY2019/20 is Ug shs 3,081.349bn
(excluding external financing). The central government votes share is Ug shs 1,256.431bn
(40.77%) and Ug shs 1,824.935bn (59%) to LGs and KCCA.
The sector realized 52.87% (Ug shs 634.480bn) of the approved budget and 83.72% (Ug shs
531.181bn) was absorbed by 31st December 2019 which was good performance.
Vote 128 - Uganda National Examinations Board registered the highest performance of 100 %
(Ug shs 58.600bn) for both the release and expenditure. The other sector votes that registered
very good release and absorption performance included; Vote 138 Makerere University
22 For Accountability Sector votes with funding/releases on the IFMS in the FY 2018/19.

Ministry of Finance, Planning and Economic Development
32 Accountability Sector: Semi-Annual Budget Monitoring Report - FY 2019/20
Business School 96% (Ug shs 37.423bn) and Vote 137 Mbarara University of Science and
Technology (MUST) 91% (22.298bn).
Soroti University registered the least performance at 53% (Ug shs 4.423bn) which was attributed
to weak financial management controls and the suspension of key staff at the University.
The detailed budget performance for the sector votes on the IFMS is shown in Table 3.19.
Energy Sector
The GoU approved budget for the Energy Sector for the FY 2019/20 is Ug shs 779.930bn. The
sector realized Ug shs 378.275bn (48.5%) which was very good performance.
The highest performance was registered under the Vote 311 - Uganda National Oil Company
(UNOC)-57% (Ug shs 17.78bn) and 100% of the release was absorbed. Other votes with very
good performance were; Vote 017 - Ministry of Energy and Mineral Development (MEMD) 85%
(Ug shs 233.699bn) and Vote 312 - Petroleum Authority of Uganda 77% (Ug shs 18.847bn).
The detailed budget performance for the sector votes as at 31st December 2019 is shown in
Table 3.20.
health Sector
The GoU approved budget for the Health Sector for the FY 2019/20 is Ug shs 1,470.145bn, of
which 37% (Ug shs 549.524bn) is earmarked for LGs and 63% (Ug shs 920.620bn) for the central
government votes and KCCA. The release performance was 59.86% (Ug shs 546.315bn) for the
central votes and, 73% (Ug shs 399.6bn) was absorbed, registering good performance.
The highest financial performance among the sector votes was 98% (Ug shs 285.650bn)
registered under Vote 116 National Medical Stores (NMS).
The LGs realized 52% (Ug shs 285.650bn) of the LG approved budget and 85% (Ug shs 242.802bn)
of which was absorbed by 31 December 2019.
The detailed budget performance for the sector votes on the IFMS is shown in Table 3.21.
water and Environment Sector
The GoU approved budget for the Water and Environment Sector for the FY2019/20 is Ug shs
569.205bn, of which 10.42% (59.330bn) was earmarked for the LGs. The sector realized 70%
(293.319bn) and 88.83% (Ug shs 260.542bn) was absorbed by 31st December 2019 which was
very good.
The least performance was registered under Vote 157-National Forestry Authority at 57% (Ug
shs 8.928bn) absorption. The detailed budget performance for the sector votes on the IFMS is
shown in Table 3.22.
Ministry of Finance, Planning and Economic Development
33Accountability Sector: Semi-Annual Budget Monitoring Report - FY 2019/20
Information and Communications Technology and National Guidance Sector
The GoU approved budget for the ICT and National Guidance Sector for the FY 2019/20 is Ug
shs 104.006bn. The overall release for the sector as at 31st December 2019 was Ug shs 49.441bn
(48% of approved budget) and 82.4% (Ug shs 40.748bn) was spent in the period.
The budget performance was very good. The detailed budget performance for the sector
votes on the IFMS is shown in table 3.23.
works and Transport Sector
The GoU approved budget for the Works and Transport Sector for the FY2019/20 is Ug shs
3,359bn and, was revised to Ug shs 3654bn. The revision was on account of a supplementary
budget of Ug shs 4,087bn (representing less than 1% of the sector approved budget) under
Vote 16 - Ministry of Works and Transport. This was towards transport infrastructure- specifically
transfers to other government units. The sector absorbed 97% (Ug shs 1,936bn) which was very
good performance.
The detailed budget performance for the sector votes on the IFMS is shown in Table 3.24.
Public Sector Management
The GoU approved budget for Public Sector Management for the FY2019/20 is Ug shs 329.299bn
(excluding LGs and KCCA) and was revised to Ug shs 336bn on account of a supplementary
budget of Ug shs 7bn.
The sector realized 57% (Ug shs 200.823bn) of the approved budget and 74% (Ug shs 149.013bn)
was absorbed by 31st December 2019. The Ministry of Local Government (MoLG) had the least
performance of 45% (Ug shs 13.063bn), this was attributed to delayed commencement of
procurement
The detailed budget performance for the sector votes on the IFMS is shown in Table 3.25.
Trade Industry and Cooperatives Sector
The GoU approved budget for Trade Industry & Cooperatives for the FY 2019/20 is Ug shs
193.492bn and was revised to Ug shs 195.544bn.
The sector release was Ug shs 128.220bn (66% of the approved budget). The LGs were allocated
Ug shs 2.232bn, of which 50% (Ug shs 1.116bn) was released by 31st December 2019. The sector
experienced a supplementary budget of Ug shs 2.052bn for compensation of the third parties.
The sector absorbed 92% (Ug shs 117.785bn) which was very good performance. The detailed
budget performance as at 31st December 2019 on the IFMS is shown in Table 3.26.
Science, Technology and Innovation Sector
The GoU approved budget for the Science, Technology and Innovation Sector for FY 2019/20
is Ug shs 102.703bn, and was revised to Ug shs 194.523bn. The sector had a supplementary

Ministry of Finance, Planning and Economic Development
34 Accountability Sector: Semi-Annual Budget Monitoring Report - FY 2019/20
budget of Ug shs 91.820bn under transfers to other government units towards the construction
of the National Science Technology Institute in Kiruhura DLG.
The sector had a release of 139.5% (Ug shs 144.379bn) and 93% (Ug shs 134.810bn) was absorbed
by 31st December 2019. The detailed budget performance as at 31st December 2019 for the
sector votes on the IFMS is shown in Table 3.27.
Local Governments (LG) Performance and kampala Capital City Authority (kCCA)
The approved budget for Local Government (LGs) for the FY 2019/20 was Ug shs 3,685bn, of
which 1,845bn (50%) was released by 31st December 2019.
The Kampala Capital City Authority (KCCA) approved budget for FY2019/20 was Ug shs
294.931bn. The recurrent budget was Ug shs 216.163bn and development Ug shs 57.71bn
representing 73% and 20% respectively. The recurrent budget realized Ug shs 132.6bn, of which
Ug shs 78.92bn (60%) was absorbed. The development release was Ug shs 57.714bn (73% of
the budget) and Ug shs 48.924bn (85%) of the release.
Timeliness of accessing funds by the MDA and LGs
Whereas expenditure limits are issued promptly by the MFPED, the actual accessing of funds
varies for the different votes. Averagely the Central Government votes took 10 working days
to access funds from the time expenditure limits were issued (this includes the warranting
duration, approval invoicing and final release by accountant general’s office).The District Local
Governments (DLGs) took on average 2 days to complete warrant, 2 days to have their warrants
reviewed and approved and another 3 days to invoice and in total took 923 working days for the
LGs to access funds after communication of the expenditure limits.
The IFMS centres in Mbarara, Mbale, Gulu, Masaka remained with static budgets for the IFMS
recurrent costs which affected operations of the respective LGs hosting the IFMS centres.
It is increasingly difficult for supplementary budget requests to obtain approval from the MFPED even where these relate to situations where extra funds are received, for example Kole DLG realized Ug shs 70 million for Information Technology under the MoICT but this had taken over two months to be granted and the FY is about to end.
Local revenue collected by the LGs is transferred to the consolidated account at Bank of Uganda (BoU) and warrants issued by the MFPED to authorize utilization. However, thresholds are given showing the amounts to be collected and deposited to BoU before the authority to utilize subsequent local revenue collections is granted, this reform is causing delays in the budget execution of LGs and votes that under estimated their Non-Tax Revenue (NTR)
Overall Conclusion
The Government of Uganda (GoU) achieved at least 56% overall release performance for the Central Government votes, and 50% release for the LGs against their approved budgets (50.23%, 53%, 58% for wage, nonwage and development respectively). This was very good release performance. The approved budgets in 63% of the 11 priority sectors, KCCA and LGs
23 This lead time is average for both LGs on the IFMS and the ones that are not.

Ministry of Finance, Planning and Economic Development
35Accountability Sector: Semi-Annual Budget Monitoring Report - FY 2019/20
were revised as at 31st December 2019. The highest revision of Ug shs 91.820bn was registered under the Science, Technology and Innovation Sector, this was followed by the Accountability Sector at Ug shs 24.146bn.
The highest sector absorption of funds released was 97% (Ug shs 1,936bn) registered under Works and Transport Sector, and the least was 74% (Ug shs 149.013bn) registered under Public Sector Management. Overall the sectors achieved 90% absorption of funds released, which was good performance. The LGs achieved 80% (Ug shs 1,576bn) absorption of funds released which was also good.
key Challenges
1) Delayed approval of supplementary budgets especially in LGs seeking expenditure of extra funds received from line ministries caused delays in implementation of activities.
2) Warranting remains a challenge for a significant number of MDA&LGs which accounts for at least 60% of delays in accessing funds in these entities.
3) Constrained budget allocations to support PFM reforms that include the Programme Budgeting System (PBS) and IFMS regional centres.
Recommendations
1) The MFPED Budget Directorate should review the processing and timelines for approval of supplementary budget requests especially were additional funding is sent to MDAs and LGs.
2) The MFPED Budget Directorate, Tax Policy Department and URA should step up efforts to monitor revenue performance with the aim of improving revenue collections for budget allocations.
3) The MFPED Budget Directorate and Accountant Generals Office should consider budget allocations for recurrent activities to support the PFM reforms (PBS and IFMS regional centres).

Ministry of Finance, Planning and Economic Development
36 Accountability Sector: Semi-Annual Budget Monitoring Report - FY 2019/20
Tab
le 3
.17:
Acc
ou
nta
bili
ty S
ect
or v
ote
s B
ud
ge
t P
erf
orm
ance
as
at 3
1st D
ece
mb
er
2019
vo
tev
ote
D
esc
rip
tio
nA
pp
rove
d B
ud
ge
t (U
g S
hs)
R
ele
ase
(Ug
Sh
s) P
erf
orm
ance
Exp
en
dit
ure
Pe
rfo
rman
ceU
g s
hs
%g
e o
f2 B
ud
ge
t re
leas
ed
%g
e o
f re
leas
e
spe
nt
Re
c- (w
age
&
No
nw
age
)
D
evt
Re
c- (w
age
&
No
nw
age
)
D
evt
Re
c- (w
age
&
No
nw
age
)
D
evt
Re
cD
ev
Re
cD
ev
00
8M
FP
ED
44
2,23
7,8
35,1
39
61,
876
,324
,98
6
258
,452
,049
,88
0
37,
186
,56
3,0
68
23
7,79
7,6
32,9
05
31,
246
,725
,217
58
.46
09
28
4
103
Insp
ect
ora
te
of
Gov
ern
me
nt
(IG)
40,1
82,
939
,638
1
3,29
3,21
2,6
51
25,
294,
756
,29
9
9
,027
,624
,428
21,
858
,922
,80
2
54
6,7
75,7
30
62.
96
7.9
68
6
112
Eth
ics
and
In
teg
rity
8,5
92,
364,
137
-
4
,046
,10
3,21
7
- 3
,052
,30
4,9
22
-
47
75.4
129
Fin
anci
al
Inte
llig
en
ce
Au
tho
rity
12,8
01,
578
,446
215
,00
0,0
00
6,0
58,0
12,8
70
1
72,0
00
,00
0
5,4
24,0
60
,525
- 47
.38
08
9
131
Au
dito
r G
en
era
l-
Sta
tuto
ry
55,
86
9,1
28,8
97
8,0
50,0
00
,00
0
30,7
80
,26
8,8
90
5
,841
,10
0,0
00
28
,519
,219
,76
1
1,3
74,3
49,2
15
5572
.59
2.6
23.5
141
Ug
and
a R
eve
nu
e
Au
tho
rity
39
4,6
15,4
13,1
25
43,
639
,69
5,8
27
197
,30
7,70
6,5
62
13,
166
,90
8,8
11
197
,30
7,70
6,5
62
13,
166
,90
8,8
11
5030
100
100
143
Ug
and
a B
ure
au o
f S
tatis
tics
39
,671
,830
,840
20
,40
9,4
85,
946
2
2,18
7,36
3,8
06
8,4
96
,443
,18
2 17
,66
3,79
2,40
5 6
,08
0,0
51,9
66
55
.941
.679
.671
.5
153
PP
DA
13
,839
,555
,659
10
,99
4,0
00
,00
0
6,7
73,9
89
,38
8
3,8
93,
200
,00
0
6,0
04,
152,
116
1
,36
3,38
3,47
3 48
.935
.48
8.6
35
310
Ug
and
a In
vest
me
nt
Au
tho
rity
14
,341
,60
7,6
28
1,
105,
859
,00
0
6,9
63,
824
,048
3
67,
190
,20
0
5,1
27,7
60
,29
2
7
3,45
9,8
60
48
.533
.273
.620
Tota
l1,
022
,152
,253
,50
9
159
,58
3,57
8,4
10
557
,86
4,0
74,9
59
78
,151
,029
,68
9
549
,08
9,3
69
,911
5
3,8
51,6
54,2
72
54.5
499
8.4
69
So
urc
e: IF
MS
Ja
nu
ary
20
20, A
pp
rove
d E
stim
ate
s of
Rev
enu
e a
nd
Exp
end
itu
re F
Y 2
019
/20
an
d B
OT2
019
/20

Ministry of Finance, Planning and Economic Development
37Accountability Sector: Semi-Annual Budget Monitoring Report - FY 2019/20
Tab
le 3
.18
: Ag
ricu
ltu
re S
ect
or v
ote
s B
ud
ge
t P
erf
orm
ance
as
at 3
1st D
ece
mb
er
2019
vo
tev
ote
D
esc
rip
tio
nA
pp
rove
d B
ud
ge
t (U
g S
hs)
Re
leas
e (U
g s
hs)
Pe
rfo
rman
ceE
xpe
nd
itu
re (U
g s
hs)
P
erf
orm
ance
%g
e o
f B
ud
ge
t re
leas
ed
%g
e o
f re
leas
e
spe
nt
Re
curr
en
t (w
age
N
on
wag
e)
De
vtR
ecu
rre
nt
(wag
e
No
nw
age
)
De
vtR
ecu
rre
nt
(wag
e
No
nw
age
)
De
vtR
ec
De
vR
ec
De
v
010
M
AA
IF
45,6
63,
380
,311
14
1,12
1,9
55,5
60
25
,66
4,6
37,8
83
73,7
58,6
36,1
70
14
,943
,130
,045
41
,99
4,9
35,2
24
5652
5857
121
D
airy
D
eve
lop
me
nt
Au
tho
rity
6,4
89
,547
,69
1
3,6
42,4
34,9
87
3,0
74,3
29,0
85
1,8
14,2
95,
498
2,
372,
89
1,34
0
55
5,40
5,0
92
4749
7730
125
N
atio
nal
A
nim
al
Ge
ne
tic R
es.
C
ent
re a
nd
D
ata
Ban
k
9,8
97,9
62,
937
53
,344
,216
,572
5,
407,
369
,310
30
,66
1,35
1,77
7
4,
80
9,0
84,
294
20,8
78,5
80
,69
5 54
578
96
8
142
N
atio
nal
A
gric
ult
ura
l R
ese
arch
O
rgan
izat
ion
42,
188
,80
2,11
1
37
,472
,99
3,56
2
21
,055
,822
,917
15
,657
,326
,59
8
19
,916
,438
,428
10
,70
0,5
33,7
87
5041
94
68
152
N
AA
DS
S
ecr
eta
riat
5
,043
,90
1,8
97
140
,849
,89
1,54
2
2,
465,
675
,28
1 7
9,1
13,1
55,7
20
2,0
51,4
12,9
59
73,
60
7,50
7,75
2 48
568
39
3
155
C
ott
on
D
eve
lop
me
nt
Org
aniz
atio
n
4
,431
,247
,414
4,2
11,0
00
,00
0
2,3
15,4
53,1
88
1,8
64,
050
,00
0
2,26
1,71
4,78
9
89
6,0
10,0
27
5244
9748
16
0
Ug
and
a C
offe
e
Dev
elo
pm
ent
A
uth
orit
y
96
,219
,077
,68
2
4
82,
595,
349
7
7,44
9,8
08
,16
9
33
9,6
71,2
79
6
,516
,639
,19
6
68
,548
,26
7,0
12
7970
8.4
20
Tota
l 2
09
,933
,920
,043
3
81,
125,
08
7,57
2 1
37,4
33,0
95,
833
2
03,
208
,48
7,0
42
52,8
71,3
11,0
51
217
,18
1,23
9,5
89
6
553
3810
6
So
urc
e: IF
MS
Ja
nu
ary
20
20, A
pp
rove
d E
stim
ate
s of
Rev
enu
e a
nd
Exp
end
itu
re F
Y 2
019
/20
an
d B
OT
2019
/20

Ministry of Finance, Planning and Economic Development
38 Accountability Sector: Semi-Annual Budget Monitoring Report - FY 2019/20
Tab
le 3
.19
: Ed
uca
tio
n S
ect
or v
ote
s B
ud
ge
t P
erf
orm
ance
as
at 3
1st D
ece
mb
er
2019
vo
tev
ote
De
scri
pti
on
Ap
pro
ved
Bu
dg
et
(Ug
sh
s)R
ele
ase
(Ug
sh
s) P
erf
orm
ance
Exp
en
dit
ure
(Ug
sh
s)
Pe
rfo
rman
ce%
ge
of
Bu
dg
et
rele
ase
d
%g
e o
f re
leas
e
spe
nt
Re
c-(w
age
&
No
nw
age
)
D
evt
Re
c-(w
age
&
No
nw
age
)
D
evt
Re
c-(w
age
&
No
nw
age
)
D
evt
Re
cD
ev
Re
cD
ev
013
Min
istr
y o
f E
du
catio
n, a
nd
S
po
rts
2
53,4
14,7
25,5
36
79,4
90
,40
8,6
62
13
2,6
80
,257
,431
33
,276
,040
,329
11
2,11
1,50
7,46
0
12,9
30,3
22,7
80
52
418
438
111
B
usi
tem
a U
niv
ers
ity
35,4
38,1
70,1
87
1,
530
,79
0,4
80
18
,171
,770
,90
6
1,0
45,9
52,3
98
17,2
30,9
57,6
32
91,
059
,572
51
68
94
8.7
127
M
un
i Un
ive
rsity
13
,09
0,0
56,6
34
4,
200
,00
0,0
00
6
,634
,433
,229
1,
026
,60
0,0
00
5,
120
,615
,834
735,
398
,36
3 50
2477
71
128
U
NE
B
51,1
24,8
67,
578
15
,00
0,0
00
,00
0
48,1
09
,50
2,26
5
10
,49
0,7
04,
784
48
,10
9,5
02,
265
10,4
90
,70
4,78
5 9
470
100
100
132
E
du
catio
n S
erv
ice
C
om
mis
sio
n
9,2
27,7
03,
411
1
91,
530
,250
4,
68
9,6
13,2
02
153
,224
,20
0
4,0
94,
097
,336
5
3,58
9,7
20
508
08
734
136
M
ake
rere
U
niv
ers
ity
30
0,5
96
,98
0,3
93
15,5
16,2
09
,712
153,
161,
356
,60
2
7,
66
7,32
6,4
16
132,
932
,90
8,8
04
2,42
0,3
15,3
24
5149
4931
137
M
bar
ara
Un
ive
rsity
43
,441
,98
9,4
29
3,
68
5,76
8,7
14
22,2
99
,20
9,2
48
2,0
79,0
93,
836
21,6
12,9
70,7
38
6
85,
244,
98
8
5156
9733
138
M
ake
rere
U
niv
ers
ity
Bu
sin
ess
Sch
oo
l
71,8
60
,50
0,5
69
4,8
30,5
00
,00
0
36,6
11,2
79,5
93
2,54
4,40
0,0
00
35,2
97,2
45,4
41
2,12
5,6
81,
86
2 51
529
68
3
139
K
yam
bo
go
U
niv
ers
ity
12
5,72
6,2
52,8
90
6,7
22,8
45,1
06
6
3,76
7,8
87,
627
5,
378
,276
,08
5
56,5
92,
716
,59
1
931
,46
2,9
39
508
08
817
.3
140
U
gan
da
Man
age
me
nt
Inst
itute
31,4
04,
508
,06
4
1,8
90
,00
0,0
00
15
,90
5,6
26,9
52
9
60
,00
0,0
00
12,9
35,6
21,5
03
76
3,41
1,35
4 50
508
179
.5
149
G
ulu
Un
ive
rsity
44,6
48,8
61,
278
3,
80
2,72
4,59
8
2
1,9
97,5
90
,60
0
1
,36
2,45
3,6
09
1
9,6
11,0
02,
643
5
52,5
14,3
20
4936
89
40.5
30
1 L
ira U
niv
ers
ity
16
,39
9,6
76,1
12
2,5
00
,00
0,0
00
9
,40
5,21
7,50
0
1,8
00
,00
0,0
00
6
,86
3,6
44,0
25
1,7
99
,99
9,9
99
57
7273
99
.9
30
3 N
CD
C
10
,36
7,19
0,8
61
3,9
00
,00
0,0
00
6,3
66
,59
3,33
0
2,3
01,
500
,00
0
5,6
57,5
27,5
80
672
,916
,348
6
598
829
.2
30
7 K
abal
e U
niv
ers
ity
30
,96
8,9
50,0
02
1,3
82,
240
,00
0
15,
754,
566
,442
4
99
,58
4,0
00
1
4,0
17,5
68
,19
9
3
17,3
71,1
55
5036
89
63
30
8
So
roti
Un
ive
rsity
11,7
81,
777,
167
6,0
00
,00
0,0
00
5
,98
2,6
14,2
44
2,3
58,0
00
,00
0
4,0
46,2
81,
473
377,
209
,135
50
396
716
Tota
l 1
,049
,49
2,21
0,1
11
150
,643
,017
,522
56
1,53
7,51
9,1
69
7
2,9
43,1
55,6
57
49
6,2
34,1
67,
524
34,
947
,20
2,6
44
5348
88
48
So
urc
e: IF
MS
Ja
nu
ary
20
20, A
pp
rove
d E
stim
ate
s of
Rev
enu
e a
nd
Exp
end
itu
re F
Y 2
019
/20
an
d B
OT2
019
/20

Ministry of Finance, Planning and Economic Development
39Accountability Sector: Semi-Annual Budget Monitoring Report - FY 2019/20
Tab
le 3
.20
: En
erg
y S
ect
or v
ote
s B
ud
ge
t P
erf
orm
ance
as
at 3
1st D
ece
mb
er,
2019
vo
tev
ote
D
esc
rip
tio
nA
pp
rove
d B
ud
ge
t (U
g s
hs)
Re
leas
e ((
Ug
sh
s)) P
erf
orm
ance
Exp
en
dit
ure
((U
g s
hs)
) P
erf
orm
ance
%g
e o
f B
ud
ge
t re
leas
ed
%g
e o
f re
leas
e
spe
nt
Re
c-(w
age
&
No
nw
age
)
D
evt
Re
c-(w
age
&
No
nw
age
)
D
evt
Re
c-(w
age
&
No
nw
age
)
D
evt
Re
cD
ev
Re
cD
ev
017
Min
istr
y o
f En
erg
y an
d M
ine
ral
Dev
elo
pm
ent
71,2
95,
131,
325
460
,78
8,8
19,3
69
30
,923
,68
1,9
63
24
3,76
0,8
14,3
23
26
,46
8,2
14,9
74
20
7,23
1,45
1,49
6.0
0
4353
85
85
123
Ru
ral
Ele
ctrifi
catio
n
Ag
en
cy (R
EA
)
38,6
15,6
59,1
25
128
,139
,340
,875
17
,59
0,3
11,2
86
43
,59
2,0
56,3
98
12,3
11,1
98
,573
32
,512
,944
,977
.00
45
3470
74
311
Ug
and
a N
atio
nal
Oil
Co
mp
any
(UN
OC
)
31,4
70,1
20,0
24
-
17
,78
1,8
36,8
39
-
17
,78
1,8
36,8
39
-
560
100
0
312
Pe
tro
leu
m
Au
tho
rity
of
Ug
and
a (P
AU
)
50,1
99
,038
,626
-
24,6
27,0
62,
349
-
18,8
47,4
48,7
04
-
490
760
Tota
l 1
91,
579
,949
,10
0
588
,928
,16
0,2
44
90
,922
,89
2,43
7 2
87,
352,
870
,720
75
,40
8,6
99
,09
0
239
,744
,39
6,4
73
4748
.78
38
3
So
urc
e: IF
MS
Ja
nu
ary
20
20, A
pp
rove
d E
stim
ate
s of
Rev
enu
e a
nd
Exp
end
itu
re F
Y 2
019
/20
an
d B
OT2
019
/20

Ministry of Finance, Planning and Economic Development
40 Accountability Sector: Semi-Annual Budget Monitoring Report - FY 2019/20
Tab
le 3
.21:
he
alth
Se
cto
r vo
tes
Bu
dg
et
Pe
rfo
rman
ce a
s at
31st
De
cem
be
r, 20
19
vo
tev
ote
De
scri
pti
on
Ap
pro
ved
Bu
dg
et
(Ug
sh
s)R
ele
ase
(Ug
sh
s) P
erf
orm
ance
Exp
en
dit
ure
(Ug
sh
s)
Pe
rfo
rman
ce%
ge
of
Bu
dg
et
rele
ase
d
%g
e o
f re
leas
e
spe
nt
Re
c-(w
age
&
No
nw
age
)
D
evt
Re
c-(w
age
&
No
nw
age
)
D
evt
Re
c-(w
age
&
No
nw
age
)
D
evt
Re
cD
ev
Re
cD
ev
014
M
inis
try
of
He
alth
8
2,11
5,23
2,0
63
68
,20
7,8
24,8
60
49
,86
0,2
10,6
52
34,5
12,5
22,9
32
38
,556
,911
,334
18
,833
,346
,60
1 6
0.7
5177
54
10
7 U
gan
da
AID
S
Co
mm
issi
on
-S
tatu
tory
8,7
14,1
16,7
57
7,
80
9,0
00
4,
333,
497,
550
6,2
47,2
00
3,
630
,847
,133
3,6
59,0
00
49
80
83
58
114
U
gan
da
Can
cer
Inst
itute
20
,040
,69
2,11
2
13
,929
,26
4,97
1
10
,428
,66
0,0
85
10,5
51,7
41,2
43
9,9
84,
09
4,38
5
8
,66
3,20
7,26
3 52
759
5.7
82
115
U
gan
da
He
art
Inst
itute
20
,057
,157
,539
4,6
50,0
00
,00
0
10,1
46,0
48,3
78
3,37
4,0
00
,00
0
8,1
40,0
40,0
95
1,70
4,79
4,20
1 50
728
050
116
N
atio
nal
Me
dic
al
Sto
res
396
,172
,215
,017
-
26
5,36
7,56
9,4
27
-
259
,470
,915
,020
- 6
70
970
134
H
eal
th S
erv
ice
C
om
mis
sio
n
6,7
87,
263,
09
5
80
,00
0,0
00
3,
393,
631
,548
56
,00
0,0
00
2,
934
,39
3,41
2
18
,36
1,8
80
50
708
632
151
Ug
and
a B
loo
d
Tran
sfu
sio
n
Se
rvic
e (U
BT
S)
16,0
72,2
12,6
15
1,
870
,00
0,0
00
8
,16
8,3
06
,239
1,
442,
00
0,0
00
7,
533,
485,
60
4
1,
075
,39
9,9
99
50
.877
92
74.5
161
Mu
lag
o H
osp
ital
Co
mp
lex
60
,614
,754
,433
11
,020
,00
0,0
00
30
,458
,152
,80
5
5,
213,
00
0,0
00
27,3
22,6
05,
138
3,
107,
025
,112
50
478
9.7
60
162
Bu
tab
ika
Ho
spita
l
13
,272
,239
,213
8,3
08
,140
,579
6
,540
,674
,612
4,
038
,88
4,34
7
5,
754,
820
,58
4
206
,28
0,0
00
50
488
817
.1
304
UV
RI
6,7
89
,055
,59
3
2,28
0,0
00
,00
0
3,19
2,21
5,9
60
1,
201,
500
,00
0
2,53
6,2
03,
163
77,4
08
,250
47
5279
6.4
163-
176
Re
gio
nal
Re
ferr
als
Ho
spita
ls
151,
674
,621
,76
7
20
,06
7,56
2,16
8
82,
235,
223,
68
8
11,7
95,
569
,711
67,
352,
055
,16
9
6,1
34,2
52,9
13
5458
82
52
Tota
l78
2,30
9,5
60
,20
4 1
30,4
20,6
01,
578
4
74,1
24,1
90
,942
7
2,19
1,46
5,43
3 4
33,2
16,3
71,0
37
39,8
23,7
35,2
19
60
559
155
So
urc
e: IF
MS
Ja
nu
ary
20
20, A
pp
rove
d E
stim
ate
s of
Rev
enu
e a
nd
Exp
end
itu
re F
Y 2
019
/20
an
d B
OT2
019
/20

Ministry of Finance, Planning and Economic Development
41Accountability Sector: Semi-Annual Budget Monitoring Report - FY 2019/20
Tab
le 3
.22:
wat
er
and
En
viro
nm
en
t S
ect
or v
ote
s B
ud
ge
t P
erf
orm
ance
as
at 3
1st D
ece
mb
er
2019
vo
tev
ote
D
esc
rip
tio
nA
pp
rove
d B
ud
ge
t (U
g S
hs)
Re
leas
e (U
g S
hs)
Pe
rfo
rman
ceE
xpe
nd
itu
re (U
g S
hs)
P
erf
orm
ance
%g
e o
f B
ud
ge
t re
leas
ed
%g
e o
f re
leas
e
spe
nt
Re
c-(w
age
&
No
nw
age
)
D
evt
Re
c-(w
age
&
No
nw
age
)
D
evt
Re
c-(w
age
&
No
nw
age
)
D
evt
Re
cD
ev
Re
cD
ev
019
Min
istr
y o
f W
ate
r an
d
Env
iron
me
nt
71,2
95,
131,
325
460
,78
8,8
19,3
69
30,9
23,6
81,
96
324
3,76
0,8
14,3
2326
,46
8,2
14,9
7420
7,23
1,45
1,49
643
.353
85.
58
5
150
Nat
ion
al
Env
iron
me
nt
Man
age
me
nt
Au
tho
rity
38,6
15,6
59,1
2512
8,1
39,3
40,8
7517
,59
0,3
11,2
86
43,5
92,
056
,39
812
,311
,19
8,5
7332
,512
,944
,977
45.5
3470
74.5
157
Nat
ion
al
Fore
stry
A
uth
orit
y
31,4
70,1
20,0
24-
17,7
81,
836
,839
-17
,78
1,8
36,8
39-
56.5
010
00
302
UN
MA
50,1
99
,038
,626
-24
,627
,06
2,34
9-
18,8
47,4
48,7
04
-49
076
.50
Tota
l19
1,57
9,9
49,1
00
588
,928
,16
0,2
449
0,9
22,8
92,
437
287,
352,
870
,720
75,4
08
,69
9,0
90
239
,744
,39
6,4
7347
48.7
83
83
So
urc
e: IF
MS
Ja
nu
ary
20
20, A
pp
rove
d E
stim
ate
s of
Rev
enu
e a
nd
Exp
end
itu
re F
Y 2
019
/20
an
d B
OT2
019
/20
Tab
le 3
.23:
Info
rmat
ion
an
d C
om
mu
nic
atio
ns
Se
cto
r vo
tes
Bu
dg
et
Pe
rfo
rman
ce a
s at
31st
De
cem
be
r, 20
19
vo
tev
ote
De
scri
pti
on
Ap
pro
ved
Bu
dg
et
(Ug
Sh
s)R
ele
ase
(Ug
Sh
s) P
erf
orm
ance
Exp
en
dit
ure
(Ug
Sh
s)
Pe
rfo
rman
ce%
ge
of
Bu
dg
et
rele
ase
d
%g
e o
f re
leas
e
spe
nt
Re
c-(w
age
&
No
nw
age
)
D
evt
Re
c-(w
age
&
No
nw
age
)
D
evt
Re
c-(w
age
&
No
nw
age
)
D
evt
Re
cD
ev
Re
cD
ev
020
M
inis
try
of
Info
rmat
ion
&
Co
mm
un
icat
ion
s Te
ch.
24,9
71,9
41,3
40
38,2
22,8
39,6
82
10,9
29,1
82,
932
20
,36
0,3
60
,28
6
8,3
18,0
54,7
71
17,9
77,8
92,
00
2 43
.753
768
8
126
N
atio
nal
Info
rmat
ion
Te
chn
olo
gy
Au
tho
rity
33,
368
,823
,559
7,
442,
585,
563
15,
023
,856
,239
3
,127
,56
6,2
55
13,4
89
,29
2,0
81
96
3,29
2,0
27
4542
89
.730
.8
Tota
l 5
8,3
40,7
64,
89
9
45,6
65,
425,
245
25,
953
,039
,171
2
3,48
7,9
26,5
40
21,
80
7,34
6,8
52
18
,941
,18
4,0
29
44.4
51.4
84
80
So
urc
e: IF
MS
Ja
nu
ary
20
20, A
pp
rove
d E
stim
ate
s of
Rev
enu
e a
nd
Exp
end
itu
re F
Y 2
019
/20
an
d B
OT2
019
/20

Ministry of Finance, Planning and Economic Development
42 Accountability Sector: Semi-Annual Budget Monitoring Report - FY 2019/20
Tab
le 3
.24:
wo
rks
and
Tra
nsp
ort
Se
cto
r vo
tes
Bu
dg
et
Pe
rfo
rman
ce a
s at
31st
De
cem
be
r 20
19
vo
tev
ote
D
esc
rip
tio
nA
pp
rove
d B
ud
ge
t
Ug
sh
sR
ele
ase
Pe
rfo
rman
ceU
g s
hs
Exp
en
dit
ure
Pe
rfo
rman
ceU
g s
hs
%g
e o
f B
ud
ge
t re
leas
ed
%g
e o
f re
leas
e
spe
nt
Re
c-(w
age
&
No
nw
age
)
D
evt
Re
c-(w
age
&
No
nw
age
)
D
evt
Re
c-(w
age
&
No
nw
age
)
D
evt
Re
cD
ev
Re
cD
ev
016
M
inis
try
of
Wo
rks
and
Tr
ansp
ort
81,
051
,628
,871
37
4,52
1,59
6,0
72
78
,959
,450
,456
6
41,5
78,8
95,
706
77,3
31,8
54,9
05
641
,121
,48
9,9
3297
171
98
10
0
113
U
gan
da
Nat
ion
al R
oad
A
uth
orit
y
98
,613
,88
3,51
3
1,6
12,7
00
,20
5,71
4
535,
647
,023
,28
9
5,
574,
00
0,0
00
53
5,38
2,9
11,2
73
5,57
3,78
8,4
18
100
81
100
10
0
118
R
oad
Fu
nd
53
5,6
47,0
23,2
89
6
,870
,00
0,0
00
28,0
93,
89
4,79
5
6,4
55,3
51,1
79
27
,214
,044
,18
5
6
,455
,351
,179
10
010
0
97
10
0
Tota
l 7
15,3
12,5
35,6
73
1,9
94,
09
1,8
01,
786
4
2,70
0,3
68
,540
6
53,6
08
,246
,88
5 6
39,9
28,8
10,3
63
6
53,1
50,6
29,5
29
100
169
10
0
100
So
urc
e: IF
MS
Ja
nu
ary
20
20, A
pp
rove
d E
stim
ate
s of
Rev
enu
e a
nd
Exp
end
itu
re F
Y 2
019
/20
an
d B
OT2
019
/20
Tab
le 3
.25:
Pu
blic
Se
cto
r M
anag
em
en
t v
ote
s B
ud
ge
t P
erf
orm
ance
as
at 3
1st D
ece
mb
er,
2019
vo
tev
ote
D
esc
rip
tio
nA
pp
rove
d B
ud
ge
t (U
g s
hs)
Ug
sh
sR
ele
ase
(Ug
sh
s) P
erf
orm
ance
Ug
sh
sE
xpe
nd
itu
re (U
g s
hs)
P
erf
orm
ance
Ug
sh
s
%g
e o
f B
ud
ge
t re
leas
ed
%g
e o
f re
leas
e
spe
nt
Re
c-(w
age
&
No
nw
age
)
D
evt
Re
c-(w
age
&
No
nw
age
)
D
evt
Re
c-(w
age
&
No
nw
age
)
D
evt
Re
cD
ev
Re
cD
ev
00
3 O
ffice
of
the
Prim
e
Min
iste
r
85,
625
,523
,79
272
,16
6,9
21,2
57
42
,970
,719
,56
9
30,1
43,8
65,
940
34,9
17,7
07,
943
20
,758
,014
,78
2 50
41.7
81
68
.8
00
5 M
inis
try
of P
ub
lic
Se
rvic
e
26,6
21,1
38,8
86
4,9
12,7
58,9
76
12
,06
5,45
8,5
88
2,
188
,66
5,6
42
9,4
47,4
76,1
65
1,0
20,9
04,
799
45
44.5
7846
.6
011
M
inis
try
of L
oca
l G
ove
rnm
ent
22,4
96
,732
,89
518
,948
,68
8,9
04
10,7
53,3
49,8
74
18,3
98
,48
2,37
3
8
,326
,211
,749
4,
737,
726
,146
45
9777
25.7
021
E
ast A
fric
an
Co
mm
un
ity
Affa
irs
72,3
85,
920
,50
58
0,4
00
,00
0
58
,945
,372
,924
6
4,32
0,0
00
47,6
80
,147
,419
7,51
0,0
00
8
18
08
011
.6

Ministry of Finance, Planning and Economic Development
43Accountability Sector: Semi-Annual Budget Monitoring Report - FY 2019/20
vo
tev
ote
D
esc
rip
tio
nA
pp
rove
d B
ud
ge
t (U
g s
hs)
Ug
sh
sR
ele
ase
(Ug
sh
s) P
erf
orm
ance
Ug
sh
sE
xpe
nd
itu
re (U
g s
hs)
P
erf
orm
ance
Ug
sh
s
%g
e o
f B
ud
ge
t re
leas
ed
%g
e o
f re
leas
e
spe
nt
Re
c-(w
age
&
No
nw
age
)
D
evt
Re
c-(w
age
&
No
nw
age
)
D
evt
Re
c-(w
age
&
No
nw
age
)
D
evt
Re
cD
ev
Re
cD
ev
10
8
Nat
ion
al
Pla
nn
ing
A
uth
orit
y-S
tatu
tory
29,1
52,9
24,9
86
4,41
4,16
7,9
88
15,1
32,8
90
,70
4
3,
00
3,43
4,39
0
15
,075
,08
6,9
07
6
61,
424,
465
526
89
9.6
22
146
P
ub
lic
Se
rvic
e
Co
mm
issi
on
8,6
72,5
97,6
01
184,
222,
142
4,59
7,47
1,22
2
6
7,37
7,71
4
3,
976
,776
,56
0
29,4
21,6
00
53
36.5
86
43
147
L
oca
l G
ove
rnm
ent
F
inan
ce
4,6
57,4
99
,947
156
,69
9,8
40
2,
389
,50
3,97
5
103,
074
,912
2,
332,
256
,543
43
,10
5,44
4 51
.26
5.7
97.6
41.8
Tota
l24
9,6
12,3
38,6
12
100
,86
3,8
59,1
07
146
,854
,76
6,8
56
53,
96
9,2
20,9
71
121
,755
,66
3,28
6
27,
258
,10
7,23
6
58.8
538
350
So
urc
e: IF
MS
Ja
nu
ary
20
20, A
pp
rove
d E
stim
ate
s of
Rev
enu
e a
nd
Exp
end
itu
re F
Y 2
019
/20
an
d B
OT2
019
/20
Tab
le 3
.26
: Tra
de
an
d In
du
stry
vo
tes
Bu
dg
et
Pe
rfo
rman
ce a
s at
31st
De
cem
be
r, 20
19
vo
tev
ote
De
scri
pti
on
Ap
pro
ved
Bu
dg
et
Ug
sh
sR
ele
ase
Pe
rfo
rman
ceU
g s
hs
Exp
en
dit
ure
Pe
rfo
rman
ceU
g s
hs
%g
e o
f B
ud
ge
t re
leas
ed
%g
e o
f re
leas
e
spe
nt
Re
c-(w
age
&
No
nw
age
)
D
evt
Re
c-(w
age
&
No
nw
age
)
D
evt
Re
c-(w
age
&
No
nw
age
)
D
evt
Re
cD
ev
Re
cD
ev
015
Min
istr
y o
f Tra
de
, In
du
stry
an
d
Co
op
era
tive
s
75,4
87,
109
,832
44
,026
,56
8,0
92
67,
036
,222
,99
8
20,5
82,
89
8,6
15
6
2,8
83,
918
,240
18
,96
5,22
5,11
6
88
469
3.8
92
154
Ug
and
a N
atio
nal
B
ure
au o
f Sta
nd
ard
s
53
,18
3,0
02,
121
15,7
52,9
15,2
28
26,7
22,7
51,0
61
11,3
57,0
40,6
60
24,8
15,4
32,6
07
9,2
18,3
07,
570
50
729
2.8
81
306
Ug
and
a E
xpo
rt
Pro
mo
tion
Bo
ard
4,9
86
,858
,979
56,2
80
,720
2,
518
,374
,340
3,50
0,0
00
1,
90
1,8
42,5
53
-
506
.21
75
Tota
l 1
33,6
56,9
70,9
32
59
,835
,76
4,0
40
96
,277
,348
,39
9
31,9
43,4
39,2
75
89
,60
1,19
3,40
0
28,1
83,
532,
68
6
7253
.39
38
8.2
So
urc
e: IF
MS
Ja
nu
ary
20
20, A
pp
rove
d E
stim
ate
s of
Rev
enu
e a
nd
Exp
end
itu
re F
Y 2
019
/20
an
d B
OT2
019
/20

Ministry of Finance, Planning and Economic Development
44 Accountability Sector: Semi-Annual Budget Monitoring Report - FY 2019/20
Tab
le 3
.27:
Sci
en
ce, T
ech
no
log
y an
d In
no
vati
on
vo
tes
Bu
dg
et
Pe
rfo
rman
ce a
s at
31st
De
cem
be
r, 20
19
vo
tev
ote
De
scri
pti
on
Ap
pro
ved
Bu
dg
et
Ug
sh
sR
ele
ase
Pe
rfo
rman
ceU
g s
hs
Exp
en
dit
ure
Pe
rfo
rman
ceU
g s
hs
%g
e o
f B
ud
ge
t re
leas
ed
%g
e o
f re
leas
e
spe
nt
Re
c-(w
age
&
No
nw
age
)
D
evt
Re
c-(w
age
&
No
nw
age
)
D
evt
Re
c-(w
age
&
No
nw
age
)
D
evt
Re
cD
ev
Re
cD
ev
023
Min
istr
y o
f S
cie
nce
, Te
chn
olo
gy
and
In
nov
atio
n
35,8
73,6
28,7
48
53,3
87,
838
,80
0
14,7
57,0
25,6
75
12
2,42
0,5
42,7
80
10,6
37,7
22,6
42
11
7,39
5,28
1,0
33
4122
972
95.
8
110
Ug
and
a In
du
stria
l R
ese
arch
In
stitu
te
12,6
67,
935
,06
0
1,
562,
00
0,0
00
6
,613
,925
,215
587,
200
,00
0
6,3
07,
98
3,14
3
469
,974
,957
52
379
579
.8
Tota
l
48
,541
,56
3,8
08
54
,949
,838
,80
0
21,3
70,9
50,8
91
12
3,0
07,
742,
780
16,9
45,7
05,
785
11
7,8
65,
255,
99
0
4422
379
95.
8
So
urc
e: IF
MS
Ja
nu
ary
20
20, A
pp
rove
d E
stim
ate
s of
Rev
enu
e a
nd
Exp
end
itu
re F
Y 2
019
/20
an
d B
OT2
019
/20

Ministry of Finance, Planning and Economic Development
45Accountability Sector: Semi-Annual Budget Monitoring Report - FY 2019/20
3.3: vote 141: Uganda Revenue Authority
Background
Uganda Revenue Authority (URA) is mandated to collect, and make assessment of specific
tax revenue, administer, enforce and account for such revenue. Its strategic direction is to
cultivate a tax paying culture through provision of reliable services, leadership development
and building strategic partnerships and to provide excellent revenue services with purpose
and passion. The authority has two programs which were monitored to assess the level of
implementation.
i) Programme 18: Administration and Support Services whose outcome is achieving efficient
and effective institutional services, and
ii) Programme 54: Revenue Collection and Administration whose outcome is to maximize
revenue.
Performance
The URA addresses the NDP II objective of increasing the tax to gross domestic product (GDP)
ratio whose target for FY 2019/20 is 15.13% of GDP. During the first half of FY 2019/20, a net
revenue of Ug shs 9,042.01 bn (92.84%) was realized against a target of Ug shs 9,739.39bn.
This represents approximately a GDP ratio of approximately 9% of the 15.13% target for the
FY2019/20.
The tax register grew by 4.3% representing 86% performance. Hoima Regional Office registered
2,529 taxpayers against a target of 1,397, whereas Mbale Regional Office registered 2,132 against
a target of 1,672. The E-tax platform from the Local Governments (LGs) was considered user
friendly and the votes were able to file returns and make payments sustainably.
Programme 1418: Administration and Support Services
The programme approved budget for FY2019/20 was Ug shs 215.77bn, of which Ug shs 110.73bn
(51.3%) was released and Ug shs 99.33bn (89.7%) spent by the end of Q2. The programme has
6 sub-programmes: i) Internal Audit and Compliance, ii) Corporate Services, iii) Legal Services,
iv) Legal Services, v) Research and Planning, and vi) Support to URA.
Internal Audits and Compliance
The e-Tax platform improved taxpayer compliance by enabling faster assessment, filing of
returns and payment of taxes. It was noted from the LGs that filing of returns (WHT and PAYE)
was easy and faster except if done on the deadline. In Lira DLG e taxpayers were happy to note
that they can make their payments through any Bank, thus improving compliance.
A total of 90 compliance audits, reviews and investigations were done, and reports issued
accordingly. This was against a target of 63. 90% of the audit and compliance review
findings were adopted. Compliance has greatly improved as was observed in the ministries,
Departments, Agencies and Local Governments assessed for Tax compliance.

Ministry of Finance, Planning and Economic Development
46 Accountability Sector: Semi-Annual Budget Monitoring Report - FY 2019/20
Nine sexual harassment sensitizations were conducted, seven (7) staff integrity sensitizations
conducted against a target of one (1), therefore extra integrity initiatives were conducted to
ensure staff adhere to the code of conduct as well as check their integrity. This is done in order
to increase taxpayer confidence in the authority thus improving tax compliance.
Administrative Support Services
Champions to support women in trade at station level were appointed. The different stations
also provided trade sensitization and facilitation to both individual women traders and women
trader groups to ease their trade at the border points. This was particularly noted at the two
border points monitored i.e. Mutukula border and Mirama border. At Mutukula border there
was an office for women traders who also operate a SACCO in the premises. They use the
office to store some of their produce brought for sell.
A total of 19 unplanned system downtimes were experienced against a target of 6. Average
system recovery took 1.89 hours. Despite the downtimes, the average real time system recovery
was less than two hours. As a result, there was minimum interruption to normal business. This
was noted across all LGs and regional URA offices.
The Equal Opportunities Employment Programme was executed as planned. Staff were hired
and on merit and availability of opportunity with no bias against any individual or group of
persons on the ground of sex, age, race, color ethnic origin, tribe, birth etc.
Legal Services
During the review period, 79% of the cases were won and settled in URA’s favor, this was against
a success rate target of 65%. A total of 19 judgments/rulings were received, of which 15 were
decided in favor of URA, and four decisions in favor of the clients. The Authority recovered Ug
shs 22bn in tax debt against a target of Ug shs 20bn.
Public Awareness and Tax Education/Modernization
Two taxpayer education outreach programmes were executed against a target of one. These
include tax barazas, diaspora engagements, tax katale, and exhibitions/expo. Twenty tax
clinics and engagements were held across regions and districts the planned target of 50.
Two tax education school and universities programs targeting the youth were done through 17
engagements i.e. tax school’s visitations and tax societies engagements - dance and drama
competitions etc. AT Loro Core PTC in Oyam District, a tax engagement activity was held in
November 2019.
The media programs executed included: 70 radio/TV shows, 10 media stories, 10 press
conferences and social media campaigns which yielded 92% positive sentiments.
The Lira Regional Office carried out tax awareness programs in conjunction with Microfinance
Support Center (MSC) and Uganda Registration Services Bureau (URSB). Radio talk shows
were done on Radio Lango and these handled the different types of taxes. All tax agents in the
sub-region were vigorously engaged in the campaigns.
Ministry of Finance, Planning and Economic Development
47Accountability Sector: Semi-Annual Budget Monitoring Report - FY 2019/20
The Hoima office handled three engagements with MSC staff and their clients, Petroleum
Authority of Uganda, and mobile money agents in the area. They had eight radio talk shows by
January 2020.
The Mbale office held several sensitizations which included: an outreach targeted rental
taxpayers, another handled small business taxpayers, and school owners. Two radio talk
shows about TREP and Presumptive tax were also done.
Government Buildings and Administrative Infrastructure
Management and maintenance of One Stop Boarder Points (OSBP) was conducted. Repairs
and maintenance issues resolved include, generator maintenance and servicing at the border
points, the renovation of the Mutukula powerhouse, emptying septic tanks at Malaba and
Busia borders.
Headquarter building snag list during the defect’s liability time were executed, these included
hanging cables, a defective card reader, non-functional switches, hand driers and water
heaters. The defects were repaired and are still on going as planned.
Office furniture and fittings were purchased. These included five counter chairs, three
orthopedic/ergonomic chairs and 10 flip chat stands. The programme performance was good
at 95.4% performance by 31st December 2019, detailed information in the table 3.28.

Ministry of Finance, Planning and Economic Development
48 Accountability Sector: Semi-Annual Budget Monitoring Report - FY 2019/20
Table 3.28: Performance of Administration and Support Services Programme as at 31st
December 2019Output Performance
Sub Pro-gramme
Output Annual Budget (Ug shs)
Cum. Receipt (Ug shs)
Annual Target
Cum. Achieved Quantity
Physical perfor-mance
Score (%)
Remark
Internal Audit and compli-ance
Internal audit and compliance
8,580,000,000
4,610,000,000 100 100 3.98 There was increased com-pliance as seen from all LGs monitored.
Corporate services
Administrative Support ser-vices
128,050,000,000
65,730,000,000
100 50 57.81 Overload of the system due to high data-base utilization. Performed as planned.
legal Services Legal services 8,700,000,000
4,630,000,000
100 65 4.03 The perfor-mance was excellent due to great teamwork.
Research & Planning Pub-lic Awareness and Tax Edu-cation
Public aware-ness and Tax Education/Modernization
26,800,000,000
13,940,000,000 100 68 12.42 Excellent per-formance as the awareness campaigns done were more than the planned at half year.
Support to URA
Government buildings and Administrative Infrastructure
5,600,000,000
2,800,000,000
100 50 2.60 Headquarter building snags were fixed and maintenance of the One Stop Border Points
Purchase of Motor vehicles and other trans-port Equipment
5,020,000,000
2,510,000,000 100 55 2.33 Performed as planned
Purchase of Office and ICT Equipment, including soft-ware
32,920,000,000
16,460,000,000
100 50 2.60
Purchase of Specialized Machinery and Equipment
50,000,000
30,000,000
100 55 2.33 Performed as planned
Purchase of office and Resi-dential Furniture and Fittings
50,000,000
30,000,000
100 40 12.21 Performed as planned
Programme Performance (Outputs)
215,770,000,000
110,740,000,000 100 68 95.41 Excellent Per-formance
Source: Author’s Compilation
The output performance was excellent at 95.41%. There was increased sensitization and tax
awareness campaigns done. This highly contributed to the greater compliance levels across
the northern, eastern and western regions of the country. The e-tax platform continued to
make it easy for taxpayers to file their returns thus increased compliance.

Ministry of Finance, Planning and Economic Development
49Accountability Sector: Semi-Annual Budget Monitoring Report - FY 2019/20
b) Programme 1854: Revenue Collection and Administration
The approved programme budget FY 2019/20 is Ug shs 222.77bn, of which Ug shs 110.73bn
was released and Ug shs 99.33bn spent by 31st December 2019.The programme has three
sub-programmes: i) Domestic Tax Collection, ii) Customs Tax Collections, iii) Tax investigations.
Domestic Tax Collections
Total domestic tax collections during the half year FY 2019/20 were Ug shs 5,673.57bn
representing 44.26% revenue collected against a target collection of 47.66%. New taxpayers
totaling to 63,979 were added onto the tax register and this was boosted by the Tax Registration
Expansion Project (TREP) initiative. The half year register growth represented 4.30% against a
targeted register growth of 5% hence representing an 86% performance.
Tax audits totaling to 589 were conducted against a target of 1,404. Additionally, a total of
13,992 compliance inspection actions were conducted to conclusion against a target of 3,551.
Significant deficits were registered in rental tax. It was noted that the URA increased awareness
campaigns in rental tax. This was noted in Arua, Lira, Mbale and Mbarara sub-region offices.
Customs Tax Collections
Total customs collections during the review period were Ug shs 3,537.31bn against a target of
Ug shs 3,798 bn. A total of 131 post clearance audits were completed. A total of 109 intelligence
focused operations were conducted, 3,890 seizures were executed, and these resulted into
recovery of Ug shs 36.30bn. The electronically tracked cargo during the period was 17.58%
against a target of 25%. Total transit cargo was 159,189 of which 27,993 was electronically
tracked.
The total customs tax collections were below the target, and this was partially attributed to
the closure of the two borders in the west, (Katuna and Mirama) and a lot of imports that fall
in the exemption category. Additionally, many previously imported items in various sectors
are currently being manufactured in the country e.g. tiles, steel products etc. and such goods
attract import duty of 25% and above. The electronic cargo tracking was affected by wear and
tear of the seals that are used hence variation in performance.
The Mutukula and Mirama One Stop Border Points were monitored. The Mutukula border had
finished the installation of the drive through cargo scanner. An office was provided for women
traders who also operate a SACCO in the premises. A health facility was also in place plus
equipment, and a health practitioner was being recruited. This is expected to improve the
smooth floor of traffic at the border. It was noted that almost 80% of the cargo is produce from
Tanzania e.g. cassava, Soya beans, beans, maize, cotton seed cake, ground nuts etc. The other
20% is cargo for motor vehicles and spare parts. It was also noted that smuggling still takes
place at this border point as it is a porous border.
The One Stop Border Point at Mirama Hills was completed. The drive through scanner was not
yet in place by January 2020. The goods at this point go to Rwanda and they are from Kenya
and China. The goods from Uganda were not allowed through this point. Goods from Rwanda

Ministry of Finance, Planning and Economic Development
50 Accountability Sector: Semi-Annual Budget Monitoring Report - FY 2019/20
to Uganda include scrap e.g. rubber paper and spaghetti. It was noted that monthly collections
at this border point had increased since the closure of the Katuna border. All goods were
diverted to this point. Previously, monthly collections were about Ug shs 36m and currently it
ranges in to about Ug shs 680m.
61
this point. Previously, monthly collections were about Ug shs 36m and currently it ranges in to about Ug shs 680m.
Top: Structure for the Drive through Scanners
Bottom: The Non- Intrusive Inspection Unit
Entrance to the drive Through Scanner Scanner
The Mutukula One Stop Border Point was complete and operational
Tax Investigations
A total of 53 scheme and sector-based cases were investigated to conclusion against a target
of 40. Additionally intelligence, science and forensic services were provided to 80% of the
requests received through forensic analysis, disposals and intelligence surveillance. Eight
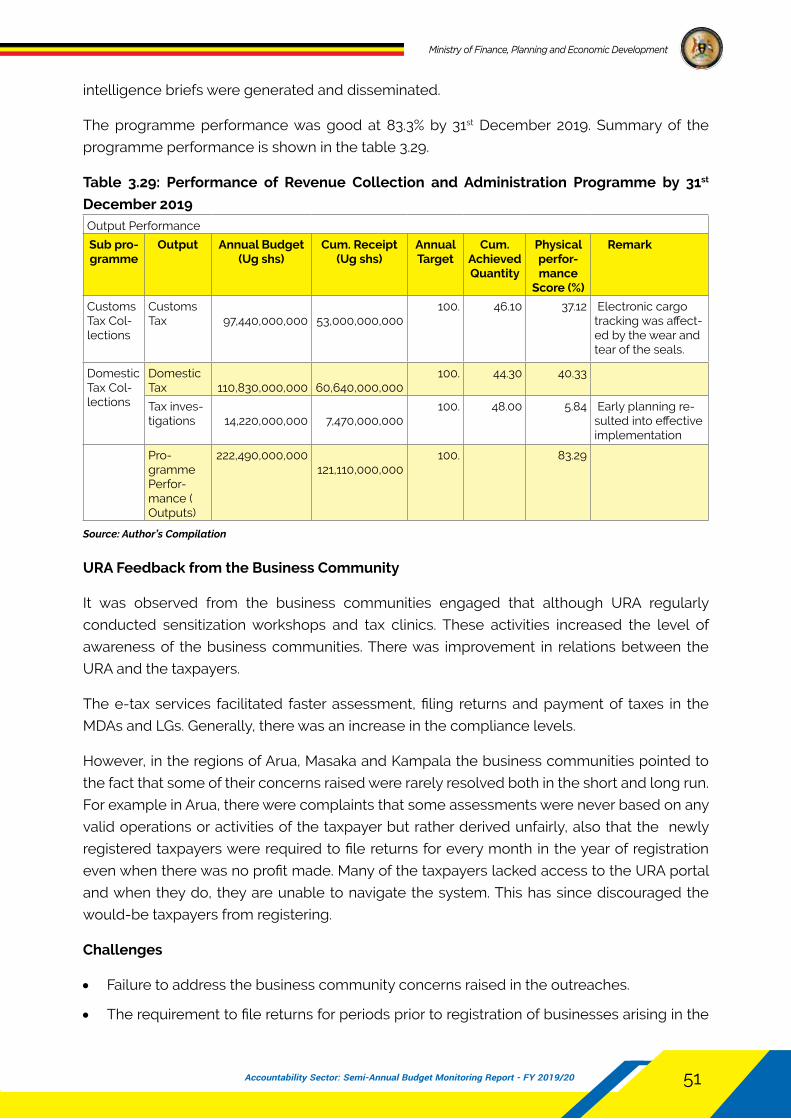
Ministry of Finance, Planning and Economic Development
51Accountability Sector: Semi-Annual Budget Monitoring Report - FY 2019/20
intelligence briefs were generated and disseminated.
The programme performance was good at 83.3% by 31st December 2019. Summary of the
programme performance is shown in the table 3.29.
Table 3.29: Performance of Revenue Collection and Administration Programme by 31st
December 2019Output Performance
Sub pro-gramme
Output Annual Budget (Ug shs)
Cum. Receipt (Ug shs)
Annual Target
Cum. Achieved Quantity
Physical perfor-mance
Score (%)
Remark
Customs Tax Col-lections
Customs Tax
97,440,000,000
53,000,000,000
100. 46.10 37.12 Electronic cargo tracking was affect-ed by the wear and tear of the seals.
Domestic Tax Col-lections
Domestic Tax
110,830,000,000
60,640,000,000
100. 44.30 40.33
Tax inves-tigations
14,220,000,000
7,470,000,000
100. 48.00 5.84 Early planning re-sulted into effective implementation
Pro-gramme Perfor-mance ( Outputs)
222,490,000,000 121,110,000,000
100. 83.29
Source: Author’s Compilation
URA Feedback from the Business Community
It was observed from the business communities engaged that although URA regularly
conducted sensitization workshops and tax clinics. These activities increased the level of
awareness of the business communities. There was improvement in relations between the
URA and the taxpayers.
The e-tax services facilitated faster assessment, filing returns and payment of taxes in the
MDAs and LGs. Generally, there was an increase in the compliance levels.
However, in the regions of Arua, Masaka and Kampala the business communities pointed to
the fact that some of their concerns raised were rarely resolved both in the short and long run.
For example in Arua, there were complaints that some assessments were never based on any
valid operations or activities of the taxpayer but rather derived unfairly, also that the newly
registered taxpayers were required to file returns for every month in the year of registration
even when there was no profit made. Many of the taxpayers lacked access to the URA portal
and when they do, they are unable to navigate the system. This has since discouraged the
would-be taxpayers from registering.
Challenges
• Failure to address the business community concerns raised in the outreaches.
• The requirement to file returns for periods prior to registration of businesses arising in the

Ministry of Finance, Planning and Economic Development
52 Accountability Sector: Semi-Annual Budget Monitoring Report - FY 2019/20
middle of a financial year discourages voluntary registration.
• Local governments offer licenses to businesses/individuals without Tax Identification
Numbers (TINS) and this contributed to low collections.
Recommendations
• The URA should review engagements with stakeholders with a possibility of giving
responses to concerns raised
• The URA should support the newly registered businesses to complete returns for periods
prior to registration within a FY.
• The URA should extend the durations of the stakeholder engagements in the regions
to include practical support of the clients for example by completing some returns and
procedures.
• URA should strengthen collaborations with other government institutions through
awareness engagements to support collection of taxes.
3.4: vote 153: Public Procurement and Disposal of Public Assets (PPDA) Authority
Introduction
The Public Procurement and Disposal of Public Assets (PPDA) is geared to the outcome of
value for money in the management of public resources and to the budget execution and
accountability thematic area
The PPDA is responsible for ensuring the application of fair, competitive, transparent, non-
discriminatory and value for money procurement and disposal standards and practices, monitor
compliance of procuring and disposing entities and build procurement Public Procurement and
Disposal of Public Assets (PPDA) is responsible for ensuring; the application of fair, competitive,
transparent, non- discriminatory, and value for money procurement and disposal capacity in
Uganda among the key roles. The authority has two programmes: a) General Administration
and Support, b) Regulation of the Procurement and Disposal System.
Performance
There was improved performance mainly attributed to; promotion of transparency through
conducting procurement and disposal audits; investigations to address the weaknesses that
have undermined public procurement through malpractices; enhancing efficiency through
review of procurement plans and reports to monitor the implementation of the procurement
plans especially the procurement lead times, use of the register of providers to offer reliable
and updated information to Entities and the general public on the competencies of providers.
Programme 1456: Regulation of the Procurement and Disposal System
The programme approved budget for FY 2019/20 is Ug shs 18.2bn, of which Ug shs 5.84bn
was released and Ug shs 1.63bn spent by 31st December 2019. The programme has two sub-

Ministry of Finance, Planning and Economic Development
53Accountability Sector: Semi-Annual Budget Monitoring Report - FY 2019/20
programmes: i) Headquarters, and ii) Support to PPDA.
i) headquarters
The approved budget for the sub-programme is Ug Shs 7.02bn, of which Ug shs 4.49bn
was released and Ug shs 4.39bn spent by 31st December 2019. The sub-programme has five
directorates which were assessed and below are the findings.
a) Performance Monitoring Directorate
The PPDA established regional offices in Mbale, Gulu and Mbarara to facilitate easy access
for the entities out of Kampala. The support to the entities entails value for money audits,
performance monitoring advisory services and capacity building engagements. The Authority
conducted 27 procurement audits, and this was ascertained from the LGs monitored during
the period e.g. Lira, Mbale. The PPDA provided support on the use of the e-Government
Procurement Portal (GPP) to entities on the system and also conducted 73 compliance
inspections.
The authority conducted compliance inspections of the records and proceedings of the
Procuring and Disposing Entities (PDEs) to ensure full and correct application of the PPDA Act
and issued twenty-four inspection reports.
The participation of local providers in the public procurement marketplace is still low in terms
of value. The local providers account for the provision of 99.5% of contracts and 87.3% by value
as at 31st December 2020. Procurements to local providers tend to be of low value in nature,
attributed mainly to the low capacity to handle large value contracts.
The Mbarara Regional Office carried out procurement audits and all entities were satisfactory
apart from Kanungu and Ntoroko districts. Nine firms from Kanungu District were blacklisted
due to forgeries. The entities whose procurements were rated unsatisfactory were mainly due
to preparation of substandard statements of requirements by user departments, this resulted
in poor service delivery, poor contract management, and delayed disposals of public assets.
There were instances were members of respective evaluation committees did not declare
conflict of interest, this was the case in Mbarara and Gulu zonal offices.
The PPDA received 17 complaints, of which 4 were referred to the Accounting Officers for
investigation, and 4 handled as administrative reviews.
A total of 2,030 providers were registered, of which 937 were new registrations, while 1,093
providers renewed their subscription
The contracts handled under the HYBRID procurement method for the construction of seed
schools and health centre IIIs were not yet complete even after rolling over to the subsequent
financial year.
There was an increase in the average time taken to complete a procurement cycle as compared
to the same period for FY2018/19. This is an indication that procurement inefficiencies are on
the rise and this calls for better mechanism to curb them.

Ministry of Finance, Planning and Economic Development
54 Accountability Sector: Semi-Annual Budget Monitoring Report - FY 2019/20
The efforts to regulate previously unregulated time frames such as time taken during evaluation
under the amendments to the PPDA Act 2006. Entities were still taking longer than the
recommended timelines. Other areas of concern remain the administrative timelines such as
time between submission of bids and start of evaluation, and time taken between completion
of evaluation and submission to the Contracts Committee. Time taken at these stages remains
unnecessarily long. The Authority is working with PDEs to ensure that delays at these stages
of the procurement process are minimized.
b) Capacity Building and Advisory Directorate
The Authority conducted trainings targeting different stakeholders like technical staff, contracts
committee members and civil society organisations (CSOs). It was also noted that the LGs under
the regional PPDA offices of Gulu, Mbarara and Mbale usually get more support compared
to those under the head/central office. The Authority also monitored the implementation of
guidelines on preference and reservation schemes, developed monitoring tools, issued a
circular to all entities on the updated template for the procurement plan.
The Mbale Regional Office trained stakeholders at Kumi MC, Nabilatuk and Bukedea DLGs
about the public procurement process, their roles and responsibilities in the procurement
and disposal process, preparation of statements of requirements, procurement and disposal
planning, disposal of public assets and contract management.
Additionally, the PPDA Eastern Regional Office in partnership with Transparency International
Uganda (TIU) undertook training for Small and Medium Enterprises (SMEs) on the preparation
of responsive bids in public procurement. The participants were also equipped with knowledge
of procurement & disposal processes with specific detail on E-Government Procurement. The
regional office also supported and trained stakeholders at Soroti Regional Referral Hospital.
The Authority observed low level of capacity in entities and noted the need for more sustained
hands on support for the stakeholders in the procurement process including the political
leaders.
c) Legal and Investigations Department
The Authority carried out investigations into mismanagement of procurements and disposals
in MDAs and LGs. They handled 90 complaints, of which 36 were worth Ug shs 371,036,336,369.
The authority found merit in 14 complaints and no merit in 22 complaints. Nine firms from
Kanungu District were blacklisted. Laxity in process of conducing procurements was noted in
some hard-to-reach LGs. This was pointed out about Ntoroko DLG.
d) E-Government
The implementation status of the e-GP system stands at 67%. Integration with other systems
was completed with the exception of the PBS and National Identification Registration Authority
(NIRA) which will be integrated after go-live expected in the third quarter.

Ministry of Finance, Planning and Economic Development
55Accountability Sector: Semi-Annual Budget Monitoring Report - FY 2019/20
ii) Support to PPDA
e) Government Buildings and Administrative Infrastructure
The physical progress on the construction of the office block was at 37%. Summary for the
performance of Programme 1456 Regulation of the Procurement and Disposal System is
shown in table 3.30.
Table 3.30: Performance of Regulation of the Procurement and Disposal System Programme
as at 31st December 2019
Output Performance
Regula-tion of the Procure-ment and Disposal System.
Output Annual Budget (Ug shs)
Cum. Receipt (Ug shs)
Annual Target
Cum. Achieved Quantity
Phys-ical per-for-
mance Score
(%)
Remark
Headquar-ters
Perfor-mance monitoring Directorate
3,080,000,000
2,760,000,000
100.00 50.00 9.54 Good per-formance
Capacity building and adviso-ry Director-ate
1,340,000,000
990,000,000
100.00 58.00 5.84 The Gulu office per-formed more than it had planned
Legal and investiga-tions Direc-torate
1,330,000,000
30,000,000
100.00 3.00 7.38 Performed well though it did not receive the expected funds.
E-Govern-ment
1,270,000,000
710,000,000
100.00 67.00 7.05 The system is at 67%.
Support to PPDA
72 Govern-ment Build-ings and Administra-tive Infra-structure
10,990,000,000
1,340,000,000
100.00 37.00 40.5 Done as planned
Total 18,010,000,000 5,830,000,000 0.00 0.00 70.31
Programme Perfor-mance (Outputs)
70.31 Good Per-formance
Source: Author’s Compilation
Programme 1412: General Administration and Support Services
The programme approved budget for FY 2019/20 is Ug shs 6.82bn, of which Ug shs 2.28bn

Ministry of Finance, Planning and Economic Development
56 Accountability Sector: Semi-Annual Budget Monitoring Report - FY 2019/20
was released and Ug shs 1.63bn spent by 31st December 2019. The programme has two sub-
programmes i) Corporate Affairs, and ii) Operations.
i) Corporate Affairs
Performance was good as a number of planned outputs: Financial, procurement and human
resource audits were conducted. The PPDA progress reports, updating the monitoring and
evaluation framework, and follow up on PPDA recommendations in MDAs and LGs were done.
The monitored LGs noted that they were working towards addressing all recommendations by
the PPDA.
ii) Operations
Staff salaries, gratuities and social security were paid timely. Health insurance was provided
to staff and defendants. Summary performance of the General Administration and Support
Services Programme is in table 3.31.
Table 3.31: Performance of the General Administration and Support Services Programme
by 31st December, 2019
Output Performance
General admin-istration and Sup-port ser-vices
Output/Subpro-
grammes
Annual Budget (Ug shs)
Cum. Receipt (Ug shs)
Annual Target
Cum. Achieved Quantity
Physical perfor-mance
Score (%)
Remark
06 Cor-porate Affairs
2,740,000,000 890,000,000
100 50 40.18 Performed as planned
07 Oper-ations
4,080,000,000 1,400,000,000
100 50 59.82 No varia-tions
Pro-gramme Perfor-mance
6,820,000,000 2,290,000,000
200 100 100 Excellent perfor-mance
Source: Author’s Compilation
Conclusion
The performance of the PPDA was good at an average rate of 70.3%. The PPDA received and
handled 17 applications for Administrative Review by bidders dissatisfied with the evaluation
process and the decisions of Accounting Officers. One application was withdrawn, eight (42%)
applications were upheld, and 11 (57.9%) applications were rejected. Out of the 18 decisions
made, four were appealed against at the PPDA Appeals Tribunal and the tribunal dismissed all
the applications.
The average lead time taken to complete the procurement cycle with open domestic bidding
method is 167.9 days (35 contracts) from the data entered into the GPP so far. This is still above
the indicative lead time frame for open domestic bidding which is 100 working days giving a
variance of 67.9 days. Implementation status of the e-GP system stands at 67%.

Ministry of Finance, Planning and Economic Development
57Accountability Sector: Semi-Annual Budget Monitoring Report - FY 2019/20
The number of local providers account for the provision of 99.5% of contracts and 87.3% by
value. The proportion of contracts that have been awarded through open competition are
71.4% (Ug shs 87,333,472,267) by value and 6.7% by number.
Challenges
• The Hybrid method used for the procurement of contractors for the construction of seed
schools and health center IIIs under the Inter Fiscal Government Transfers Project resulted
into delays in completion of construction works.
• Understaffing in the procurement and disposal units (PDUs). Twelve (50%) of the monitored
LGs had only one procurement officer. This affects workflow leading to under performance
in procurement.
• Lack of sufficient funding for capacity building activities. The regional offices can only carry
out demand driven trainings which are funded by the entities.
• Limited procurement audit coverage especially in the central region on account of large
coverage area (no regional office) and with inadequate capacity and capability.
• Limited users’ knowledge of the procurement procedures and laws, hence increasing the
procurement lead times and subsequent delayed service delivery.
Recommendations
• The PPDA advisory function for procurement methods to be applied by the PDEs should
give guidance on the efficient implementation of the Hybrid method to avoid delays
experienced in execution of some contracts
• The PPDA should plan for a budget allocation towards capacity building activities to the
PDEs.
• The PPDA and MFPED should expedite the dissemination and operationalization of the
revised PPDA Act.

Ministry of Finance, Planning and Economic Development
58 Accountability Sector: Semi-Annual Budget Monitoring Report - FY 2019/20
ChAPTER 4: CONCLUSIONS AND RECOMMENDATIONS
4.1: Conclusion
Overall, the MSC performance was good at 75%. The MSC disbursed loans worth Ug shs
51.18bn, against a target of Ug shs 35bn (146% performance), compared to Ug shs 18.03bn
disbursed by the company at half year FY 2018/19. The company registered a 14.5% increase
in outstanding portfolio to Ug shs 134.7bn from Ug shs 117.3bn. Moroto Zonal Office registered
the least performance in disbursement of Ug shs 421million (less than 1% percent of total
disbursements), and the highest performance of Ug shs 16.810bn (32% of the disbursement)
was under Nakasero Kampala office. The MSC continues to register delays in processing loans
to clients and partial funding for applications received.
The overall performance of the PBS was good at 85%. The PBS was tested for all components and
used for budgeting, reporting and procurement planning in the Central Government (CG) and
reporting by LGs. Subsequent period reporting is not possible as the PBS remains unavailable
for updating after submission of preceding period report. Processing of supplementary
budgets by the LGs is difficult with no flexibility accommodated on the PBS moreover these
regularly occur. Failure to communicate final indicative planning figures (IPFs) promptly to the
LGs delays the timely completion of the budgets. In some instances, the outcome indicators
are not aligned to the outcomes. There were delays in approval of and granting of cash limits
for supplementary budgets.
The performance of the Public Procurement and Disposal of Public Assets (PPDA) for the FY
2019/20 was good at 70.31%. Through the regional offices in Gulu, Mbale and Mbarara, regional
procuring and disposal entities were regularly supported to develop procurement plans and
their quarterly performance reported. There was good performance in audits of procuring
entities conducted by the PPDA, and timely feedback to the entities. Low awareness of the
hybrid procurement method led to delays in implementation of projects. The PPDA regulations
remain unclear to some PDEs on account of poor dissemination of developments reached.
The Uganda Revenue Authority (URA) performance was rated good at 85%, but slightly lower
than it performed during the same period in FY 2018/19. The GDP to tax ratio realized was 9%
(which was 50% of half year target and was good). This was an increase from 7.8% attained in
the FY2018/19, and higher than the NDP II target at 14.60%. The closure of the Katuna border
post affected tax collections. The business communities in Arua and Kampala complained of
failure to attend to their concerns raised in engagements with URA. There was an increase in
domestic revenue collected and increase in informal sector registration on account of the Tax
Registration Expansion Project (TREP).

Ministry of Finance, Planning and Economic Development
59Accountability Sector: Semi-Annual Budget Monitoring Report - FY 2019/20
4.2: Recommendations
1) The MSC should improve the duration for loan processing, and terms for follow-on clients.
2) The Ministry of Trade, Industry and Cooperatives (MoTIC), and Local Economic Development
departments at District Local Governments (DLGs) should support SACCOs to mobilize
savings and improve their rating to facilitate access to credit from the MSC.
3) The MFPED with the National Planning Authority (NPA), Uganda Bureau of Statistics (UBOS)
and Office of Prime Minister should improve the outcome indicators and also link the output
indicators to the outcomes.
4) The PPDA should conduct capacity building activities to empower entities, civil society,
and citizens ability to monitor budget execution.
5) The PPDA Act should be reviewed with the aim of reducing time for the procurement
planning process i.e. bidding time, evaluation, review and award.
6) The MFPED should provide a budget allocation to support the recurrent activities incidental
to PFM reforms, like internet for PBS and IFMS regional centres, that also need stationery,
and generator running costs.
7) The MFPED should consider issuing timelines for approval of supplementary budgets and
the related cash limits especially those arising from the LGs.
8) The URA should step up collaboration activities with other government agencies and
business communities through increased awareness and sensitization engagements.

Ministry of Finance, Planning and Economic Development
60 Accountability Sector: Semi-Annual Budget Monitoring Report - FY 2019/20
REFERENCES
MFPED, Budget operations Table FY 2019-20
MFPED, 2019/20: Approved Estimates of Revenue and Expenditure (Recurrent and
Development): Central and Local Government Votes
MFPED, 2018/19: Approved Estimates of Revenue and Expenditure (Recurrent and
Development) Volume II: Local Government Votes.
MFPED, Accountability Sector Annual Report FY 2018/19
Ministry of Finance Planning and Economic Development IFMS data January 2020
National Planning Authority, Second National Development Plan (NDP II) 2015/16-2019/20
PPDA, Quarter II FY 2019/20 PBS report
The Microfinance Support Centre Midterm Review Report on the Performance of the MSC
Strategic Plan (2014-19).
URA Annual Data Book, FY 2018/19
The MSC Strategic Plan (2014-19).
MSC progressive report (July-December 2019)
Field findings

Ministry of Finance, Planning and Economic Development
61Accountability Sector: Semi-Annual Budget Monitoring Report - FY 2019/20
ANNEx
Annex 1: Accountability Sector Programmes Monitored During Semi-annual FY 2019/20
S/No vote/Project Sampled Regions
vote 008 Ministry of Finance Planning and Economic Development
1 Budget preparation, execution and reporting PBS and IFMS
LGs: Kole, Lira, Gulu, Hoima, Kyankwazi, Kayunga, Nakaseke, Kikuube, Kagadi, Kibaale, Mayuge, Tororo, Bukedea, Sironko, Soroti, Kumi, Mbale, Lwengo, Wakiso, Ntungamo, Kabale, Rwampara
2 Financial Sector Development; The Micro Finance Support Centre (MSC)
Zonal offices of Arua, Jinja, Hoima, Lira, Kampala, Kabale, Lira, Ngoma satellite office in Nakaseke, Masaka, Mbale, Mbarara and soroti. Three institutions and two group beneficiary were sampled and District Commercial Officers of Amuru, Bukedea, Gulu, Kagadi, Kikuube, Kabale, Kayunga, Kibaale, Kumi, Kyamkwanzi, Lira, Mayuge, Mbale, Nakaseke, Ntungamo, Rwampara, Tororo and Wakiso.
vote 141 Uganda Revenue Authority
3 Administration and Support Services
Revenue Collection and administration
URA Headquarters, URA Regional Offices of; Gulu, Lira, Mbale, Mbarara, Mutukula border post, Mirama border post and supported LGs of; Kole, Lira, Gulu, Hoima, Kyankwazi, Kayunga, Nakaseke, Kikuube, Kagadi, Kibaale, Mayuge, Tororo, Bukedea, Sironko, Soroti, Kumi, Mbale, Lwengo, Wakiso, Ntungamo, Kabale, Rwampara
vote 153 Public Procurement and Disposal of Assets
4 Regulation of the Procurement and Disposal Systems
PPDA regional offices in Gulu, Mbarara, and Mbale. Supported entiies in LGs; Kole, Lira, Gulu, Hoima, Kyankwazi, Kayunga, Nakaseke, Kikuube, Kagadi, Kibaale, Mayuge, Tororo, Bukedea, Sironko, Soroti, Kumi, Mbale, Lwengo, Wakiso, Ntungamo, Kabale, Rwampara

Ministry of Finance, Planning and Economic Development
62 Accountability Sector: Semi-Annual Budget Monitoring Report - FY 2019/20


64 Accountability Sector: Semi-Annual Budget Monitoring Report - FY 2019/20
#DoingMoreMOFPED
Plot 2 -12 Apollo Kaggwa RoadP. O. Box 8147, Kampala-Uganda
www.finance.go.ug