accountabilityandtesting.brevardschools.orgaccountabilityandtesting.brevardschools.org/School... ·...
32
Brevard Public Schools School Improvement Plan 2015 – 2016 Name of School: Area: Principal: Area Superintendent: SAC Chairperson: Superintendent: Dr. Desmond Blackburn Mission Statement: Empower today’s students to successfully impact tomorrow. Vision Statement: Responsible citizens inspired by passion and purpose—skilled at helping the world achieve its potential. Stakeholder Involvement in School Improvement Planning: Briefly explain how stakeholders are involved in the development, review, and communication of the SIP. The mission, vision, and school improvement plan is communicated to all stakeholders through Edline communication, website, newsletter announcements, parent meetings, 1 | Page Suntree Elementary Central Area Mecheall Giombetti Jane Cline Jennifer Raley
Transcript of accountabilityandtesting.brevardschools.orgaccountabilityandtesting.brevardschools.org/School... ·...

Brevard Public SchoolsSchool Improvement Plan
2015 – 2016
Name of School: Area:
Principal: Area Superintendent:
SAC Chairperson:
Superintendent: Dr. Desmond Blackburn
Mission Statement:
Empower today’s students to successfully impact tomorrow.
Vision Statement:
Responsible citizens inspired by passion and purpose—skilled at helping the world achieve its potential.
Stakeholder Involvement in School Improvement Planning: Briefly explain how stakeholders are involved in the development, review, and communication of the SIP.
The mission, vision, and school improvement plan is communicated to all stakeholders through Edline communication, website, newsletter announcements, parent meetings, faculty/staff meetings, and School Advisory Council meetings. Our school vision and mission are posted in the front office for visitors. They are communicated to students through direct lessons from the instructional staff and lived daily by everyone on campus.
1 | Page
Suntree Elementary School Central Area
Mecheall Giombetti Jane Cline
Jennifer Raley

Brevard Public SchoolsSchool Improvement Plan
2015-2016Part 1: Planning for Student Achievement
RATIONALE – Continuous Improvement Cycle Process
Data analysis from multiple data sources:
What are the areas of successful professional practices and what data shows evidence of improvements? What are the concerns with professional practices and how are they revealed with data?
Survey Results from 2014-2015 indicated a need for professional development in the area of writing strategies to meet the rigor and depth of the standards, specifically with regard to writing in response to reading across the content areas. Professional development in this area needs to continue and implementation needs to be integrated and aligned with our new backward design unit planning process, in order for lesson plans to reflect the learning from the previous year.
Based on the Insight Survey, a strong instructional culture is present at Suntree Elementary. The highest ranked domains were Learning Environment, Professional Development, Peer Culture, Common Core, and Leadership. Our weakest areas were Career Progression, Observation and Feedback, and Evaluation. More specifically, in the category for Observation and Feedback only 38% of teachers feel that they have regular opportunities to discuss instructional plans and get feedback from their evaluator. In the same category, 54% of teachers agree that they get specific feedback after an observation to help improve teaching practices, and receive consistent follow-up from the evaluator.
Qualitative data from observation, discussion, and teacher surveys indicates a need for continued professional development, planned and purposeful implementation, and feedback on the planning process as it relates to writing instruction.
After our initial professional development day introducing the Backward Design Planning Process, Suntree teachers who responded to a Likert Survey describing their level of knowledge and comfort for the backward design planning process convey that: 43% of teachers feel comfortable using a backward design planning process, and 57% feel a range of levels of discomfort with the backward design planning.
A Post Survey from our 2014-2015 School Improvement Plan revealed the following results (percent in parentheses indicates the increase or decrease from the Pre Survey results).
2 | Page

5- I feel very confident using this strategy and am comfortable sharing best practices and modeling for my peers.
4- I understand and fully implement this strategy in my classroom.
3- I understand this strategy, but I am not fully confident that I can use it.
2- I can explain this strategy, but I am not fully confident that I can use it.
1- I do not understand this strategy. I do not currently use it.
Writing in response to reading across all content areas
24% (+1) 56% (-1) 20% 0% 0%
Using Rubrics 20% 44% (+10) 36% (-10) 0% 0%
Writing Rubrics
12% 40% (+11) 44% (-11) 4% 0%
Florida Standards Assessment Data, while not fully received and analyzed shows the following T Score Results:
Suntree ELA Suntree Mathematics Brevard/State--R/M Difference--R Difference--M
Third Grade 56 52 52/50 50/50 +4 +2Fourth Grade 57 57 52/50 50/50 +5 +7Fifth Grade 58 58 51/50 50/50 +7 +8Sixth Grade 57 59 53/50 54/49 +4 +5
FSA Data shows that Suntree students perform above the district average ranging from +2 to +8 points, and from +2 to +10 points above the state average. Scores reflect an area of concern in both Reading and Mathematics in third grade, particularly in the area of Mathematics. Scores reflect areas of strength in fourth and fifth grades, particularly in fifth grade.
Last year a new scoring rubric for writing was implemented for the 4th-6th grade FSA test with a focus on writing in response to text. The BELAA, Brevard’s English Language Arts Assessment, is the district model for standards-based assessment. On both the BELAA A and BELAA B, Suntree students scored at or above average on the Literacy and Informational Text Responses and the Foundational Skill Responses. However, on the Written Response sections, all grade level averages were below 50%. The data below indicates a need for continuing our focus on writing in response to complex text.
3 | Page

Written Responses Grade Level Average % Correct
Grade Level BELAA A Fall 2014 BELAA B Spring 2015
1st Grade 36% 39%
2nd Grade 23% 17%
3rd Grade 25% 37%
4th Grade 31% 32%
5th Grade 44% 43%
6th Grade 39% 41%
What are the areas of successful student achievements and what data shows evidence of improvements?
What are the concerns with student achievements and how are they revealed to the data?
● Students in grades 3-6 exceeded the state mean ability score for Reading Comprehension on the FAIR-FS - Assessment Period 1
○ 3rd AP 1 - 386 (Target 379)○ 4th AP 1 - 446 (Target 432)○ 5th AP 1 - 489 (Target 470)○ 6th AP 1 - 594 (Target 510)
● In August 2015, 46.8% of Suntree Elementary Kindergarten students knew 2 or more sight words, as measured by the KLS. ● In May 2015, 78% of Suntree 1st graders scored 70% or higher in Reading Proficiency, as measured by the End of Year
Course Exam (BELAA).● In May 2015, 70% of Suntree 2nd graders scored 70% or higher in Reading Proficiency, as measured by the End of Year
Course Exam (BELAA).● In February 2015, 54.3% of Suntree students in grades 1-6 scored 70% or higher in Writing Proficiency on the BELAA B.● In April 2015, 85% of Suntree 5th graders scored proficient in Science as measured by FCAT 2.0 Science.
Current and trend data document writing scores as an area of concern as indicated on BELAA.
What other areas of strength or opportunity are revealed in data from leading indicators?
Considering the overall learning curve involved in implementing a Florida Standards Based Education, the district’s backward design planning process initiative, and the ongoing implementation of the IPPAS, discussions with teachers and peers indicate the need to align, connect, and support teachers in our various efforts dedicated to improving instruction and increasing achievement.
Analysis of Current Practices:
4 | Page

Describe action steps that have become non-negotiable, things that you will continue doing.
● Teachers will continue to utilize and integrate Kagan engagement strategies in daily instruction, with the focus being an increased use of student to student engagement and real world connections.
● Teachers will utilize knowledge from Steps to Quality Questioning to continue to integrate and increase the use of higher order questions and questioning strategies within instruction.
● Teachers will continue to utilize the developed list of “Classroom Look-Fors”, which were developed by teacher teams after grade level walkthroughs and that have been implemented school-wide. Examples of “look-fors” include: interactive focus walls, using graphic organizers, and responding in writing in all subject areas.
● Leadership Teams are in place and include: Florida Standards, Best Practices, Teaching and Learning Environment and 21st Century Skills. These teams continue to consist of representation from each grade level, and serve as a Professional Learning Community to support the implementation of the School Improvement Plan. They function as a vertical articulation team within that focus area. These teams oversee any school wide activities and make decisions related to school improvement initiatives.
● Teachers continue to learn and implement the instructional approaches necessitated by the shift to Florida Standards (LAFS/MAFS). Grade levels continue to need formalized collaborative planning time to plan for and develop differentiated lessons based on data to include higher order thinking strategies and best practices.
● Teachers will continue to be provided with training and work time focused on the Florida Standards. ● Policies and procedures are becoming more unified in plan and implementation from grade to grade and classroom to
classroom. A common language connected to the Kovalik LIFESKILLS has taken root, but still needs to become integral to the school culture and daily language in all classrooms, school events, and homes.
● Teachers will continue to be encouraged to engage in self-reflective practices and peer coaching and mentoring opportunities.
● Teachers will continue to utilize strategies for extended thinking activities, summarizing, and vocabulary in context. These instructional strategies and tools continue to be used in daily instruction in the classroom.
● Suntree Elementary students with disabilities participate in both a pull-out and inclusion model. Suntree is working toward a full scale inclusion model. English Language Learners participate in an inclusion model.
● Suntree offers an after-school Academic Support Program (ASP) to eligible students in grades 3-6 for Math and Reading. In addition, Science Academic Support is available to eligible students in grade 5.
● Gifted students at Suntree participate in a one day a week enrichment program called Horizons.
Best Practice:
Based on research, as it relates to the data analysis above, what should be best practices in the class room?
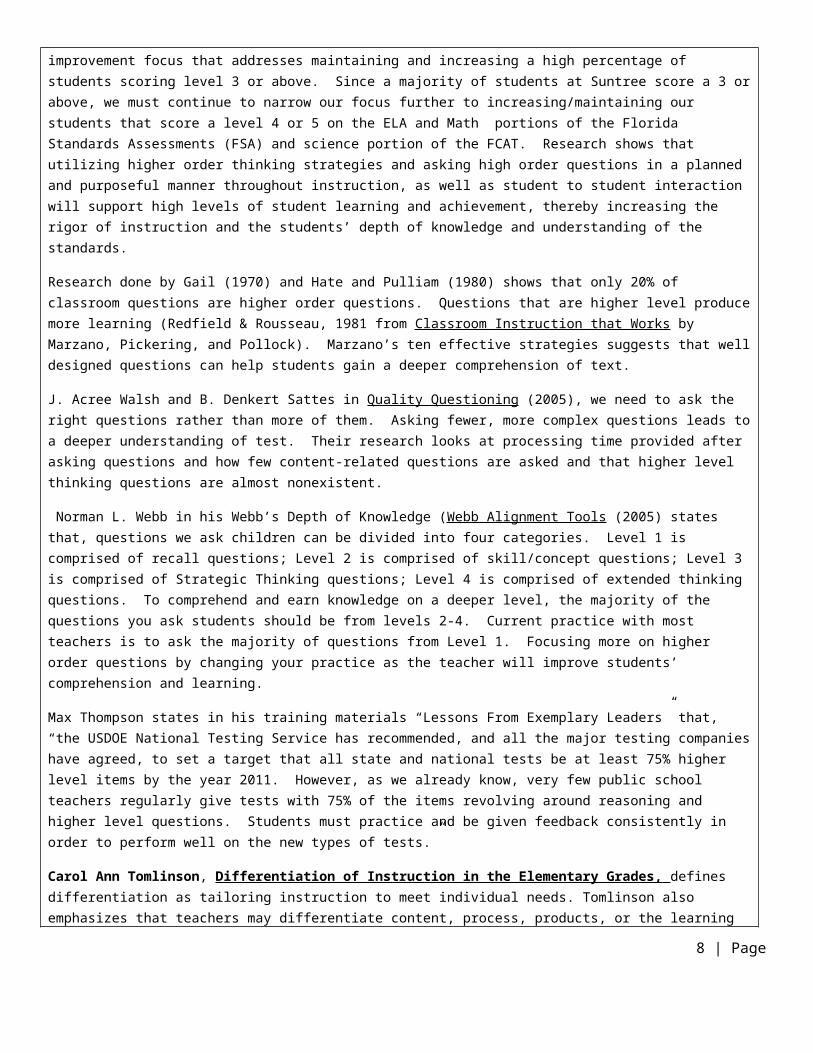
Based on an analysis of all data, it is evident that we need to pursue a school improvement focus that addresses maintaining and increasing a high percentage of students scoring level 3 or above. Since a majority of students at Suntree score a 3 or above, we must continue to narrow our focus further to increasing/maintaining our students that score a level 4 or 5 on the ELA and Math portions of the Florida Standards Assessments (FSA) and science portion of the FCAT. Research shows that utilizing higher order thinking strategies and asking high order questions in a planned and purposeful manner throughout instruction, as well as student to student interaction will support high levels of student learning and achievement, thereby increasing the rigor of instruction and the students’ depth of knowledge and understanding of the standards.
Research done by Gail (1970) and Hate and Pulliam (1980) shows that only 20% of classroom questions are higher order questions. Questions that are higher level produce more learning (Redfield & Rousseau, 1981 from Classroom Instruction that Works by Marzano, Pickering, and Pollock). Marzano’s ten effective strategies suggests that well designed questions can help students gain a deeper comprehension of text.
J. Acree Walsh and B. Denkert Sattes in Quality Questioning (2005), we need to ask the right questions rather than more of them. Asking fewer, more complex questions leads to a deeper understanding of test. Their research looks at processing time provided after asking questions and how few content-related questions are asked and that higher level thinking questions are almost
5 | Page

nonexistent.
Norman L. Webb in his Webb’s Depth of Knowledge (Webb Alignment Tools (2005) states that, questions we ask children can be divided into four categories. Level 1 is comprised of recall questions; Level 2 is comprised of skill/concept questions; Level 3 is comprised of Strategic Thinking questions; Level 4 is comprised of extended thinking questions. To comprehend and earn knowledge on a deeper level, the majority of the questions you ask students should be from levels 2-4. Current practice with most teachers is to ask the majority of questions from Level 1. Focusing more on higher order questions by changing your practice as the teacher will improve students’ comprehension and learning.
Max Thompson states in his training materials “Lessons From Exemplary Leaders” that, “the USDOE National Testing Service has recommended, and all the major testing companies have agreed, to set a target that all state and national tests be at least 75% higher level items by the year 2011. However, as we already know, very few public school teachers regularly give tests with 75% of the items revolving around reasoning and higher level questions. Students must practice and be given feedback consistently in order to perform well on the new types of tests.”
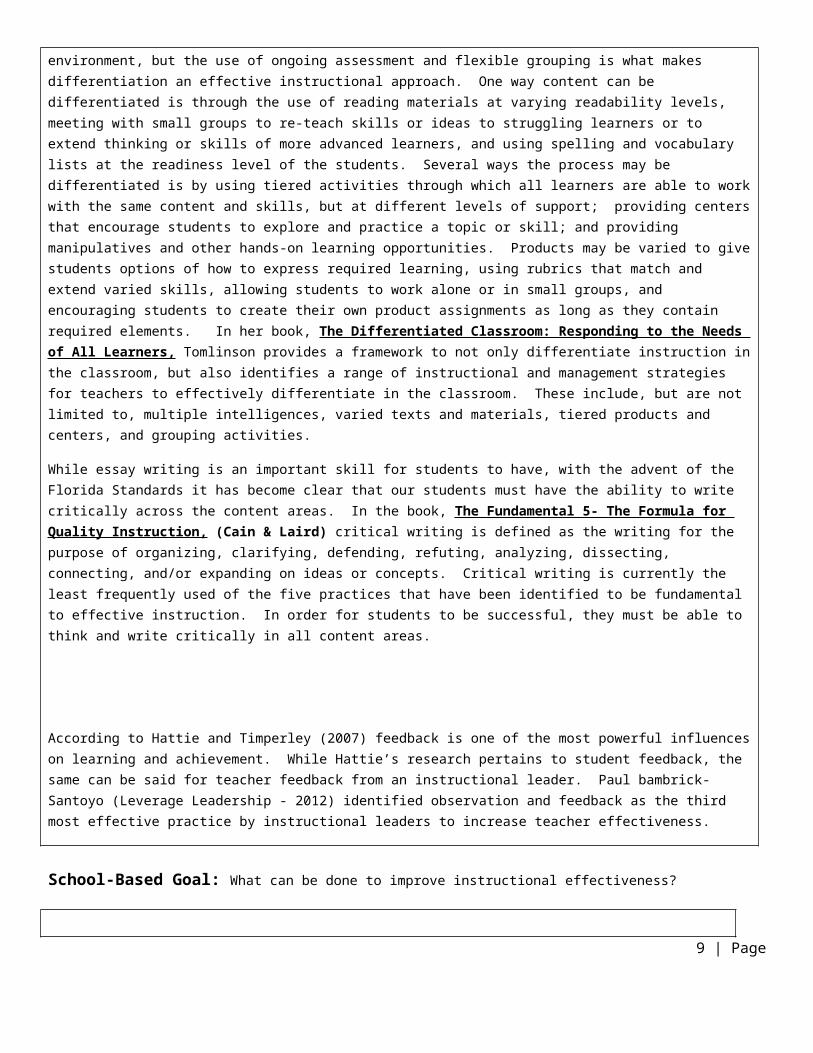
Carol Ann Tomlinson, Differentiation of Instruction in the Elementary Grades, defines differentiation as tailoring instruction to meet individual needs. Tomlinson also emphasizes that teachers may differentiate content, process, products, or the learning environment, but the use of ongoing assessment and flexible grouping is what makes differentiation an effective instructional approach. One way content can be differentiated is through the use of reading materials at varying readability levels, meeting with small groups to re-teach skills or ideas to struggling learners or to extend thinking or skills of more advanced learners, and using spelling and vocabulary lists at the readiness level of the students. Several ways the process may be differentiated is by using tiered activities through which all learners are able to work with the same content and skills, but at different levels of support; providing centers that encourage students to explore and practice a topic or skill; and providing manipulatives and other hands-on learning opportunities. Products may be varied to give students options of how to express required learning, using rubrics that match and extend varied skills, allowing students to work alone or in small groups, and encouraging students to create their own product assignments as long as they contain required elements. In her book, The Differentiated Classroom: Responding to the Needs of All Learners, Tomlinson provides a framework to not only differentiate instruction in the classroom, but also identifies a range of instructional and management strategies for teachers to effectively differentiate in the classroom. These include, but are not limited to, multiple intelligences, varied texts and materials, tiered products and centers, and grouping activities.
While essay writing is an important skill for students to have, with the advent of the Florida Standards it has become clear that our students must have the ability to write critically across the content areas. In the book, The Fundamental 5- The Formula for Quality Instruction, (Cain & Laird) critical writing is defined as the writing for the purpose of organizing, clarifying, defending, refuting, analyzing, dissecting, connecting, and/or expanding on ideas or concepts. Critical writing is currently the least frequently used of the five practices that have been identified to be fundamental to effective instruction. In order for students to be successful, they must be able to think and write critically in all content areas.
According to Hattie and Timperley (2007) feedback is one of the most powerful influences on learning and achievement. While Hattie’s research pertains to student feedback, the same can be said for teacher feedback from an instructional leader. Paul bambrick-Santoyo (Leverage Leadership - 2012) identified observation and feedback as the third most effective practice by instructional leaders to increase teacher effectiveness.
School-Based Goal: What can be done to improve instructional effectiveness?
6 | Page

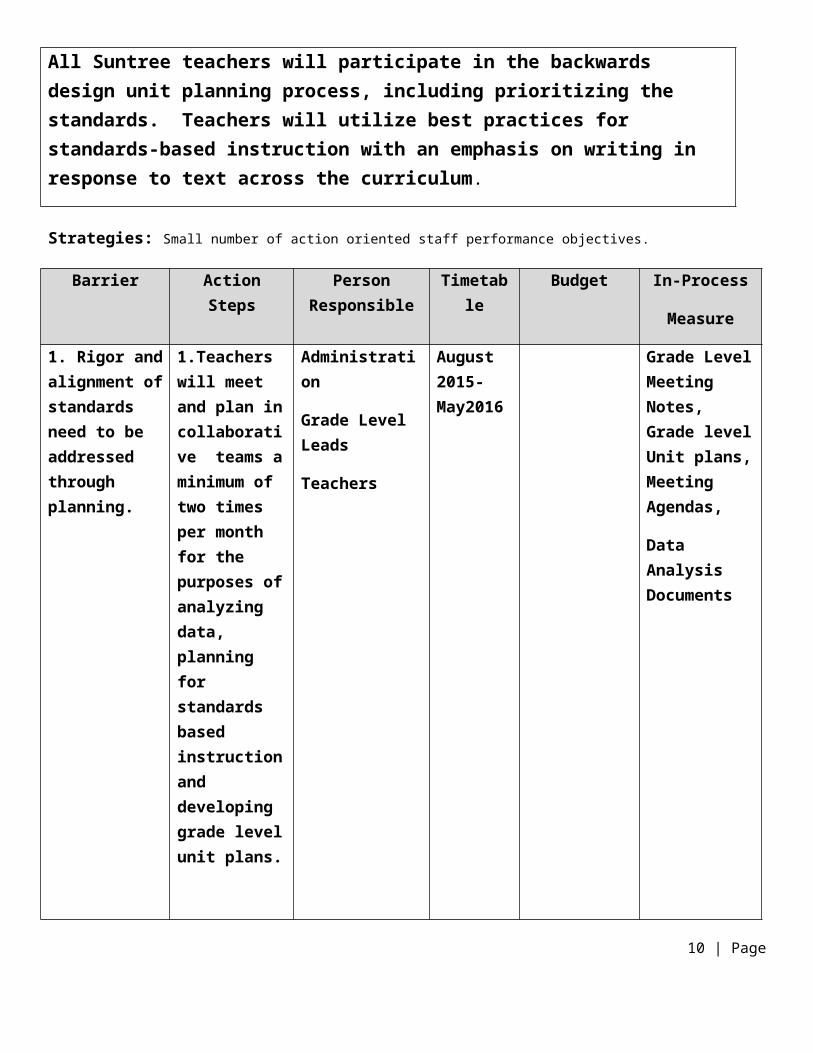
All Suntree teachers will participate in the backwards design unit planning process, including prioritizing the standards. Teachers will utilize best practices for standards-based instruction with an emphasis on writing in response to text across the curriculum.
Strategies: Small number of action oriented staff performance objectives.
Barrier Action Steps Person Responsible
Timetable Budget In-Process
Measure
1. Rigor and alignment of standards need to be addressed through planning.
1.Teachers will meet and plan in collaborative teams a minimum of two times per month for the purposes of analyzing data, planning for standards based instruction and developing grade level unit plans.
2. Teachers will utilize Early Release Training Days in support of prioritizing the standards and developing collaborative unit plans using the Backward Design Process of choice--UbD
Administration
Grade Level Leads
Teachers
Administration
Reading Coach
August 2015-May2016
August 2015-May 2016
Grade Level Meeting Notes, Grade level Unit plans, Meeting Agendas,
Data Analysis Documents
PLC Schedule,
Meeting Agendas,
Unit Plans,
7 | Page
or LDC.
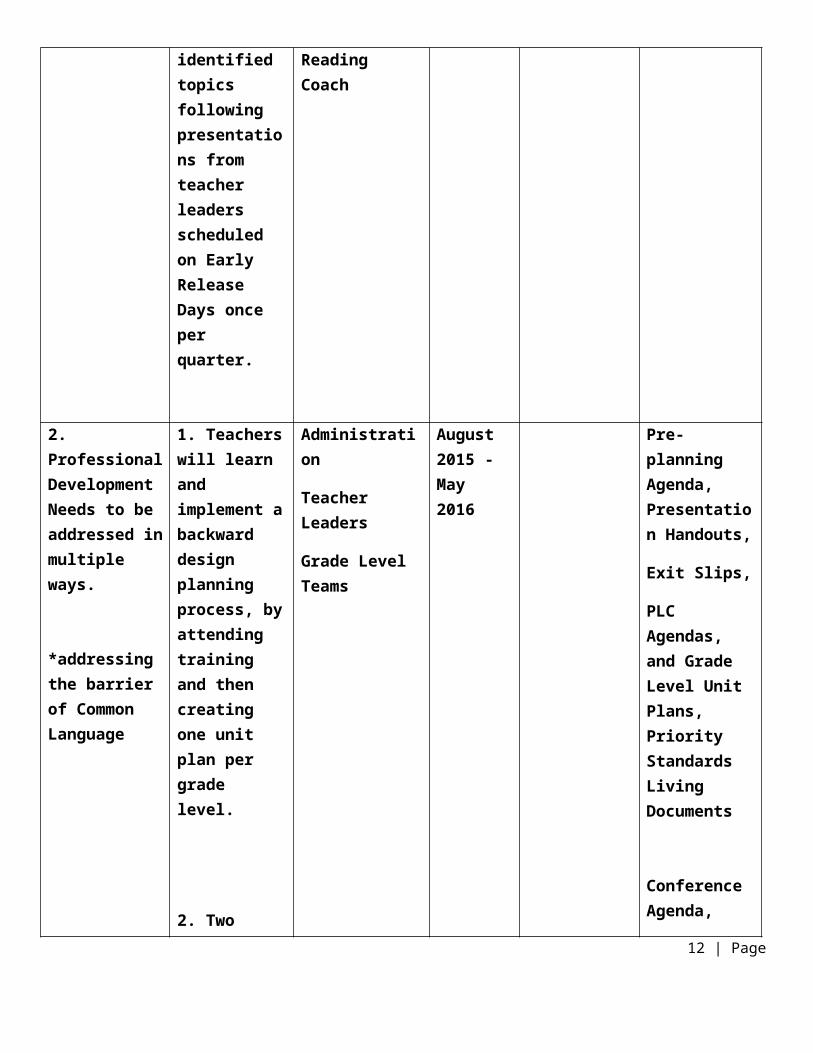
3. Teachers will learn, implement, and integrate into lesson plans best practice strategies on identified topics following presentations from teacher leaders scheduled on Early Release Days once per quarter.
Teachers
Administration
Teacher Leaders
Reading Coach
Once each 9 weeks August 2015-May 2016
Teacher Created Living Documents of Priority Standards
Survey Results,
ERD schedule,
Classroom
Walkthrough
Data
2. Professional Development Needs to be addressed in multiple ways.
*addressing the barrier of Common Language
1. Teachers will learn and implement a backward design planning process, by attending training and then creating one unit plan per grade level.
Administration
Teacher Leaders
Grade Level Teams
August 2015 - May 2016
Pre-planning Agenda, Presentation Handouts,
Exit Slips,
PLC Agendas, and Grade Level Unit Plans, Priority Standards Living Documents
8 | Page
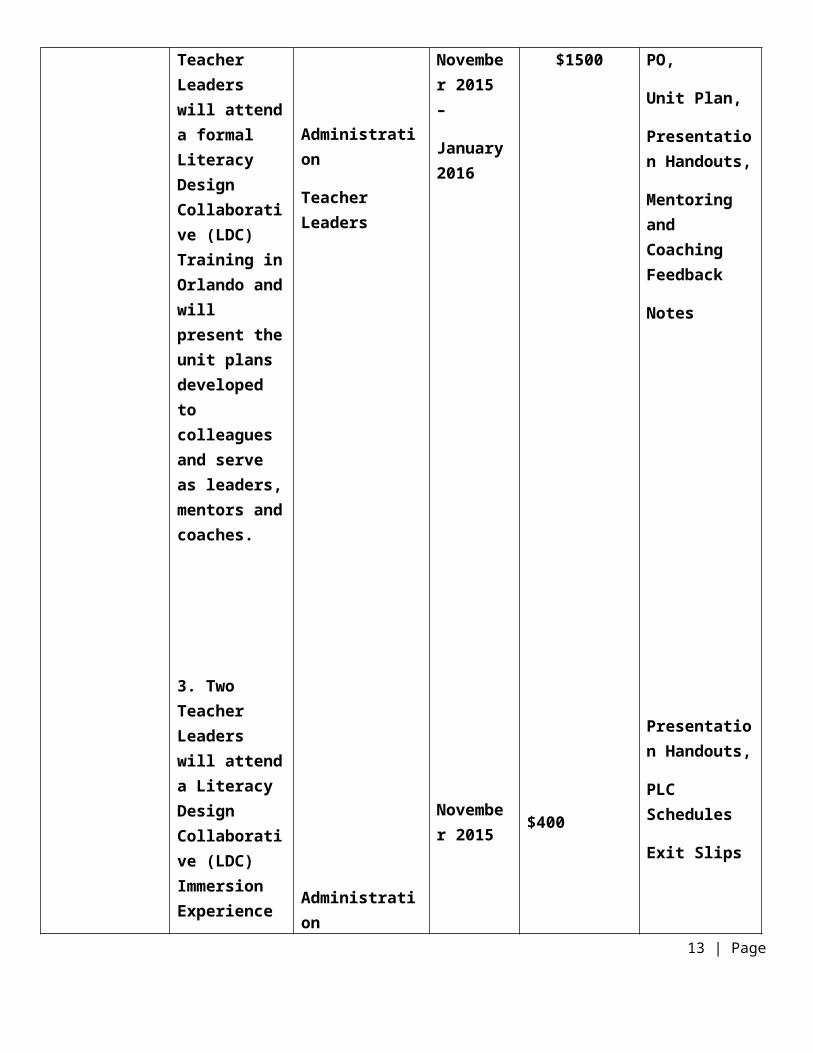
2. Two Teacher Leaders will attend a formal Literacy Design Collaborative (LDC) Training in Orlando and will present the unit plans developed to colleagues and serve as leaders, mentors and coaches.
3. Two Teacher Leaders will attend a Literacy Design Collaborative (LDC) Immersion Experience at Stevenson Elementary and share information with colleagues.
4. Teachers will attend Marzano Prioritizing Standards and Learning Scales
Administration
Teacher Leaders
Administration
Teacher Leaders
November 2015 –
January 2016
November 2015
$1500
$400
Conference Agenda,
PO,
Unit Plan,
Presentation Handouts,
Mentoring and Coaching Feedback
Notes
Presentation Handouts,
PLC Schedules
Exit Slips
9 | Page
Training
at Bayside High School. They will use this new knowledge to complete a process to prioritize ELA Standards within each grade level.
5. Teachers will attend training on the Three Shifts in relation to the rigor of the ELA Florida Standards as an opening session to our Mini-ECET2
Building Level Inservice Day.
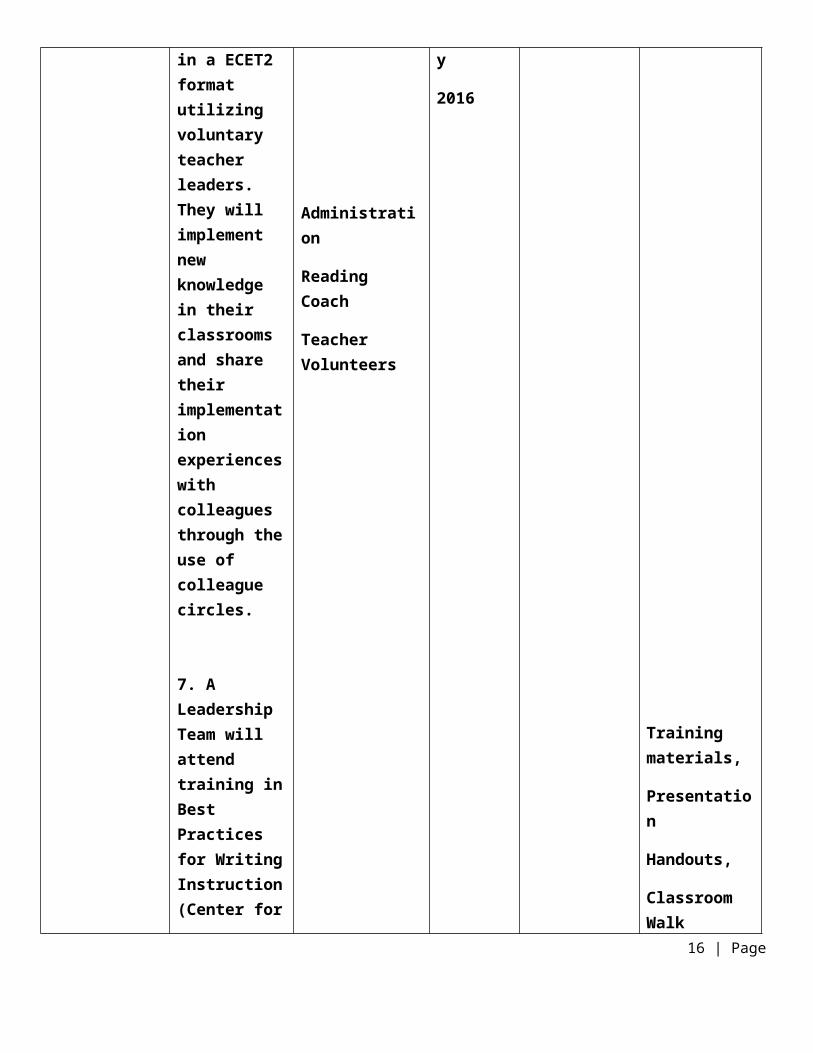
6. Teachers will participate in training on best practices and planning processes in a ECET2 format utilizing voluntary teacher leaders. They will
Administration
Teachers
October
2015-
February
2015$1000
Training Records,
Training Handouts,
Completed Prioritized Standards Document for each grade level,
Exit Slips
Training Agenda,
Handouts,
10 | Page

implement new knowledge in their classrooms and share their implementation experiences with colleagues through the use of colleague circles.
7. A Leadership Team will attend training in Best Practices for Writing Instruction (Center for the Collaborative Classroom), will present information to the entire faculty, and will provide coaching and mentoring feedback as requested.
8. Teachers will receive and reflect on
Administration
Reading Coach
Administration
Reading Coach
Teacher Volunteers
February
2016
February
2016
Exit Slips
Training Agenda,
Handouts,
Exit Slips
11 | Page
regular and purposeful feedback on practices in writing instruction and lesson plan development pertaining to writing in response to text across the content areas.
Administrator
Reading Coach
Teacher Leaders
Faculty
October
2015-
December 2015
$500
Training materials,
Presentation
Handouts,
Classroom Walk Through Data/Notes,
Coaching and Mentoring Feedback Notes
12 | Page
Administrators
Reading Coach
Teachers
January-
May 2015-2016
Classroom Walk Through Data/Notes
Conference Schedules
Feedback Notes in ProGOE
EDI Survey
EVALUATION – Outcome Measures and Reflection- begin with the end in mind .
Qualitative and Quantitative Professional Practice Outcomes: Measures the level of implementation of professional practices throughout your school.
13 | Page

Where do you want your teachers to be? What tools will you use to measure the implementation of your strategies? What tool will be used to measure progress throughout the year? Use real percentages and numbers.
In May 2015, only 28% of Suntree Teachers felt that their professional development needs were adequate to meet the goals of our SIP. By May 2016, 85% of Suntree teachers will state that their professional development needs are being met in order to meet the goals of our SIP. This reflects an increase of 57%.
The EDI/Insight Teacher survey will show a 12% increase in regards to professional feedback. Our 2016 survey will reflect an increase from 38% to 50%.
A survey conducted following our initial backward design training showed that 43% of teachers are comfortable using a backward design planning process, while 57% are not comfortable using a backward design planning process. By May 2016 a follow up survey will reflect an increase from 43% to 90% of teachers feeling comfortable with utilizing a backward design planning process.
By May 2016, 100% of Suntree Teachers will have participated in a process for prioritizing the standards and will be planning using priority standards. This will reflect an increase of 100% as no teachers utilize a process for prioritizing standards at this time.
Classroom Walkthrough Observations and post observation conferences will reflect the use of strategies for writing in response to reading across content areas.
Qualitative and Quantitative Student Achievement Expectations: Measures student achievement.
Where do you want your students to be? What will student achievement look like at the end of the school year 2015-16?
What tools will be used to measure progress throughout the year?
A 2015 survey of students revealed that 77% indicated that they were learning the 21st Century Learning Skill of Effective Communication, an increase of 5.4% from 2014. The 2015 survey also showed that 79% of students stated that they were learning the 21st Century Skills of Meaningful Projects often, a decrease of 1% from 2014. We expect that, with a focus of planning for standards-based instruction, with an emphasis on writing in response to reading across all content areas, a follow-up survey in the Spring of 2016 will demonstrate an increase from 77% to 82% percent for Effective Communication, and an increase from 79% percent to 84% for Meaningful Projects.
14 | Page

FSA scores and FAIR-FS information will be used to measure academic growth in grades 3-6.
2015 FSA Score Growth Measures have not yet been released. With further information we will be able to determine and set goals for appropriate growth.
The Kindergarten Literacy Survey (KLS) and Brevard English and Language Arts Assessment (BELAA) will be used to measure academic growth in Kindergarten and grades 1-2.
During the 2015-2016 school year, the FAIR-FS Mean Ability score for Reading Comprehension in grades 3-6 will increase by at least 20 points from AP 1 to AP 3.
FCAT 2.0 5th Grade Science Scores will reflect an increase from 85% of Suntree students meeting state standards on the 2015 FCAT 2.0 Science Assessment to 87% of Suntree students meeting state standards on the 2016 FCAT 2.0.
In May 2016, 90% of Suntree Elementary Kindergarten students will know at least 55 sight words, as measured by the KLS.
In May 2016, 85% of Suntree 1st and 2nd graders will score 70% or higher in Reading Proficiency, as measured by End of Year Course Exam (BELAA).
In May 2016, 65% of Suntree students in grades 1-6 will score 70% or higher in Writing Proficiency as measured by the Spring BELAA.
15 | Page
Part 2: Support Systems for Student Achievement
(Federal, State, and District Mandates)For the following areas, please write a brief narrative that includes the data from the year 2014-2015 and a description of changes you intend to incorporate to improve the data for the year 2015-2016.
MULTI-TIERED SYSTEM OF SUPPORTS MTSS/RtI This section meets the requirements of Sections 1114(b)(1)(B)(i)-(iv) and 1115(c)(1)(A)-(C), P.L. 107-110, NCLB, codified at 20 U.S.C. § 6314(b) and Senate Bill 850.
1. Describe the process through which school leadership identifies and aligns all available resources (e.g., personnel, instructional, curricular) in order to meet the needs of all students. Include the methodology for coordinating the use of federal, state and local funds, services, and programs.
Personnel resources are assigned based upon the Personnel Allocation Report provided to the school by the district. Teachers are given assignments based upon the class size needs, requirements, and student projections. Curricular and instructional resources are allocated and assigned based upon classroom and student needs and the available allocated funds.
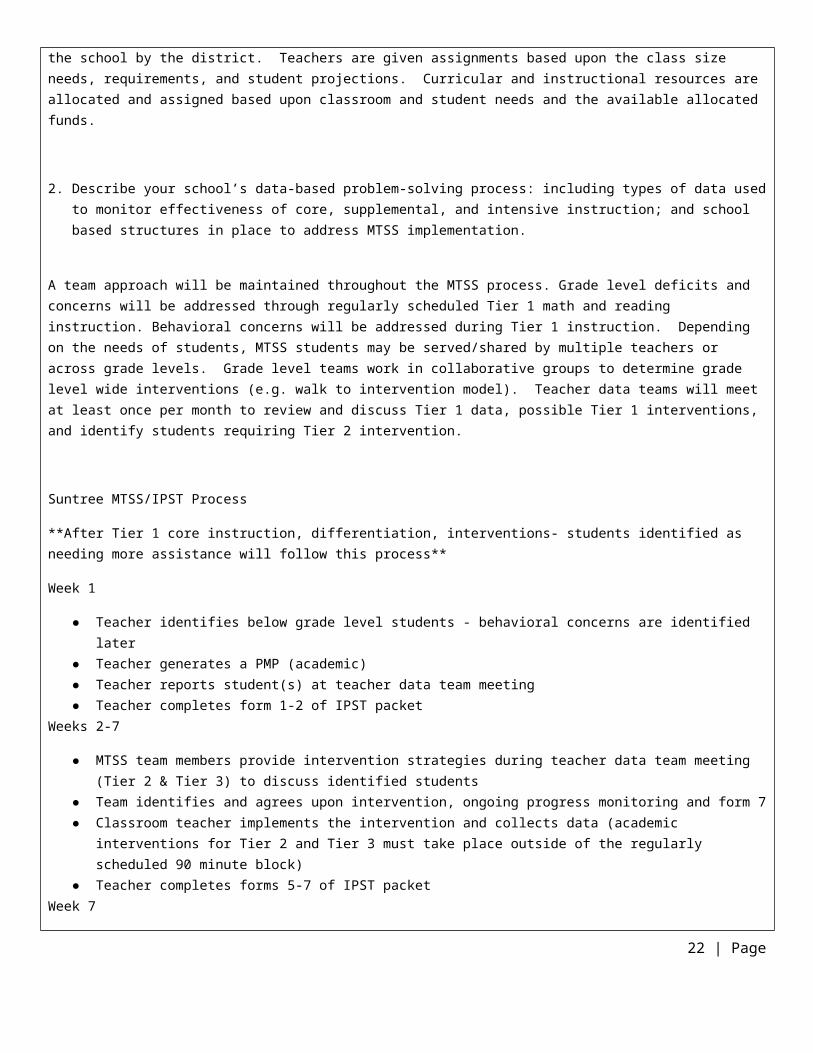
2. Describe your school’s data-based problem-solving process: including types of data used to monitor effectiveness of core, supplemental, and intensive instruction; and school based structures in place to address MTSS implementation.
A team approach will be maintained throughout the MTSS process. Grade level deficits and concerns will be addressed through regularly scheduled Tier 1 math and reading instruction. Behavioral concerns will be addressed during Tier 1 instruction. Depending on the needs of students, MTSS students may be served/shared by multiple teachers or across grade levels. Grade level teams work in collaborative groups to determine grade level wide interventions (e.g. walk to intervention model). Teacher data teams will meet at least once per month to review and discuss Tier 1 data, possible Tier 1 interventions, and identify students requiring Tier 2 intervention.
Suntree MTSS/IPST Process
**After Tier 1 core instruction, differentiation, interventions- students identified as needing more assistance will follow this process**
Week 1
● Teacher identifies below grade level students - behavioral concerns are identified later ● Teacher generates a PMP (academic)● Teacher reports student(s) at teacher data team meeting ● Teacher completes form 1-2 of IPST packet
Weeks 2-7
● MTSS team members provide intervention strategies during teacher data team meeting (Tier 2 & Tier 3) to discuss identified students
16 | Page

● Team identifies and agrees upon intervention, ongoing progress monitoring and form 7● Classroom teacher implements the intervention and collects data (academic interventions for Tier 2 and Tier 3 must take
place outside of the regularly scheduled 90 minute block)● Teacher completes forms 5-7 of IPST packet
Week 7
● MTSS Collaborative Team Meeting (AP, Guidance, Teacher, ESE, ESE Support Specialist, School Psychologist, Parent - Optional)
● Collaborative Team will review intervention data, decide upon a Tier 3 intervention (if necessary) or Tier 2 intervention, OPM, and form 7
● If student is moving to Tier 3○ Complete pgs. 3-4 of IPST packet○ Invite parent for the Collaborative Team meeting
Week 7-14
● Teacher implements the Tier 3 (or Tier 2) intervention● Teacher collects and reports data at Tier 2 / 3 TDT Meeting
Week 7-14
● Guidance will get consent for testing (if needed)● Student tested (if needed)● Guidance to schedule an IPST meeting to take place● Complete forms 5-7 for the NEW intervention● Complete forms 3-4 if not already completed● Send form 8 of IPST packet home if not already completed
Week 14
● Guidance submits IPST packet to ESE Support Specialist● IPST Meeting held to determine eligibility
PARENT AND FAMILY INVOLVEMENT: (Parent Survey Data must be referenced) Title I Schools may use the Parent Involvement Plan to meet the requirements of Sections 1114(b)(1)(F) and 1115(c)(1)(G), P.L. 107-110, NCLB, codified at 20 U.S.C. § 6314(b).
Consider the level of family and community involvement at your school and parent survey data collected. Respond to the following questions. What are best practices that are strengths and how will they be sustained? What are areas of weaknesses and how are they being addressed?
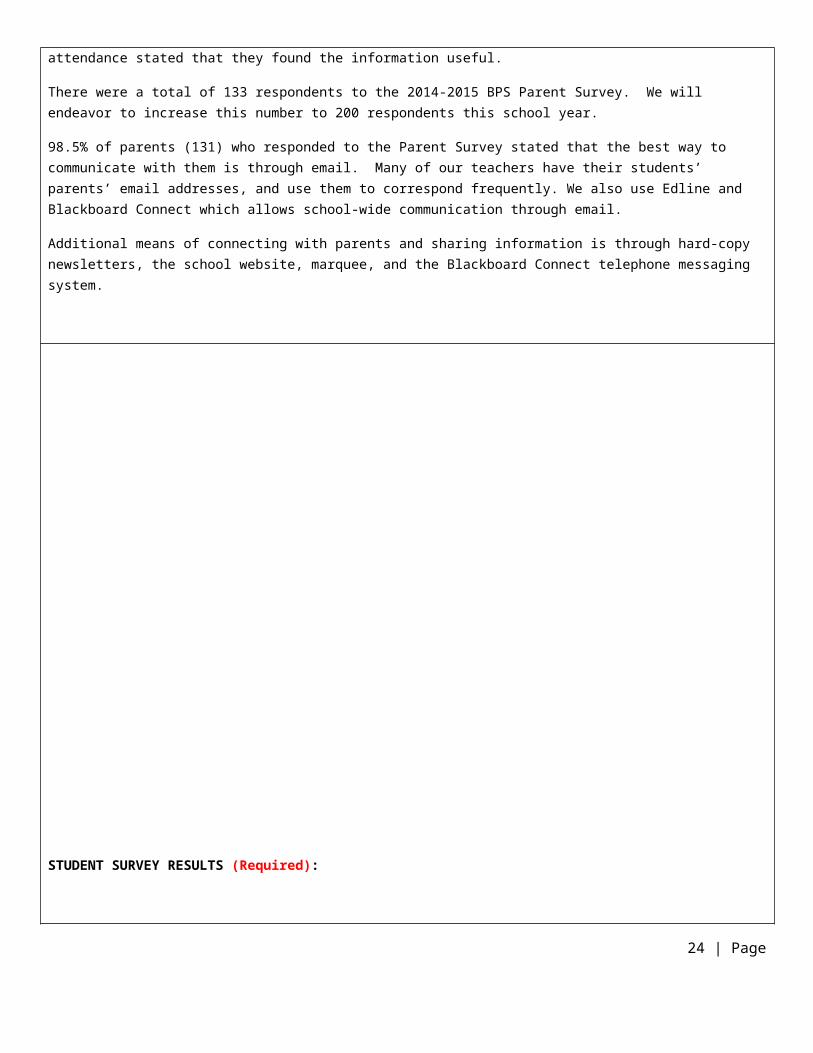
Suntree Elementary offers many opportunities for parents to attend informational and community building events. We begin in August with Meet and Greet. We have other events spread throughout the year such as Open House, STEAM Night, Fall Festival, Sweetheart Dance, and Boys Night Out, which are well attended. 84.25% (107 of 127 respondents) of parents who responded to the Parent Survey said that they attended informational meetings or academic events at Suntree ES, and 90.29% percent (93 respondents) of parents in attendance stated that they found the information useful.
There were a total of 133 respondents to the 2014-2015 BPS Parent Survey. We will endeavor to increase this number to 200
17 | Page

respondents this school year.
98.5% of parents (131) who responded to the Parent Survey stated that the best way to communicate with them is through email. Many of our teachers have their students’ parents’ email addresses, and use them to correspond frequently. We also use Edline and Blackboard Connect which allows school-wide communication through email.
Additional means of connecting with parents and sharing information is through hard-copy newsletters, the school website, marquee, and the Blackboard Connect telephone messaging system.
STUDENT SURVEY RESULTS (Required):
Address Elements of Student Survey Results found in the District Strategic Plan and describe how you will improve student perceptions of these indicators.
Strategic Plan Indicators:
✓ Promotes 21st Century Skills 1.4.2, 1.4.3, 1.4.4, 1.4.5The results of the 2015 BPS Student Survey indicate that:
18 | Page

Students feel they are learning the following 21st Century Learning Skills (in order from greatest to least)
○ Teamwork - 79.32%○ Meaningful projects - 78.47%○ Effective communication - 77.45%○ Personal character - 69.95%○ Practical uses of technology - 61.65%○ Real world issues and organizational skills - 58%○ How to conduct research - 52%
These results indicate that students feel there are greater opportunities for learning in the areas of research, learning practical technology skills, and making connections to real world issues.
We expect that, with a focus on planning for standards-based instruction with an emphasis on writing in response to reading across all content areas this year, a follow-up survey in the Spring of 2016 will demonstrate an increase of 5 percent for Effective Communication and 5 percent for Meaningful Projects..
Strategic Plan Indicators:
✓ Safe Learning Environment 2.2.3, 2.2.4, 2.2.5The results of the 2015 BPS Student Survey indicate that 86.47% of Suntree students feel safe at school. Of the students who responded to not feeling safe at school, they identified the following areas as places they did not feel safe:
● hallways● walking or riding their bike to/from school● riding the bus to/from school● restrooms● after-school activities● cafeteria
In regards to bullying, 35.71% of students responded that they had some form of bullying happen to them.
On the 2015 BPS Student Survey, 94.74% of Suntree students responded that they have learned about online safety at school. 27% of students report that they have been the victim of cyberbullying. 57.52% of students report that they have friends that have been cyberbullied.
19 | Page

EARLY WARNING SYSTEMS (SB 850) Please complete 1 – 3
1. List any additional early warning system indicators and describe the school’s early warning system.
ELEMENTARY
●Attendance below 90 percent, regardless of whether absence is excused or a result of out-of-school suspension
●One or more suspensions, whether in school or out of school
● Level 1 score on the statewide, standardized assessments in English Language Arts or mathematics
●Other
Students performing below grade level on building and district assessments.
SECONDARY
● Attendance below 90 percent, regardless of whether absence is excused or a result of out-of-school suspension
●One or more suspensions, whether in school or out of school
● Course failure in English Language Arts or mathematics
● Level 1 score on the statewide, standardized assessments in English Language Arts or mathematics
●Other
Add any additional EWS indicators here.
20 | Page

2. This section captures a snapshot of the total number of students exhibiting a respective indicator or set of indicators during the 2014-15 school year. These data should be used as part of the needs assessment to identify potential problem areas and inform the school’s planning and problem solving for 2015-16.:
● The number of students by grade level that exhibit each early warning indicator listed above.
Fill in BLANKS with data from 2014-15 School Year - Number of Students
Grade Level K 1 2 3 4 5 6 7 8 9 10 11 12 Total
Attendance <90 1 6 3 8 4 3 14
1 or more ISS or OSS
2 1 6 0 3 2 1
Level 1 in ELA or Math
Course Failure in ELA or Math
Students exhibiting 2 or more indicators
3. Describe all intervention strategies employed by the school to improve the academic performance of students identified by the early warning system (i.e., those exhibiting two or more early warning indicators).
Attendance is monitored every interim and quarter. Parents are notified if their children are below 90%. These students will be monitored by the MTSS team. Grades and current progress in ELA and Math will be monitored each interim and quarter. Students with one or more suspensions will be monitored by the MTSS team and behavioral interventions will be implemented, if necessary. Students will be offered assistance through the Academic Support Program.
STUDENT TRANSITION AND READINESS
21 | Page
1. PreK-12 TRANSITION This section used to meet requirements of 20 U.S.C 6314(b)(1)(g).
Describe the strategies the school employs to support incoming and outgoing cohorts of students in transition from one school level to another.
2. COLLEGE AND CAREER READINESS This section is required for schools with 9, 10, 11 or 12. This section meets the requirements of Sections 20 U.S.C. § 6314(b).
Describe the strategies the school uses to support college and career awareness, which may include establishing partnerships with business, industry or community organizations.
Identify the career and technical education programs available to students and industry certifications that may be earned through those respective programs.
Describe efforts the school has taken to integrate career and technical education with academic courses (e.g. industrial biotechnology) to support student achievement.
Describe strategies for improving student readiness for the public postsecondary level based on annual analysis of the High School Feedback Report ( http://data.fldoe.org/readiness/). As required by section 1008.37(4), FL Statutes.
22 | Page

(TITLE 1 SCHOOLS ONLY)
Highly Qualified TeachersDescribe the school based strategies that will be used to recruit and retain high quality, highly qualified teachers to the school.
Descriptions of Strategy Person Responsible Projected Completion Date
1.
2.
3.
Non-Highly Qualified InstructorsProvide the number of instructional staff and paraprofessionals that are teaching out-of-field and/or who are not highly qualified. *When using percentages, include the number of teachers the percentage represents (e.g., 70% [35]).
Number of staff and paraprofessionals that are teaching out-of-field/and who are not highly qualified
Provide the strategies that are being implemented to support the staff in becoming highly qualified
23 | Page
24 | Page