accountabilityandtesting.brevardschools.orgaccountabilityandtesting.brevardschools.org/School... ·...
28
Brevard County Public Schools School Improvement Plan 2012-2013 Name of School: Area: Principal: Area Superintendent: SAC Chairperson: Superintendent: Dr. Brian Binggeli Mission Statement: Building today’s dreams into tomorrow’s realities. Vision Statement: To enhance students’ lives by meeting their educational and social needs through commitment, teamwork and scholarship. Stone Middle School South Area Andrew L. Johnson, Jr. Dr. Mark Mullins Melissa E. Grabowski Page 1
Transcript of accountabilityandtesting.brevardschools.orgaccountabilityandtesting.brevardschools.org/School... ·...

Brevard County Public SchoolsSchool Improvement Plan
2012-2013
Name of School: Area:
Principal: Area Superintendent:
SAC Chairperson:
Superintendent: Dr. Brian Binggeli
Mission Statement: Building today’s dreams into tomorrow’s realities.
Vision Statement: To enhance students’ lives by meeting their educational and social needs through commitment, teamwork and scholarship.
Stone Middle School South Area
Andrew L. Johnson, Jr. Dr. Mark Mullins
Melissa E. Grabowski
Page 1

Brevard County Public SchoolsSchool Improvement Plan
2012-2013RATIONAL – Continuous Improvement Cycle Process
Data Analysis from multiple data sources: (Needs assessment that supports the need for improvement)
Groups 2012 2011 2010 2009 2008 2007Free/
Reduced Lunch Rate
63 60 55 48 50 44
Minority Rate 50 49 44 46 48 47General School Data:
FCAT Reading Data:
Traditionally, our reading scores have shown gains, however, the Florida Comprehensive Assessment Test (FCAT) 2.0 changed that for the 2012 year. At the infancy of the FCAT testing in 2002, Stone Middle School was reported to have 48% of our students meeting high standards in reading. Over the next nine years, that percentage has increased to reach 76% in 2011. Students meeting high standards in reading declined from 86% to 62% (for 7th graders) and 67% to 58% (for 8th graders) from the 2011 to 2012 test. In 2012, students making annual learning gains in reading were reported to be 65% (an increase of 6% over the previous year). The lowest performing students in reading, labeled as “the lowest 25%”, maintained the same percentage as last year at 60%.
Historically, three reported subgroups have been unable to consistently meet established levels of proficiency in reading: black students, economically disadvantaged students, and students with disabilities (SWD). Black students scores declined from 49% (2011) to 42% (2012). Economically disadvantaged students scores declined from 60% (2011) to 45% (2012). The scores of students with disabilities declined from 33% (2011) to 20% (2012).
Groups/Subgroups 2012 2011 2010 2009 2008 2007Percent Proficient in Reading 62 76 80 76 72 70
Black StudentsProficient in Reading 42 49 55 55 58 47
Economically Disadvantaged Students Proficient in Reading 45 60 65 61 58 54
Students with Disabilities 20 33 34 39 36 30
Page 2

Proficient in ReadingPercent Making Annual Learning Gains
in Reading 65 59 66 64 65 59Black Students Making Annual Learning Gains
in Reading 55 55Economically Disadvantaged Students Making
Annual Learning Gains in Reading 50Students with Disabilities Making Annual
Learning Gains in Reading 39Lowest 25% Making Annual Learning Gains
in Reading 60 60 70 69 75 62
FCAT Mathematics Data:
Mathematics scores have shown an overall increase since 2002, of the percent of our students meeting high standards, until last year (2011) with an additional decline in 2012. In 2002, this percentage was reported to be 54%. With a couple of slight declines (in 2008 and 2011) the percentage of students meeting high standards were maintained or showed increases (of up to 80%) as a whole until 2012, which evidenced a significant decline to 56%.
Students making annual learning gains in math has fluctuated between 49% and 80% during the ten years of FCAT data reporting, with changes as much as ±20% in a single year. The most recent decline was from the 2011 to 2012 year, which changed from 69% to 49%.
The “lowest 25%” of the school population in math has been measured and reported since 2007. The first two years reported showed annual learning gains of 74% and 77% respectively. In 2009, the percentage took a significant decline to 70%. With the return of the mathematics remediation course in 2009-2010, this reported subset of students evidenced a reversal in the scores to an increase to 79% (9% increase over previous year). In 2012, students making annual learning gains in this subgroup significantly decreased to 49% from 69% in 2011.
Historically, three reported subgroups have been unable to consistently meet established levels of proficiency in math: black students, economically disadvantaged students, and students with disabilities. Black students have fluctuated from 49% (2004) to 58% (2010) to 34% (2012). Economically disadvantaged students have shown similar trends, fluctuating between 49% (2004) and 69% (2010) with increases evidenced in four of the past five years: 52% (2006), 60% (2007), 61% (2008), 63% (2009), 69% (2010). In 2011, economically disadvantaged students showed an 8% decline to 61%, then an additional decline of 15% to 46% in 2012. Students with disabilities scores have fluctuated over the past six years, however, still remain the lowest performing subgroup. In 2007, this subgroup evidenced 32% of the students being proficient in math. Subsequent years have shown increases 33% (2008), 38% (2009), and 47% (2010), until 2011 (27%) and decreased yet again in 2012 to 18%.
Groups/Subgroups 2012 2011 2010 2009 2008 2007Percent Proficient in Math 56 80 82 82 79 81
Black StudentsProficient in Math 34 46 58 54 54 53
Economically Disadvantaged Students 46 61 69 63 61 60
Page 3

Proficient in MathStudents with Disabilities
Proficient in Math 18 27 47 38 33 32Percent Making Annual Learning Gains
in Math 49 69 77 73 80 79Black Students Making Annual Learning Gains
in Math 35 22Economically Disadvantaged Students Making
Annual Learning Gains in Math 40Students with Disabilities Making Annual
Learning Gains in Math 31Lowest 25% Making Annual Learning Gains
in Math 41 69 79 70 77 74
FCAT Writes Data (2011 – 2012):
FCAT Writes scores have historically remained well above the District and State averages, until the 2008-2009 year. The 2009 FCAT Writing results showed 8th graders matching State and District averages.
The percentage of students meeting high standards in writing was reported to be 86% in 2002. Historically, this has been an area of strength. However, since 2008, students have moved in a downward trend, with a 4% decline in 2010, 5% decline in 2011 and 6% in 2012 (to 79%). It should be noted that the scoring procedures of the FCAT Writing test changed significantly in 2010 from two essay scorers to one. This decline was evidenced both district- and statewide.
District Writing Assessment Data (2011 – 2012):
In the area of 8th grade writing, Stone MS students scoring a 3.0 to 3.9 decreased from 30.88% to 29.88% and students scoring a 4.0 or above increased from 49.29% to 55.92%. All subgroups, except American Indian, increased in the percent of students scoring at 4.0 or above: white students increased from 53.81% to 60.11%, black students increased from 38.46% to 45.95%, Hispanic students increased from 35.29% to 45.95%, Asian increased from 63.64% to 83.33%, economically disadvantaged students increased from 41.45% to 49.74%, English Language Learners (ELL) students increased from 18.75% to 30.77%, and students with disabilities increased from 10.53% to 15.25%. American Indian students scoring at 4.0 or above remained the same at 0%.
FCAT Science Data (2011 – 2012):
Science score reporting, beginning in 2007, shows students meeting high standards in science at 60%. The following year evidenced an 8% decline to 52%. Over the next two years, that percentage increased to 61% with the greatest gain (7%) being earned in 2010 and 2011. In 2012, students meeting high standards declined to 48%. Science scores in the Choice program have consistently scored above the District average. However, the general science courses have yet to meet District standards.
Florida Assessment for Instruction in Reading (FAIR) Data (2012):
Page 4

During the 2011-2012 school year, results from the initial FAIR testing window and the final FAIR testing window were analyzed. In the area of 7th grade reading comprehension, Stone MS moved from a median percentile rank of 42% to 50%. For our 8 th grade students, the median percentile rank moved from 46% to 54%.
For the 2012-2013 school year, during the initial FAIR testing window, the median percentile rank for reading comprehension test was 39% for the 7th grade and 42% for the 8th grade.
Currently for our 7th grade students, the initial FAIR testing window indicates 40.8% of our White Students, 66.4% of our Black Students, and 46.2% of our Hispanic Students are performing below the 40% rank on the Reading Comprehension test. Currently for our 8th grade students, the initial FAIR testing window indicates 38% of our White Students, 63.5% of our Black Students, and 36.7% of our Hispanic Students are performing below the 40% rank on the Reading Comprehension test.
During the 2011-2012 school year, In the area of 7th grade Reading Comprehension, when comparing the initial and final FAIR Reading Comprehension results of students performing below the 40%, White Students decreased from 41.1% to 30.3%, Black Students decreased from 61.9% to 48.8%, Hispanic Students decreased from 47.8% to 43.3%, Economically Disadvantaged Students decreased from, 54.5% to 42%, and Students with Disabilities decreased from 71.4% to 75%.
During the 2011-2012 school year, In the area of 8th grade Reading Comprehension, when comparing the initial and final FAIR Reading Comprehension results of students performing below the 40%, White Students decreased from 30.7% to 26.8%, Black Students decreased from 53.4% to 44.7%, Hispanic Students decreased from 69.1% to 44.4%, Economically Disadvantaged Students decreased from, 49.8% to 38.6%, and Students with Disabilities decreased from 83.3% to 73.2%.
FAIR Data (2011):
In the area of 7th grade reading comprehension, Stone MS moved from the 33rd percentile rank to the 27th percentile rank. In the area of 7th grade FCAT Success Probability, Stone MS students increased in mastery from 49.9% to 55.5%. Three subgroups remained the same: Asian (88.9%), American Indian (100%), and ELL (0%). All other subgroups showed an increase in mastery as follows: white students increased from 61.1% to 67.2%, black students increased from 30.8% to 36.4%, Hispanic students increased from 32% to 35.4%, economically disadvantaged students increased from 39.9% to 46.2%, and students with disabilities increased from 44% to 50.8%.
In the area of 8th grade reading comprehension, Stone MS students moved from the 26th percentile rank to the 21st percentile rank. In the area of 8th grade FCAT Success Probability, Stone MS students decreased in mastery from 48% to 47.5%. One subgroup remained the same: ELL (0%). One subgroup, white, increased from 52.1% to 52.7%. All other subgroups showed a decrease in mastery as follows: black students decreased from 30.7% to 29.2%, Hispanic students decreased from 42.6% to 42.2%, Asian students decreased from 87.5% to 85.7%, economically disadvantaged students decreased from 39.5% to 38.9%, and students with disabilities decreased from 42.4% to 40.8%.
Math District Assessment Data (2011 – 2012):
Page 5
In the area of 7th grade mathematics, Stone MS increased from 3.64% mastery to 13.52% mastery. Six subgroups made gains in mastery: level 5 students increased from 24% to 57.14%, white students increased from 4.17% to 15.14%, black students increased from .94% to 2.17%, Hispanic students increased from 3.85% to 18.37%, Asian students increased from 50% to 75%, economically disadvantaged students increased from .4% to 6.9%, and students with disabilities increased from 0% to 2.08%. No subgroup decreased, two subgroups (ELL and SWD) remained the same at 0% proficiency and all other subgroups showed an increase in average performance.
In the area of 8th grade mathematics, Stone MS increased in mastery from 3.06% to 8.47%. Six subgroups made gains in mastery: Level 3 students increased from 0% to 1%, Level 4 students increased from 2.7% to 11.11%, Level 5 students increased from 20% to 44.44%, white students increased from 4.1% to 12.57%, Asian students increased from 0% to 33.33%, and economically disadvantaged students increased from 2.54% to 6.93%. Seven subgroups remained the same. Five subgroups showed a decrease in average performance and eight subgroups showed an increase in average performance.
Math End of Course Data (2011):
Stone MS students did show an increase in overall proficiency on the Algebra test, increasing from 0% to 4.24% proficiency and showed an increase in overall average from a 36.88 to 47.06. Proficiency increased in the areas of function, linear equations & inequalities (43.32 to 56.13%), polynomials (22.12 to 27.86%), and rationals, radicals, quadratics & discrete math (3.08 to 11.86%). The average score for each of the categories increased. Five subgroups remained the same at level of proficiency. One subgroup showed a decrease in overall average (ELL 42.5 to 35%). All other subgroups (white, black, Hispanic, Asian, economically disadvantaged, and students with disabilities) showed an increase in overall average.
Stone MS students did show an increase in overall proficiency on the Geometry test, increasing from 0% to 3.7%. For both assessments, the students showed an increase in overall average from a 27.44 to 45.12%. Proficiency increased in the areas of Two-dimensional (0 to 11.11%), Three-Dimensional (3.7 to 14.81%), and Trigonometry & Discrete Math (3.7 to 18.52%). The average score for each of the categories increased. Five subgroups showed an increase in overall average (white, Hispanic, Asian, economically disadvantaged, and students with disabilities). However, three subgroups remained the same (0%) due to (0) students enrolled.
Analysis of Current Practice: (How do we currently conduct business?) Historically, we have operated using the “middle school teams” mentality. The emphasis on “teams” placed academic-core teachers with shared student-cohorts. In this same model, common team planning afforded the luxury of discussing problematic students, interdisciplinary teaching, teacher bonding, etc. Although the team approach shared some of the support attributes of Common Core, the purposes of the two differ greatly. The teaming approach places the majority of the focus on the student...what he or she can or cannot do and the “fixes” necessary to make everything right in the world of the teacher. As we began to move away from “the student is lacking” problem statement, our focus has begun to shift toward the Common Core premise in that “it’s up to the teacher” to facilitate valued learning. The Common Core State Standards (CCSS) emphasize rigor and relevance for all students that will lead to critical thinking essential for 21st Century learners. Therefore, the Common Core initiative has led us to common departmental planning which allows teachers to fully implement the CCSS with fidelity. The implementation process allows teachers to challenge students at higher levels of learning, scaffold student learning and evaluate learning by student demonstration.
Page 6

Currently, analysis of school-wide student data is evaluated through the results of District Assessments, FAIR, Intensive Reading Progress Monitoring Assessments, and classroom-based tests. This data is accessed through several district supported data systems (A3 vision, the PMRN and the Desktop Student Data System). Collaborative Teams meet to monitor the progress of the lowest 39%.
Presently, our school goal is to become the second AVID National Demonstration Middle School in Brevard County. We are seeking this distinction, which complements the Common Core implementation for the 2012-2013 school year. AVID embeds higher levels of learning and critical thinking by student demonstration facilitated by teachers. AVID holds high expectations in reading, writing, speaking, listening, and language, which are the foundational foci of CCSS. AVID clearly defines what students are expected to know and be able to do in order to be successful in more rigorous curriculum. The AVID strategies and methodologies are research-based and proven to maximize student-learning outcomes.
Best Practice: (What does research tell us we should be doing as it relates to data analysis above?)
As outlined in our 2013 School Improvement Plan, the Stone Middle School student population shows deficits in our FCAT testing in three areas: black students, economically disadvantaged students, and students with disabilities. In an effort to minimize deficiencies in these areas, the AVID program targets this very student base. In conjunction with all stakeholders (teachers, students, parents/guardians), a collaborative effort will be made to support the success and academic growth of all students. Research evidences that on-going professional learning “yielding the highest levels of improved student achievement, is a team of teachers with a natural common interest” (Darling-Hammond, Wei, Andree, Richardson, & Orphanos, 2009; Gallimore et al., 2009; Little, 2006, Saphier et al., 2006; Stigler & Hiebert, 2009).
In addition, research evidences that shared beliefs and support among stakeholders had significantly higher levels of student achievement (Watt, Huerta & Mills, 2010; Rooney, 2005; Fullan, 2004). AVID and CCSS research cite the need to connect students to a higher level of learning, operating with a shared belief, for the ultimate success for all students. The goal of the 2013 Stone Middle School Improvement Plan is to become a National Demonstration site. Through this process of implementing AVID strategies and methodologies with fidelity, we will better meet the academic needs of all students we serve.
Page 7

CONTENT AREA: Reading Math Writing Science Parental
InvolvementDrop-out Programs
Language Arts
Social Studies
Arts/PE Other:
School Based Objective: (Action statement: What will we do to improve programmatic and/or instructional effectiveness?)The Stone Middle School faculty will use the process of becoming an AVID (Advancement Via Individual Determination) National Demonstration School to address increased student achievement and instructional effectiveness.
Strategies: (Small number of action oriented staff performance objectives)
Barrier Action Steps Person Responsible
Timetable
Budget* In-ProcessMeasure
1. Teacher buy-in
1A. Presentation of the program by Administration.
Administration August 2012
* Faculty meeting agendas; SWAP (Sharing With Another Professional) meets; Hosting Florida/Georgia District Directors Conference; Mock and Validation visits
1B. Share student success stories.
AVID Coordinator; student panel; parents
Ongoing, beginning
August 2012
* SWAP meets; Student panel at Florida/Georgia District Directors Conference; Mock and Validation visits
1C. Present Data supporting college-readiness and attendance to faculty.
AVID Coordinator
Ongoing, beginning
August 2012
* Faculty meeting; SWAP meet
1D. Emphasize the connection with Common Core & individual teacher PGP (Professional Growth Plan).
Principal; Assistant Principal/ Curriculum
Ongoing, beginning
August 2012
* Pre-planning presentation; Faculty meetings; SWAP meets
1E. Implement Word Walls
Administration; All teachers
By September
2012
$80* Classroom Walkthroughs (CWTs)
1F. Emphasize monthly exposure to Text Complexity through Common Focus Reading Day
Administration; S.T.A.R.R. (Striving To Attain Reflective Reading) PLC; All teachers
Monthly on Early
Release Days (ERD), beginning
August 2012
* Monthly review of articles by STARR PLC;CWTs
Page 8

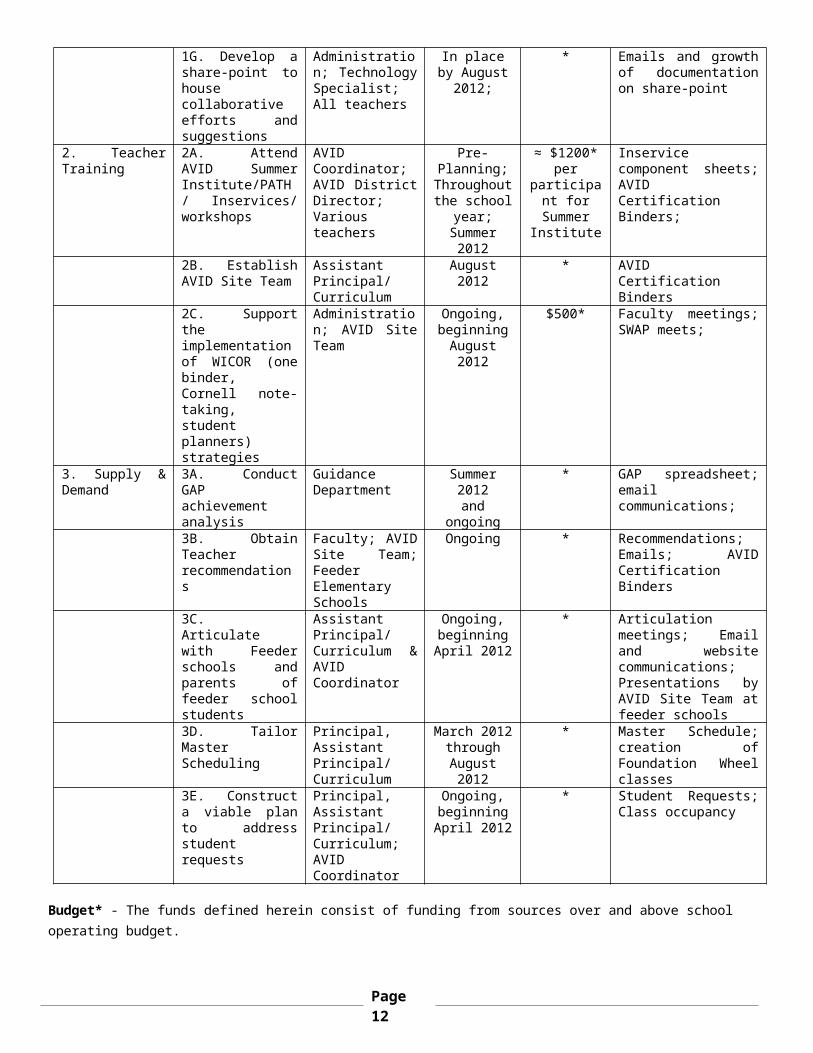
1G. Develop a share-point to house collaborative efforts and suggestions
Administration; Technology Specialist; All teachers
In place by August 2012;
* Emails and growth of documentation on share-point
2. Teacher Training
2A. Attend AVID Summer Institute/PATH/ Inservices/ workshops
AVID Coordinator; AVID District Director; Various teachers
Pre-Planning;
Throughout the school
year; Summer
2012
≈ $1200* per
participant for
Summer Institute
Inservice component sheets; AVID Certification Binders;
2B. Establish AVID Site Team
Assistant Principal/ Curriculum
August 2012
* AVID Certification Binders
2C. Support the implementation of WICOR (one binder, Cornell note-taking, student planners) strategies
Administration; AVID Site Team
Ongoing, beginning
August 2012
$500* Faculty meetings; SWAP meets;
3. Supply & Demand
3A. Conduct GAP achievement analysis
Guidance Department
Summer 2012and
ongoing
* GAP spreadsheet; email communications;
3B. Obtain Teacher recommendations
Faculty; AVID Site Team; Feeder Elementary Schools
Ongoing * Recommendations; Emails; AVID Certification Binders
3C. Articulate with Feeder schools and parents of feeder school students
Assistant Principal/ Curriculum & AVID Coordinator
Ongoing, beginning April 2012
* Articulation meetings; Email and website communications; Presentations by AVID Site Team at feeder schools
3D. Tailor Master Scheduling
Principal, Assistant Principal/ Curriculum
March 2012 through August 2012
* Master Schedule; creation of Foundation Wheel classes
3E. Construct a viable plan to address student requests
Principal, Assistant Principal/ Curriculum; AVID Coordinator
Ongoing, beginning April 2012
* Student Requests; Class occupancy
Budget* - The funds defined herein consist of funding from sources over and above school operating budget.
Page 9

EVALUATION – Outcome Measures and Reflection
Qualitative and Quantitative Professional Practice Outcomes: (Measures the level of implementation of the professional practices throughout the school)
Qualitative Outcomes:Levels of implementation will be measured in the following ways:
1. 100% of the teachers will reference AVID strategies/methodologies in their Individual Professional Growth Plan for 2013.
2. 100% of the teachers will participate in collaborative teams to help address specific needs of the lowest 35% of our student population.
3. At least 50% of the Classroom Walkthrough Observations will evidence use of AVID strategies/ methodologies.
4. At least 50% of the Teacher Lesson Plans will evidence AVID strategies/methodologies.5. The AVID Mock and Demonstration Visit Evaluations will identify 100% of the needs/concerns for those
teachers not effectively using AVID strategies.6. 75% of the teacher-to-teacher observations will be used as a means of sharing best practices. 7. 100% of the teacher training evaluations from the sharing of AVID strategies will be used to identify
individual/school-wide needs for future training and growth.8. 100% of the teachers surveyed will provide information to determine the need for additional PLCs.
Quantitative Outcomes:1. The Value Added Measure (VAM) scores should show an increase of at least 10% over the previous
year.2. At least 50% of the students who earned a 2012 FCAT score of less than proficient in reading and/or
math will show a learning gain on the respective tests in 2013.3. At least 15% of teachers and administration will be active participants of the AVID Site Team.4. At least 35% of the teachers and administrators will be trained by AVID at Summer Institute or PATH.
Qualitative and Quantitative Student Achievement Expectations: (Measures of student achievement)
Qualitative Outcomes:Measures of student achievement will be evaluated in the following ways:
1. Student work: All teachers will evidence student growth, over time, in math, reading, writing, and science work (Edline, portfolios, IANs, etc.).
2. Student binders: At least 10% of the students will maintain organized and meaningful binders to assist in their “preparedness” for instruction. These binders will be graded to evidence this preparedness.
3. Cornell Notes: Students will utilize Cornell Notes as the method of note taking in at least 75% of their core classes. Samples of quality Cornell Notes – utilizing the Cornell Way – will be evidenced in the student binders/portfolios.
4. Interactive Notebooks (IANs): Of the teachers using IANs, at least 75% will model the proper method. IANs will be available in student binders/portfolios.
5. Socratic Seminars: 100% of the AVID trained teacher will properly use Socratic Seminars. Reflections/Articles from Socratic Seminars will be available in student binders/portfolios.
6. Philosophical Chairs: 100% of the AVID trained teacher will properly use Philosophical Chairs. Reflections from Philosophical Chairs will be available in student binders/portfolios
7. 100% of the teachers will evidence reading comprehension through our S.T.A.R.R. (Striving to Attain Reflective Reading) initiative and the use of Complex Text. Students will be participating in relevant reading (of complex text) in each of their classes monthly (at a minimum) – during our Early Release Days (ERDs).
Quantitative Outcomes:1. 2013 Student FCAT assessment results: 70% of the students will make annual learning gains in
Page 10

reading and math on the 2013 FCAT.2. FAIR testing results: 70% of students will show an increase for the 1st to last FAIR test in 2012 – 2013.3. End of Course test results for Algebra I and Geometry students: The percentage of Algebra I and
Geometry students earning a passing score on their respective EOC exams will be at or above 80%.4. District Assessment results on Writing, Math and Science: At least 80% of the students taking the
District Assessments will score at or above grade level.
Page 11
APPENDIX A
(ALL SCHOOLS)
Reading Goal
1. If the process of becoming an AVID National Demonstration School is implemented with fidelity, reading achievement will be addressed for all groups.
2012 Current Level of
Performance(Enter percentage information and the number of students that percentage reflects ie.
28%=129 students)
2013 Expected Level of
Performance(Enter percentage
information and the number of students that percentage reflects ie. 31%=1134 students)
Anticipated Barrier(s):1.
Strategy(s):1.
FCAT 2.0Students scoring at Achievement Level 3
Barrier(s):
Strategy(s):1.
31% = 227 34% = 259current Level 3’s
+ 10% from current Levels
1 & 2’sFlorida Alternate Assessment: Students scoring at levels 4, 5, and 6 in Reading
Barrier(s):
Strategy(s):
1.
80% = 4 *Due to the small number of
students in this category, the
data would not be valid
FCAT 2.0Students scoring at or above Achievement Levels 4 and 5 in Reading
Barrier(s):
Strategy(s):1.
30% = 219 31% = 242current Level 4 and 5’s + 10% from current
Levels 3’sFlorida Alternate Assessment:Students scoring at or above Level 7 in Reading
Barrier(s):
Strategy(s):1.
20% = 1 *Due to the small number of
students in this category, the
data would not be valid
Florida Alternate Assessment:Percentage of students making learning Gains in Reading
Barrier(s):
Strategy(s):1.
33% = 1 *Due to the small number of
students in this category, the
data would not be valid
FCAT 2.0Percentage of students in lowest 25% making learning gains in Reading
Barrier(s):
Strategy(s):1.Florida Alternate Assessment:
60% = 102 71% = 120
Page 12

Percentage of students in Lowest 25% making learning gains in ReadingBarrier(s):
Strategy(s):1.
*Due to the small number of
students in this category, the
data would not be valid
Ambitious but Achievable Annual Measurable Objectives (AMOs). In six years school will reduce their Achievement Gap by 50%:
Baseline data 2010-11:
Student subgroups by ethnicity NOT making satisfactory progress in reading:
White:
Black:
Hispanic:
Asian:
American Indian:
Enter numerical data for current level of performance
30% = 112
57% = 100
46% = 54
25% = 4
Subgroup too small
Enter numerical data for expected level of
performance
20% = 75
47% = 83
36% = 42
6% = 1
Subgroup too small
English Language Learners (ELL) not making satisfactory progress in ReadingBarrier(s):
Strategy(s):1.
83% = 10 57% = 7
Students with Disabilities (SWD) not making satisfactory progress in ReadingBarrier(s):
Strategy(s):1.
44% = 287 34% = 222
Economically Disadvantaged Students not making satisfactory progress in ReadingBarrier(s):
Strategy(s):1.
47% = 214 37% = 168
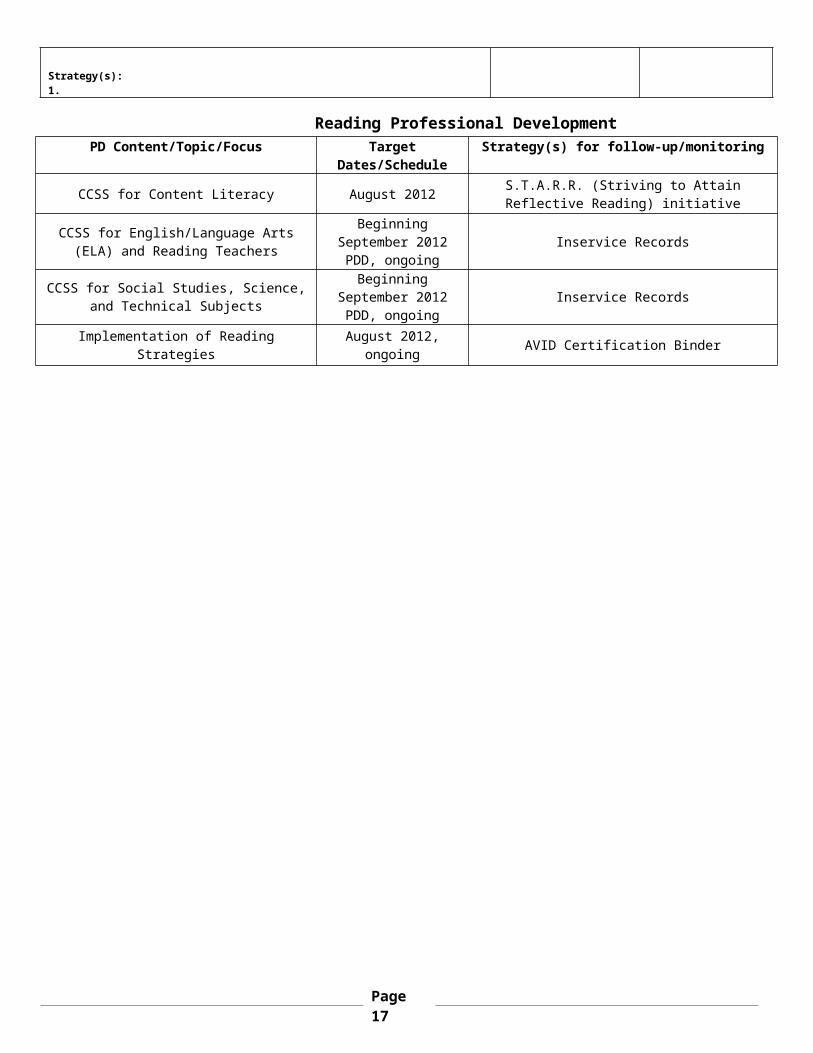
Reading Professional DevelopmentPD Content/Topic/Focus Target
Dates/ScheduleStrategy(s) for follow-up/monitoring
CCSS for Content Literacy August 2012 S.T.A.R.R. (Striving to Attain Reflective Reading) initiative
CCSS for English/Language Arts (ELA) and Reading Teachers
Beginning September 2012
PDD, ongoingInservice Records
CCSS for Social Studies, Science, and Technical Subjects
Beginning September 2012
PDD, ongoingInservice Records
Implementation of Reading Strategies August 2012, ongoing AVID Certification Binder
Page 13

CELLA GOAL Anticipated Barrier
Strategy Person/Process/
Monitoring2012 Current Percent of Students Proficient in Listening/ Speaking:
1. Provide an additional period of Language Immersion for limited language learners.
2. Provide each English Language Learner (ELL) with an English to heritage language dictionary.
3. Provide access to Achieve 3000 ≥ three times weekly (differentiated, online instruction using non-fiction content and ongoing Lexile® assessment)
Language Immersion Teacher; ELL Itinerate
Teacher; Assistant Principal; ELL School
Contact Person
2012 Current Percent of Students Proficient in Reading:
1. Provide an additional period of Language Immersion for limited language learners.
2. Provide each English Language Learner (ELL) with an English to heritage language dictionary.
3. Provide access to Achieve 3000 ≥ three times weekly (differentiated, online instruction using non-fiction content and ongoing Lexile® assessment)
Language Immersion Teacher; ELL Itinerate
Teacher; Assistant Principal; ELL School
Contact Person
2012 Current Percent of Students Proficient in Writing:
1. Provide an additional period of Language Immersion for limited language learners.
2. Provide each English Language Learner (ELL) with an English to heritage language dictionary.
Language Immersion Teacher; ELL Itinerate
Teacher; Assistant Principal; ELL School
Contact Person
Mathematics Goal(s):
1. If the process of becoming an AVID National Demonstration School is implemented with fidelity, mathematics achievement will be addressed for all groups.
2012 Current Level of Performance
(Enter percentage information and the number of students
that percentage reflects)
2013 Expected Level of Performance
(Enter percentage information and the number of students
that percentage reflects)
Anticipated Barrier(s):1.
Strategy(s):1.
FCAT 2.0Students scoring at Achievement Level 3Barrier(s):
Strategy(s):1.
27% = 197 31% = 231current Level 3’s + 10%
from current Levels 1 & 2’s
Florida Alternate Assessment: Students scoring at levels 4, 5, and 6 in MathematicsBarrier(s):
Strategy(s):1.
100% = 5 N/A
FCAT 2.0Students scoring at or above Achievement Levels 4 and 5 in MathematicsBarrier(s):
Strategy(s):1.
27% = 200 30% = 220current Level 4 and 5’s + 10% from current Levels
3’s
Florida Alternate Assessment:Students scoring at or above Level 7 in MathematicsBarrier(s):
Strategy(s):1.
0%*Due to the small
number of students in this category, the data
would not be valid
Florida Alternate Assessment:Percentage of students making learning Gains in MathematicsBarrier(s):
67% = 2 *Due to the small number of students in
27% = 4
0%
0%
Page 14

Strategy(s):1.
this category, the data would not be valid
FCAT 2.0Percentage of students in lowest 25% making learning gains in MathematicsBarrier(s):
Strategy(s):1.
41% = 71 51% = 88
Florida Alternate Assessment:Percentage of students in Lowest 25% making learning gains in MathematicsBarrier(s):
Strategy(s):1.
*Due to the small number of students in this category, the data would not be
valid
*Due to the small number of students in this category, the data
would not be valid
Ambitious but Achievable Annual Measurable Objectives (AMOs). In six years school will reduce their Achievement Gap by 50%:
Baseline Data 2010-11:
Student subgroups by ethnicity NOT making satisfactory progress in mathematics:
White:
Black:
Hispanic:
Asian:
American Indian:
37% = 137
68% = 120
55% = 65
6% = 1
Subgroup too small
25% = 93
55% = 97
37% = 44
0% = 0
Subgroup too smallEnglish Language Learners (ELL) not making satisfactory progress in Mathematics 83% = 10 64% = 8Students with Disabilities (SWD) not making satisfactory progress in Mathematics 62% = 77 56% = 70Economically Disadvantaged Students not making satisfactory progress in Mathematics 56% = 256 41% = 189
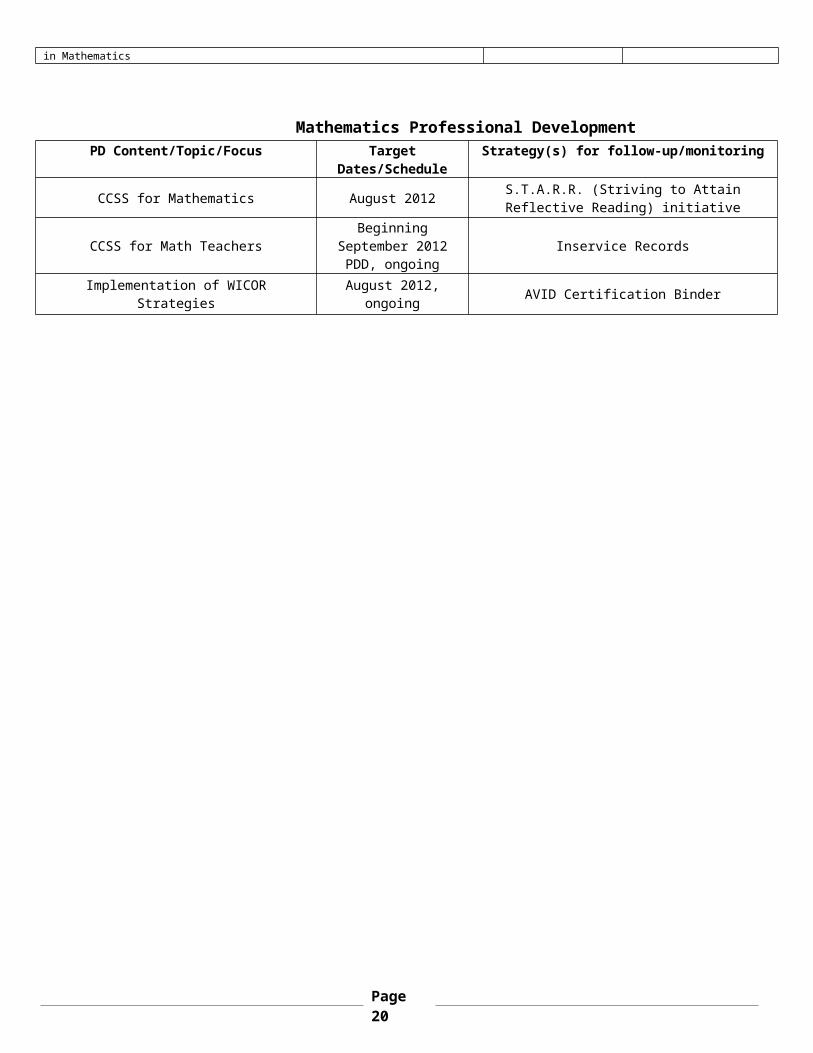
Mathematics Professional DevelopmentPD Content/Topic/Focus Target
Dates/ScheduleStrategy(s) for follow-up/monitoring
CCSS for Mathematics August 2012 S.T.A.R.R. (Striving to Attain Reflective Reading) initiative
CCSS for Math TeachersBeginning
September 2012 PDD, ongoing
Inservice Records
Implementation of WICOR Strategies August 2012, ongoing AVID Certification Binder
Page 15

Writing
1. If the process of becoming an AVID National Demonstration School is implemented with fidelity, writing achievement will be addressed for all groups.
2012 Current Level of Performance
(Enter percentage information and the number of students
that percentage reflects)
2013 Expected Level of Performance
(Enter percentage information and the number of students that
percentage reflects)
Barrier(s):
Strategy(s):1.
FCAT: Students scoring at Achievement level 3.0 and higher in writing 79% = 268 89% = 302Florida Alternate Assessment: Students scoring at 4 or higher in writing 100% = 2
*Due to the small number of students in this category, the data
would not be valid
Science Goal(s)(Elementary and Middle)
1. If the process of becoming an AVID National Demonstration School is implemented with fidelity, the science barriers will be addressed for all groups.
2012 Current Level of Performance
(Enter percentage information and the
number of students that percentage reflects)
2013 Expected Level of Performance
(Enter percentage information and the
number of students that percentage reflects)
Barrier(s):
Strategy(s):1.
FCAT 2.0 Students scoring at Achievement level 3 in Science: 35% = 123 41% = 143Florida Alternate Assessment: Students scoring at levels 4, 5, and 6 in Science 100% = 2 N/AFCAT 2.0 Students scoring at or above Achievement Levels 4 and 5 in Science: 12% = 42 15% = 54Florida Alternate Assessment:Students scoring at or above Level 7 in Reading 0%
*Due to the small number of students in this category, the data
would not be valid
Page 16
APPENDIX B(SECONDARY SCHOOLS ONLY)
Algebra 1 EOC Goal
1. If the process of becoming an AVID National Demonstration School is implemented with fidelity, writing achievement will be addressed for all groups.
2012 Current Level of Performance
(Enter percentage information and the number of students
that percentage reflects)
2013 Expected Level of Performance
(Enter percentage information and the number of students
that percentage reflects)
Barrier(s):
Strategy(s):1.
Students scoring at Achievement level 3 in Algebra: 47% = 57 50% = 60Students scoring at or above Achievement Levels 4 and 5 in Algebra: 41% = 50 46% = 56Ambitious but Achievable Annual Measurable Objectives (AMOs). In six years school will reduce their Achievement Gap by 50%: Baseline Data 2010-11
Student subgroups by ethnicity (White, Black, Hispanic, Asian, American Indian) not making satisfactory progress in Algebra.
White:
Black:
Hispanic:
10% = 7
14% = 3
14% = 2
7% = 7
5% = 1
7% = 1
English Language Learners (ELL) not making satisfactory progress in Algebra N/A N/AStudents with Disabilities (SWD) not making satisfactory progress in Algebra N/A N/AEconomically Disadvantaged Students not making satisfactory progress in Algebra N/A N/A
Page 17

Geometry EOC Goal
1. If the process of becoming an AVID National Demonstration School is implemented with fidelity, writing achievement will be addressed for all groups.
2012 Current Level of Performance (Enter
percentage information and the number of students that
percentage reflects)
2013 Expected Level of Performance
(Enter percentage information and the
number of students that percentage reflects)
Barrier(s):
Strategy(s):1.
Students scoring at Achievement level 3 in Geometry:
Students scoring at or above Achievement Levels 4 and 5 in Geometry:
Ambitious but Achievable Annual Measurable Objectives (AMOs). In six years school will reduce their Achievement Gap by 50%: Baseline Data 2010-11
Student subgroups by ethnicity (White, Black, Hispanic, Asian, American Indian) not making satisfactory progress in Geometry.
White:
Black:
Hispanic:
English Language Learners (ELL) not making satisfactory progress in GeometryStudents with Disabilities (SWD) not making satisfactory progress in GeometryEconomically Disadvantaged Students not making satisfactory progress in Geometry
Civics EOC
1. If the process of becoming an AVID National Demonstration School is implemented with fidelity, writing achievement will be addressed for all groups.
2012 Current Level of Performance(Enter percentage information and
the number of students that percentage reflects)
2013 Expected Level of Performance(Enter percentage information and the number of students that percentage
reflects)
Students scoring at Achievement level 3 in Civics: N/A N/AStudents scoring at or above Achievement Levels 4 and 5 in Civics:
N/A N/A
Page 18

U.S. History EOC
1. If the process of becoming an AVID National Demonstration School is implemented with fidelity, writing achievement will be addressed for all groups.
2012 Current Level of Performance
(Enter percentage information and the
number of students that percentage reflects)
2013 Expected Level of Performance(Enter percentage information and the number of students that percentage
reflects)
Students scoring at Achievement level 3 in U. S. History: N/A N/AStudents scoring at or above Achievement Levels 4 and 5 in U. S. History: N/A N/A
Science, Technology, Engineering, and
Mathematics (STEM) Goal(s)
Anticipated Barrier
Strategy Person/Process/Monitoring
Based on the analysis of school data, identify and define areas in need of improvement:
Goal 1: Teachers will expose students to more hands-on technology
Technology available and functioning
Teachers will expose students to more
technology and tools that support STEM
Tech Ed teacherStudents
Evaluation of TechnologyAssessments
Rubrics
Career and Technical Education (CTE) Goal(s)
Anticipated Barrier
Strategy Person/Process/Monitoring
Based on the analysis of school data, identify and define areas in need of improvement:
Goal 1: Create awareness in teachers and parents regarding the CTE program
Goal 2: Increase awareness in students of the connections to Science & Technology interwoven with Math in relation to the CTE classes
Buy-in
Student buy-in
Create an online presentation for
parents and teachers
Students will create projects based upon
the basis of STEM
CTE department Online/Website
Survey to parents
CTE teachers Projects
Project assessments rubrics
Additional Goal(s) Anticipated Barrier
Strategy Person/Process/Monitoring
Based on the analysis of school data, identify and define areas in need of improvement:
Goal 1: Music: Develop and utilize more standards based assessments to prepare kids for pre and post assessments and/or End of Course.
Goal 2: World Language: To create awareness of language acquisition across curriculum
Music: Standardization of the assessment
World Language: Student success and retention of interest
world language
Music: Teacher created assessments based upon the NGSS’
standards
World Language: Foster connections cross-discipline of world language;
Collaboration with peers to support world
language cross-discipline
Music: Music DepartmentCurriculum Guides and Pacing guides
Formative/Summative
World Language: World Language teacher
CollaborationFormative/Summative Assessments
Page 19
For the following areas, please write a brief narrative that includes the data for the year 2011-12 and a description of changes you intend to incorporate to improve the data for the year 2012-13.
MULTI-TIERED SYSTEM OF SUPPORTS (MTSS)/RESPONSE to INTERVENTION (RtI) (Identify the MTSS leadership team and it role in development and implementation of the SIP along with data sources, data management and how staff is trained in MTSS)
There are three Tiers in the RtI process. Some students will make rapid progress and only need Tier 1. Other students may need Tier 2 or Tier 3 to be successful. Each Tier gives more intensive help to the student. Data regarding student learning will be constantly looked at to see if the student is making progress.
Tier 1 – This is core instruction that all students receive in their regular classroom. Sometimes a different teaching approach or materials are used with some of the students in the class. This helps not only the struggling student but also others in the classroom as well.
Tier 2 - If the student is still struggling, a school team called the Individual Problem Solving Team (IPST) will work with the teacher and the parent to develop more intensive strategies. The IPST may consist of many different people such as a psychologist, speech/language therapist, reading specialist, as well as the teacher. Different, more targeted strategies such as small groups may be put in place to meet the learning needs of the student.
Tier 3 - If the student is not making adequate progress with Tier 2 interventions the IPST will look at providing Tier 3 interventions, which will increase the intensity and individualization of the interventions and supports. Progress charts may show that the child needs more instructional time, for example, or needs to be taught using a different method or different materials. Tier 3 interventions are provided in addition to core (regular) instruction rather than as a replacement. If the student is successful in Tier 3, school staff and the parents decide the best way to maintain success.
Data is collected from a multitude of sources: A3 Vision, FAIR test data, DA testing data, teacher input, parent/teacher conferences.
PARENT INVOLVEMENT:
In the 2012 school year, Stone Middle School parents and community volunteer hours rose to over 16,000 hours. In an effort to meet rising standards, deployment of monthly family/community involvement meetings set a precedence for meeting the needs on campus, for both teachers and students. Based on the 2012 Parent/Client surveys, 25.8% of those surveyed noted one area of concern was the lack of "convenient time" for family involvement meetings.
ATTENDANCE: (Include current and expected attendance rates, excessive absences and tardies):
Our attendance rate is currently at 96.6% (as of 09/24/12). Our expected attendance rate should not fall below 95%.
SUSPENSION:
Stone Middle School had a total of 119 students suspended last year with a total student population of 744. For the 2012-13 school year, we currently have 30 students suspended (as of 10/08/12) with a total student population of 802. In an effort to maintain attendance, we have several consequence options prior to utilizing suspensions to include phone calls home, conferences with parents/teachers/dean, teacher detentions, truancy officer support, and administrative timeouts.
DROP-OUT (High Schools only):
POSTSECONDARY READINESS: (How does the school incorporate students’ academic and career planning, as well as promote student course selections, so that students’ course of study is personally meaningful? Describe strategies for improving student readiness for the public postsecondary level based on annual analysis of the High School Feedback Report.)
Stone Middle School assists students with academic and career planning through IPS student/parent/counselor meetings, AVID, promotion of high school programs, and course recommendations. High School courses to include Spanish I, Spanish II, Computing for College and Careers, Algebra I, Algebra I Honors, and Geometry Honors are available to challenge our middle school students. Courses selections are recommended by teachers and approved by students and parents. Gifted students participate in gifted classes to enhance learning and address their needs. The ability to participate in high school courses at the middle school allows students the ability to be exposed to more advanced curriculum once in high school.
Page 20