Accessing and Matching Industry Certification Data€¦ · Accessing and Matching Industry...
41
Accessing and Matching Industry Certification Data August 10, 2016 Catherine Imperatore, ACTE John Haigh, OCTAE Gretchen Koch, CompTIA Scott Parke, Collin College Pradeep Kotamraju, Vladimir Bassis & Paula Nissen, IA Bob Sheets, George Washington University
Transcript of Accessing and Matching Industry Certification Data€¦ · Accessing and Matching Industry...

Accessing and Matching Industry Certification Data
August 10, 2016 Catherine Imperatore, ACTE
John Haigh, OCTAE Gretchen Koch, CompTIA Scott Parke, Collin College
Pradeep Kotamraju, Vladimir Bassis & Paula Nissen, IA Bob Sheets, George Washington University

The work reported herein was supported under theImproving Program Performance TechnicalAssistance to States project, Contract Number (ED-VAE-11-O-023) as administered by the Office ofCareer, Technical, and Adult Education, U.S. Department of Education. However, the contents donot necessarily represent the positions or policies of the Office of Career, Technical, and Adult Education or the U.S. Department of Education and you shouldnot assume endorsement by the FederalGovernment.
2
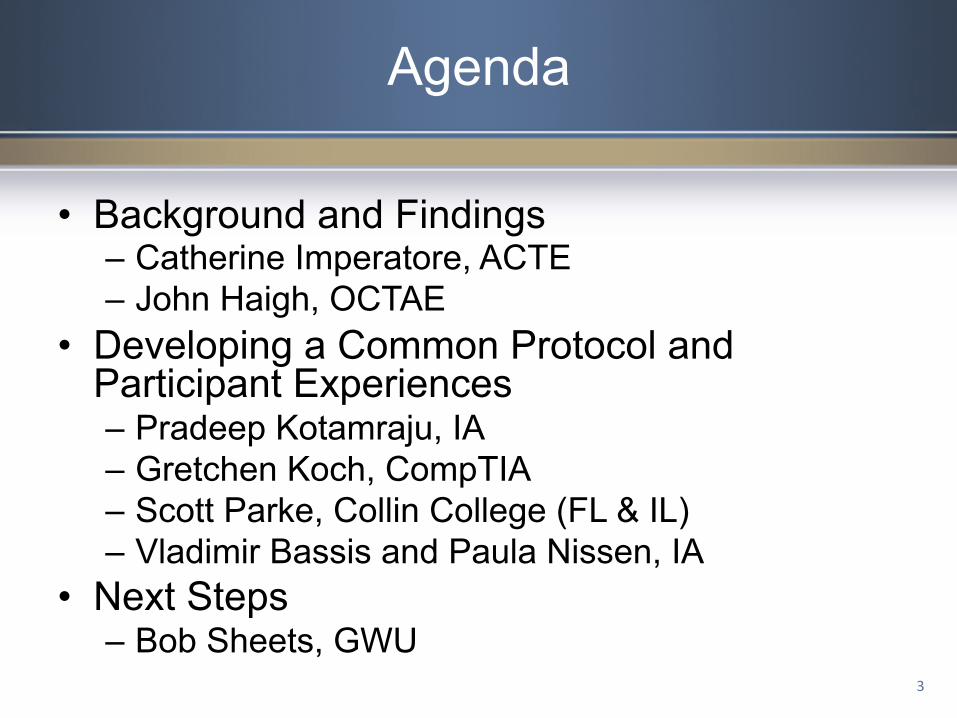
Agenda
• Background and Findings– Catherine Imperatore, ACTE– John Haigh, OCTAE
• Developing a Common Protocol andParticipant Experiences– Pradeep Kotamraju, IA– Gretchen Koch, CompTIA– Scott Parke, Collin College (FL & IL)– Vladimir Bassis and Paula Nissen, IA
• Next Steps– Bob Sheets, GWU
3

Credentials, Defined
ACTE, 2015, What is a Credential? Fact Sheet 4

Perkins Reporting
• Carl D. Perkins Act of 2006 (Perkins IV)– Data for accountability requirements
• 2S1 and 1P1: … passed technical skillassessments that are aligned with industry-recognized standards, if available andappropriate …
• 3S1: … earned a proficiency credential …• 2P1 … earned an industry-recognized
credential …– Data for program improvement– Data that demonstrates ROI
5

Early Stages
• Different stakeholders coming together– Illinois-CompTIA pilot– Department of Education Office of Career,
Technical and Adult Education– ACTE
6
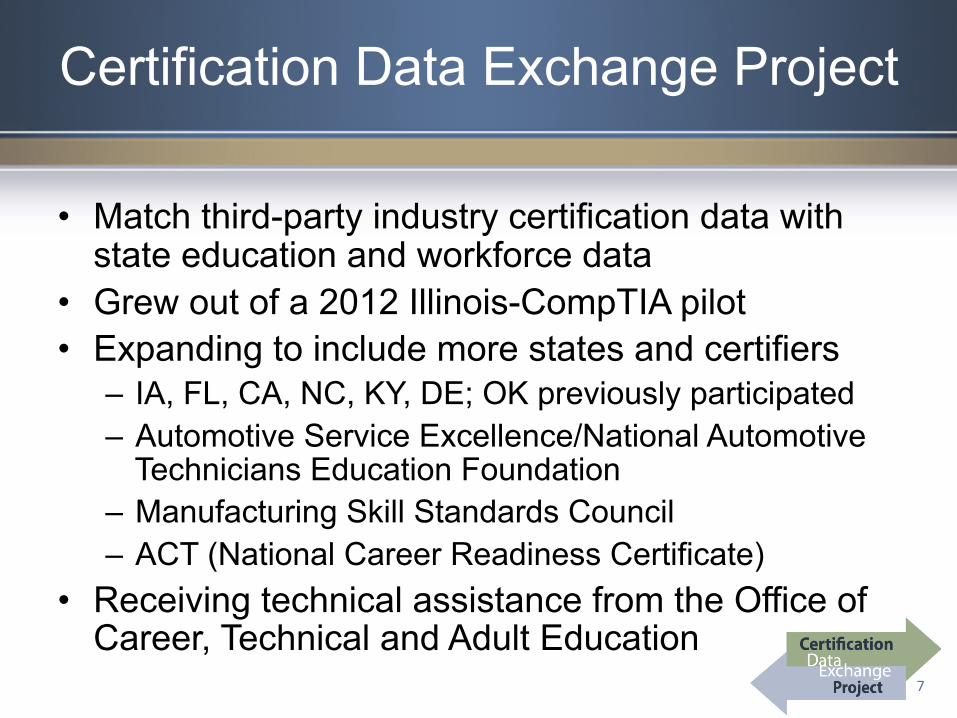
Certification Data Exchange Project
• Match third-party industry certification data withstate education and workforce data
• Grew out of a 2012 Illinois-CompTIA pilot• Expanding to include more states and certifiers
– IA, FL, CA, NC, KY, DE; OK previously participated– Automotive Service Excellence/National Automotive
Technicians Education Foundation– Manufacturing Skill Standards Council– ACT (National Career Readiness Certificate)
• Receiving technical assistance from the Office ofCareer, Technical and Adult Education
7

Data from Certifying
Organization to State
Match to State Education Data
System
State Education Data Matched to
State EmploymentData
Match certification records with student data using first name, last name, location, month/year of birth (with some variation) Use SSN to match with unemployment insurance wage records Report back aggregate results 8
Recent Findings & Types of Data Available

Enrollment Status
8000
7000
6000
5000 N
Iowa: The majority of students became certifiedwhile they were enrolled 4000
3000
2000
1000
0Certified Not Certified
Y
10
California: More test-takers not enrolled than enrolled
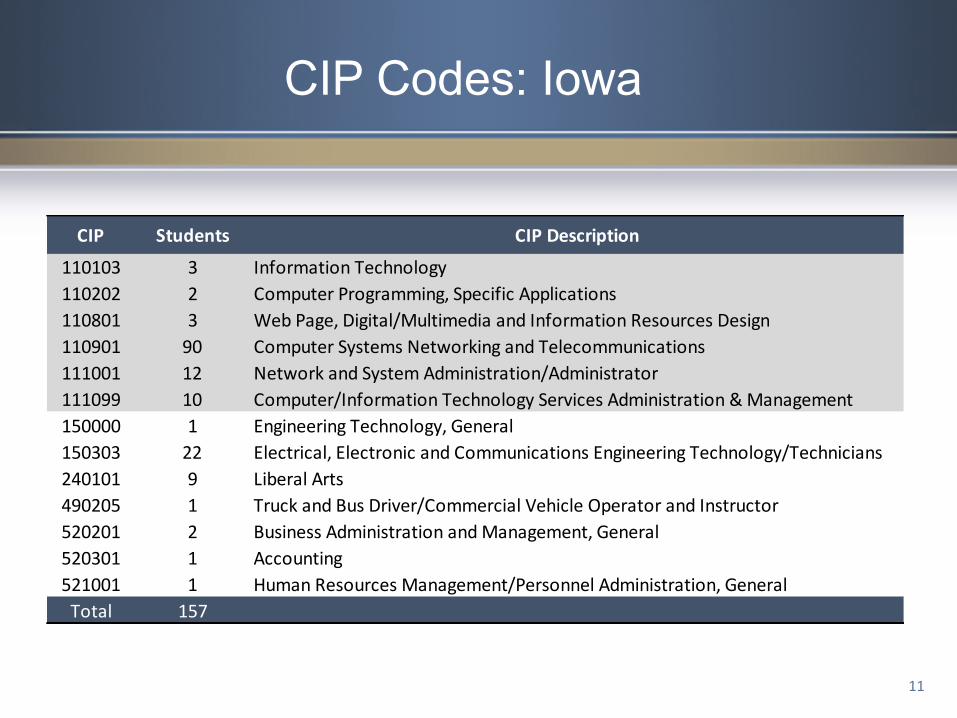
CIP Codes: Iowa
CIP Students CIP Description 110103 3 Information Technology 110202 2 Computer Programming, Specific Applications 110801 3 Web Page, Digital/Multimedia and Information Resources Design 110901 90 Computer Systems Networking and Telecommunications 111001 12 Network and System Administration/Administrator 111099 10 Computer/Information Technology Services Administration & Management 150000 1 Engineering Technology, General 150303 22 Electrical, Electronic and Communications Engineering Technology/Technicians 240101 9 Liberal Arts 490205 1 Truck and Bus Driver/Commercial Vehicle Operator and Instructor 520201 2 Business Administration and Management, General 520301 1 Accounting 521001 1 Human Resources Management/Personnel Administration, General
Total 157
11

Credentials: Illinois
Degree Codes Not Certified
Certified Totals
Associate in Arts (AA) 7 25 32 Associate in Science (AS) 6 36 42 Associate in Applied Science (AAS) 58 254 312 General Associate Degree(AGS, ALS, AGE) 4 5 9 Associate in Arts and Science (A&S) 2 2 Basic Skills 3 7 10 Occupational Certificate of 30 Semester (or 45 Quarter) Hours or More
1 41 42
Occupational Certificate of Less Than 30 Semester (or 45 Quarter) Hours
152 438 590
Associate in Engineering Science (AES) 2 2 Totals 233 808 1041
12

Employment & Earnings Across States
Employment
Illinois*
Iowa
Certified: 61%, or 496 individuals out of 814employed (3rd quarter after exam) Certified: 72.7%, or 93 out of 128 employed one year after certification, up from 70.3% one year prior
Not Certified: 57%, or 327 outof574 employed Not Certified: 74.1%, or 20out of 27 employed, up from 66.7% one year prior
Iowa
California
Certified: $22,129 (median, adjusted to 2015Q1)
Not Certified: $3,603Not Certified: $4,403
Certified: $22,886 (average for 2012 certified – 41.8% increase over average wage one year before certification)
Earnings
Illinois* Certified: $5,302/quarter (median)
*Employment and earnings data is from an earlier Illinois-CompTIA match conducted in 2012 13

-
Employment & Earnings by Industry: Iowa
Most notable Comp TIA | Certified Pre and Post-Certification Employment by Industry Sector
Industry Sector
Year Before Cert Year After Cert
# Matched Emp. Adj. Median
Wage (to 2015Q1)
# Matched Emp. Adj. Median
Wage (to 2015Q1)
11 $38,757 20 $30,064Educational Services
Retail Trade
Professional, Scientific & Technical Services
Health Care & Social Assistance
Manufacturing
Accommodation & Food Services
Administrative & Support Services
Construction
Public Administration
Wholesale Trade
Arts, Entertainment & Recreation
Finance & Insurance
Information
Other Services
Utilities
Unknown
Management of Companies & Enterprises
Transportation & Warehousing
***** Insufficient data (less than 3)
15
3
7
9
15
*****
$11,962
$9,312
$10,526
$33,726
$6,767
*****
***** *****
7
0
*****
$5,012
-
*****
***** *****
4
6
0
*****
$6,809
$12,919
-
*****
***** *****
3 $7,670
12 $13,587
8 $33,866
7 $44,712
7 $38,843
5 $4,344
5 $18,864
4 $5,845
4 $30,419
4 $1,403
3 $37,024
3 $33,679
3 $10,957
3 $16,141
3 $13,892
0 -
***** *****
***** *****
employment increases: • Educational
Services• Professional,
Scientific &TechnicalServices
Most notable decrease: • Accommodation
& Food Service
14

Common Protocols & Participant Experiences

A Common Protocol
• Establishing data-sharing agreement• Developing minimum match criteria
– First name, last name, birth month/yr., location
• Facilitating the transfer of data• Estimating state bandwidth for completing work• Performing analytics and quality control• Presenting with a common template
16

Certification Data ExchangeProject
Gretchen Koch Executive Director, Workforce Development Strategies
CompTIA’s Creating IT Futures Foundation August 10, 2016
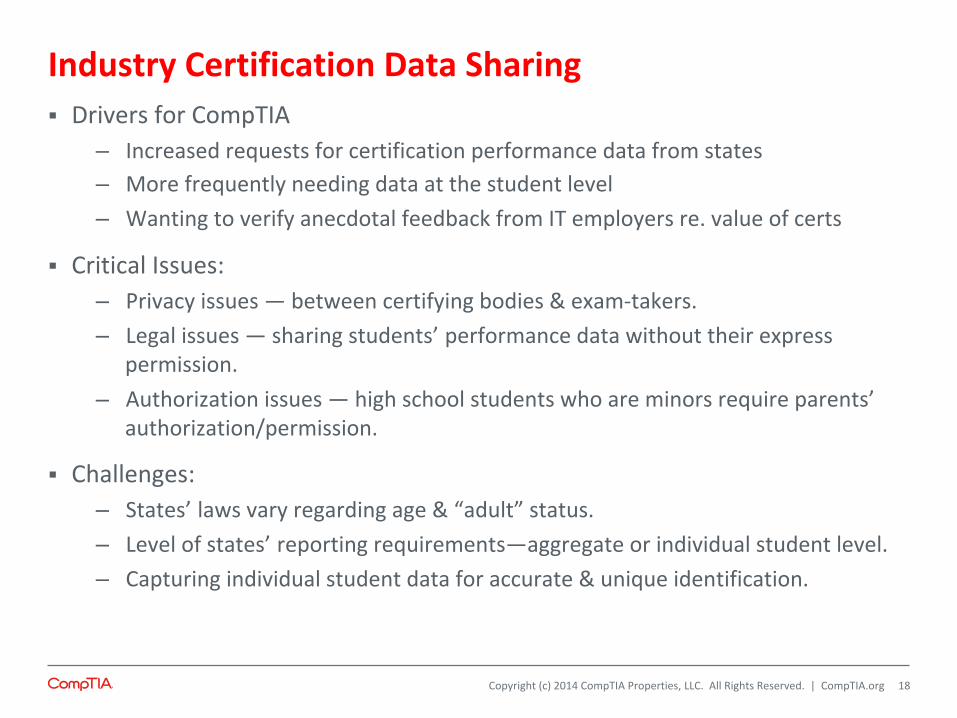
Industry Certification Data Sharing § DriversforCompTIA
– Increasedrequestsforcertificationperformancedatafromstates– Morefrequentlyneedingdataatthestudentlevel– WantingtoverifyanecdotalfeedbackfromITemployersre.valueofcerts
§ CriticalIssues:– Privacyissues—betweencertifyingbodies&exam-takers.– Legalissues—sharingstudents’ performancedatawithouttheirexpress
permission.– Authorizationissues—highschoolstudentswhoareminorsrequireparents’
authorization/permission.
§ Challenges:– States’ lawsvaryregardingage&“adult”status.– Levelofstates’ reportingrequirements—aggregateorindividualstudentlevel.– Capturingindividualstudentdataforaccurate&uniqueidentification.
Copyright(c)2014CompTIAProperties, LLC.AllRightsReserved.|CompTIA.org 18

DataSharingPilot:TacklingtheLegalIssues
§ Previously, CompTIAhadsharedstudentperformancedataonlyattheaggregatelevelwithstates.
§ OriginallyconcernedaboutpotentialissueswithFERPA.
§ ToprotectCompTIAfromprivacyissuesitslegaldepartmentrequiredtheIL CommunityCollegeBoardtosignanIndemnificationAgreementinorderto startapilotproject
§ Begansharing5yearsofstudentleveldatawithILin2011
Copyright(c)2014CompTIAProperties, LLC.AllRightsReserved.|CompTIA.org 19

The CompTIA-State Relationship Development
§ Presented results of CompTIA/IL Data Sharing Project in 2012– Demographic & academic data– Employment & salary data, over time
§ More states wanted to join, but Indemnification Agreement stopped them
§ Upon FERPA clarification CompTIA moved to a Data Sharing Agreement
§ Paved the way for more states and more certifying bodies to join
§ Have shared student performance data with FL, CA, OK, IA, NC, KY and updated data sharing with IL. Still awaiting results from several states.
Copyright (c) 2014 CompTIA Properties, LLC. All Rights Reserved. | CompTIA.org 20

CompTIA’s Ongoing Role
§ Continue providing certification data to new states joining the Project
§ Assist in moving toward a common protocol and Clearinghouseestablishment
§ Participate in Beta Project with the NAM Institute, US Census, NSC, & othercertifyingbodies
Copyright (c) 2014 CompTIA Properties, LLC. All Rights Reserved. | CompTIA.org 21

Illinois Pilot – People, Expertise and Priorities Came Together for a Shared Purpose
• Corporate headquarters is located in Illinois. • Gretchen Koch & Craig Latto – right industry leaders were willing to
reach out, partner & share data in a tightly controlled manner.• Bob Sheets from the Department of Commerce & Community
Affairs facilitated bringing the partners together.• John Haigh & Sharon Miller from OCTAE gently nudged the parties
to collaborate to develop a rigorous process for counting industrycertification in Perkins Accountability Reporting – completion/credential attainment (3S1, 2P1).
• Candy Tempel, Nathan Wilson, Karen Anderson, Jay Brooks &Scott Parke from the Illinois Community College Board set asidetime to advance the project.
• State Directors Mark Williams & Dora Welker and secondarypartners from the Illinois State Board of Education encouragedparticipation.
• Ben Xu from Northern Illinois University Center for GovernmentalStudies helped generate employment & earnings outcomes. 23

Florida Career and Professional Education Act (CAPE)
• 2007 legislation created to improve Florida’stalent pipeline in order to better attract andretain targeted, high-value industries and toadvance Florida’s knowledge-based economy.
• Encourage students to pursue cutting-edgetraining and earn industry certificationsrequired for high-skill, high-wage careers inFlorida’s target and infrastructure industries tohelp diversify the state’s economy.
• Source: Career Source Florida,Florida Department of Education &Florida Statutes
24

Florida Career and Professional Education Act (CAPE)
• Original CAPE legislation focused on secondary students.• In 2013 CAPE expanded to include postsecondary student industry
certifications. • Postsecondary & Secondary certification funding lists are annually agreed
upon. • Florida Statutes provide for a performance award of $1,000 for each industry
certification earned by a workforce education student, if the value of the totalfundable certifications does not exceed the maximum in the performance-based incentive funds appropriation.
• In 2016-17, the totals funds available are $4.5 Million.• certifications appear on postsecondary & secondary fundable lists.
CompTIA A+ CompTIA Network+ CompTIA Server+ CompTIA CDIA+ CompTIA Project+ CompTIA Cloud+ (PS) CompTIA Linux+ CompTIA Security+ CompTIA Storage+ (PS)
• project supporters and collaborators include Randy Hanna, StateDirector Rod Duckworth, Lorrain James, Wendy Sikora, Kathy Scheuch,Andre Smith, Christopher Mullin, Madeline Pumariega & Scott Parke. 25

Win-Win --
• Proof of Concept.– Overcoming legal obstacles.
• Additional information about the characteristics ofboth test takers and those who are certified.– Demographics.– Special populations.– Major program areas.– Employment and earnings.– Statewide and by provider.
• Collaborated to identify strategies for enhancingmatch rates.
26

Win-Win – Community Colleges
• Opportunity to collaborate with a recognized industryleader.
• Joint learning opportunity with a provider of qualityindependent 3rd party assessments of skill attainment.
• Ability to compare characteristics, employment andearnings of test takers and those certified.
• Broad comparative passage rate counts available fornon-community college providers.
• Replication of the project by participating states will allowcommunity colleges to gauge progress over time.
• Matching protocol optimized using available data.• Enhancements to the matching process identified.• Five states successfully participated so far–
CA, FL, IL, IA, OK. 27

Prosperity Through Educa9on
Iowa’s Community College CompTIA Data Matching
Pradeep Kotamraju, Vladimir Bassis, and Paula Nissen Iowa Department of Education

Prosperity Through Educa9on
Basics of CompTIA Project '• Developed methodology for certification and exam data
– Using only name and zip code (all that was available)– Matched to MIS– Matched to National Student Clearinghouse (NSC)– Matched to Unemployment Insurance (UI) records– Analyzed the data
C E R T I F I C A T I O N D A T A E X C H A N G E P R O J E C T 29
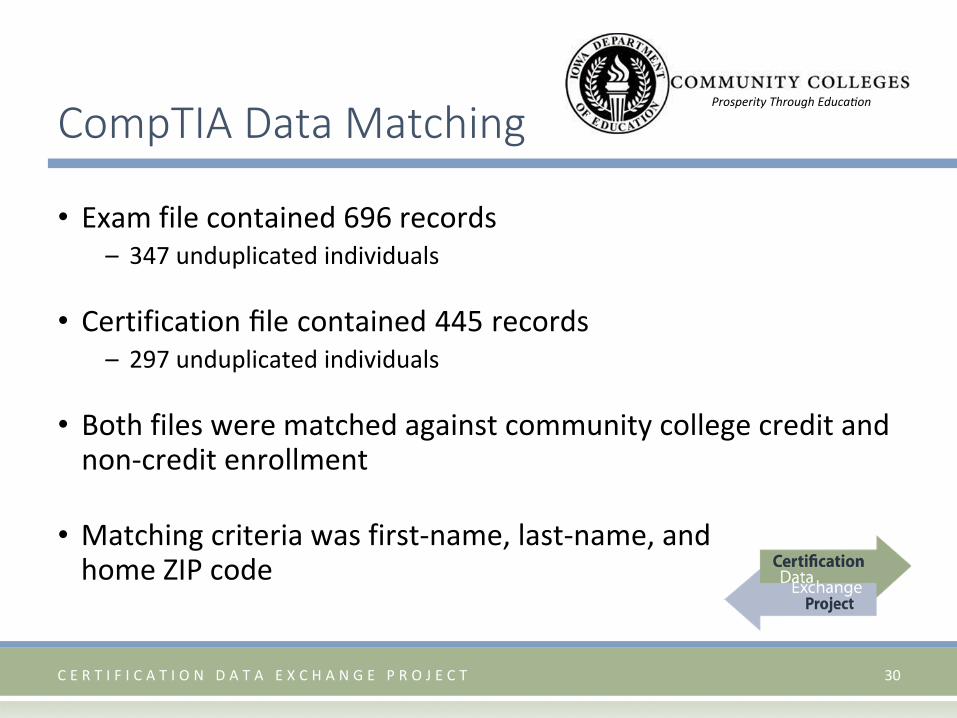
Prosperity Through Educa9on
CompTIA Data Matching
• Exam file contained 696 records– 347 unduplicated individuals
• Certification file contained 445 records– 297 unduplicated individuals
• Both files were matched against community college credit andnon-credit enrollment
• Matching criteria was first-name, last-name, andhome ZIP code
C E R T I F I C A T I O N D A T A E X C H A N G E P R O J E C T 30

Prosperity Through Educa9on
• Analyses Include:– Gender– Age– Race/Ethnicity– Pass versus Fail– Geography of Exams/Examinees– Types of Exams Taken by Iowans– When Exams are Taken (Before, During, After) – Certification/CIP from Community College Courses– Employment, Industry, & Wages by Certification
C E R T I F I C A T I O N D A T A E X C H A N G E P R O J E C T 31

Prosperity Through Educa9on Employment & Wages Those Certified/Not Certified
Comp TIA | Pre- and Post-Certification/Exam Employment and Wages
CompTIA Cert. Status # in Cohort
Year Before Cert/Exam Year After Cert/Exam
# Matched Emp.
% Matched Emp.
Adj. Median Wage
(to 2015Q1)
# Matched Emp.
% Matched Emp.
Adj. Median Wage
(to 2015Q1) Not Certified 27 18 66.7% $5,841 20 74.1% $4,403
Certified 128 90 70.3% $9,262 93 72.7% $22,129
Employmentincrease for both groups, however the mostnotable increase was in the quarterly wages of those who have earned a certificate.
C E R T I F I C A T I O N D A T A E X C H A N G E P R O J E C T 32

Prosperity Through Educa9on
Upcoming Analysis
• Median wage for students taking at least one exam but not passing any certifications
• Median wage for Information Technology students versus nonIT students
• Employment and wages by CIP• Control group compared to CompTIA sample
– Employment– Wages
C E R T I F I C A T I O N D A T A E X C H A N G E P R O J E C T 33

Contact Information Prosperity Through Educa9on
Pradeep Kotamraju 515-281-4716
[email protected] Paula Nissen
(515)281-3550 [email protected]
Vladimir Bassis (515)281-3671
C E R T I F I C A T I O N D A T A E X C H A N G E P R O J E C T 34

Next Steps

Roadmap
1• Raise awareness and gain consensus on need
2• Develop use cases and conduct pilot projects
3• Develop standards and guidelines on data
sharing
4• Establish national data exchange
clearinghouse
36
Improving Reports
• Employer and industry profiles for employmentand earnings of credential holders
• Expanded population coverage (e.g., secondary,noncredit)
• More comprehensive population profiles (e.g.,veterans)
• Improved reporting on timing and combinationsof:– Education credentials and participation– Certifications– Employment and earnings
37

Benefits of a Clearinghouse
• States have different systems, varyingbandwidth and capacity
• A clearinghouse/exchange would provide:– Economies of scale– Improved data quality and consistency– Improved access to related data– More efficient reporting
• Examples: National Student Clearinghouse, Federal Employee Data Exchange System
38

Clearinghouse Options
• Continue existing state-by-stateapproach
• Build multi-state consortium(s)• Create a national organization• Use a central facilitator/match agent
39

How You Can Get Involved
• States• Certifying organizations• Other interested parties
Questions?
40

Learn More
• Project websitewww.acteonline.org/certification_data
• Catherine Imperatore, [email protected]
• Pradeep Kotamraju, Iowa CTE [email protected]
41