Strategic Capital Group Workshop #1: Stock Pitch Composition.
Access to Capital and InvestmentComposition: Evidence from Fracking in
North Dakota∗
Zack Liu† Avishai Schiff‡ Nathan Swem§
March 2019
Abstract
We examine the relationship between access to capital and project choice using datafrom the capital intensive hydraulic fracturing (fracking) industry. The data allow us todistinguish riskier market-expanding projects from investments in proven markets. Wefind that private firms more intensely invest in the former type of projects, while publicfirms tilt their investments towards the latter. Furthermore, we find that exogenousimprovements in financing conditions for private firms mitigates these differences ininvestment patterns. Our results are consistent with anecdotal evidence that privatefirms tend to more aggressively push technological boundaries and suggest that accessto financing contributes to this dynamic.
∗We thank Lee Beckelman, John Butler, Jonathan Cohn, Cesare Fracassi, Billy Grieser, Praveen Kumar,Sheridan Titman, Christopher Tucci (discussant), Adam Winegar, and participants of the 11th AnnualSearle Innovation Economics conference, as well as seminar participants at the Federal Reserve Board, TexasChristian University, and University of Houston for helpful comments and feedback. We also thank NathanKirby and Rhonda Reuther at the North Dakota Department of Mineral Resources for help gathering andinterpreting data. This article represents the views of the authors, and should not be interpreted as reflectingthe views of the Board of Governors of the Federal Reserve System or other members of its staff.†C.T. Bauer College of Business, University of Houston. E-mail: [email protected].‡McCombs School of Business, University of Texas at Austin. E-mail: [email protected].§Board of Governors of the Federal Reserve System. E-mail: [email protected].
Access to Capital and Investment Composition 1
“...and yet the true creator is necessity, who is the mother of our invention.”
-Plato, The Republic
One of the most important questions in finance is how access to financial markets impacts
real investment decisions. In addition to examining how financing affects investment levels,
several theoretical and empirical papers suggest that access to public equity markets facil-
itates investment in riskier and more opaque projects. However, an appealing contrasting
intuition, along the lines of Plato’s proverb quoted above, would imply that a lack of access
to external sources of financing might necessitate, rather than preclude, a more aggressively
exploratory investment mix.
In this paper, we explore the above by investigating how access to capital influences
project choice. We use data from hydraulically fractured (fracked) wells in the North Dakota
portion of the Bakken shale formation to distinguish riskier market-expanding projects from
investments in proven markets. We find that private firms more intensely invest in the
former type of projects, while public firms more aggressively pursue the latter type. This
result is consistent with the stylized fact often attributed to differences in managerial skills
and preferences or to reduced agency frictions at private firms (Holmstrom (1989)). While
we recognize the importance of these traditional determinants, we propose an explanation in
which, to some degree, adverse financing conditions crowd private firms out of more highly
desirable developed markets and force them to invest in riskier less well-established markets.
In our setting, entry into core markets is very costly. Furthermore, since high quality markets
with little uncertainty support economies of scale, public firms can translate access to capital
into cost advantages in those areas. We isolate the effects of access to capital via exogenous
shocks to firm financing and within-firm changes in available capital and find strong support
Access to Capital and Investment Composition 2
for our hypotheses.
The fracking revolution in North Dakota serves as a useful laboratory to examine how
access to capital affects investments in new technologies for several reasons. First, the
widespread adoption of fracking represents a highly disruptive technological advancement,
as discussed in Blackwill and O’Sullivan (2014). Second, each of the over 11,000 fracked
wells in our sample represents an investment of at least $5 million, and these highly capital
intensive projects require that most firms in our sample depend on external finance.1 Third,
crude oil is a homogeneous commodity so competition on quality or price should not impact
project choice. Finally, as we detail below, historical mineral rights of firms and geographical
variation in shale quality provide exogenous heterogeneity in firm’s financial conditions and
project risks which helps us isolate the effects of firm financing on investment choice.
Our hand-parsed dataset of oil well surveys, permit filings, and production and engi-
neering reports from the North Dakota Industrial Commission (NDIC) allows us to observe
detailed characteristics at the project level. Crucially, we use the geographic coordinates of
each well head to distinguish between riskier frontier wells, in which firms apply fracking
techniques for the first time in new areas, and wells drilled in areas of known quality and with
standardized fracking procedures. These data allows us to quantify the proportion of invest-
ments made by both public and private firms in the more exploratory and risky projects.
Using these project level characteristics, we compare the mix of investments made by public
and private firms in the cross-section and we examine how firms adjust their investment mix
in response to exogenous shocks to asset base values in the time series.
We first examine whether private firms tilt a greater share of investment towards fracking
wells in new areas than do public firms. We define a frontier well as the first well in
1Fracking across the United States during out sample period comprises one of the largest investmentbooms in modern history.
Access to Capital and Investment Composition 3
a previously unfracked oil field. Frontier wells have higher variation in initial crude oil
production, and less follow-on activity relative to wells fracked in more established areas.
These results corroborate prior studies suggesting that fracking in new areas entails large
risks and results in material information spillovers.2 Our pooled regressions indicate that
private firms’ frontier share (the share of each firm’s wells identified as frontier, within
each quarter) is 4.2-8.6 percentage points higher than for public firms, which represents an
economically significant difference versus the public firm average of 6.1%. We design our
tests to control for two additional differences between public and private firm investments
in our sample: 1) the fact that private companies in our sample frack fewer wells on average
relative to public companies, and 2) the fact that private companies frack a greater share of
wells earlier in the time series when more frontier drilling is more prevalent.
We next present two analyses in which we isolate and quantify the extent to which finan-
cial frictions contribute to the dynamics we discuss above, and rule-out other explanations.
First, we exploit quasi-random variation in the values of assets held by firms prior to the
fracking boom. We use non-fracked wells drilled before the widespread adoption of fracking
in North Dakota to proxy for the locations of legacy mineral rights leases. Since the mineral
rights (legacy leases) for these wells were secured prior to the large-scale use of fracking, we
assume that the firms who hold legacy leases in areas where shale drilling becomes prevalent
experience a positive shock to the value of their proven reserves (i.e. their borrowing base)
after the onset of the fracking boom. We show that each favorable legacy lease held by a
private firm leads to a reduction in frontier activity of of 0.25 percentage points, or about 5
percent of the average difference in frontier shares between public and private firms. More-
2Variation in subterranean rock characteristics across shale formations, such as North Dakota’s Bakken,gives rise to risks resulting from variation in fracking efficacy, as discussed in Baihly et al. (2012), Jabbari,Zeng et al. (2012), and Saputelli et al. (2014). See also Gilje (2016) for a discussion on exploratory vs.development drilling.
Access to Capital and Investment Composition 4
over, we show this windfall effect is much stronger for private firms than for public firms,
which suggests that the financing channel is an important determinant of the differences in
investment mix that we document above. We also verify that the effect of legacy leases on
frontier activity cannot be explained by other factors linked to post-boom behavior, such as
firm size, the ability to identify high-quality frontier assets, or capacity constraints.
To further confirm that access to financing drives differences in project choice, we examine
within-firm changes in investment mix in response to variation in recent oil production, from
recently drilled wells. For these tests we assume that private firms are especially dependent
on internal cash flows generated by oil producing wells and collateralized loans against proven
oil reserves to fund new projects Azar (2017). We proxy for available capital by aggregating
the value of the oil production from each firm’s fracked wells over the most recent 3 years. We
find that in response to a $1 million change in available capital, private firms reduce their
investment mix tilt towards frontier areas by 1.1-1.5 percentage points, or 7-10% relative
to the private firm average. Consistent with the legacy lease endowment effect, we find
the sensitivity of investment choice to recent production is stronger for private than for
public firms. We argue that these findings show how private firms rely on reserves collateral
for financing to a much higher degree than do public firms, and that these differences in
access to external financing have significant implications for project choice. Also, our within-
firm regression specifications suggest differences in investment patterns between public and
private firms are not purely the result of time-invariant firm characteristics that affect both
investment and listing choice.
Finally, we present evidence that greater access to capital provides public firms an addi-
tional advantage via economies of scale in developed areas. Specifically, we show that public
companies, and better financed private firms, tilt investment towards pads, which are large-
Access to Capital and Investment Composition 5
scale projects in which firms drill and frack multiple wells in rapid succession in very close
proximity. Since pad drilling can yield material cost savings of hundreds of thousands of
dollars per well, the emphasis on scale-improving pad wells is a major benefit for operating
in established markets with lower productivity uncertainty. Furthermore, the economics of
these projects helps account for the disparity in the levels of investment between private and
public firms.3
Our paper relates to the literature examining firm financing and investment such as
Fazzari, Hubbard, and Petersen (1988), and to more recent papers comparing how public
and private companies invest. For example, Sheen (2016), finds that private petrochemical
firms invest differently, and more efficiently, than public firms. In addition, Asker, Farre-
Mensa, and Ljungqvist (2014) finds that public firms investments are less responsive to
changes in investment opportunities than private firms. In addition, Almeida et al. (2017)
finds that less financial slack mitigates agency frictions and leads to more efficient generation
of innovation (although they consider only public firms). Our findings affirm that private
firms invest differently than do public firms, and that lack of access to financing can foster
more a more innovative investment mix. However, we focus on differential access to finance
rather than agency frictions in explaining our results.
Other closely related papers include Gilje and Taillard (2017) and Gilje (2016). Gilje and
Taillard (2017) use natural gas wells to demonstrate that access to capital allows public firms
to respond more quickly to new investment opportunities. Their results are consistent with
our finding that public firms invest more heavily in larger scale-building projects. However,
we focus more on how firm financing relates to investment composition, rather than how
firms respond to opportunities in overall investment levels. Moreover, we exploit shocks
3Public companies drill and frack over 80% of the wells in our sample. See the following Energy Informa-tion Agency article for information on cost savings from pad drilling: https://tinyurl.com/y9q2t638.
Access to Capital and Investment Composition 6
to firm financing, not investment opportunities, and focus the exploratory investments of
private firms. In addition, Gilje (2016) uses data on public oil firms to show that financially
distressed firms engage in less risk shifting. While the measure of risky drilling used in
Gilje (2016) is similar in spirit to ours, our analysis centers around the effects of financial
constraints rather than distress.
Finally, our paper also relates to the literature examining R&D and patents to compare
how public and private firms innovate as surveyed by Hall and Lerner (2010) and Kerr and
Nanda (2015). For example, Acharya and Xu (2017) finds that public firms in external
finance dependent industries spend more on R&D and generate better patents than private
firms. In contrast, Bernstein (2015) shows that the quality of internal innovation declines
following IPOs, but that public firms acquire external innovation. Rather than use patents
or R&D, we characterize the tilt of each company’s investment mix towards more speculative
projects.4 Nonetheless, our findings are somewhat supportive of Bernstein (2015) in that we
find private companies more aggressively speculate with their investment tilt.
1. The Fracking Boom in North Dakota
The fracking revolution in North Dakota, and the widespread adoption and implementation
of fracking generally, represents a highly disruptive technological advancement, as discussed
in Blackwill and O’Sullivan (2014). Energy firms in North Dakota first began adapting
fracking to oil drilling in the early/mid-2000’s, as we show in Appendix Figure A1. Healy
(2012) succinctly defines fracking as follows:
Hydraulic fracturing, or ‘fracking’, is a method used by drilling engineers to stim-
4We do not examine R&D or patents as R&D expenses are minimal for energy firms, and patents arerarely used to protect innovations in the energy industry, as shown in Cohen, Nelson, and Walsh (2000).
Access to Capital and Investment Composition 7
ulate or improve fluid flow from rocks in the subsurface. In brief, the technique
involves pumping a water-rich fluid into a borehole until the fluid pressure at
depth causes the rock to fracture. The pumped fluid contains small particles
known as proppant (often quartz-rich sand) which serve to prop open the frac-
tures.
Engineers performed the first frack in Kansas in 1949, as discussed in Montgomery, Smith
et al. (2010). While initially used to stimulate the production of natural gas, fracking has
been subsequently adapted for crude oil production. In this paper, we study the adoption of
fracking in crude oil production because there exists detailed well-level data for oil wells and
because the market for crude oil is very large and global in scale. By contrast, natural gas
is far harder than crude oil to transport, and is less widely used. Private firms were the first
to frack in North Dakota, and anecdotal evidence suggests that they are also more likely to
push the boundaries of the technology. The first frack to occur in our data was executed by
a private company called Headington in October of 2004.5 That first frack involved pumping
proppant into a well reaching more than three miles below the surface, and extending more
than one mile horizontally. Private companies were the initial leaders in pioneering fracking
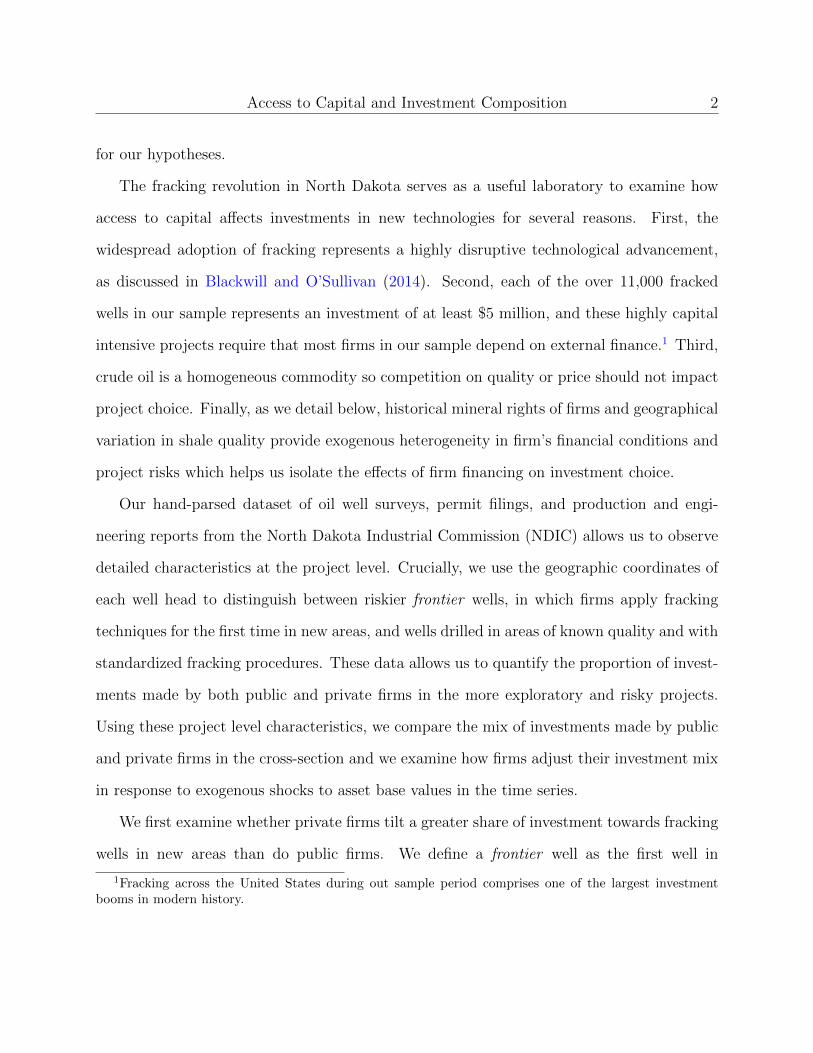
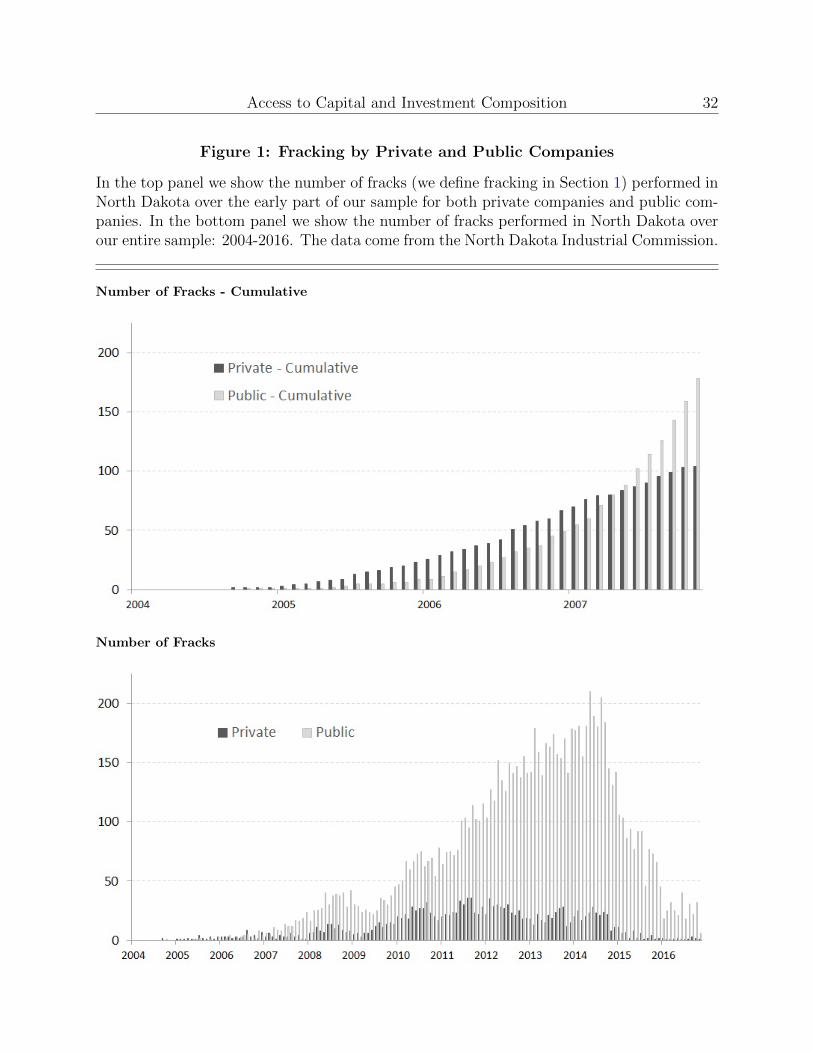
during the first years, as we show in the top panel of Figure 1. Beginning around 2006
public companies dramatically increased fracking activity relative to private companies, but
private firms remained focused on expanding the geographical frontier of the Bakken shale
formation throughout the time-series of our sample, as we show in more detail below. The
exploration of the frontier areas by private operators has been recognized by the trade press,
such as Platt’s (see for example: https://tinyurl.com/y9etso2d). For example, Justin
5Headington sold its North Dakota assets to XTO Energy (a public company) in 2008, and XTO wassubsequently acquired by Exxon in 2010.
Access to Capital and Investment Composition 8
Kringstad, the director of the North Dakota Pipeline Authority, notes the role that small
and private firms play in exploring new regions:
“What we would’ve considered a fringe area a year ago are now considered eco-
nomic territory in the state of North Dakota.” ... Relatively smaller operators,
either unable or unwilling to acquire so-called Tier 1 acreage in the core of the
core, are looking at less costly Tier 2 and even Tier 3 areas and considering
adding rigs on the outskirts of the Bakken’s most prolific plays.
Fracking oil wells in North Dakota involves significant costs. First, fleets of specialized
pumping trucks pump over 150,000 barrels of frack fluids into wells at pressures exceeding
9,000 pounds per square inch (psi). These materials and equipment must be purchased or
rented. In addition, in order to be fracked, wells must be drilled deep enough to reach the
Bakken shale rock formation which is generally at least two miles below ground. Finally,
fracked wells must also extend horizontally, within the cross-section of the shale, for another
one or two miles. Drilling deeply, and then turning horizontally, requires highly technical
directional drilling equipment. These factors can double or triple the cost of a fracked well
relative to that of a non-fracked well. However, as we show in Appendix Figure A2, fracked
wells produce oil at far higher rates than non-fracked wells on average, which generally
justifies these costs.
The gains in oil production, relative to the added costs, resulted in a boom in oil fracking
investment primarily in shale formations below North Dakota and Texas starting in 2008.
According to the U.S. Energy Information Agency (EIA), drilling fracking and leasing costs
in North Dakota average between $7-10 million per well.6 Our sample consists of 11,254 wells,
which implies an aggregate capital investment of more than $80 billion, the bulk of which
6See the EIA’s “Trends in U.S. Oil and Natural Gas Upstream Costs”: https://tinyurl.com/zh4kdvx.
Access to Capital and Investment Composition 9
occurs between 2010 and 2015. This does not capture investments in pipelines, processing
plants, terminals, and other infrastructure necessary for getting the oil from North Dakota
to refineries in the U.S. Mid-Continent and Gulf Coast regions. EIA data indicates that
fracking activity in Texas is roughly three-fold higher than in North Dakota, which suggests
that the overall fracking boom rivaled (or possibly exceeded) the telecom boom of the late
1990’s in terms of aggregate dollars invested, according to Doms (2004).
The drilling and fracking boom in North Dakota over the past decade, compounded by
increases in oil production per well, contributed to dramatic increases in crude oil production
in North Dakota and in the U.S., which we show in Appendix Figure A3. Between 2000-2016,
which includes the years spanned by our sample, North Dakota’s aggregate oil production
grew more than 10-fold: from less than 100,000 barrels per day to over 1 million barrels per
day. During this time North Dakota went from accounting for from less than 1% of total U.S.
crude oil production to over 12%. Currently, North Dakota is the second largest oil producing
state (behind Texas). According to the EIA, oil flowing from fracked wells accounts for over
half of aggregate U.S. production as of 2016, and accounted for the entirety of the crude oil
production growth over the past decade.7
The recent growth in U.S. crude oil production has disrupted import/export dynamics and
lowered global energy prices. Between 2008-2016 total U.S. crude oil imports fell 20%, and
U.S. imports from OPEC countries fell 40%. These declines are remarkable considering that
U.S. GDP expanded by 24% over the same period (according to the World Bank). Crude oil
prices in recent years are dramatically lower than in the years prior to the 2010-2015 fracking
boom. Outside of the U.S. many sources of energy, such as liquefied natural gas (LNG), are
indexed to crude oil prices. Therefore, fracking in the U.S. has contributed to lower energy
7See the EIA’s “Today In Energy” on March 15th, 2016: https://tinyurl.com/y9fdb4no.

Access to Capital and Investment Composition 10
prices throughout the world. These developments have significant implications for the global
economy and global geopolitics, as discussed in Blackwill and O’Sullivan (2014).
2. Data
2.1. Well-level Characteristics
We assemble data for 11,254 unique oil wells from the North Dakota Industrial Commis-
sion (NDIC) for our analysis, which is similar to the data used in Covert (2015). Each of the
wells in our sample is an oil well, which is drilled into the Bakken shale formation, and is
completed using hydraulic fracturing (fracking). We define individual wells using subscript
i, define the firm which drills and fracks each wells using j, define the quarter in which the
construction of the fracked wells begins using t, and define the geographic area of the surface
of each the fracked well using g.
Our sample of wells is drilled and fracked by 94 unique energy firms. We hand match firm
names from the NDIC data to energy firm names from The Center for Research in Security
Prices (CRSP) to define which firms are publicly traded and which firms are privately held.
We research each of the 94 companies to ensure we capture names in the NDIC data which
relate to operating subsidiaries of public companies. We define privatej to be firms not
matched to CRSP. In the sample, we identify 32 public and 57 private firms and, as we show
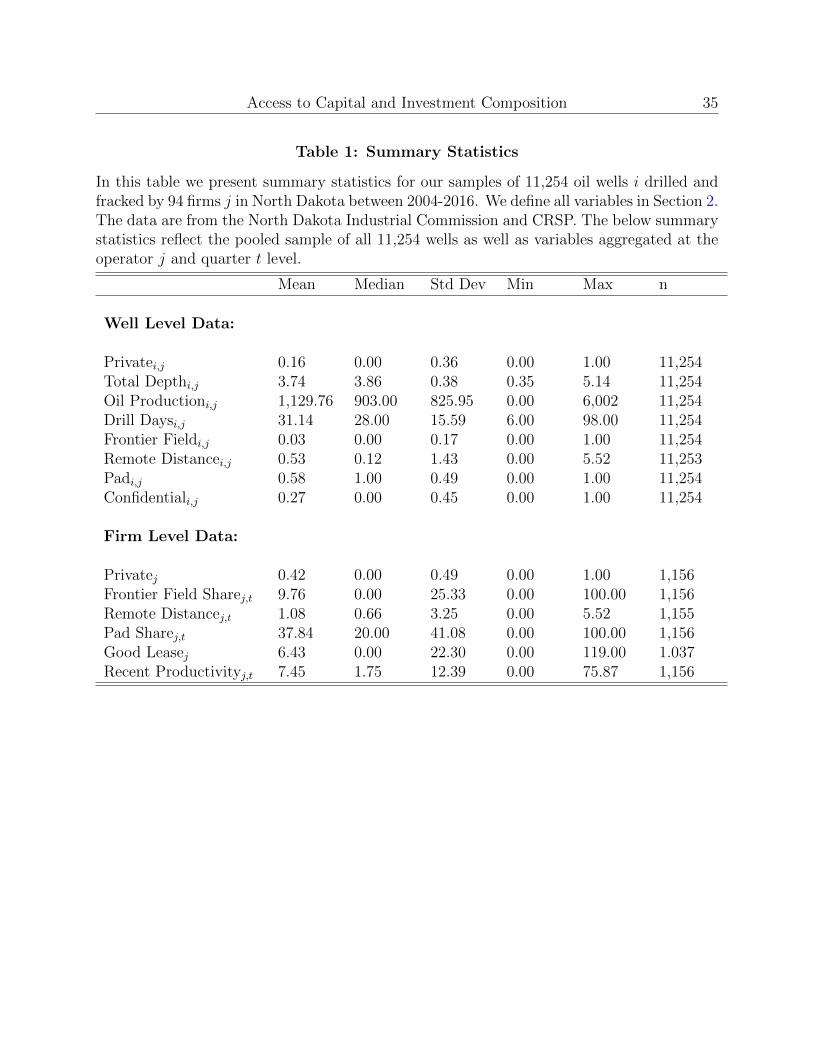
in Table 1, 16% of the wells in our sample were drilled and fracked by private companies.
Our data include a rich set of characteristics for each fracked well. First, we measure
productivity as Oil Productioni,j, which is the number of barrels of crude oil from well i
over the first 24-hours that the well produces.8 Second, we know the total depth of each
8Fracking is especially effective in increasing a well’s initial production, as discussed in the EIA’s “Initialproduction rates in tight oil formations continue to rise”: https://tinyurl.com/yatk5ed8.

Access to Capital and Investment Composition 11
well (Total Depthi,j), the total distance that each well extends laterally (HDepthi,j), and
the vertical depth (V Depthi,j), which we calculate as: Total Depthi,j −HDepthi,j.9 Third,
we tally the number of well bores which connect to each wellhead (Lateralsi,j). Finally, we
also observe the number number of days that the drilling rig is on site to drill each well
(Drill Daysi,j). As we show in Table 1: our average fracked well is 3.74 miles deep, requires
31 rig-days to drill, and produces 1,130 barrels of oil on the well’s first day.
The NDIC requires detailed plans describing the drilling and fracking techniques for each
well be filed and made public. This information, as shown in Covert (2015), can be a source of
learning for competitors. However, the NDIC allows firms to request confidential treatment,
which embargoes the well data for a 6-month period. After this period, the data is revealed
to the public, and we can observe if the well data was protected by confidential treatment
(Confidentialj). This information embargo would dampen information spillovers to com-
petitors such as which areas are productive new processes are most effective.10 Roughly 27%
of all wells in our sample involve confidential treatment, and we use this data to examine
competitive dynamics and information signaling.
2.2. Fracking Wells in Frontier Areas
We use the geographic location of each fracked well’s wellhead to define several vari-
ables which classify whether the well is drilled in a new or developed area. This is the
primary way we characterize a firm’s investment composition. We define the binary variable
Frontier F ieldi,j which indicates the first fracked well in a given oil field (oil fields are de-
fined by the NDIC). We show an example oil field called Twin Valley which is outlined in
red in Appendix Figure A4. Twin Valley covers an 8-square miles area, as indicated by the
9the EIA’s “Trends in U.S. Oil and Natural Gas Upstream Costs”: https://tinyurl.com/zh4kdvx indi-cates that costs are positively correlated with each fracked well’s depth.
10This effect is discussed in trade press, such as: https://tinyurl.com/ybxbu5rf.
Access to Capital and Investment Composition 12
black square-mile grid-squares, and the wellheads of the various fracked wells appear as black
dots. In Appendix Figure A5 we show new Frontier F ieldi,j fracks (red dots) relative to
previously fracked wells (black dots) and new wells fracked in established areas (blue dots),
that occur during 2006, 2008, 2010, and 2012. These maps show how rapidly firms develop
and drill the Bakken shale, and how the frontier shifts outwards as previously developed
areas become crowded.
We also use our geographic data to define well remoteness directly: RemoteDistancei,j
is the distance (in miles) of each fracked well i to the nearest fracked well that exists in the
data prior to when construction of well i was at time t. As we show in Table 1: on average,
when a well is fracked, it is 0.57 miles from the nearest existing fracked well. In addition,
over the course of the sample, 3% of wells are drilled in frontier oil fields.
Fracking previously unexplored and more remote areas presents significant technical chal-
lenges, and firms applying fracking techniques in new areas face a higher degree of risk. Even
for wells drilled into the same shale formation, sub-surface geologic characteristics can vary
dramatically from area to area. As such, successfully fracking new locations is more complex
and risky than repeatedly fracking in a more well-known area. We present several analyses
to illustrate this fact. First, we present a variance decomposition of Oil Productioni,j for
our sample of fracked wells in Appendix Table A2, which shows that geography accounts for
an outsized share of the overall variation in well productivity.
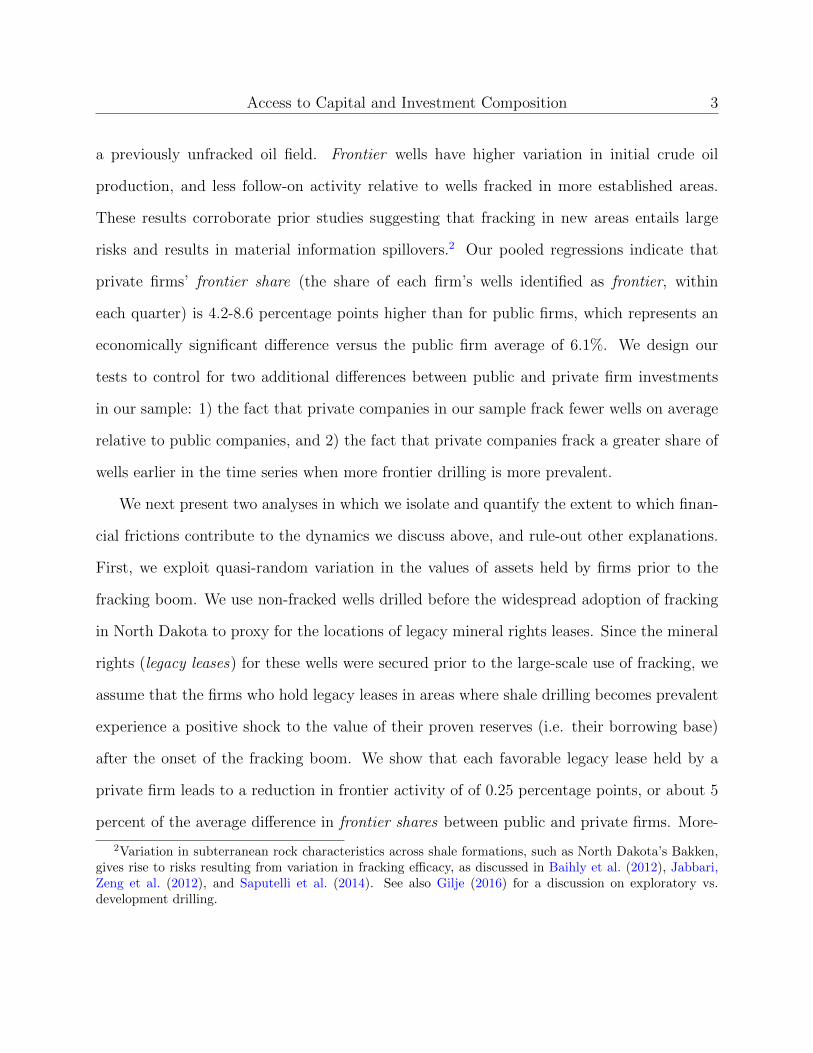
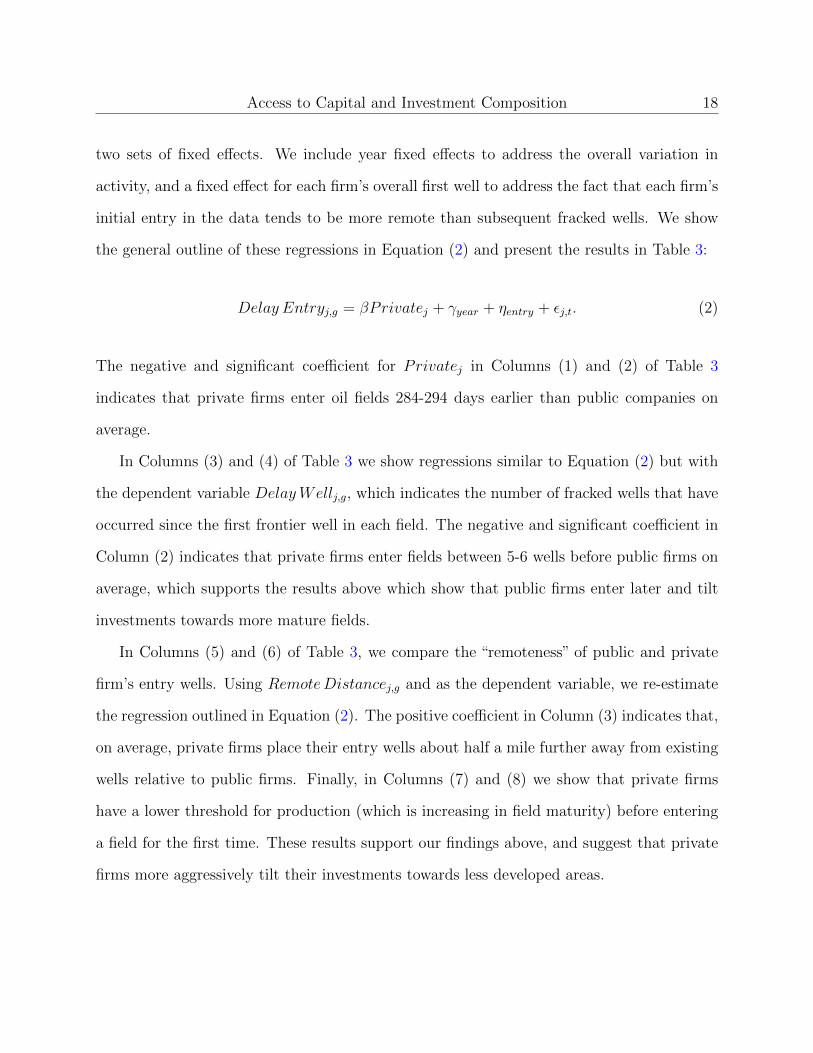
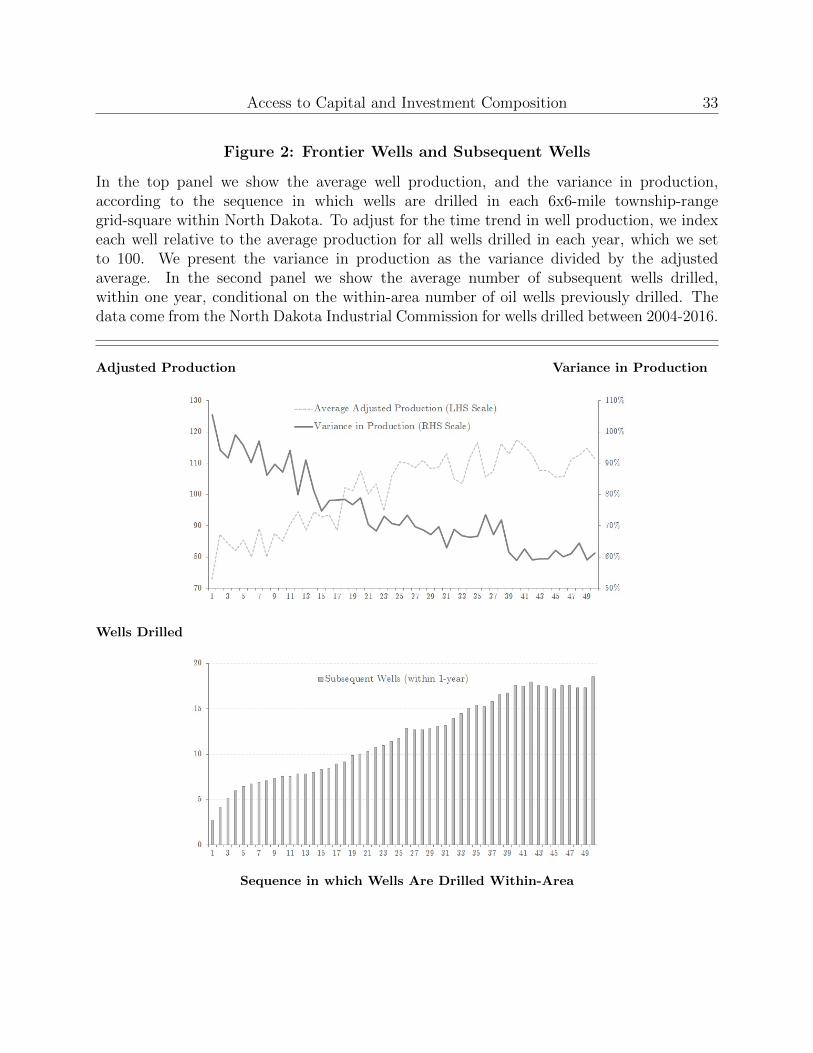
Second, we illustrate the particularly high-risk nature of more remote frontier-expanding
wells in Figure 2. In the first panel, we show that the initial production from wells drilled
in new fields is 28% below the cross-sectional average, and these new wells also have a very
high degree in variation of their initial production. As subsequent wells are drilled and
fracked, production increases and the variation in production decreases. We attribute these

Access to Capital and Investment Composition 13
improvements to knowledge gains and process improvements as energy firms adapt fracking
technology to the geographic-specific challenges presented by each new area (see also Covert
(2015)).
In the second panel of Figure 2 we show the average number of subsequent wells, drilled
and fracked in the same field within one year, conditional on the sequence of wells previously
drilled in each field. In many fields, no subsequent wells will ever be drilled after the first,
exploratory, well. However, for fields in which second, third, fourth etc. wells are drilled the
likelihood that fifth, sixth, etc. even a fiftieth well will be drilled increases. The probability
of subsequent wells is lowest for the first well in a field, which represents an additional aspect
of risk for wells drilled in previously unexplored areas. Given the risks of experimenting with
these new technologies to unknown rocks for the first time, and the information externalities
that pioneering companies provide to the rest of the industry, we consider fracking in new
fields our primary measure of exploratory investment.
In our regression specifications, we aggregate the frontier and remoteness measures at the
firm-quarter level to facilitate comparison between firms. We define Frontier F ield Sharej,t
as the number of Frontier F ield fracked wells that firm j fracks during quarter t divided
by the total number of fracked wells that firm j fracks during that quarter. As we show in
Table 1 on average Frontier F ieldi fracks represent 10% of firm’s overall fracked well mix,
which exceeds the share of overall wells drilled (3%) by over three-fold. This reflects the fact
that Frontier F ield Sharej,t averages across companies/quarters, and reflects a skew driven
by a greater number of smaller companies tilting their fracks towards frontier areas, as we
discuss in more detail in Section 3.1 below.
Finally, we define two variables which describe the order and timing in which firm’s drill
and frack wells within each oil field, g. These variables help us examine whether public firm
Access to Capital and Investment Composition 14
entry into new fields lags those of private firms. We define Delay T imej,g as the difference
between firm j’s first fracked well in oil field g (its entry well) and the date of the oil field’s
Frontier F ieldg fracked well. Similarly, we define DelayWellj,g as the number of wells that
had been drilled in oil field g prior to firm j’s entry well.
2.3. Pad Drilled Wells
The second type of investment we can identify in our sample are wells drilled on the same
pad. Prior to the widespread adoption of fracking, energy firms would generally drill wells
that were widely spaced geographically which would require that the firm disassemble move
reassemble the drilling rig for each well. Fracking allows for wells to be drilled much closer
together, and pioneering firms began to use one rig to drill multiple wells from a single surface
location – pad drilling. This saves time and money, and is less environmentally disruptive.11
Pad drilling cannot be directly observed in the data, but we infer pad drilling patterns
following industry standards (e.g. https://tinyurl.com/yaj6epts) and identify pad wells
as any cluster of wells that is drilled sequentially by the same firm-rig pair and within 0.1
miles. Our primary measure of pads includes all qualifying clusters of two or more wells
(denoted as Pad).12 We choose this threshold because it generates a time-series of pad
drilling that resembles estimates consistent with the statistics on pad drilling generated by
DrillingInfo, a premier analytics firm for the E&P industry. However, we also ensure our
results are robust to larger cluster size thresholds. The map in Appendix Figure A4 illustrates
several pad wells, which appear as tight clusters of black circles (wellheads) in which several
lines (horizontal wellbores) extend. As we show in Table 1 58% of our sample of fracked
wells are drilled in pads.
11See the EIA’s “Today in Energy” September, 2012 for a discussion of pads: https://tinyurl.com/
yavnbkoc.12We display the time-series of the share of wells denoted as Padi,j in Figure 3.
Access to Capital and Investment Composition 15
Similar to our frontier measures above, we aggregate the above pad well data at the
firm level, and at quarterly frequency, to create proxies for the degree to which the mix of
each firm’s fracked wells tilts towards large pad well projects. We define PadSharej,t as
the number of Padi,j fracked wells that firm j fracks during quarter t divided by the total
number of fracked wells that firm j fracks during quarter t. As we show in Table 1, the
sample average for PadSharej,t of 39% is far lower than the overall share of wells drilled in
pads (58%) reflecting the fact that a greater number of smaller firms drill a lower share of
wells in pads, which we discuss in Section 3.3 below.
2.4. Energy Firm Capital Access
The energy industry is immensely capital intensive, and many firms rely heavily on ex-
ternal financing for their investments (Gilje and Taillard, 2017). Firms typically use their
mineral rights and oil reserves as collateral to secure loan financing. Thus, the quality of a
firm’s mineral rights and the amount of proven reserves largely determine the firm’s available
credit.
In our extended sample, we observe all wells drilled in North Dakota, including non-
fracked wells. Specifically, we observe the universe of legacy - i.e. non-fracked and non-
Bakken - wells that each firm drilled prior to the fracking boom. We classify 2008-on as the
post-boom years, and define the variable GoodLeasej as the number of legacy wells a firm
operates prior to 2008 that are within 1 mile of at least 10 post-boom fracked wells.13 After
the fracking boom, firms with good leases have greater credit access since their mineral rights
are more valuable as collateral. We exploit the distribution of GoodLeasej across private
and public firms as a source of exogenous variation in financing conditions.
Additionally, based on conversations with current and former energy executives, many
13We also use the total number of pre-boom conventional wells as a control and denote it as Legacy Leasej .
Access to Capital and Investment Composition 16
firms, especially private firms, depend on reserve-based lending as an important source of
funds for investing in fracking. Therefore, we proxy for a firm’s collateralizable reserves,
Recent Productivityj,t, using the trailing three-year total number of wells drilled, multiplied
by the average Oil Productioni,j for each well, multiplied by the oil price (1-month NYMEX
future) from the prior quarter. This is a proxy for the value of capital available to the firm
j at quarter t.
3. Results
3.1. Frontier Drilling
In this section we examine how access to external sources of financing relates to a firm’s
propensity to invest in new, risky, frontier-expanding areas. For our first set of tests we
run pooled OLS regressions, with year fixed-effects, as outlined in Equation (1) below. We
include year fixed effects in order to control for time-specific factors, such as the oil price,
which affect firm’s financing conditions, and to adjust for the time-trends in drilling and
fracking activity over the time-series, as we show in Appendix Figure A1 and Figure 1. The
dependent variable in this regression specification is Frontier F ield Sharej,t, which is our
proxy for each firm’s investment tilt towards fracking wells in new areas. We report the
results of running the regression outlined in Equation (1) in Table 2:
Frontier Sharej,t = βPrivatej + γyear + εj,t. (1)
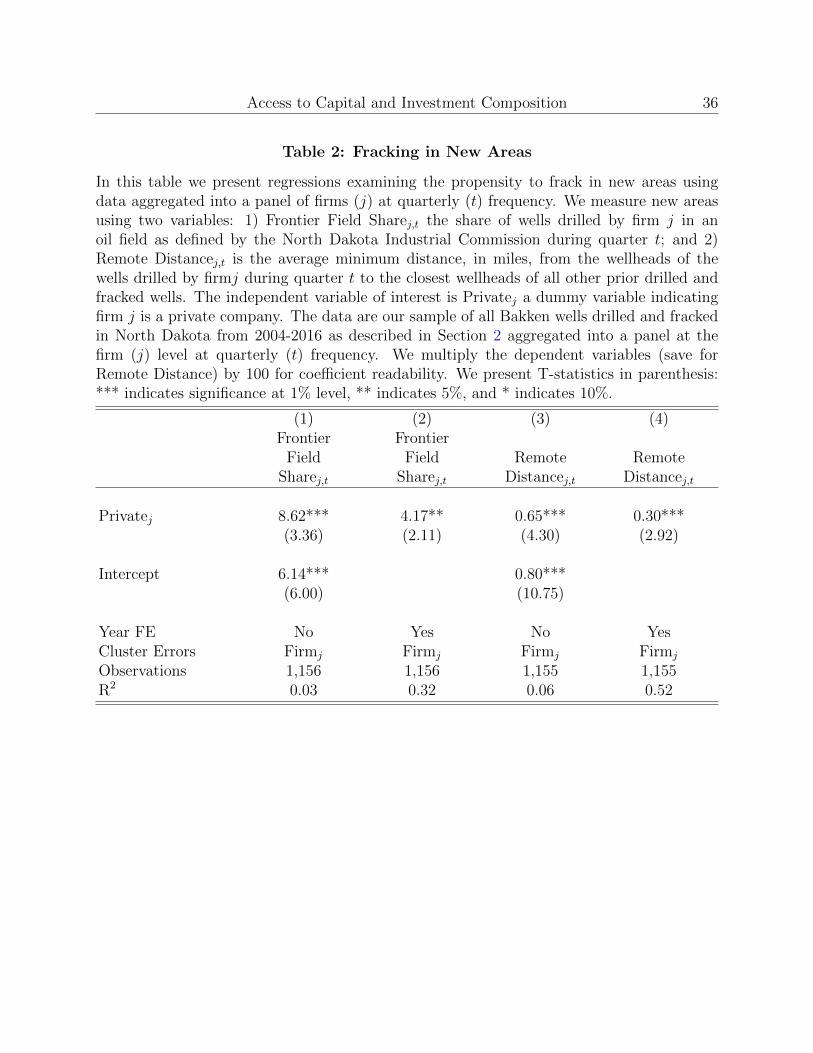
The positive and significant coefficient for Privatej in Columns (1) and (2) of Table 2 indi-
cates that on average private firms share of fracked wells are between 4.17-8.62 percentage-
points higher than for public firms. As we show in Table 1, the unconditional average for
Access to Capital and Investment Composition 17
Frontier F ield Sharej,t is 10%, which indicates that private firms share of fracked wells
is more than 50% higher than for public firms, which we believe reflects an economically
significant difference in investment policies between public and private firms.14
In Columns (3) and (4) of Table 2 we show the results from running the regression
outlined in Equation (1) using RemoteDistancej,t, our alternative proxy for each firm’s
average fracked well remoteness, as the dependent variable. The positive and significant
coefficients for Privatej indicate that on average, wells fracked by private firms are located
between 0.30-0.65 miles further from any other wells relative to wells fracked by public firms.
This represents an economically significant magnitude relative to the sample average for
RemoteDistancej,t of 0.53 miles. These results support those presented above, and suggest
that the mix of investments is quite different between private and public firms.15
The differences in Frontier F ield Sharej,t we show above may arise, in part, due to the
fact that public firms drill many more wells than private firms on average. To ensure that
our findings are not driven by disparities in levels of investments, i.e. the denominator
in Frontier F ield Sharej,t, we also examine the timing of entry into new areas. For this
analysis we use a sub-sample which includes only the first well, drilled and fracked by each
firm j, in each field g. We use variables to measure the time (Delay Entryj,g), sequence
(DelayWellj,g), and distance (RemoteDistancej,g) of each firm j’s entry into field g relative
to the first well in each field. We also use the average Oil Productioni,j in the year preceding
firm j’s entry into field g to further proxy for the field’s maturity. As we show in Figure
2, younger fields tend to be less productive and uncertainty regarding field quality drops
drastically as as more wells are drilled and fracked. For our field entry regressions we include
14We cluster errors by firm (j) throughout to adjust for within-firm correlations in investment patterns.Our results are robust to a myriad of alternative error clustering specifications.
15For additional robustness, we present the result from a regression similar to Equation 1 but for thedis-aggregated sample of 11,254 in Appendix Table A3.
Access to Capital and Investment Composition 18
two sets of fixed effects. We include year fixed effects to address the overall variation in
activity, and a fixed effect for each firm’s overall first well to address the fact that each firm’s
initial entry in the data tends to be more remote than subsequent fracked wells. We show
the general outline of these regressions in Equation (2) and present the results in Table 3:
Delay Entryj,g = βPrivatej + γyear + ηentry + εj,t. (2)
The negative and significant coefficient for Privatej in Columns (1) and (2) of Table 3
indicates that private firms enter oil fields 284-294 days earlier than public companies on
average.
In Columns (3) and (4) of Table 3 we show regressions similar to Equation (2) but with
the dependent variable DelayWellj,g, which indicates the number of fracked wells that have
occurred since the first frontier well in each field. The negative and significant coefficient in
Column (2) indicates that private firms enter fields between 5-6 wells before public firms on
average, which supports the results above which show that public firms enter later and tilt
investments towards more mature fields.
In Columns (5) and (6) of Table 3, we compare the “remoteness” of public and private
firm’s entry wells. Using RemoteDistancej,g and as the dependent variable, we re-estimate
the regression outlined in Equation (2). The positive coefficient in Column (3) indicates that,
on average, private firms place their entry wells about half a mile further away from existing
wells relative to public firms. Finally, in Columns (7) and (8) we show that private firms
have a lower threshold for production (which is increasing in field maturity) before entering
a field for the first time. These results support our findings above, and suggest that private
firms more aggressively tilt their investments towards less developed areas.

Access to Capital and Investment Composition 19
3.2. The Role of Firm Financing
We believe that a significant portion of the differences in the investment mix between
private and public firms is attributable to differences in access to financing. However, we
acknowledge that private and public firms differ across many other pertinent dimensions
that might contribute to the results in Tables 2 and 3. For example, public firms are more
vulnerable to agency frictions (Stein (1989)) which may hamper their ability to engage in
more risky and opaque projects like frontier drilling. Furthermore, it is possible project
selection dictates listing choice and managers who prefer to invest more in frontier projects
choose to remain private for disclosure requirements (Bhattacharya and Ritter (1983), Farre-
Mensa (2017)) or due to the high fixed costs of IPOs (Ritter (1987)).
3.2.1 Legacy Leases and Access to Capital
To isolate the effects of capital access on project choice we exploit quasi-random variation
in“legacy”mineral right leases as an exogenous shock to the ability of firms to access external
financing. We observe the universe of legacy wells, i.e. those which were drilled in shallower
formations above the Bakken prior to the adoption of fracking, that each firm owned prior
to the onset of the fracking boom. We assume that mineral rights attached to legacy wells
were negotiated without consideration of fracking and the economic exploitation of oil from
far deeper and more challenging geological formations such as the Bakken. However, since
legacy wells cover the geographic footprint of the (far deeper) Bakken formation as well, firms
lucky enough to hold legacy leases in the right areas exhibit a sharp, exogenous appreciation
of their asset base in the years following the start of the fracking boom. We argue that this
shock facilitates firm financing both by endowing firms with assets that may otherwise be
prohibitively expensive, and by increasing the value of their collateral base (proven reserves).
Importantly, since private companies are more reliant on loans collateralized by reserves
Access to Capital and Investment Composition 20
(Azar (2017)) than their public counterparts, we hypothesize that good legacy leases should
affect the level and mix of investments more dramatically for privately held firms.
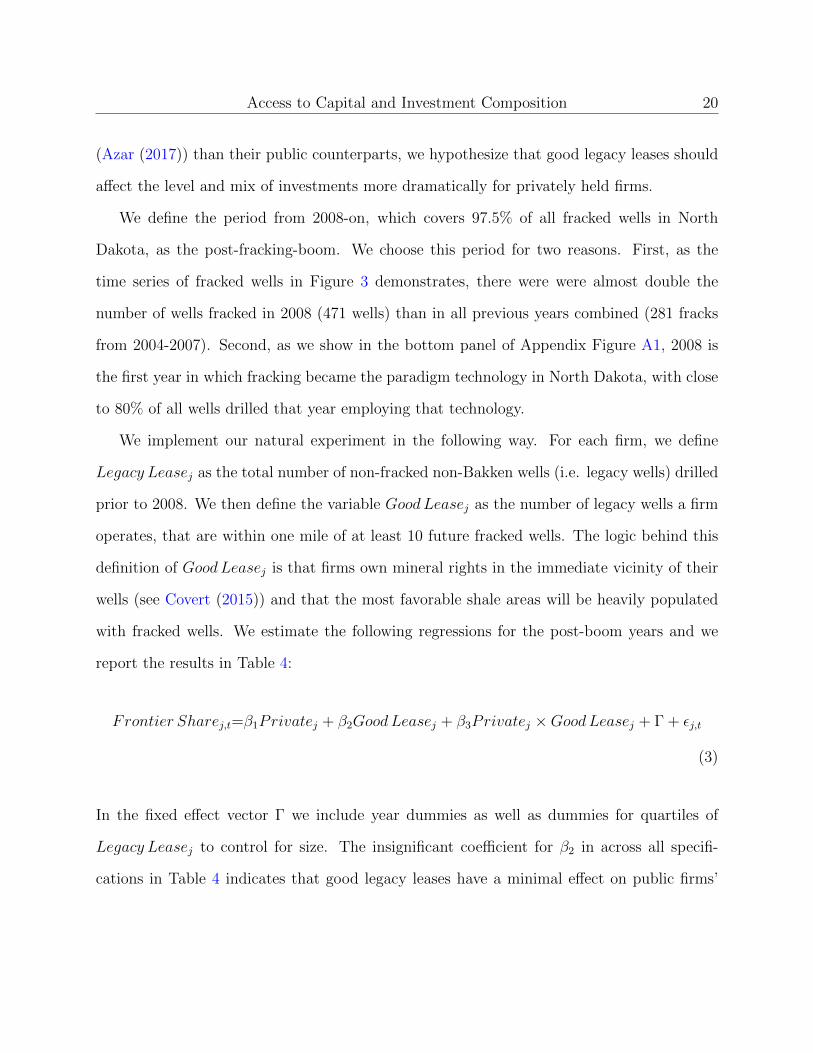
We define the period from 2008-on, which covers 97.5% of all fracked wells in North
Dakota, as the post-fracking-boom. We choose this period for two reasons. First, as the
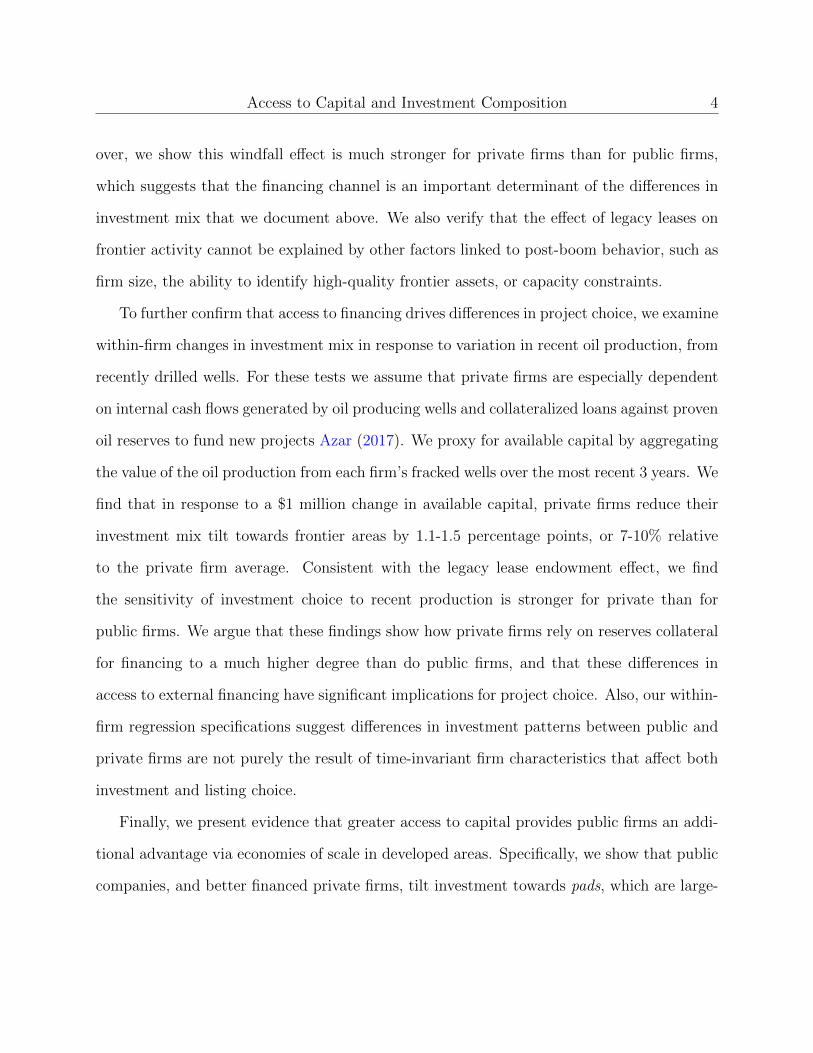
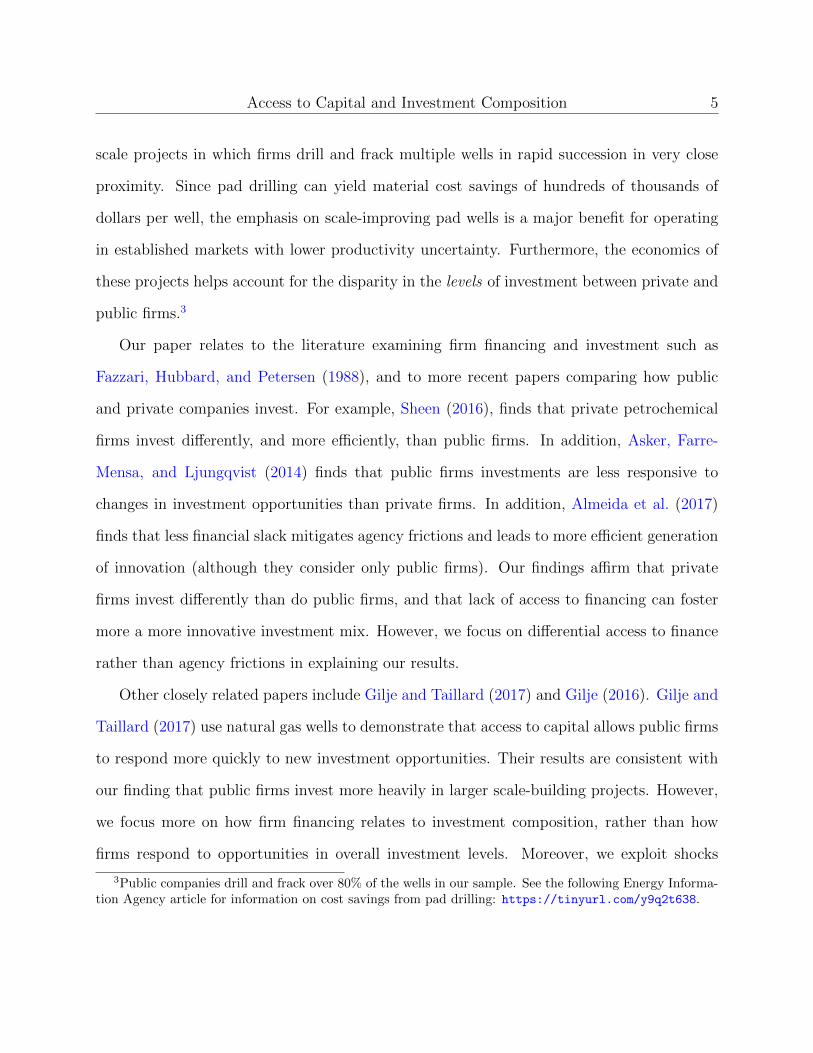
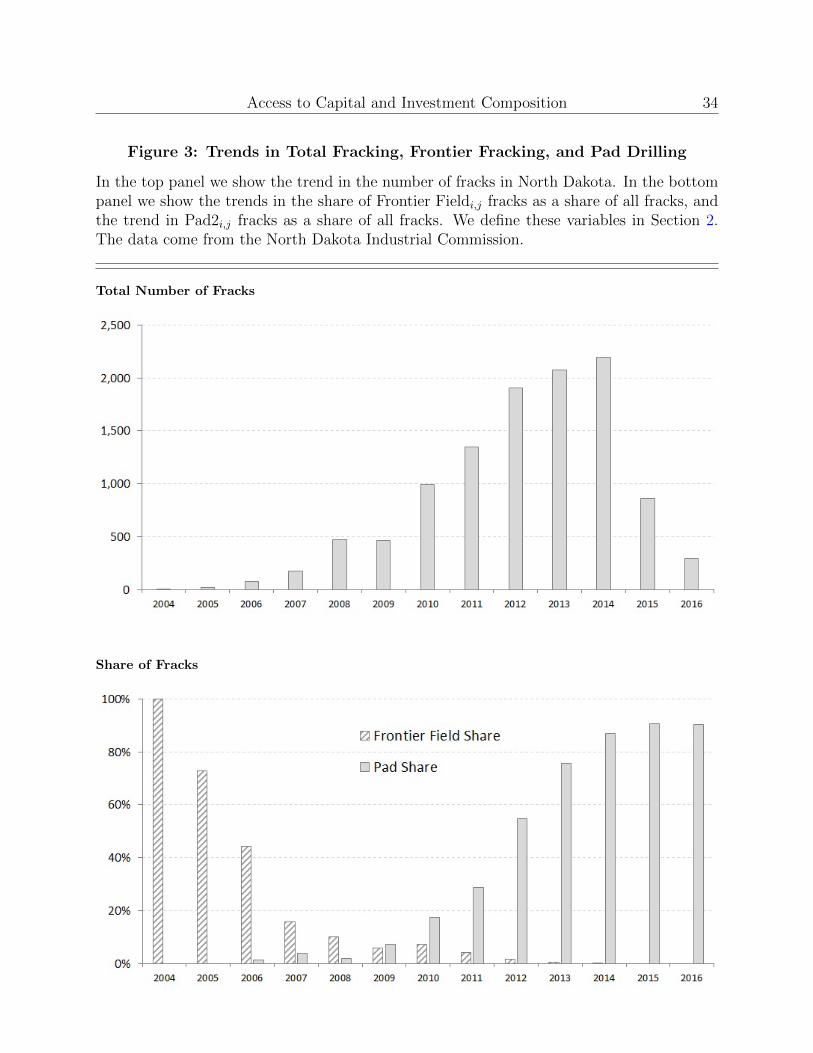
time series of fracked wells in Figure 3 demonstrates, there were were almost double the
number of wells fracked in 2008 (471 wells) than in all previous years combined (281 fracks
from 2004-2007). Second, as we show in the bottom panel of Appendix Figure A1, 2008 is
the first year in which fracking became the paradigm technology in North Dakota, with close
to 80% of all wells drilled that year employing that technology.
We implement our natural experiment in the following way. For each firm, we define
Legacy Leasej as the total number of non-fracked non-Bakken wells (i.e. legacy wells) drilled
prior to 2008. We then define the variable GoodLeasej as the number of legacy wells a firm
operates, that are within one mile of at least 10 future fracked wells. The logic behind this
definition of GoodLeasej is that firms own mineral rights in the immediate vicinity of their
wells (see Covert (2015)) and that the most favorable shale areas will be heavily populated
with fracked wells. We estimate the following regressions for the post-boom years and we
report the results in Table 4:
Frontier Sharej,t=β1Privatej + β2GoodLeasej + β3Privatej ×GoodLeasej + Γ + εj,t
(3)
In the fixed effect vector Γ we include year dummies as well as dummies for quartiles of
Legacy Leasej to control for size. The insignificant coefficient for β2 in across all specifi-
cations in Table 4 indicates that good legacy leases have a minimal effect on public firms’
Access to Capital and Investment Composition 21
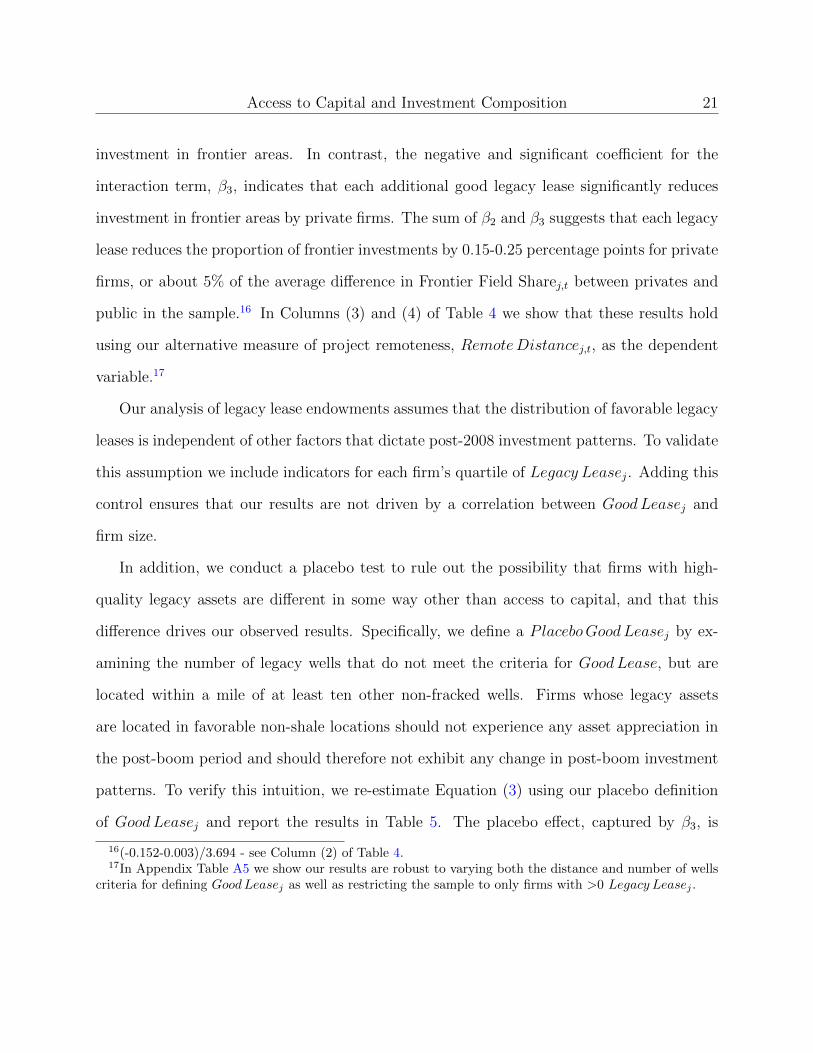
investment in frontier areas. In contrast, the negative and significant coefficient for the
interaction term, β3, indicates that each additional good legacy lease significantly reduces
investment in frontier areas by private firms. The sum of β2 and β3 suggests that each legacy
lease reduces the proportion of frontier investments by 0.15-0.25 percentage points for private
firms, or about 5% of the average difference in Frontier Field Sharej,t between privates and
public in the sample.16 In Columns (3) and (4) of Table 4 we show that these results hold
using our alternative measure of project remoteness, RemoteDistancej,t, as the dependent
variable.17
Our analysis of legacy lease endowments assumes that the distribution of favorable legacy
leases is independent of other factors that dictate post-2008 investment patterns. To validate
this assumption we include indicators for each firm’s quartile of Legacy Leasej. Adding this
control ensures that our results are not driven by a correlation between GoodLeasej and
firm size.
In addition, we conduct a placebo test to rule out the possibility that firms with high-
quality legacy assets are different in some way other than access to capital, and that this
difference drives our observed results. Specifically, we define a PlaceboGoodLeasej by ex-
amining the number of legacy wells that do not meet the criteria for GoodLease, but are
located within a mile of at least ten other non-fracked wells. Firms whose legacy assets
are located in favorable non-shale locations should not experience any asset appreciation in
the post-boom period and should therefore not exhibit any change in post-boom investment
patterns. To verify this intuition, we re-estimate Equation (3) using our placebo definition
of GoodLeasej and report the results in Table 5. The placebo effect, captured by β3, is
16(-0.152-0.003)/3.694 - see Column (2) of Table 4.17In Appendix Table A5 we show our results are robust to varying both the distance and number of wells
criteria for defining GoodLeasej as well as restricting the sample to only firms with >0 Legacy Leasej .
Access to Capital and Investment Composition 22
economically small and for the most part statistically insignificant, suggesting it is not some
unobserved characteristic associated with the ownership of high-quality assets that drives
our results.18
We also attempt to rule out that the GoodLeasej shock affects firm behavior by a mecha-
nism other than improved access to financing. First, we ask whether our results could obtain
due to capacity constraints. If private firms are constrained in the amount of projects they
can pursue at a time, they may choose to prioritize developing their assets in place rather
than pursuing new projects even absent any financial frictions. This dynamic may result in
private firms tilting investment to nearby (i.e. non-Frontier) areas, due to greater capacity
constraints, rather than due to great access to external sources of financing.
To address capacity constraints as a mechanism, we examine whether private firms with
good legacy lease endowments invest differently even in areas not connected with the devel-
opment of the legacy assets. If good legacy leases affect private firm behavior only due to
capacity constraints, we should not find a material effect when examining this sub-sample.
To implement the test, we re-estimate Equation (3) after excluding wells within the vicinity
(i.e. 1 mile) of a firms’ legacy leases from its Frontier F ield Sharej,t calculation. We report
the results in Table 6. We find qualitatively and quantitatively similar results after excluding
all wells connected with the legacy lease. The coefficient on the interaction term remains sta-
tistically significant and is of a similar magnitude to the baseline results in Table 4 across all
specifications. These findings confirm that capacity constraints are not a material concern.
We also assess whether the GoodLeasej results in Table 4 obtains due to differential
levels of expertise in detecting high-quality frontier assets between private and public firms.
18While tiny in magnitude, the interaction term for the RemoteDistancej,t in Table 5 is statisticallysignificant at the 5% level. This result may be due to the fact that ownership of high-quality shale and non-shale legacy assets is somewhat correlated. In untabulated results, including both the genuine and placebodefinitions of GoodLeasej render the placebo effect insignificant.
Access to Capital and Investment Composition 23
If private firms are worse at predicting high output areas compared to public firms, then
those private firms endowed with GoodLeasej assets may stick to drilling in that area not
because of an increase in access to financing but because their likelihood of success elsewhere
is low. Alternatively, private firms may have an advantage in forecasting frontier profitability.
However, if this advantage exists, then increasing financial access should not dampen their
investments in frontier activity.
To test for differential rates of expertise, we look at the probability that a field is more
likely to boom (succeed) or bust (fail) depends on whether it was first fracked by a private
of public firm. We define Boom is an indicator equal to 1 if the number of wells drilled in
this field is in the top quartile compared to other fields drilled in the same year, Bust is
an indicator equal to 1 if the number of wells drilled in this field is in the bottom quartile
compared to other fields drilled in the same year, and Privateg is an indicator equal to 1 if
the field was first fracked by a private firm. We include year fixed effects in order to control
for time-specific factors. Specifically, we run the following regression:
Boom(Bust)g = βPrivateg + γyear + εj,t. (4)
The coefficient for Privateg in Columns (1) and (2) of Table 7 indicates there is no significant
difference between fields first fracked by private firms and those first fracked by public firms
in the propensity to become a booming field. Public fields are slightly, though insignificantly
so, better, which can be explained by public firms having more money to buy better mineral
rights. Furthermore, the coefficient for Privateg in Columns (3) and (4) of Table 7 indicates
there is no significant difference between fields first fracked by private firms and those first
fracked by public firms in the propensity to become a bust. As these (null) results point
Access to Capital and Investment Composition 24
to no material (dis)advantages of private firm in frontier scouting ability, they indicate that
the GoodLeasej results cannot obtain via that channel. Overall, our tests suggest that
GoodLeasej serves as an exogenous shock to private firm financing conditions, and that
private firms endowed with more GoodLeasej assets invest in a manner that more closely
resembles the investment mixes of public firms.
3.2.2 Recent Productivity and Capital Availability
Another way to isolate the effects of capital access on project choice is to look at the
productivity of firm wells. We use the variable Recent Productivityj,t to proxy for a firm’s
available capital, which includes cash generated by selling crude oil and banks loans that
use proved oil reserves as collateral. We run regressions similar to the regression outlined in
Equation (5) in Table 8:
Frontier Sharej,t =β1Privatej + β2Recent Productivityj,t
+ β3Privatej ×Recent Productivityj,t + εj,t.
(5)
The negative and significant coefficient for the interaction term, β3, in Column (2) of Table
8 indicates that greater Recent Productivityj,t significantly reduces the tilt in investment
towards frontier areas for private firms in the cross-section. This result supports our findings
in Table 4 which also indicate shocks to asset values, for private firms, lowers the mix of
investment in frontier projects.
In Column (3) of Table 8 we present a similar regression, but include firm fixed effects.
The negative and significant coefficient for β2 indicates that higher recent productivity, which
should correlate with an increase in firm’s asset bases, negatively correlates with firm’s in-
vestment tilt towards the frontier. The negative and significant coefficient for the interaction
term, β3, indicates that this effect is significantly more pronounced for private firms. We
Access to Capital and Investment Composition 25
interpret this as additional evidence that, within-firm, greater access to financing result in a
lower mix of investment towards frontier projects.
In Columns (4) and (5) of Table 8 we show that the results we show in Columns (2)
and (3) respectively are robust to using our alternative measure of project remoteness,
RemoteDistancej,t, as the dependent variable. Specifically, the regression in Column (5)
shows that, within-firm, increases in recent productivity negatively correlate with fracked
well remoteness. In addition, these effects are especially pronounced for private firms.
3.3. Economies of Scale and Project Choice
Our findings thus far indicate that adverse financing conditions lead private firms to tilt
their investment mix towards more risky frontier projects. Our next set of tests show that
better access to capital provides firms this access an additional advantage via economies of
scale. Specifically, we examine the effect of access to financing on the investment tilt towards
multi-well pad drilling and fracking, which is the practice of drilling and fracking multiple
wells from a single surface location.
Pad drilling saves time and money through several different channels. Firstly, pad drilling
cuts down on rig assembly and relocation times since rigs don’t have to be disassembled
and moved several miles to new drill sites. Additionally, pad drilling allows contractors to
maximize fluids that assist vertical drilling as one batch, then switch to fluids that assist
horizontal drilling without having to clean or remix multiple times. Finally, consolidating
drilling sites saves on infrastructure investment such as water, power, and road construction.
To illustrate the efficiency gains from pad drilling, we compare the time it takes to
drill wells in pads relative to drilling one-off wells. We measure efficiency via our variable
Drill Daysi,j, the number of days between when drilling began for the well i and when total
well depth was reached. Our main variable of interest is Padi,j, which is an indicator that
Access to Capital and Investment Composition 26
the well i is part of a pad. To compare pad and non-pad wells we estimate the regression
outlined in Equation (6), and include a vector of controls Xi,j and a vector of fixed effects γ
which we discuss below:
Drill Daysi,j = β1Padi,j + β′2Xi,j + γ + εi,j (6)
We present the results of the analysis in Table 9. The negative and significant coefficient for
Padi,j in Column (1) indicates that wells drilled in pads take 6.5 fewer days to drill relative to
one-off non-pad wells. The intercept terms indicates the average non-pad well takes slightly
more than one month to drill, which suggests that the time savings for pad drilling, almost
one week, is highly economically significant.
In Column (2) we show that this result is robust to including controls which proxy for the
intensity of the drilling for each well, including the well’s depth. While well depth and laterals
significantly increases the drilling time for wells, including these controls does not alter the
point estimate for Padi,j relative to Column (1). Our most conservative specification, which
includes fixed-effects for year, firm, geographic area (field), and rig, indicates that pad drilling
saves on the order of about 1.7 days (Column (3)) or about 7% (Column (4)) of total drilling
times. This estimate is on par with survey-based findings that pad drilling saves about 10%
on drilling costs (e.g. https://tinyurl.com/y9aa4brs).19
We hypothesize that public firms, who can more easily marshal resources to capitalize
large-scale pad drilling sites, should employ this technology with greater frequency. By
contrast, private firms, who may be constrained in their ability to finance such large-scale
operations, should utilize pad drilling more infrequently. We verify this intuition by re-
19Note that this is a conservative estimate of cost savings since it does not include time savings from nothaving to disassemble and relocate the rig, nor does it account for the infrastructure savings.
Access to Capital and Investment Composition 27
estimating Equation (1) replacing the dependent variable with PadSharej,t and report the
results in Table 10. The negative and significant coefficient for Privatej in Columns (1) and
(2) indicate that private pad shares are on average between 14.6-21.1 percentage points lower
than public firm pad shares. As the average public firm pad share stands at 47.2 percentage
points (intercept of Column (1) in Table 10), these discrepancies are economically significant
as well.
To connect the differences in pad shares to financial capacity we also re-estimate Equation
(3) with PadSharej,t as the dependent variable. We report the effects of GoodLeasej on
pad shares in Columns (3) and (4) of Table 10. Our estimates indicate that each additional
GoodLease increases private firm pad shares by 1.8-2.5 percentage points (β2+β3), a quantity
that is both statistically and economically larger than the effect of GoodLeasej for public
firms (β2 only). Likewise, the estimates in Columns (5) and (6) of Table 10 indicate that
a one million dollar increase in Recent Productivityj,t increases pad shares for private firms
by 0.9-3.2 percentage points. All together the findings presented in Table 10 suggest that a
material portion of the difference in pad utilization rates between private and public firms
derives from access to external capital.
While pad drilling creates savings on a per-well basis, these multi-well projects require
significant upfront investment, and ex-ante commitments, relative to one-off well projects.
Ex-ante commitment are not suitable for frontier wells, where quality of the shale and the
right technology mix are unknown. This logic bears out in the data as only 8% of all
frontier wells in our data are drilled using the pad technology compared with almost 60%
of non-frontier wells. Since private firms are face greater constraints on access to external
financing for pad drilling, they face significant competitive disadvantages relative to public
firms when it comes to drilling in developed fields, and will therefore pursue frontier projects.
Access to Capital and Investment Composition 28
Therefore, the use of pad drilling, which is most effective in oil fields with proven quality
and standardized fracking technology, is another channel by which access to capital informs
the project choice of private and public firms.
3.4. Disclosure Requirements
We perform one additional test to rule out a specific manifestation of reverse causal-
ity. Specifically, we assess whether disclosure requirements lead firms engaged in frontier
investment to remain private. To test this hypothesis, we re-estimate Equation 1 using
Confidentiali,j as the dependent variable. We report the results in Table A6. The coefficient
on Privatej is negative, albeit statistically insignificantly so, suggesting that if anything, pri-
vate firms are less likely to petition for confidential status.20 Importantly, in Column (3) of
Table A6 we verify that privates are no more secretive regarding their frontier wells. This
finding helps reject the notion that frontier drillers remain private due to disclosure reasons.
4. Conclusion
We use detailed micro-data on oil well drilling in North Dakota to examine differences in
investment choices between private and public firms. Rather than focus on the level of
investment, we analyze whether private and public firms engage in different types of invest-
ment. The data allow us to distinguish riskier market-expanding projects from investments
in proven markets. We find that private firms more intensely invest in the former type
projects, while public firms tilt investment towards larger and more efficient pad drilling
projects in more well-established areas. We use endowments of legacy leases and proxies
20Unconditionally, about 20% of wells in our sample were filed confidentially. Given that there are nosignificant costs for petitioning for confidential well status, one may wonder why all wells are not filedconfidentially. One potential reason is that firms may be worried that overuse of this tool may lead regulatoryagencies to crack down on it - see for example https://tinyurl.com/ybxbu5rf.

Access to Capital and Investment Composition 29
for capital availability to link these findings to differential access to financial markets. In
summary, our results suggest that lack of access to external financing may encourage, rather
than preclude, firms to be more adventurous and bold with their investment mix.

Access to Capital and Investment Composition 30
References
Acharya, Viral and Zhaoxia Xu, 2017, Financial dependence and innovation: The case ofpublic versus private firms, Journal of Financial Economics 124, 223–243.
Almeida, Heitor, Po-Hsuan Hsu, Dongmei Li, and Kevin Tseng, 2017, More cash, less inno-vation: The effect of the American Jobs Creation Act on patent value, Available on SSRN.
Asker, John, Joan Farre-Mensa, and Alexander Ljungqvist, 2014, Corporate investment andstock market listing: A puzzle?, The Review of Financial Studies 28, 342–390.
Azar, Amir, 2017, Reserve base lending and the outlook for shale oil and gas finance, WorkingPaper .
Baihly, Jason David, Raphael Mark Altman, Isaac Aviles et al., Has the economic stagecount been reached in the bakken shale?, SPE Hydrocarbon Economics and EvaluationSymposium (Society of Petroleum Engineers 2012).
Bernstein, Shai, 2015, Does going public affect innovation?, The Journal of Finance 70,1365–1403.
Bhattacharya, Sudipto and Jay R Ritter, 1983, Innovation and communication: Signallingwith partial disclosure, The Review of Economic Studies 50, 331–346.
Blackwill, Robert D and Meghan L O’Sullivan, 2014, America’s energy edge: The geopoliticalconsequences of the shale revolution, Foreign Aff. 93, 102.
Cohen, Wesley M, Richard R Nelson, and John P Walsh, 2000, Protecting their intellectualassets: Appropriability conditions and why us manufacturing firms patent (or not), NBERWorking Paper No. 7552 .
Covert, Thomas R, 2015, Experiential and social learning in firms: the case of hydraulicfracturing in the bakken shale, Working Paper .
Doms, Mark, 2004, The boom and bust in information technology investment, EconomicReview-Federal Reserve Bank of San Francisco 19.
Farre-Mensa, Joan, 2017, The benefits of selective disclosure: Evidence from private firms,Unpublished Working Paper .
Fazzari, Steven M, R Glenn Hubbard, and Petersen, 1988, Financing constraints and corpo-rate investment, Brookings papers on economic activity 1988, 141–206.
Access to Capital and Investment Composition 31
Gilje, Erik and Jerome Taillard, 2017, Do public firms invest differently than private firms?taking cues from the natural gas industry, The Journal of Finance Forthcoming.
Gilje, Erik P, 2016, Do firms engage in risk-shifting? empirical evidence, The Review ofFinancial Studies 29, 2925–2954.
Hall, Bronwyn H and Josh Lerner, The financing of r&d and innovation, Handbook of theEconomics of Innovation, volume 1, 609–639 (Elsevier 2010).
Healy, David, 2012, Hydraulic fracturing or ‘fracking’: A short summary of current knowledgeand potential environmental impacts: A small scale study for the environmental protectionagency (ireland) under the science, technology, research & innovation for the environment(strive) programme 2007–2013 .
Holmstrom, Bengt, 1989, Agency costs and innovation, Journal of Economic Behavior &Organization 12, 305–327.
Jabbari, Hadi, Zhengwen Zeng et al., Hydraulic fracturing design for horizontal wells in thebakken formation, 46th US Rock Mechanics/Geomechanics Symposium (American RockMechanics Association 2012).
Kerr, William R and Ramana Nanda, 2015, Financing innovation, Annual Review of Finan-cial Economics 7, 445–462.
Lemmon, Michael L, Michael R Roberts, and Jaime F Zender, 2008, Back to the beginning:persistence and the cross-section of corporate capital structure, The Journal of Finance63, 1575–1608.
Montgomery, Carl T, Michael B Smith et al., 2010, Hydraulic fracturing: history of anenduring technology, Journal of Petroleum Technology 62, 26–40.
Ritter, Jay R, 1987, The costs of going public, Journal of Financial Economics 19, 269–281.
Saputelli, Luigi, Carlos Lopez, Alejandro Chacon, and Mohamed Soliman, Design optimiza-tion of horizontal wells with multiple hydraulic fractures in the Bakken Shale, SPE/EAGEEuropean Unconventional Resources Conference and Exhibition (2014).
Sheen, Albert, 2016, Do public and private firms behave differently? An examination ofinvestment in the chemical industry, Unpublished Working Paper .
Stein, Jeremy C, 1989, Efficient capital markets, inefficient firms: A model of myopic corpo-rate behavior, The Quarterly Journal of Economics 104, 655–669.
Access to Capital and Investment Composition 32
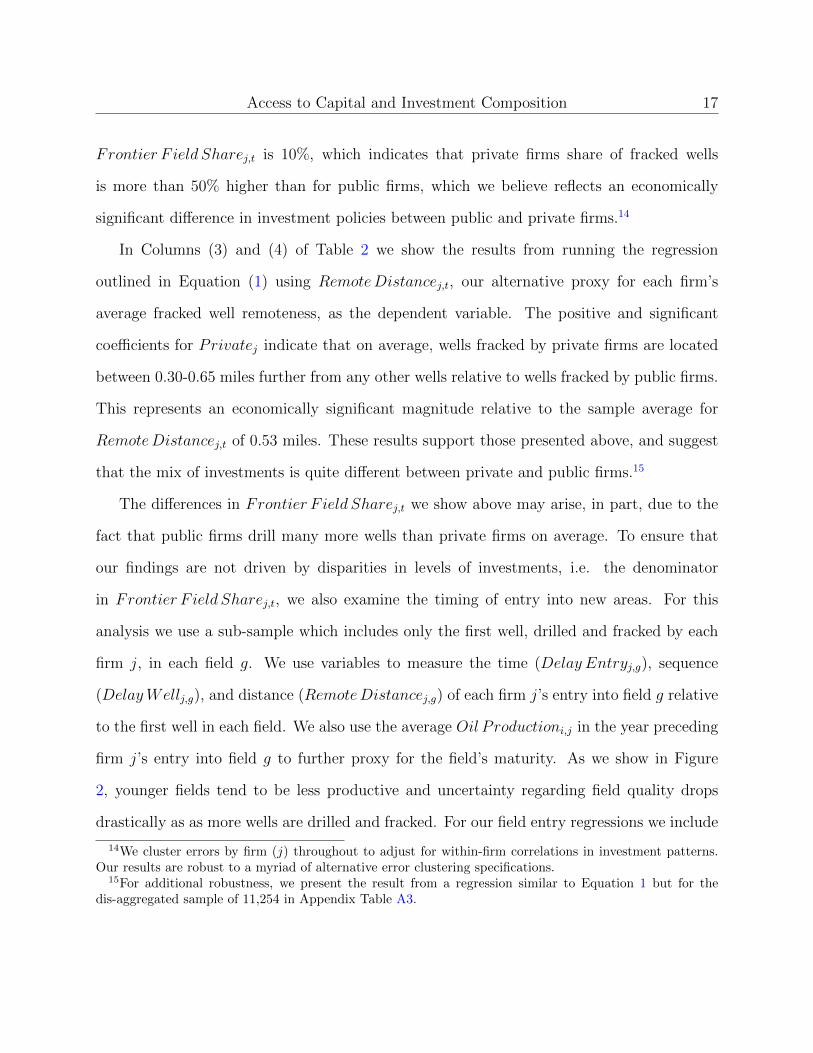
Figure 1: Fracking by Private and Public Companies
In the top panel we show the number of fracks (we define fracking in Section 1) performed inNorth Dakota over the early part of our sample for both private companies and public com-panies. In the bottom panel we show the number of fracks performed in North Dakota overour entire sample: 2004-2016. The data come from the North Dakota Industrial Commission.
Number of Fracks - Cumulative
Number of Fracks
Access to Capital and Investment Composition 33
Figure 2: Frontier Wells and Subsequent Wells
In the top panel we show the average well production, and the variance in production,according to the sequence in which wells are drilled in each 6x6-mile township-rangegrid-square within North Dakota. To adjust for the time trend in well production, we indexeach well relative to the average production for all wells drilled in each year, which we setto 100. We present the variance in production as the variance divided by the adjustedaverage. In the second panel we show the average number of subsequent wells drilled,within one year, conditional on the within-area number of oil wells previously drilled. Thedata come from the North Dakota Industrial Commission for wells drilled between 2004-2016.
Adjusted Production Variance in Production
Wells Drilled
Sequence in which Wells Are Drilled Within-Area
Access to Capital and Investment Composition 34
Figure 3: Trends in Total Fracking, Frontier Fracking, and Pad Drilling
In the top panel we show the trend in the number of fracks in North Dakota. In the bottompanel we show the trends in the share of Frontier Fieldi,j fracks as a share of all fracks, andthe trend in Pad2i,j fracks as a share of all fracks. We define these variables in Section 2.The data come from the North Dakota Industrial Commission.
Total Number of Fracks
Share of Fracks
Access to Capital and Investment Composition 35
Table 1: Summary Statistics
In this table we present summary statistics for our samples of 11,254 oil wells i drilled andfracked by 94 firms j in North Dakota between 2004-2016. We define all variables in Section 2.The data are from the North Dakota Industrial Commission and CRSP. The below summarystatistics reflect the pooled sample of all 11,254 wells as well as variables aggregated at theoperator j and quarter t level.
Mean Median Std Dev Min Max n
Well Level Data:
Privatei,j 0.16 0.00 0.36 0.00 1.00 11,254Total Depthi,j 3.74 3.86 0.38 0.35 5.14 11,254Oil Productioni,j 1,129.76 903.00 825.95 0.00 6,002 11,254Drill Daysi,j 31.14 28.00 15.59 6.00 98.00 11,254Frontier Fieldi,j 0.03 0.00 0.17 0.00 1.00 11,254Remote Distancei,j 0.53 0.12 1.43 0.00 5.52 11,253Padi,j 0.58 1.00 0.49 0.00 1.00 11,254Confidentiali,j 0.27 0.00 0.45 0.00 1.00 11,254
Firm Level Data:
Privatej 0.42 0.00 0.49 0.00 1.00 1,156Frontier Field Sharej,t 9.76 0.00 25.33 0.00 100.00 1,156Remote Distancej,t 1.08 0.66 3.25 0.00 5.52 1,155Pad Sharej,t 37.84 20.00 41.08 0.00 100.00 1,156Good Leasej 6.43 0.00 22.30 0.00 119.00 1.037Recent Productivityj,t 7.45 1.75 12.39 0.00 75.87 1,156
Access to Capital and Investment Composition 36
Table 2: Fracking in New Areas
In this table we present regressions examining the propensity to frack in new areas usingdata aggregated into a panel of firms (j) at quarterly (t) frequency. We measure new areasusing two variables: 1) Frontier Field Sharej,t the share of wells drilled by firm j in anoil field as defined by the North Dakota Industrial Commission during quarter t; and 2)Remote Distancej,t is the average minimum distance, in miles, from the wellheads of thewells drilled by firmj during quarter t to the closest wellheads of all other prior drilled andfracked wells. The independent variable of interest is Privatej a dummy variable indicatingfirm j is a private company. The data are our sample of all Bakken wells drilled and frackedin North Dakota from 2004-2016 as described in Section 2 aggregated into a panel at thefirm (j) level at quarterly (t) frequency. We multiply the dependent variables (save forRemote Distance) by 100 for coefficient readability. We present T-statistics in parenthesis:*** indicates significance at 1% level, ** indicates 5%, and * indicates 10%.
(1) (2) (3) (4)Frontier Frontier
Field Field Remote RemoteSharej,t Sharej,t Distancej,t Distancej,t
Privatej 8.62*** 4.17** 0.65*** 0.30***(3.36) (2.11) (4.30) (2.92)
Intercept 6.14*** 0.80***(6.00) (10.75)
Year FE No Yes No YesCluster Errors Firmj Firmj Firmj Firmj
Observations 1,156 1,156 1,155 1,155R2 0.03 0.32 0.06 0.52
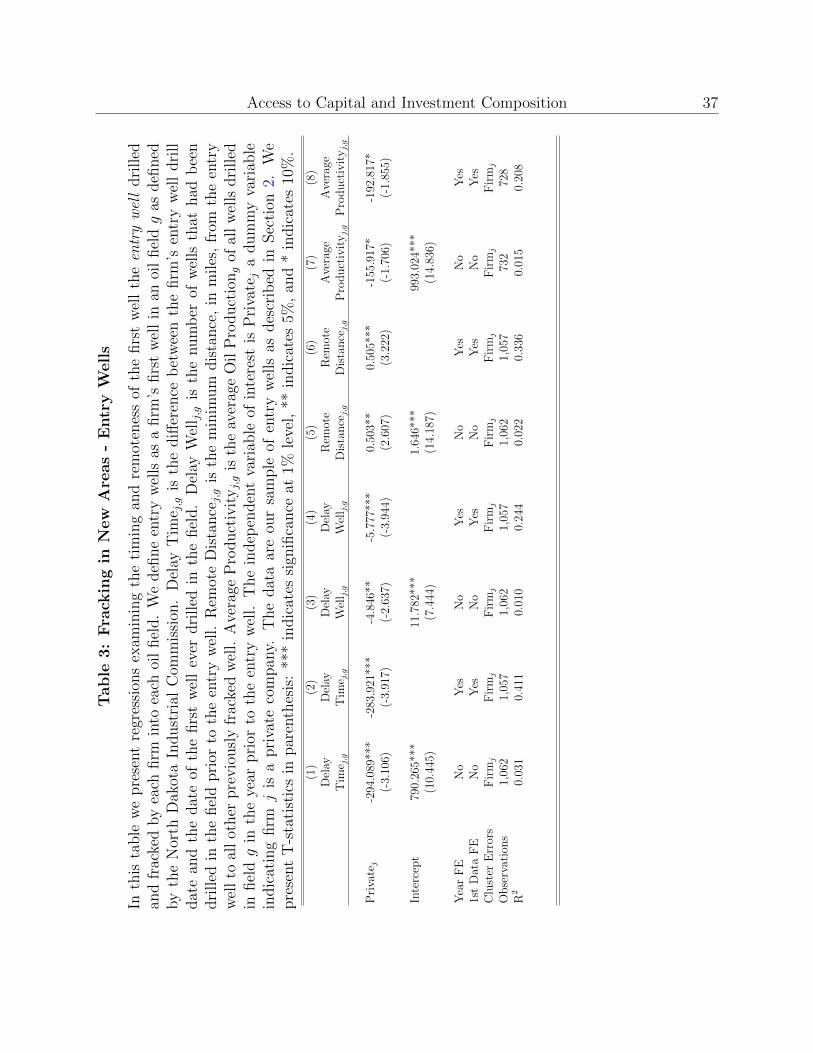
Access to Capital and Investment Composition 37T
able
3:
Fra
ckin
gin
New
Are
as
-E
ntr
yW
ells
Inth
ista
ble
we
pre
sent
regr
essi
ons
exam
inin
gth
eti
min
gan
dre
mot
enes
sof
the
firs
tw
ell
the
entr
yw
ell
dri
lled
and
frac
ked
by
each
firm
into
each
oil
fiel
d.
We
defi
ne
entr
yw
ells
asa
firm
’sfirs
tw
ell
inan
oil
fiel
dg
asdefi
ned
by
the
Nor
thD
akot
aIn
dust
rial
Com
mis
sion
.D
elay
Tim
e j,g
isth
ediff
eren
ceb
etw
een
the
firm
’sen
try
wel
ldri
lldat
ean
dth
edat
eof
the
firs
tw
ell
ever
dri
lled
inth
efiel
d.
Del
ayW
ell j,g
isth
enum
ber
ofw
ells
that
had
bee
ndri
lled
inth
efiel
dpri
orto
the
entr
yw
ell.
Rem
ote
Dis
tance
j,g
isth
em
inim
um
dis
tance
,in
miles
,fr
omth
een
try
wel
lto
all
other
pre
vio
usl
yfr
acke
dw
ell.
Ave
rage
Pro
duct
ivit
yj,g
isth
eav
erag
eO
ilP
roduct
iong
ofal
lw
ells
dri
lled
infiel
dg
inth
eye
arpri
orto
the
entr
yw
ell.
The
indep
enden
tva
riab
leof
inte
rest
isP
riva
tej
adum
my
vari
able
indic
atin
gfirm
jis
apri
vate
com
pan
y.T
he
dat
aar
eou
rsa
mple
ofen
try
wel
lsas
des
crib
edin
Sec
tion
2.W
epre
sent
T-s
tati
stic
sin
par
enth
esis
:**
*in
dic
ates
sign
ifica
nce
at1%
leve
l,**
indic
ates
5%,
and
*in
dic
ates
10%
.
(1)
(2)
(3)
(4)
(5)
(6)
(7)
(8)
Del
ayD
elay
Del
ayD
elay
Rem
ote
Rem
ote
Ave
rage
Ave
rage
Tim
e j,g
Tim
e j,g
Wel
l j,g
Wel
l j,g
Dis
tance
j,g
Dis
tance
j,g
Pro
duct
ivit
yj,g
Pro
duct
ivit
yj,g
Pri
vate
j-2
94.0
89**
*-2
83.9
21**
*-4
.846
**-5
.777
***
0.50
3**
0.50
5***
-155
.917
*-1
92.8
17*
(-3.
106)
(-3.
917)
(-2.
637)
(-3.
944)
(2.6
07)
(3.2
22)
(-1.
706)
(-1.
855)
Inte
rcep
t79
0.26
5***
11.7
82**
*1.
646*
**99
3.02
4***
(10.
445)
(7.4
44)
(14.
187)
(14.
836)
Yea
rF
EN
oY
esN
oY
esN
oY
esN
oY
es1s
tD
ata
FE
No
Yes
No
Yes
No
Yes
No
Yes
Clu
ster
Err
ors
Fir
mj
Fir
mj
Fir
mj
Fir
mj
Fir
mj
Fir
mj
Fir
mj
Fir
mj
Obse
rvat
ions
1,06
21,
057
1,06
21,
057
1,06
21,
057
732
728
R2
0.03
10.
411
0.01
00.
244
0.02
20.
336
0.01
50.
208

Access to Capital and Investment Composition 38
Table 4: Fracking and Legacy Leases
In this table we present the effect of Legacy Leases on a firm’s propensity to frack in newareas. We measure new areas using two variables: 1) Frontier Field Sharej,t is the share ofwells drilled by firm j in a previously undeveloped oil field as defined by the North DakotaIndustrial Commission during quarter t; 2) Remote Distancej,t is the average minimumdistance, in miles, of each well drilled by firm j in quarter t to all other previously drilledwells. The independent variable of interest is Good Leasej, the number of mineral rightsleases in favorable shale locations which were procured for non-fracked, non-Bakken wellsdrilled prior to 2008. The data are our sample of all Bakken wells drilled and fracked inNorth Dakota from 2008-2016. We multiply the Frontier Field Share by 100 for coefficientreadability. We present T-statistics in parenthesis: *** indicates significance at 1% level, **indicates 5%, and * indicates 10%.
(1) (2) (3) (4)Frontier Frontier
Field Field Remote RemoteSharej,t Sharej,t Distancej,t Distancej,t
Privatej 6.180*** 3.694* 0.608*** 0.323***(2.772) (1.884) (4.555) (3.207)
Good Leasej -0.003 -0.003 -0.001 -0.001(-0.198) (-0.260) (-0.580) (-0.757)
Good Leasej × Privatej -0.242*** -0.152** -0.021*** -0.010***(-2.675) (-2.008) (-3.531) (-2.645)
Total Legacy Lease Yes Yes Yes YesYear FE No Yes No YesCluster Errors Firmj Firmj Firmj Firmj
Private Firm Observations 422 422 422 422Public Firm Observations 615 615 615 615R2 0.040 0.106 0.103 0.389
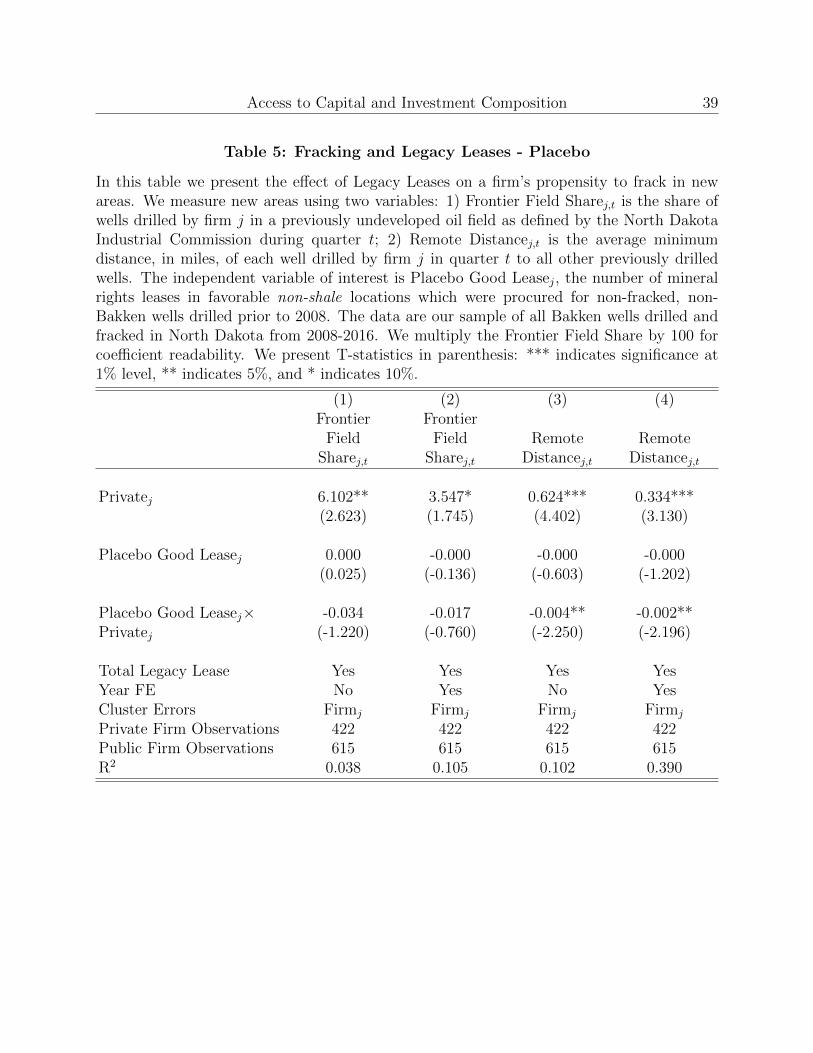
Access to Capital and Investment Composition 39
Table 5: Fracking and Legacy Leases - Placebo
In this table we present the effect of Legacy Leases on a firm’s propensity to frack in newareas. We measure new areas using two variables: 1) Frontier Field Sharej,t is the share ofwells drilled by firm j in a previously undeveloped oil field as defined by the North DakotaIndustrial Commission during quarter t; 2) Remote Distancej,t is the average minimumdistance, in miles, of each well drilled by firm j in quarter t to all other previously drilledwells. The independent variable of interest is Placebo Good Leasej, the number of mineralrights leases in favorable non-shale locations which were procured for non-fracked, non-Bakken wells drilled prior to 2008. The data are our sample of all Bakken wells drilled andfracked in North Dakota from 2008-2016. We multiply the Frontier Field Share by 100 forcoefficient readability. We present T-statistics in parenthesis: *** indicates significance at1% level, ** indicates 5%, and * indicates 10%.
(1) (2) (3) (4)Frontier Frontier
Field Field Remote RemoteSharej,t Sharej,t Distancej,t Distancej,t
Privatej 6.102** 3.547* 0.624*** 0.334***(2.623) (1.745) (4.402) (3.130)
Placebo Good Leasej 0.000 -0.000 -0.000 -0.000(0.025) (-0.136) (-0.603) (-1.202)
Placebo Good Leasej× -0.034 -0.017 -0.004** -0.002**Privatej (-1.220) (-0.760) (-2.250) (-2.196)
Total Legacy Lease Yes Yes Yes YesYear FE No Yes No YesCluster Errors Firmj Firmj Firmj Firmj
Private Firm Observations 422 422 422 422Public Firm Observations 615 615 615 615R2 0.038 0.105 0.102 0.390
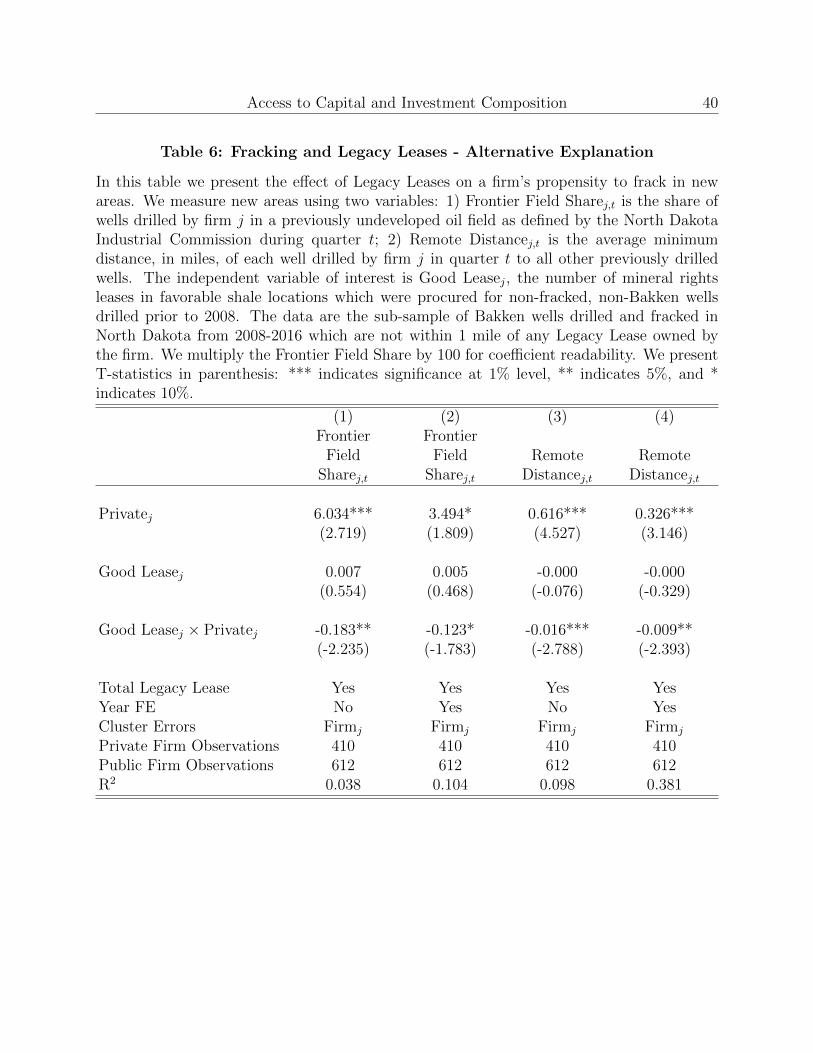
Access to Capital and Investment Composition 40
Table 6: Fracking and Legacy Leases - Alternative Explanation
In this table we present the effect of Legacy Leases on a firm’s propensity to frack in newareas. We measure new areas using two variables: 1) Frontier Field Sharej,t is the share ofwells drilled by firm j in a previously undeveloped oil field as defined by the North DakotaIndustrial Commission during quarter t; 2) Remote Distancej,t is the average minimumdistance, in miles, of each well drilled by firm j in quarter t to all other previously drilledwells. The independent variable of interest is Good Leasej, the number of mineral rightsleases in favorable shale locations which were procured for non-fracked, non-Bakken wellsdrilled prior to 2008. The data are the sub-sample of Bakken wells drilled and fracked inNorth Dakota from 2008-2016 which are not within 1 mile of any Legacy Lease owned bythe firm. We multiply the Frontier Field Share by 100 for coefficient readability. We presentT-statistics in parenthesis: *** indicates significance at 1% level, ** indicates 5%, and *indicates 10%.
(1) (2) (3) (4)Frontier Frontier
Field Field Remote RemoteSharej,t Sharej,t Distancej,t Distancej,t
Privatej 6.034*** 3.494* 0.616*** 0.326***(2.719) (1.809) (4.527) (3.146)
Good Leasej 0.007 0.005 -0.000 -0.000(0.554) (0.468) (-0.076) (-0.329)
Good Leasej × Privatej -0.183** -0.123* -0.016*** -0.009**(-2.235) (-1.783) (-2.788) (-2.393)
Total Legacy Lease Yes Yes Yes YesYear FE No Yes No YesCluster Errors Firmj Firmj Firmj Firmj
Private Firm Observations 410 410 410 410Public Firm Observations 612 612 612 612R2 0.038 0.104 0.098 0.381
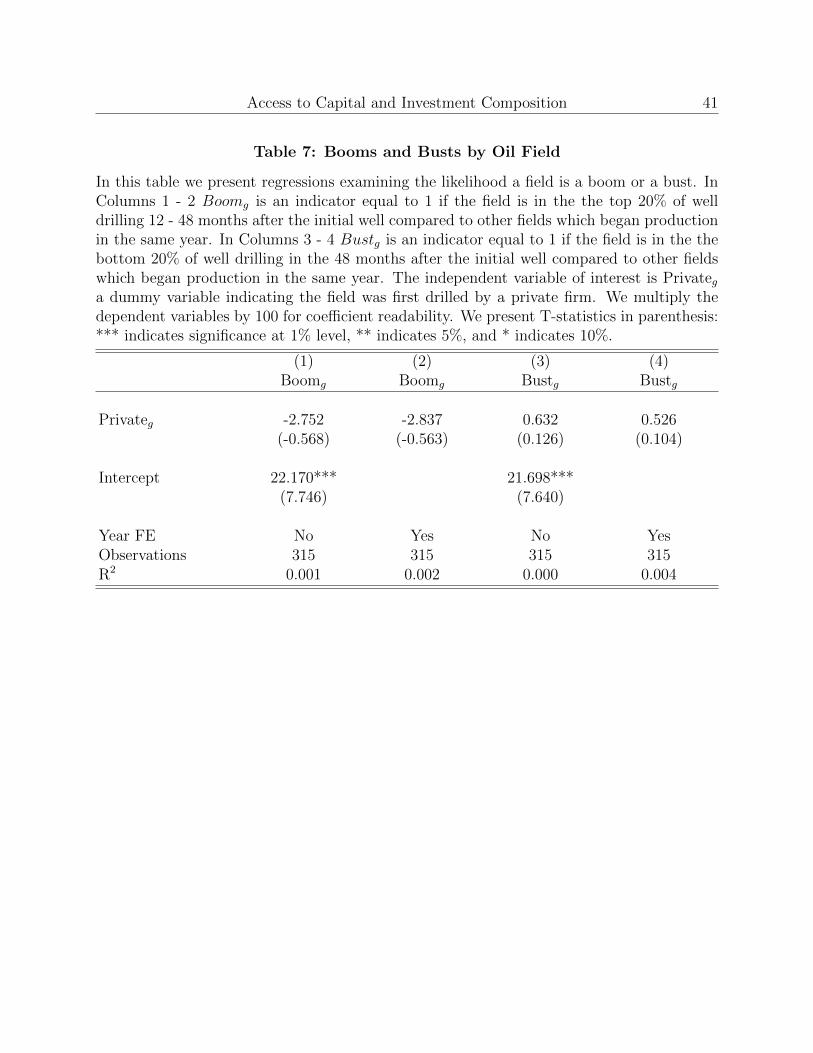
Access to Capital and Investment Composition 41
Table 7: Booms and Busts by Oil Field
In this table we present regressions examining the likelihood a field is a boom or a bust. InColumns 1 - 2 Boomg is an indicator equal to 1 if the field is in the the top 20% of welldrilling 12 - 48 months after the initial well compared to other fields which began productionin the same year. In Columns 3 - 4 Bustg is an indicator equal to 1 if the field is in the thebottom 20% of well drilling in the 48 months after the initial well compared to other fieldswhich began production in the same year. The independent variable of interest is Privatega dummy variable indicating the field was first drilled by a private firm. We multiply thedependent variables by 100 for coefficient readability. We present T-statistics in parenthesis:*** indicates significance at 1% level, ** indicates 5%, and * indicates 10%.
(1) (2) (3) (4)Boomg Boomg Bustg Bustg
Privateg -2.752 -2.837 0.632 0.526(-0.568) (-0.563) (0.126) (0.104)
Intercept 22.170*** 21.698***(7.746) (7.640)
Year FE No Yes No YesObservations 315 315 315 315R2 0.001 0.002 0.000 0.004
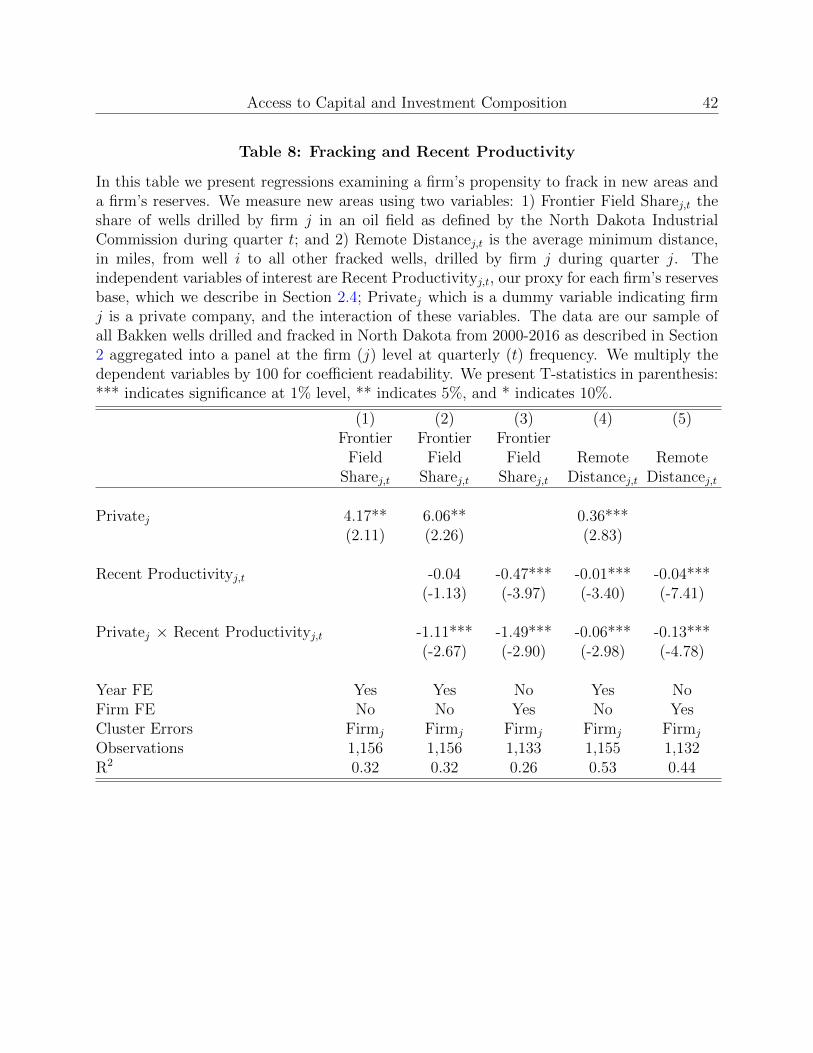
Access to Capital and Investment Composition 42
Table 8: Fracking and Recent Productivity
In this table we present regressions examining a firm’s propensity to frack in new areas anda firm’s reserves. We measure new areas using two variables: 1) Frontier Field Sharej,t theshare of wells drilled by firm j in an oil field as defined by the North Dakota IndustrialCommission during quarter t; and 2) Remote Distancej,t is the average minimum distance,in miles, from well i to all other fracked wells, drilled by firm j during quarter j. Theindependent variables of interest are Recent Productivityj,t, our proxy for each firm’s reservesbase, which we describe in Section 2.4; Privatej which is a dummy variable indicating firmj is a private company, and the interaction of these variables. The data are our sample ofall Bakken wells drilled and fracked in North Dakota from 2000-2016 as described in Section2 aggregated into a panel at the firm (j) level at quarterly (t) frequency. We multiply thedependent variables by 100 for coefficient readability. We present T-statistics in parenthesis:*** indicates significance at 1% level, ** indicates 5%, and * indicates 10%.
(1) (2) (3) (4) (5)Frontier Frontier Frontier
Field Field Field Remote RemoteSharej,t Sharej,t Sharej,t Distancej,t Distancej,t
Privatej 4.17** 6.06** 0.36***(2.11) (2.26) (2.83)
Recent Productivityj,t -0.04 -0.47*** -0.01*** -0.04***(-1.13) (-3.97) (-3.40) (-7.41)
Privatej × Recent Productivityj,t -1.11*** -1.49*** -0.06*** -0.13***(-2.67) (-2.90) (-2.98) (-4.78)
Year FE Yes Yes No Yes NoFirm FE No No Yes No YesCluster Errors Firmj Firmj Firmj Firmj Firmj
Observations 1,156 1,156 1,133 1,155 1,132R2 0.32 0.32 0.26 0.53 0.44
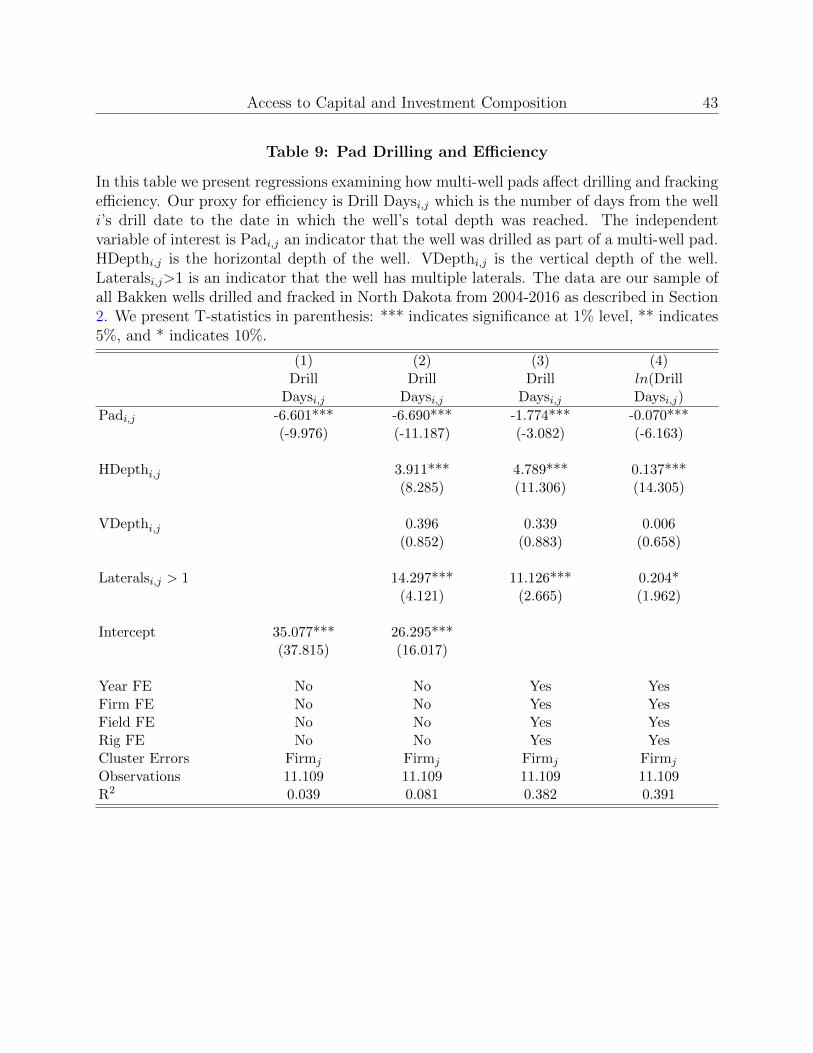
Access to Capital and Investment Composition 43
Table 9: Pad Drilling and Efficiency
In this table we present regressions examining how multi-well pads affect drilling and frackingefficiency. Our proxy for efficiency is Drill Daysi,j which is the number of days from the welli’s drill date to the date in which the well’s total depth was reached. The independentvariable of interest is Padi,j an indicator that the well was drilled as part of a multi-well pad.HDepthi,j is the horizontal depth of the well. VDepthi,j is the vertical depth of the well.Lateralsi,j>1 is an indicator that the well has multiple laterals. The data are our sample ofall Bakken wells drilled and fracked in North Dakota from 2004-2016 as described in Section2. We present T-statistics in parenthesis: *** indicates significance at 1% level, ** indicates5%, and * indicates 10%.
(1) (2) (3) (4)Drill Drill Drill ln(Drill
Daysi,j Daysi,j Daysi,j Daysi,j)
Padi,j -6.601*** -6.690*** -1.774*** -0.070***(-9.976) (-11.187) (-3.082) (-6.163)
HDepthi,j 3.911*** 4.789*** 0.137***(8.285) (11.306) (14.305)
VDepthi,j 0.396 0.339 0.006(0.852) (0.883) (0.658)
Lateralsi,j > 1 14.297*** 11.126*** 0.204*(4.121) (2.665) (1.962)
Intercept 35.077*** 26.295***(37.815) (16.017)
Year FE No No Yes YesFirm FE No No Yes YesField FE No No Yes YesRig FE No No Yes YesCluster Errors Firmj Firmj Firmj Firmj
Observations 11.109 11.109 11.109 11.109R2 0.039 0.081 0.382 0.391
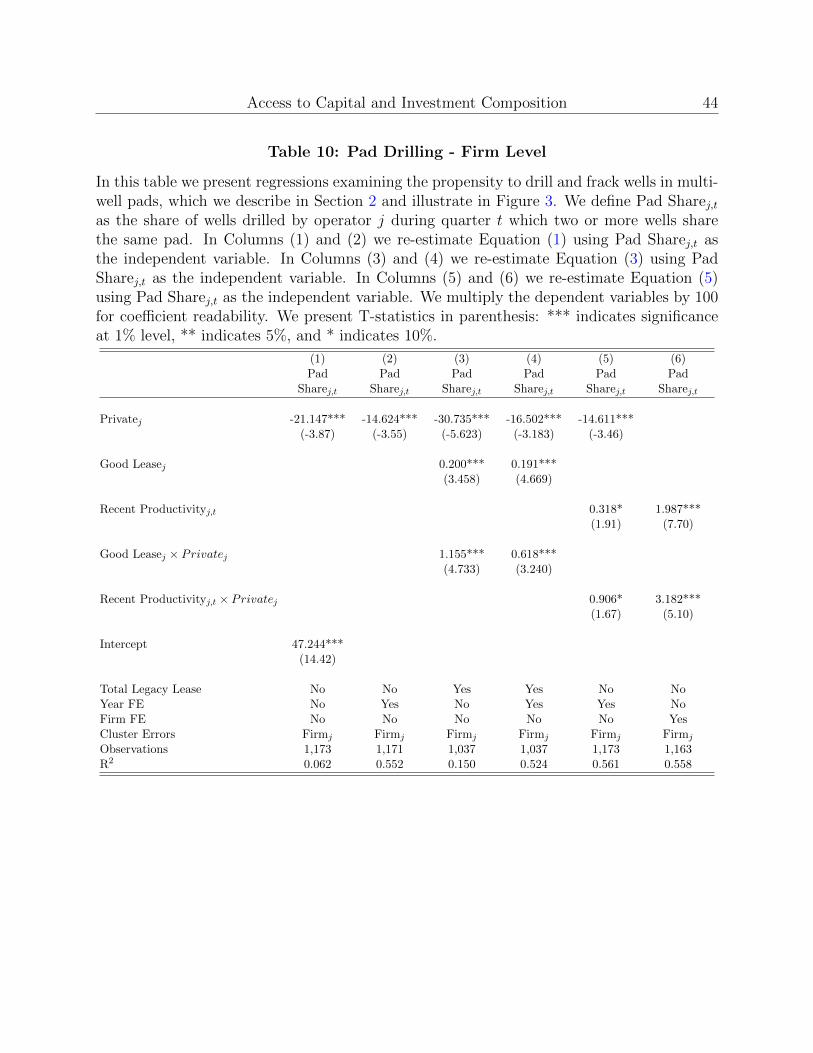
Access to Capital and Investment Composition 44
Table 10: Pad Drilling - Firm Level
In this table we present regressions examining the propensity to drill and frack wells in multi-well pads, which we describe in Section 2 and illustrate in Figure 3. We define Pad Sharej,tas the share of wells drilled by operator j during quarter t which two or more wells sharethe same pad. In Columns (1) and (2) we re-estimate Equation (1) using Pad Sharej,t asthe independent variable. In Columns (3) and (4) we re-estimate Equation (3) using PadSharej,t as the independent variable. In Columns (5) and (6) we re-estimate Equation (5)using Pad Sharej,t as the independent variable. We multiply the dependent variables by 100for coefficient readability. We present T-statistics in parenthesis: *** indicates significanceat 1% level, ** indicates 5%, and * indicates 10%.
(1) (2) (3) (4) (5) (6)Pad Pad Pad Pad Pad Pad
Sharej,t Sharej,t Sharej,t Sharej,t Sharej,t Sharej,t
Privatej -21.147*** -14.624*** -30.735*** -16.502*** -14.611***(-3.87) (-3.55) (-5.623) (-3.183) (-3.46)
Good Leasej 0.200*** 0.191***(3.458) (4.669)
Recent Productivityj,t 0.318* 1.987***(1.91) (7.70)
Good Leasej × Privatej 1.155*** 0.618***(4.733) (3.240)
Recent Productivityj,t × Privatej 0.906* 3.182***(1.67) (5.10)
Intercept 47.244***(14.42)
Total Legacy Lease No No Yes Yes No NoYear FE No Yes No Yes Yes NoFirm FE No No No No No YesCluster Errors Firmj Firmj Firmj Firmj Firmj Firmj
Observations 1,173 1,171 1,037 1,037 1,173 1,163R2 0.062 0.552 0.150 0.524 0.561 0.558

Access to Capital and Investment Composition 45
Appendix A: Supporting Data
Table A1: Individual Company Summary Statistics
In this table we present summary statistics for the most active of the 94 firms in our sample.Our sample of 11,254 oil wells i and firms j spans 2004-2016. We define all variables inSection 2. The data are from the North Dakota Industrial Commission and CRSP.
Total Total FrontierWells Frontier Field Total Pad2
Firm Name Privatej Fracked Fieldi,j Sharej,t Pad2i,j Sharej,t
CONTINENTAL RESOURCES 0 1187 36 0.03 632 0.53 [t]HESS CORP 0 1088 18 0.02 791 0.73WHITING OIL AND GAS CORP 0 1024 20 0.02 493 0.48OASIS PETROLEUM 0 844 20 0.02 534 0.63EOG RESOURCES, INC. 0 701 11 0.02 242 0.35XTO ENERGY INC. 0 634 3 0.00 528 0.83BURLINGTON RESOURCES 0 592 18 0.03 398 0.67MARATHON OIL COMPANY 0 514 7 0.01 269 0.52STATOIL OIL & GAS LP 0 426 1 0.00 347 0.81QEP ENERGY COMPANY 0 316 0 0.00 293 0.93SM ENERGY COMPANY 0 311 7 0.02 163 0.52PETRO-HUNT, L.L.C. 1 301 13 0.04 148 0.49KODIAK OIL & GAS (USA) INC. 0 293 4 0.01 258 0.88SLAWSON EXPLORATION CO 1 276 5 0.02 162 0.59OXY USA INC. 0 189 2 0.01 98 0.52WPX ENERGY WILLISTON, LLC 0 176 0 0.00 157 0.89HRC OPERATING, LLC 0 173 1 0.01 140 0.81BRIGHAM OIL & GAS, L.P. 0 162 20 0.12 56 0.35WILLIAMS COS 0 160 5 0.03 29 0.18HUNT OIL COMPANY 1 145 6 0.04 28 0.19ZENERGY, INC 1 134 7 0.05 21 0.16TRIANGLE USA PETROLEUM CORP 0 119 1 0.01 103 0.87ZAVANNA, LLC 1 106 4 0.04 50 0.47DENBURY ONSHORE, LLC 0 99 0 0.00 47 0.47ENERPLUS RESOURCES USA CORP 0 98 0 0.00 71 0.72
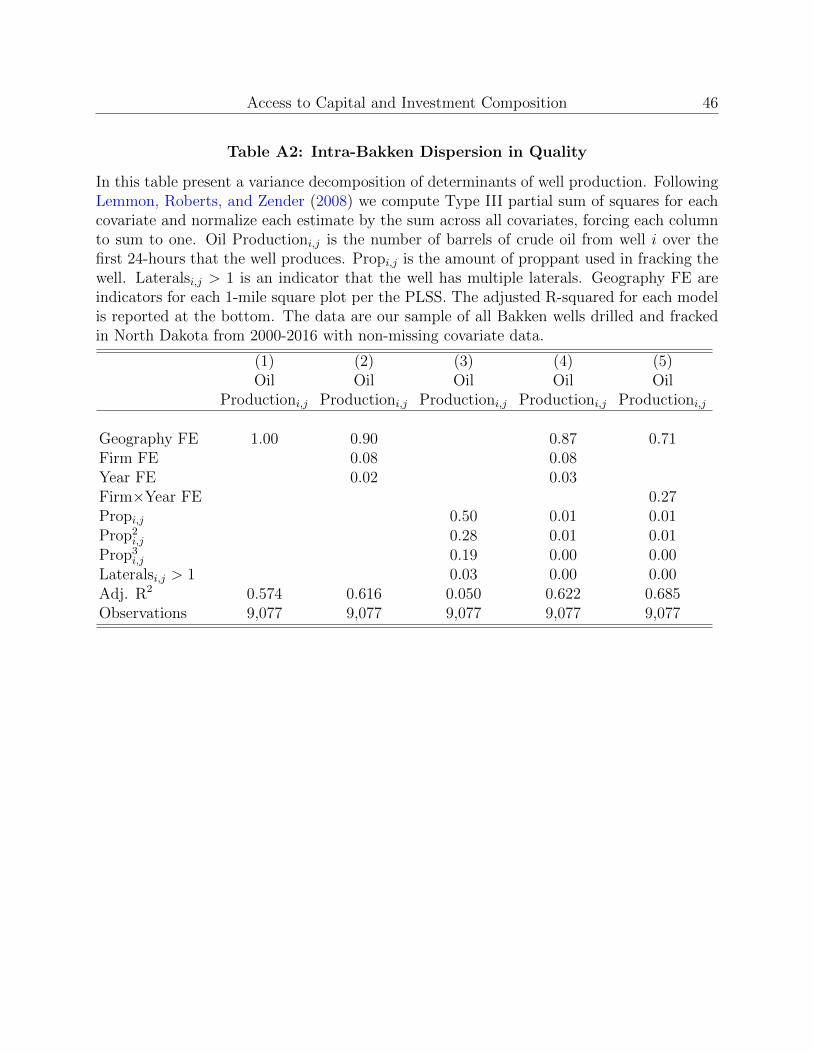
Access to Capital and Investment Composition 46
Table A2: Intra-Bakken Dispersion in Quality
In this table present a variance decomposition of determinants of well production. FollowingLemmon, Roberts, and Zender (2008) we compute Type III partial sum of squares for eachcovariate and normalize each estimate by the sum across all covariates, forcing each columnto sum to one. Oil Productioni,j is the number of barrels of crude oil from well i over thefirst 24-hours that the well produces. Propi,j is the amount of proppant used in fracking thewell. Lateralsi,j > 1 is an indicator that the well has multiple laterals. Geography FE areindicators for each 1-mile square plot per the PLSS. The adjusted R-squared for each modelis reported at the bottom. The data are our sample of all Bakken wells drilled and frackedin North Dakota from 2000-2016 with non-missing covariate data.
(1) (2) (3) (4) (5)Oil
Productioni,j
OilProductioni,j
OilProductioni,j
OilProductioni,j
OilProductioni,j
Geography FE 1.00 0.90 0.87 0.71Firm FE 0.08 0.08Year FE 0.02 0.03Firm×Year FE 0.27Propi,j 0.50 0.01 0.01Prop2
i,j 0.28 0.01 0.01Prop3
i,j 0.19 0.00 0.00Lateralsi,j > 1 0.03 0.00 0.00Adj. R2 0.574 0.616 0.050 0.622 0.685Observations 9,077 9,077 9,077 9,077 9,077
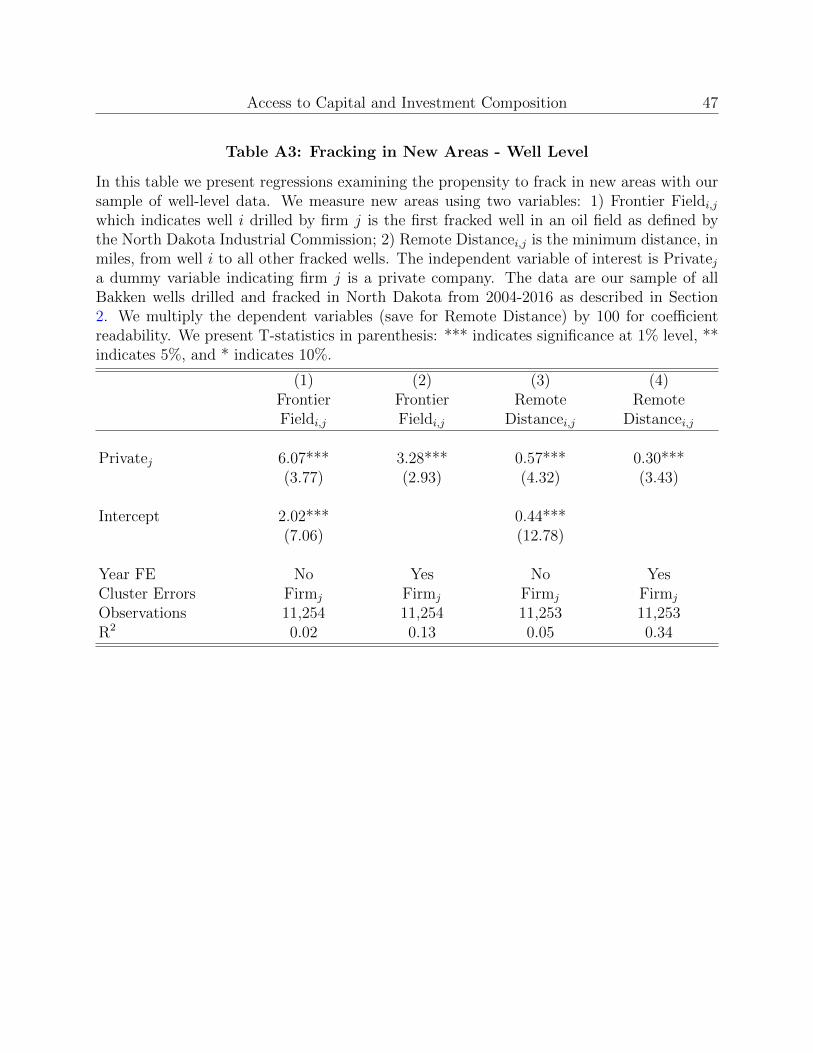
Access to Capital and Investment Composition 47
Table A3: Fracking in New Areas - Well Level
In this table we present regressions examining the propensity to frack in new areas with oursample of well-level data. We measure new areas using two variables: 1) Frontier Fieldi,j
which indicates well i drilled by firm j is the first fracked well in an oil field as defined bythe North Dakota Industrial Commission; 2) Remote Distancei,j is the minimum distance, inmiles, from well i to all other fracked wells. The independent variable of interest is Privateja dummy variable indicating firm j is a private company. The data are our sample of allBakken wells drilled and fracked in North Dakota from 2004-2016 as described in Section2. We multiply the dependent variables (save for Remote Distance) by 100 for coefficientreadability. We present T-statistics in parenthesis: *** indicates significance at 1% level, **indicates 5%, and * indicates 10%.
(1) (2) (3) (4)Frontier Frontier Remote RemoteFieldi,j Fieldi,j Distancei,j Distancei,j
Privatej 6.07*** 3.28*** 0.57*** 0.30***(3.77) (2.93) (4.32) (3.43)
Intercept 2.02*** 0.44***(7.06) (12.78)
Year FE No Yes No YesCluster Errors Firmj Firmj Firmj Firmj
Observations 11,254 11,254 11,253 11,253R2 0.02 0.13 0.05 0.34
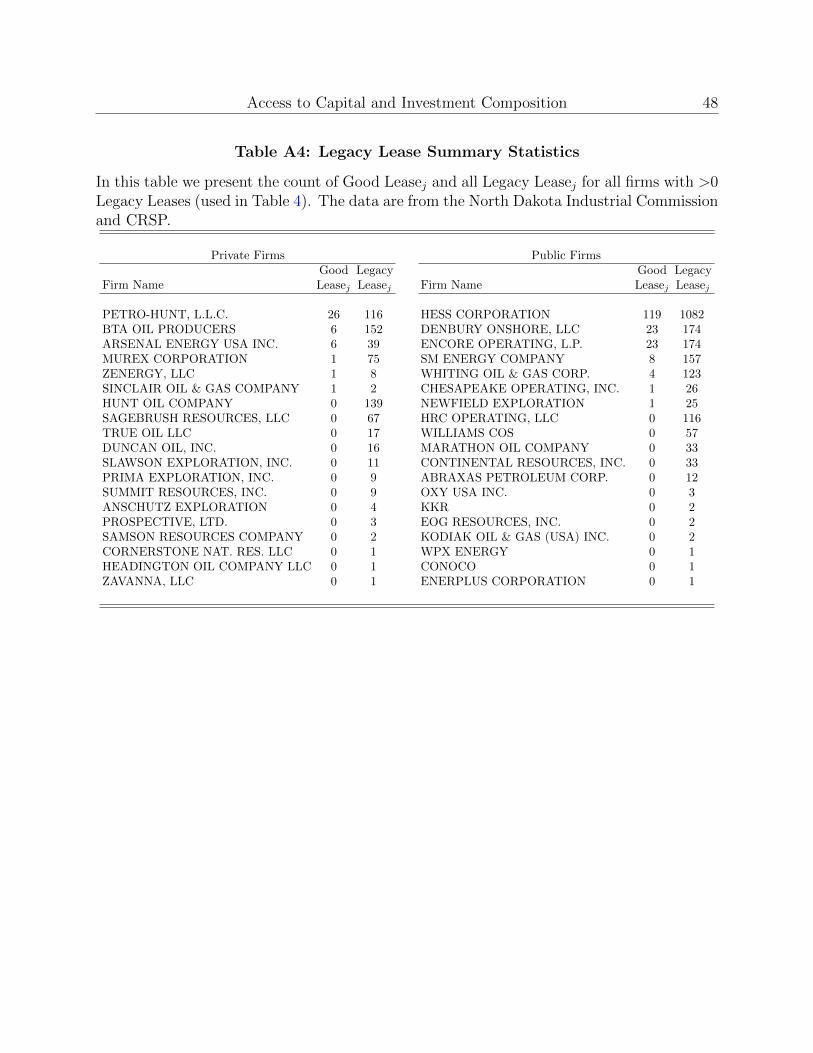
Access to Capital and Investment Composition 48
Table A4: Legacy Lease Summary Statistics
In this table we present the count of Good Leasej and all Legacy Leasej for all firms with >0Legacy Leases (used in Table 4). The data are from the North Dakota Industrial Commissionand CRSP.
Private Firms Public FirmsGood Legacy Good Legacy
Firm Name Leasej Leasej Firm Name Leasej Leasej
PETRO-HUNT, L.L.C. 26 116 HESS CORPORATION 119 1082BTA OIL PRODUCERS 6 152 DENBURY ONSHORE, LLC 23 174ARSENAL ENERGY USA INC. 6 39 ENCORE OPERATING, L.P. 23 174MUREX CORPORATION 1 75 SM ENERGY COMPANY 8 157ZENERGY, LLC 1 8 WHITING OIL & GAS CORP. 4 123SINCLAIR OIL & GAS COMPANY 1 2 CHESAPEAKE OPERATING, INC. 1 26HUNT OIL COMPANY 0 139 NEWFIELD EXPLORATION 1 25SAGEBRUSH RESOURCES, LLC 0 67 HRC OPERATING, LLC 0 116TRUE OIL LLC 0 17 WILLIAMS COS 0 57DUNCAN OIL, INC. 0 16 MARATHON OIL COMPANY 0 33SLAWSON EXPLORATION, INC. 0 11 CONTINENTAL RESOURCES, INC. 0 33PRIMA EXPLORATION, INC. 0 9 ABRAXAS PETROLEUM CORP. 0 12SUMMIT RESOURCES, INC. 0 9 OXY USA INC. 0 3ANSCHUTZ EXPLORATION 0 4 KKR 0 2PROSPECTIVE, LTD. 0 3 EOG RESOURCES, INC. 0 2SAMSON RESOURCES COMPANY 0 2 KODIAK OIL & GAS (USA) INC. 0 2CORNERSTONE NAT. RES. LLC 0 1 WPX ENERGY 0 1HEADINGTON OIL COMPANY LLC 0 1 CONOCO 0 1ZAVANNA, LLC 0 1 ENERPLUS CORPORATION 0 1
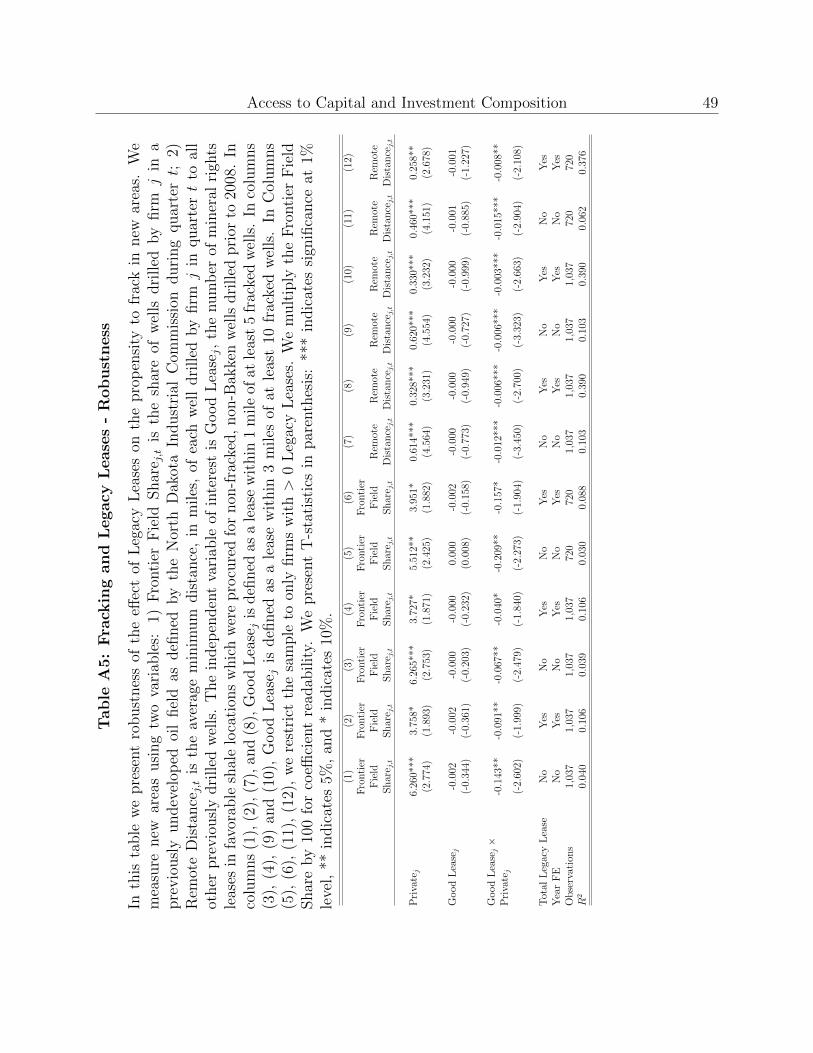
Access to Capital and Investment Composition 49T
able
A5:
Fra
ckin
gand
Legacy
Lease
s-
Robust
ness
Inth
ista
ble
we
pre
sent
robust
nes
sof
the
effec
tof
Leg
acy
Lea
ses
onth
epro
pen
sity
tofr
ack
innew
area
s.W
em
easu
renew
area
susi
ng
two
vari
able
s:1)
Fro
nti
erF
ield
Shar
e j,t
isth
esh
are
ofw
ells
dri
lled
by
firm
jin
apre
vio
usl
yundev
elop
edoi
lfiel
das
defi
ned
by
the
Nor
thD
akot
aIn
dust
rial
Com
mis
sion
duri
ng
quar
tert;
2)R
emot
eD
ista
nce
j,t
isth
eav
erag
em
inim
um
dis
tance
,in
miles
,of
each
wel
ldri
lled
by
firm
jin
quar
tert
toal
lot
her
pre
vio
usl
ydri
lled
wel
ls.
The
indep
enden
tva
riab
leof
inte
rest
isG
ood
Lea
sej,
the
num
ber
ofm
iner
alri
ghts
leas
esin
favo
rable
shal
elo
cati
ons
whic
hw
ere
pro
cure
dfo
rnon
-fra
cked
,non
-Bak
ken
wel
lsdri
lled
pri
orto
2008
.In
colu
mns
(1),
(2),
(7),
and
(8),
Good
Lea
sej
isdefi
ned
asa
leas
ew
ithin
1m
ile
ofat
leas
t5
frac
ked
wel
ls.
Inco
lum
ns
(3),
(4),
(9)
and
(10)
,G
ood
Lea
sej
isdefi
ned
asa
leas
ew
ithin
3m
iles
ofat
leas
t10
frac
ked
wel
ls.
InC
olum
ns
(5),
(6),
(11)
,(1
2),
we
rest
rict
the
sam
ple
toon
lyfirm
sw
ith>
0L
egac
yL
ease
s.W
em
ult
iply
the
Fro
nti
erF
ield
Shar
eby
100
for
coeffi
cien
tre
adab
ilit
y.W
epre
sent
T-s
tati
stic
sin
par
enth
esis
:**
*in
dic
ates
sign
ifica
nce
at1%
leve
l,**
indic
ates
5%,
and
*in
dic
ates
10%
.
(1)
(2)
(3)
(4)
(5)
(6)
(7)
(8)
(9)
(10)
(11)
(12)
Fro
nti
erF
ronti
erF
ronti
erF
ronti
erF
ronti
erF
ronti
erF
ield
Fie
ldF
ield
Fie
ldF
ield
Fie
ldR
emot
eR
emot
eR
emot
eR
emot
eR
emot
eR
emot
eShar
e j,t
Shar
e j,t
Shar
e j,t
Shar
e j,t
Shar
e j,t
Shar
e j,t
Dis
tance
j,t
Dis
tance
j,t
Dis
tance
j,t
Dis
tance
j,t
Dis
tance
j,t
Dis
tance
j,t
Pri
vate
j6.
260*
**3.
758*
6.26
5***
3.72
7*5.
512*
*3.
951*
0.61
4***
0.32
8***
0.62
0***
0.33
0***
0.46
0***
0.25
8**
(2.7
74)
(1.8
93)
(2.7
53)
(1.8
71)
(2.4
25)
(1.8
82)
(4.5
64)
(3.2
31)
(4.5
54)
(3.2
32)
(4.1
51)
(2.6
78)
Good
Lea
sej
-0.0
02-0
.002
-0.0
00-0
.000
0.00
0-0
.002
-0.0
00-0
.000
-0.0
00-0
.000
-0.0
01-0
.001
(-0.
344)
(-0.
361)
(-0.
203)
(-0.
232)
(0.0
08)
(-0.
158)
(-0.
773)
(-0.
949)
(-0.
727)
(-0.
999)
(-0.
885)
(-1.
227)
Good
Lea
sej×
Pri
vate
j-0
.143
**-0
.091
**-0
.067
**-0
.040
*-0
.209
**-0
.157
*-0
.012
***
-0.0
06**
*-0
.006
***
-0.0
03**
*-0
.015
***
-0.0
08**
(-2.
602)
(-1.
999)
(-2.
479)
(-1.
840)
(-2.
273)
(-1.
904)
(-3.
450)
(-2.
700)
(-3.
323)
(-2.
663)
(-2.
904)
(-2.
108)
Tot
alL
egac
yL
ease
No
Yes
No
Yes
No
Yes
No
Yes
No
Yes
No
Yes
Yea
rF
EN
oY
esN
oY
esN
oY
esN
oY
esN
oY
esN
oY
esO
bse
rvat
ions
1,03
71,
037
1,03
71,
037
720
720
1,03
71,
037
1,03
71,
037
720
720
R2
0.04
00.
106
0.03
90.
106
0.03
00.
088
0.10
30.
390
0.10
30.
390
0.06
20.
376
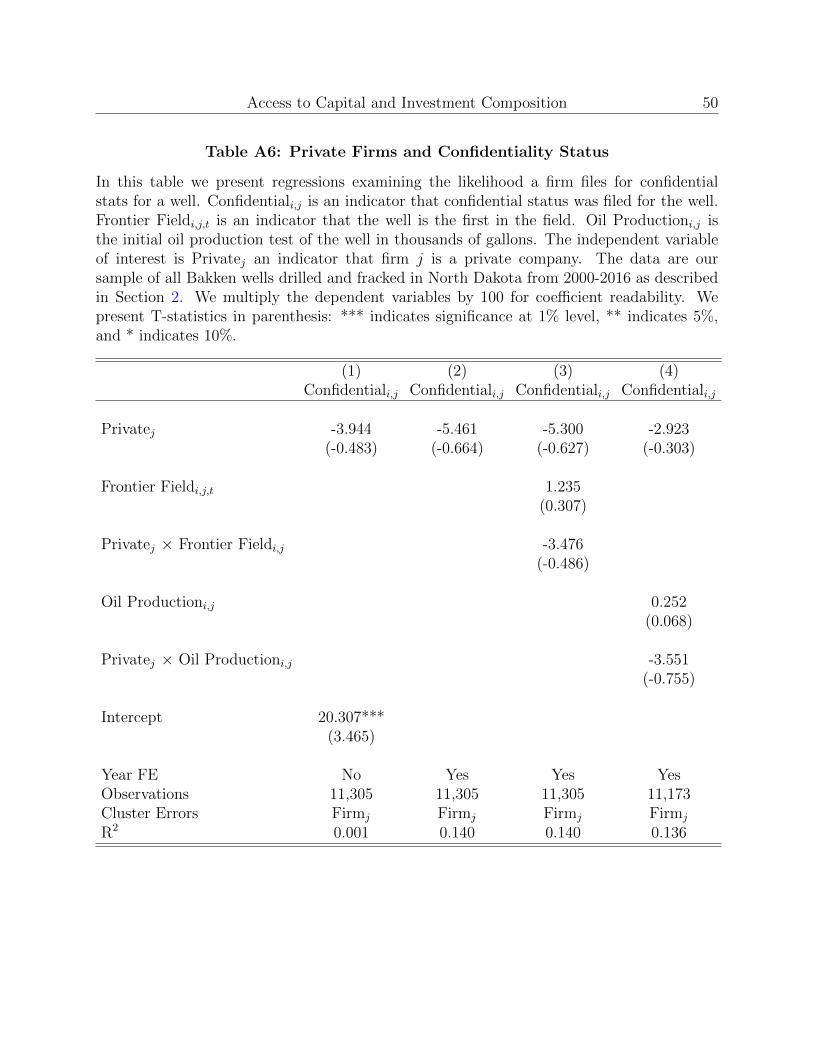
Access to Capital and Investment Composition 50
Table A6: Private Firms and Confidentiality Status
In this table we present regressions examining the likelihood a firm files for confidentialstats for a well. Confidentiali,j is an indicator that confidential status was filed for the well.Frontier Fieldi,j,t is an indicator that the well is the first in the field. Oil Productioni,j isthe initial oil production test of the well in thousands of gallons. The independent variableof interest is Privatej an indicator that firm j is a private company. The data are oursample of all Bakken wells drilled and fracked in North Dakota from 2000-2016 as describedin Section 2. We multiply the dependent variables by 100 for coefficient readability. Wepresent T-statistics in parenthesis: *** indicates significance at 1% level, ** indicates 5%,and * indicates 10%.
(1) (2) (3) (4)Confidentiali,j Confidentiali,j Confidentiali,j Confidentiali,j
Privatej -3.944 -5.461 -5.300 -2.923(-0.483) (-0.664) (-0.627) (-0.303)
Frontier Fieldi,j,t 1.235(0.307)
Privatej × Frontier Fieldi,j -3.476(-0.486)
Oil Productioni,j 0.252(0.068)
Privatej × Oil Productioni,j -3.551(-0.755)
Intercept 20.307***(3.465)
Year FE No Yes Yes YesObservations 11,305 11,305 11,305 11,173Cluster Errors Firmj Firmj Firmj Firmj
R2 0.001 0.140 0.140 0.136
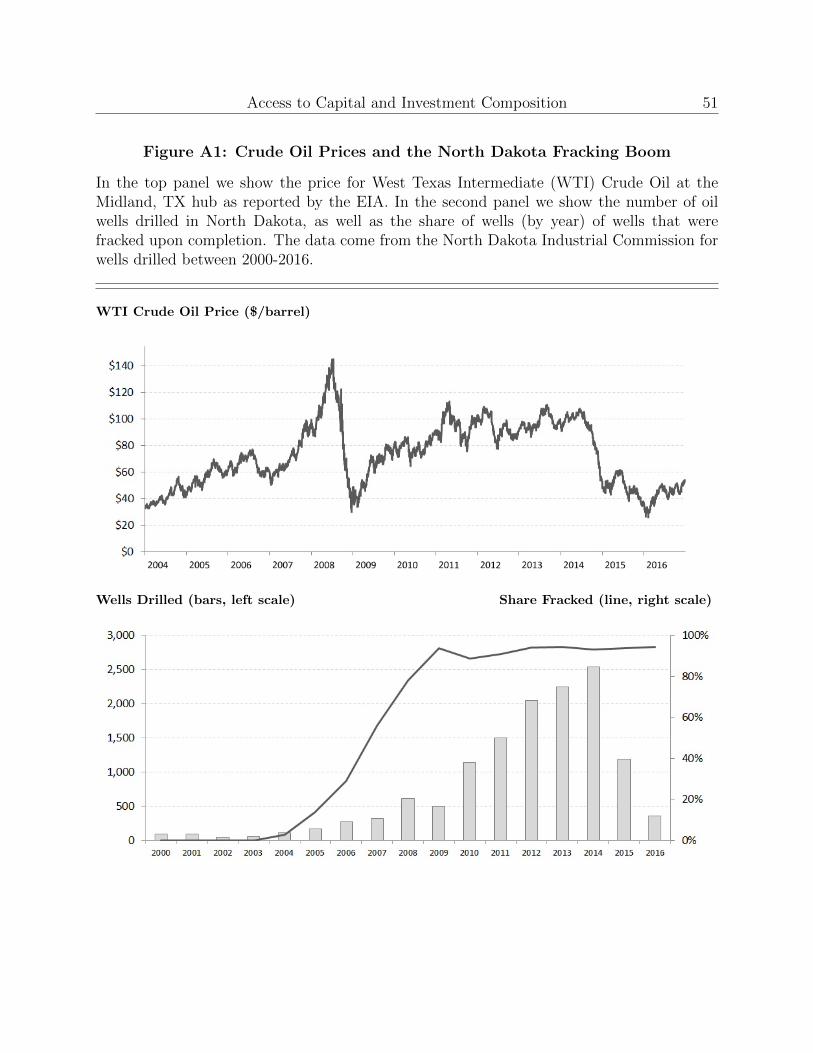
Access to Capital and Investment Composition 51
Figure A1: Crude Oil Prices and the North Dakota Fracking Boom
In the top panel we show the price for West Texas Intermediate (WTI) Crude Oil at theMidland, TX hub as reported by the EIA. In the second panel we show the number of oilwells drilled in North Dakota, as well as the share of wells (by year) of wells that werefracked upon completion. The data come from the North Dakota Industrial Commission forwells drilled between 2000-2016.
WTI Crude Oil Price ($/barrel)
Wells Drilled (bars, left scale) Share Fracked (line, right scale)
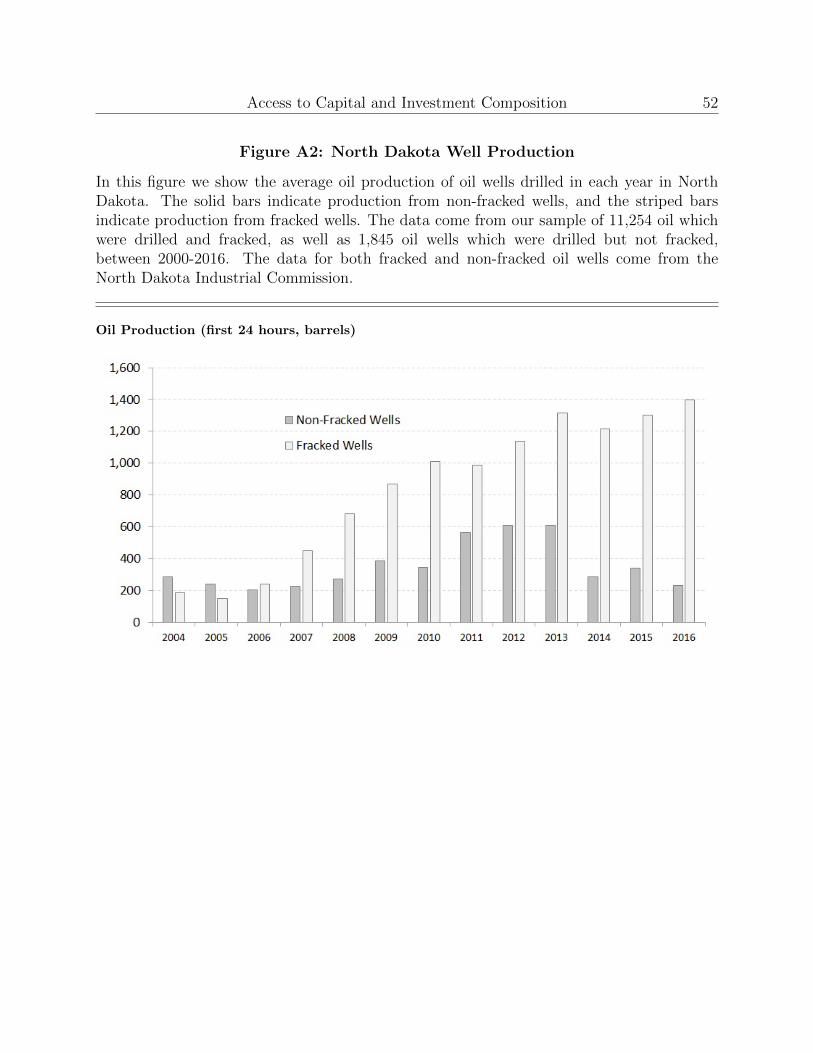
Access to Capital and Investment Composition 52
Figure A2: North Dakota Well Production
In this figure we show the average oil production of oil wells drilled in each year in NorthDakota. The solid bars indicate production from non-fracked wells, and the striped barsindicate production from fracked wells. The data come from our sample of 11,254 oil whichwere drilled and fracked, as well as 1,845 oil wells which were drilled but not fracked,between 2000-2016. The data for both fracked and non-fracked oil wells come from theNorth Dakota Industrial Commission.
Oil Production (first 24 hours, barrels)
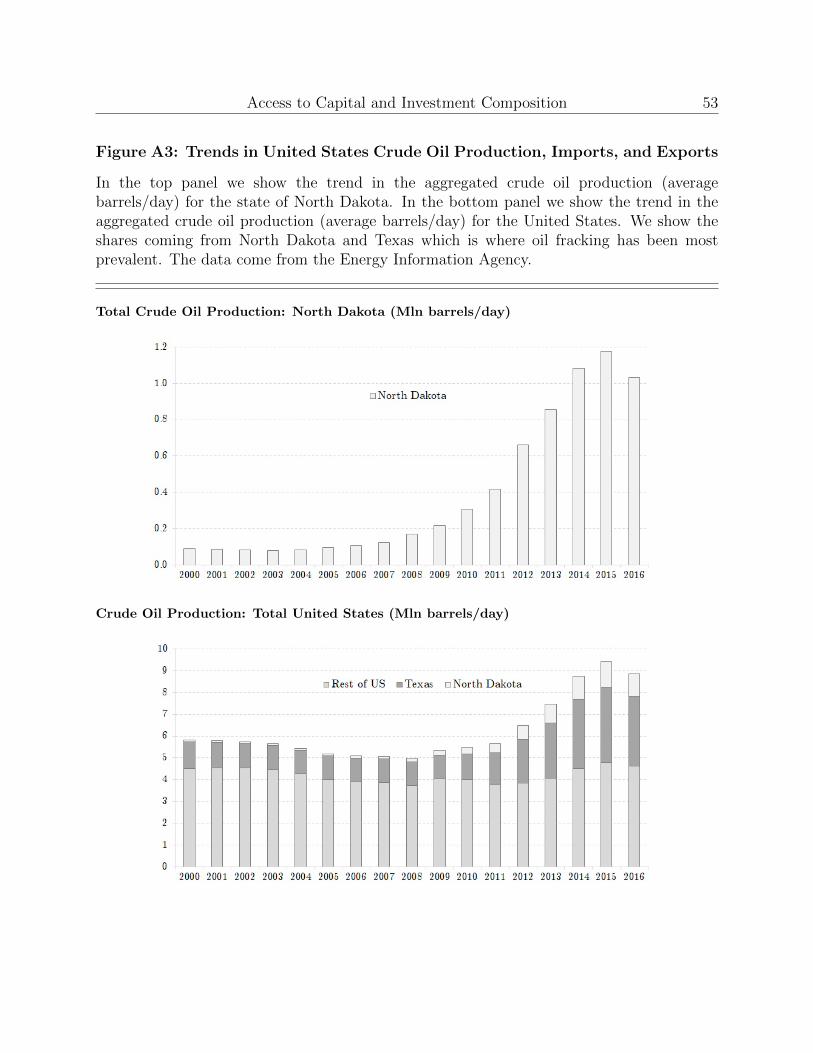
Access to Capital and Investment Composition 53
Figure A3: Trends in United States Crude Oil Production, Imports, and Exports
In the top panel we show the trend in the aggregated crude oil production (averagebarrels/day) for the state of North Dakota. In the bottom panel we show the trend in theaggregated crude oil production (average barrels/day) for the United States. We show theshares coming from North Dakota and Texas which is where oil fracking has been mostprevalent. The data come from the Energy Information Agency.
Total Crude Oil Production: North Dakota (Mln barrels/day)
Crude Oil Production: Total United States (Mln barrels/day)
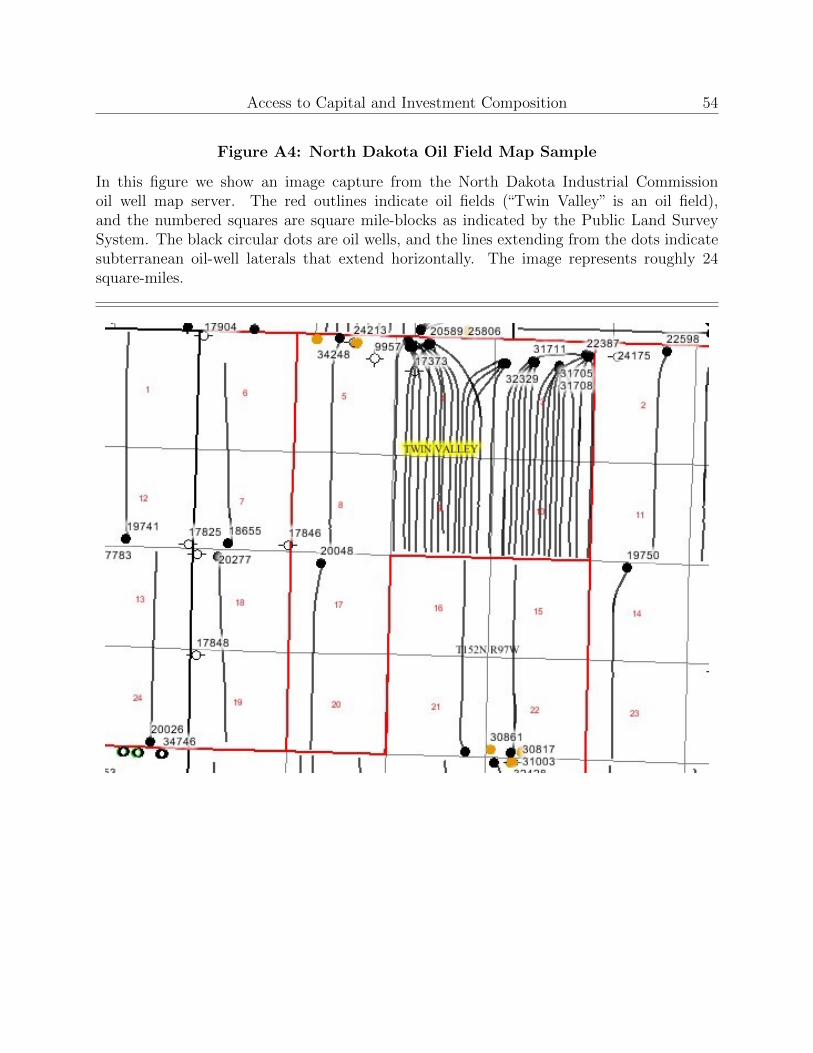
Access to Capital and Investment Composition 54
Figure A4: North Dakota Oil Field Map Sample
In this figure we show an image capture from the North Dakota Industrial Commissionoil well map server. The red outlines indicate oil fields (“Twin Valley” is an oil field),and the numbered squares are square mile-blocks as indicated by the Public Land SurveySystem. The black circular dots are oil wells, and the lines extending from the dots indicatesubterranean oil-well laterals that extend horizontally. The image represents roughly 24square-miles.

Access to Capital and Investment Composition 55
Figure A5: North Dakota Frontier Wells Over Time
In this figure we show the trend in Bakken oil wells drilled and fracked in North Dakota.Each panel shows a map of all oil wells drilled and fracked in North Dakota as of the endof each indicated year. Red dots represent Frontier Fieldi,j wells drilled and fracked in therespective year. Blue dots represent all other new oil wells drilled and fracked in that year,and black dots represent all oil wells drilled prior to that year. The data come from theNorth Dakota Industrial Commission.