AcceptAble behAviour? - ipsos.com · 1 Acceptable Behaviour - Ipsos MORI There is a growing...
28
ACCEPTABLE BEHAVIOUR? Public opinion on behaviour change policy Social Research Institute
Transcript of AcceptAble behAviour? - ipsos.com · 1 Acceptable Behaviour - Ipsos MORI There is a growing...
1
Acceptable Behavior - Ipsos MORI SRI
AcceptAble behAviour?Public opinion on behaviour change policy
Social Research Institute
2
Ipsos MORI SRI - Acceptable Behavior
coNteNtS
AuthorS
chriS brANSoN [email protected]
bobby Duffy [email protected]
chriS perry [email protected]
DAN WelliNgS [email protected]
01. foreWorD
03. executive SummAry
04. iNtroDuctioN
08. A globAl Survey of AttituDeS to behAviour chANge iNterveNtioNS
16. Why Do couNtrieS Differ?
21. coNcluSioNS
24. refereNceS AND techNicAl Note
1
Acceptable Behaviour - Ipsos MORI
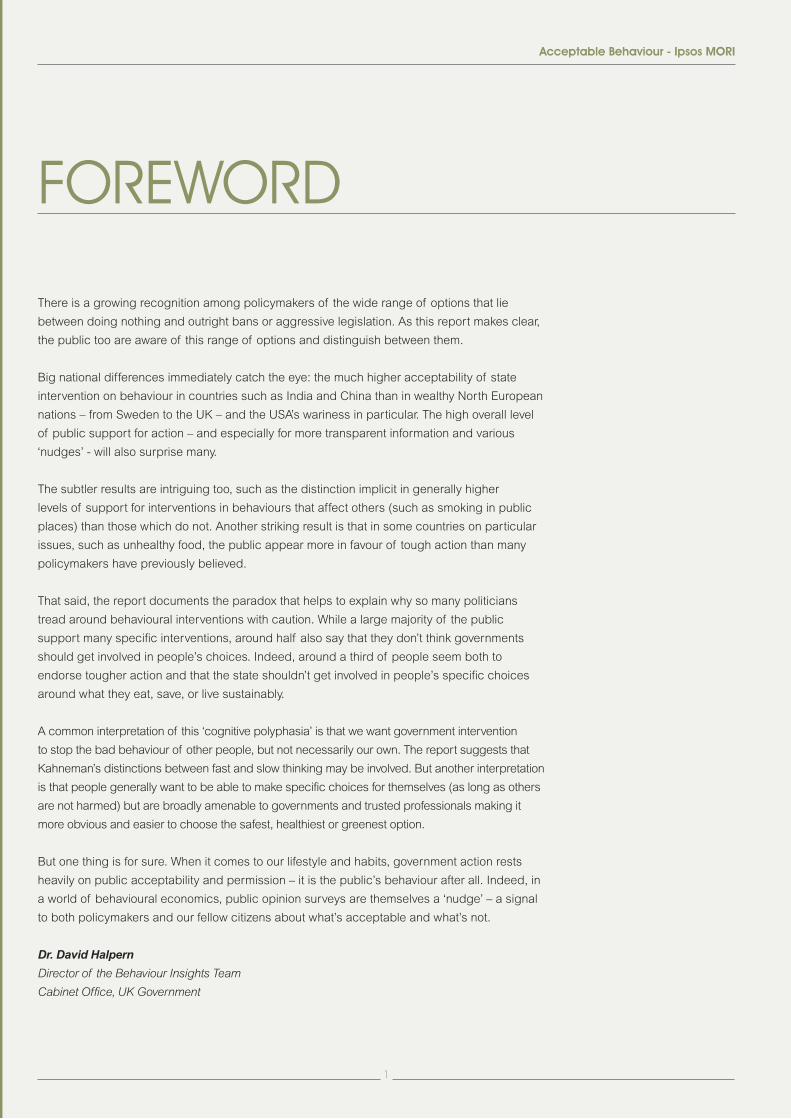
There is a growing recognition among policymakers of the wide range of options that lie
between doing nothing and outright bans or aggressive legislation. As this report makes clear,
the public too are aware of this range of options and distinguish between them.
Big national differences immediately catch the eye: the much higher acceptability of state
intervention on behaviour in countries such as India and China than in wealthy North European
nations – from Sweden to the UK – and the USA’s wariness in particular. The high overall level
of public support for action – and especially for more transparent information and various
‘nudges’ - will also surprise many.
The subtler results are intriguing too, such as the distinction implicit in generally higher
levels of support for interventions in behaviours that affect others (such as smoking in public
places) than those which do not. Another striking result is that in some countries on particular
issues, such as unhealthy food, the public appear more in favour of tough action than many
policymakers have previously believed.
That said, the report documents the paradox that helps to explain why so many politicians
tread around behavioural interventions with caution. While a large majority of the public
support many specific interventions, around half also say that they don’t think governments
should get involved in people’s choices. Indeed, around a third of people seem both to
endorse tougher action and that the state shouldn’t get involved in people’s specific choices
around what they eat, save, or live sustainably.
A common interpretation of this ‘cognitive polyphasia’ is that we want government intervention
to stop the bad behaviour of other people, but not necessarily our own. The report suggests that
Kahneman’s distinctions between fast and slow thinking may be involved. But another interpretation
is that people generally want to be able to make specific choices for themselves (as long as others
are not harmed) but are broadly amenable to governments and trusted professionals making it
more obvious and easier to choose the safest, healthiest or greenest option.
But one thing is for sure. When it comes to our lifestyle and habits, government action rests
heavily on public acceptability and permission – it is the public’s behaviour after all. Indeed, in
a world of behavioural economics, public opinion surveys are themselves a ‘nudge’ – a signal
to both policymakers and our fellow citizens about what’s acceptable and what’s not.
Dr. David Halpern Director of the Behaviour Insights Team
Cabinet Office, UK Government
foreWorD

2
Ipsos MORI - Acceptable Behaviour
3
Acceptable Behaviour - Ipsos MORI
reSeArch
This international research considers
the public acceptability of a range of
measures intended to change behaviour
across four key policy areas. We
investigated support for different levels
of political intervention in the lives of
individuals with regard to:
•smoking;
•eating unhealthy foods;
•saving for retirement;
•and living in an environmentally
sustainable way.
The findings are drawn from the Ipsos
MORI Global @dvisor online survey of
c.18,500 adults across 24 countries.
Fieldwork took place between 4th and
22nd November 2010.
Our data provides insight into how
attitudinal responses to different
behaviour change policies vary with
global cultural differences, and our
analysis sheds light on the factors that
influence these variations.
fiNDiNgS•There is majority support for all types of
intervention across all of the countries
polled, including surprisingly high levels
of support for prohibitive government
legislation, such as outright bans on
smoking and unhealthy foods.
•However, support for interventions
tends to decrease as the “force”
of intervention increases. While the
provision of information or incentives is
largely popular, legislative approaches
receive less support, with acceptability
decreasing as more freedoms are lost.
•The public are much more supportive
of policies directed at businesses – for
example, legislation obliging companies
to promote healthy choices or act in
environmentally sustainable ways – than
they are of similarly forceful interventions
directed at individuals.
•Even though support for interventions is
high across the board, around half still
have a gut instinct against the nanny
state, agreeing that “government should
not get involved” in people’s decisions
about how to behave.
•Globally, there is a significant range
of support for legislation. Support for
partially-restrictive interventions, which
make a behaviour more expensive or
difficult, drops from an average across
policy areas of 88% in China to 46% in
the USA. Outright prohibitions divide
global opinion even more, with 87%
average support in Saudi Arabia and
India but only 33% in the USA.
•The more that a country is in favour of
partially-restrictive interventions, such as
increased taxation, the more it will also
tend to support outright prohibitions,
and vice versa.
•The more prosperous a country is (as
measured by GDP per capita adjusted
for purchasing power), the less likely
its public are to support behaviour
change interventions. But within
countries, wealthier individuals tend
to be more supportive of each level
of behavioural intervention than those
with lower incomes.
•Support for outright bans of behaviours
is particularly high in countries with a
high Power Distance Index (PDI).1 Such
countries tend to have authoritarian
cultures, with centralised, top-down
governmental structures.
•Socio-demographic differences,
where they occur, are generally not as
pronounced as differences between
countries.
•Just because many people practise
an undesirable behaviour, this does
not necessarily feed through into low
support for interventions against this
behaviour. The effect of prevalence on
support of intervention appears to be
both issue- and country-dependent.
executive SummAry
4
Ipsos MORI - Acceptable Behaviour
the importANce of behAviour chANge
Many of the biggest challenges we face
as societies around the world could be
largely solved if people changed their
behaviours and habits.
For example, if we smoked less and
ate more healthily – two of the areas we
investigate in this report – we would do
much to relieve the problems associated
with “lifestyle” diseases such as obesity,
heart disease and type 2 diabetes. In
the USA, for example, treatment of type
2 diabetes – which is almost entirely
preventable – is projected to cost $500
billion per year by 2020.2
Similarly, citizens around the world are
not saving nearly enough to pay for a
much longer retirement. Governments
cannot afford to fill this gap, so policies
that encourage the “right” behaviour at
an individual level are vital.
NuDgiNg AND ShoviNg
In recent years the ideas of “behavioural
economics”3 have been popularised
by a range of books and studies by
academics and policy-makers around the
world. In particular, Thaler and Sunstein’s
Nudge4 created a huge amount of interest
when it was published in 2008, with the
authors going on to advise a number of
governments.
The idea behind Nudge is that it is
possible to influence public behaviour
simply by modifying the environment in
which people conduct their actions and
make their decisions – what Thaler and
Sunstein call the “choice architecture” of
the behaviour.5 Such modifications might
range from changing the wording of a
letter (in order to elicit better responses)
to painting road markings closer together
before a bend (to get drivers to slow
down). These subtle alterations, aimed at
encouraging more desirable behaviour
without coercing the individual, are
known as “nudges.” Thaler and Sunstein
define the target of nudging as “any
aspect of the choice architecture that
alters people’s behaviour in a predictable
way without forbidding any options or
significantly changing their economic
incentives”.6
Behavioural economics is not new:
Daniel Kahneman received a Nobel
prize for his pioneering work in the area,
which he began in the 1970s. Kahneman
summarises behaviour change very
simply, as addressing one key question:
“If we want people to change, how do
we make it easy?” 7 Given the public
policy context of a sovereign debt crisis,
escalating health costs, environmental
threats due to our behaviour and
insufficient saving to support ourselves
in old age, it is no surprise that behaviour
change has become a mainstream topic
for governments around the world.
Of course, governments have always
sought to influence the behaviour of their
citizens – but traditionally policymakers
have used legislation, regulation, or a
financial imperative, such as taxation, in
an attempt to change public behaviour.
This approach – sometimes known as
“shoving”8 – can be characterised as
a more obviously interventionist and
paternalist approach than nudging.
For those concerned with changing
behaviour, the choice between shoving
and nudging is often positioned as a
no-brainer:
…[nudging] proposes a set of seemingly
simple, low cost solutions that do not
require legislation and can be applied to
a wide array of problems arising from our
behaviour.9
However, while nudging promises much,
it is not yet clear that it will always offer
“value for money” or sustained success
in changing behaviour.10 As with most
policy tools, case studies demonstrate a
range of impacts.
there’S NuDgiNg more effectively…
•Retirement: The Save More Tomorrow
(SMT) plan asks people to commit
in advance to allocate a portion of
their future salary increases towards
retirement savings. In the US pilot
average saving rates for SMT plan
participants increased from 3.5 percent
to 11.6 percent over the course of 28
months.11
•Recycling: Since 2008, Marks
and Spencer retail stores in the UK
have managed to encourage pro-
environmental behaviours through the
introduction of a five pence charge for
iNtroDuctioN

5
Acceptable Behaviour - Ipsos MORI
6
Ipsos MORI - Acceptable Behaviour
plastic bags. Researchers at the London
School of Economics found the charge
not only increased reuse of bags but
also encouraged reuse of bags at other
stores where there was no charge. In this
instance a well-placed nudge was able to
“crowd-in” and sustain pro-environmental
behaviour.12
AND NuDgiNg leSS effectively…
•Obesity: New York State responded to
warnings of an “obesity epidemic” by
passing legislation obliging restaurants
to post the calorie content of regular
meal items. However, despite an official
estimate that the law would stop 150,000
New Yorkers from becoming obese it
seems that there was no identifiable
change in the number of calories
purchased after the introduction of
calorie labelling (despite almost 30% of
people asked suggesting the information
had influenced their eating choices).13
•Energy: In Sacramento, California,
homeowners were provided with a
mechanism allowing them to directly
compare electricity bills with their
neighbours. The initiative was intended
to reduce energy consumption through
the introduction of peer comparison.
While energy consumption fell, the
reduction of between 1.2% and 2.1%14
was “modest relative to the hopes being
pinned on it”.15
George Loewenstein, another pioneer in
behavioural economics, suggests that the
insights derived from the field are useful but
limited. He suggests, for example, that the
most effective way to reduce obesity and
promote healthy eating is not to introduce
calorie labelling as in New York, but to
“change the relative price of [healthy] and
[unhealthy] food”.16 Loewenstein’s insight is
summed up by Tyler Cowen who suggests
that “Often there is no nudge-based free
lunch and we need a straightforward relative
price shift”.17
uSiNg the Whole toolKit of meASureS Nudges and shoves are clearly not
mutually exclusive. Indeed, the recent UK
House of Lords report suggests nudges
and shoves may prove more effective
when used together:
In general, the evidence supports
the conclusion that non-regulatory or
regulatory measures used in isolation
are often not likely to be effective and
that usually the most effective means of
changing behaviour at a population level
is to use a range of policy tools, both
regulatory and non-regulatory. Given that
many factors may influence behaviour, this
conclusion is perhaps unsurprising.18
Drink driving provides a case study
example of how the shoves of legislation
and the nudges of communication
campaigns have “combined to change
behaviour quite significantly” over a period
of two decades.19 This example suggests
that tailoring a combination of intervention
types to a specific context over a
significant period of time can provide a
particularly effective and lasting solution
to a behavioural problem.
It is also worth pointing out that there are
a growing number of resources available
to policy-makers and behaviour change
professionals to assist their design of
behaviour change interventions. Some
notable examples would include BJ
Fogg’s Behaviour Grid,20 which provides
a structured way of thinking about types
of behaviour change, and his Behaviour
Model,21 which helps explain why a
given behaviour occurs (or not) by
clearly describing the component parts
of a behaviour. Fogg’s work is already
proving influential, with the Behaviour
Model being used by the World Economic
Forum as their framework for health
behaviour change.22 Another notable
resource is ‘MINDSPACE’,23 a report by
the UK’s Institute for Government, which
discusses the link between behaviours
and interventions, and whose acronym
functions as a helpful checklist of the
most important influences on behaviour.
But before any other aspect of behaviour
change intervention is considered we
would do well to think about public
AR
AU
BE
BR
CA
CN
FR
DE
GB
HU
IN
ID
IT
JP
MX
PL
RU
SA
ROK
ZA
ES
SE
TR
US
7
Acceptable Behaviour - Ipsos MORI
acceptability. The recent UK House of
Lords report on behaviour change notes
that “a measure which does not have
public support is, in general, less likely
to succeed,” citing the adverse effect of
using pricing as the primary mechanism
of alcohol control in Scandinavia.24 When
the public don’t accept a particular
measure it may well not lead to the type
of behaviour change desired. While
public acceptability is clearly not the sole
determining factor of the effectiveness
of an intervention, it is an important
component of the context in which
behaviour change may be attempted.
Studies of public acceptability don’t
just tell us about the popularity of an
intervention (or lack of it), but can also
provide valuable insight into the very
possibility or likely success of attempts
to change behaviour. In particular, it can
indicate the types of intervention that
would be more or less appropriate to the
situation, the level of resistance there is
to changing specific behaviours, and the
length of time a particular strategy may
need before coming to fruition.
Our research considers the issue of
acceptability of interventions across four
key areas for behaviour change, and in
a variety of international contexts. We
compare how opinion about acceptability
varies for different areas of policy and
types of behaviour, and we investigate
how support for behaviour change
mechanisms varies with the type of
intervention. Our focus here was not so
much on the relative acceptability of
various sophisticated and finely-tuned
ways of altering the choice architecture
- after all, it is the purpose of these tools
to be as unobtrusive as possible. Rather,
we were primarily interested in the effect
on public opinion of the “force” of a
behavioural intervention. Ultimately, we
wished to understand how acceptability
of a wide range of intervention levels
varies between nations. As such, we
asked about the broad spectrum of
mechanisms available to policy-makers,
including regulatory and non-regulatory
tools – both shoves and nudges.
Naturally, we acknowledge that asking
people what they think would be an
acceptable action for government can
only take us so far in understanding what
people would actually do. Nevertheless,
we think there is significant value in a
study that compares and contrasts these
attitudinal responses across a wide range
of countries, policies and interventions.
It is the first study of its type that we’re
aware of, and the findings provide insight
into the specific national reactions that
individual governments might expect.
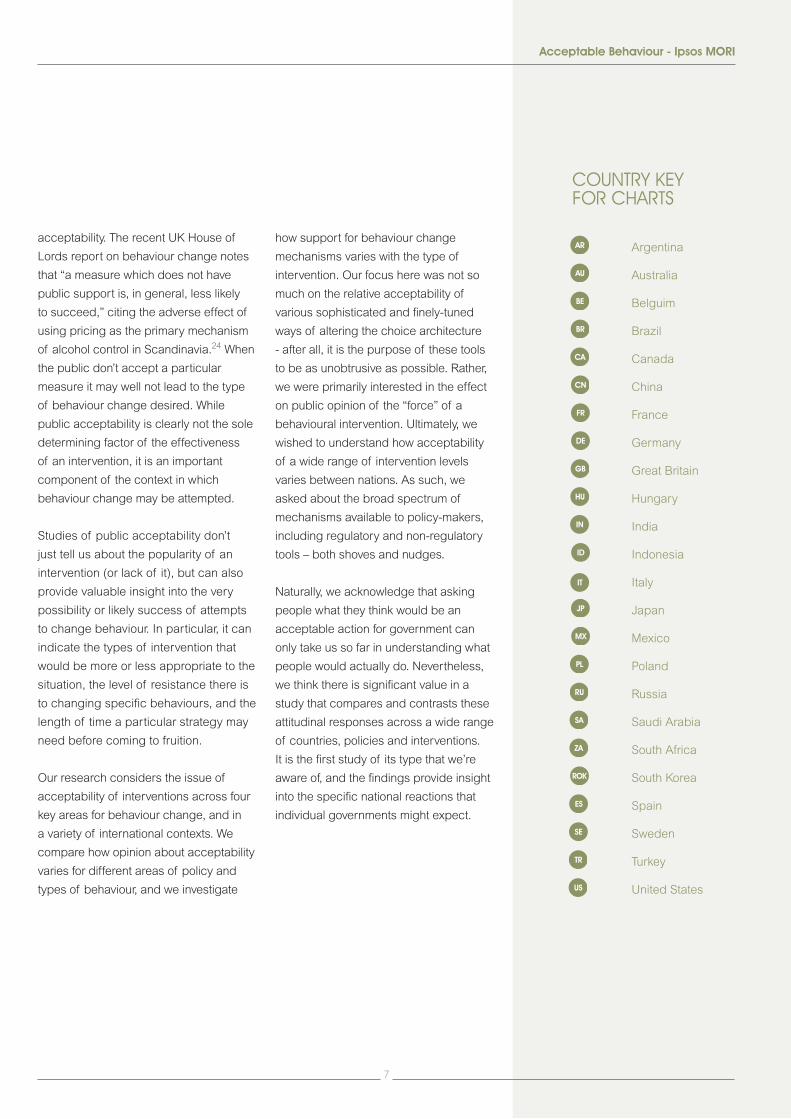
Argentina
Australia
Belguim
Brazil
Canada
China
France
Germany
Great Britain
Hungary
India
Indonesia
Italy
Japan
Mexico
Poland
Russia
Saudi Arabia
South Africa
South Korea
Spain
Sweden
Turkey
United States
couNtry Key for chArtS
8
Ipsos MORI - Acceptable Behaviour
A globAl Survey of AttituDeS to behAviour chANge iNterveNtioNS
9
Acceptable Behaviour - Ipsos MORI
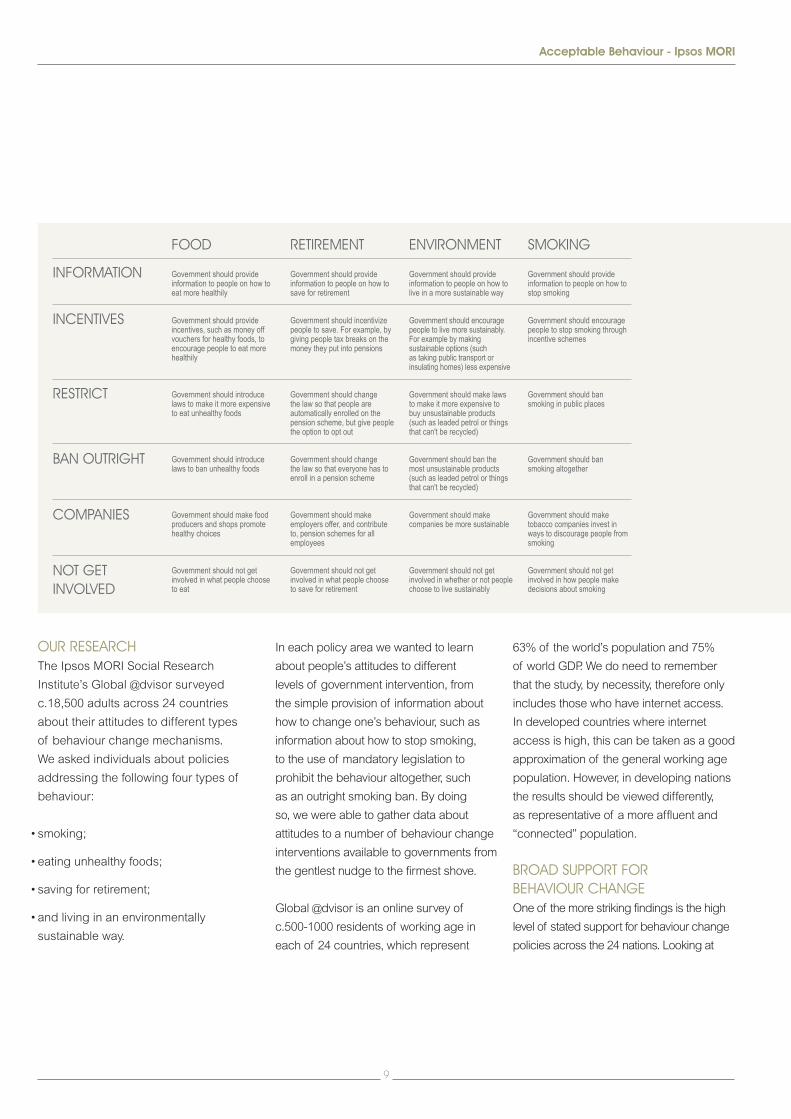
our reSeArchThe Ipsos MORI Social Research
Institute’s Global @dvisor surveyed
c.18,500 adults across 24 countries
about their attitudes to different types
of behaviour change mechanisms.
We asked individuals about policies
addressing the following four types of
behaviour:
•smoking;
•eating unhealthy foods;
•saving for retirement;
•and living in an environmentally
sustainable way.
In each policy area we wanted to learn
about people’s attitudes to different
levels of government intervention, from
the simple provision of information about
how to change one’s behaviour, such as
information about how to stop smoking,
to the use of mandatory legislation to
prohibit the behaviour altogether, such
as an outright smoking ban. By doing
so, we were able to gather data about
attitudes to a number of behaviour change
interventions available to governments from
the gentlest nudge to the firmest shove.
Global @dvisor is an online survey of
c.500-1000 residents of working age in
each of 24 countries, which represent
63% of the world’s population and 75%
of world GDP. We do need to remember
that the study, by necessity, therefore only
includes those who have internet access.
In developed countries where internet
access is high, this can be taken as a good
approximation of the general working age
population. However, in developing nations
the results should be viewed differently,
as representative of a more affluent and
“connected” population.
broAD Support for behAviour chANgeOne of the more striking findings is the high
level of stated support for behaviour change
policies across the 24 nations. Looking at
fooD retiremeNt eNviroNmeNt SmoKiNg
iNformAtioN Government should provide information to people on how to eat more healthily
Government should provide information to people on how to save for retirement
Government should provide information to people on how to live in a more sustainable way
Government should provide information to people on how to stop smoking
iNceNtiveS Government should provide incentives, such as money off vouchers for healthy foods, to encourage people to eat more healthily
Government should incentivize people to save. For example, by giving people tax breaks on the money they put into pensions
Government should encourage people to live more sustainably. For example by making sustainable options (such as taking public transport or insulating homes) less expensive
Government should encourage people to stop smoking through incentive schemes
reStrict Government should introduce laws to make it more expensive to eat unhealthy foods
Government should change the law so that people are automatically enrolled on the pension scheme, but give people the option to opt out
Government should make laws to make it more expensive to buy unsustainable products (such as leaded petrol or things that can't be recycled)
Government should ban smoking in public places
bAN outright Government should introduce laws to ban unhealthy foods
Government should change the law so that everyone has to enroll in a pension scheme
Government should ban the most unsustainable products (such as leaded petrol or things that can't be recycled)
Government should ban smoking altogether
compANieS Government should make food producers and shops promote healthy choices
Government should make employers offer, and contribute to, pension schemes for all employees
Government should make companies be more sustainable
Government should make tobacco companies invest in ways to discourage people from smoking
Not get iNvolveD
Government should not get involved in what people choose to eat
Government should not get involved in what people choose to save for retirement
Government should not get involved in whether or not people choose to live sustainably
Government should not get involved in how people make decisions about smoking
10
Ipsos MORI - Acceptable Behaviour
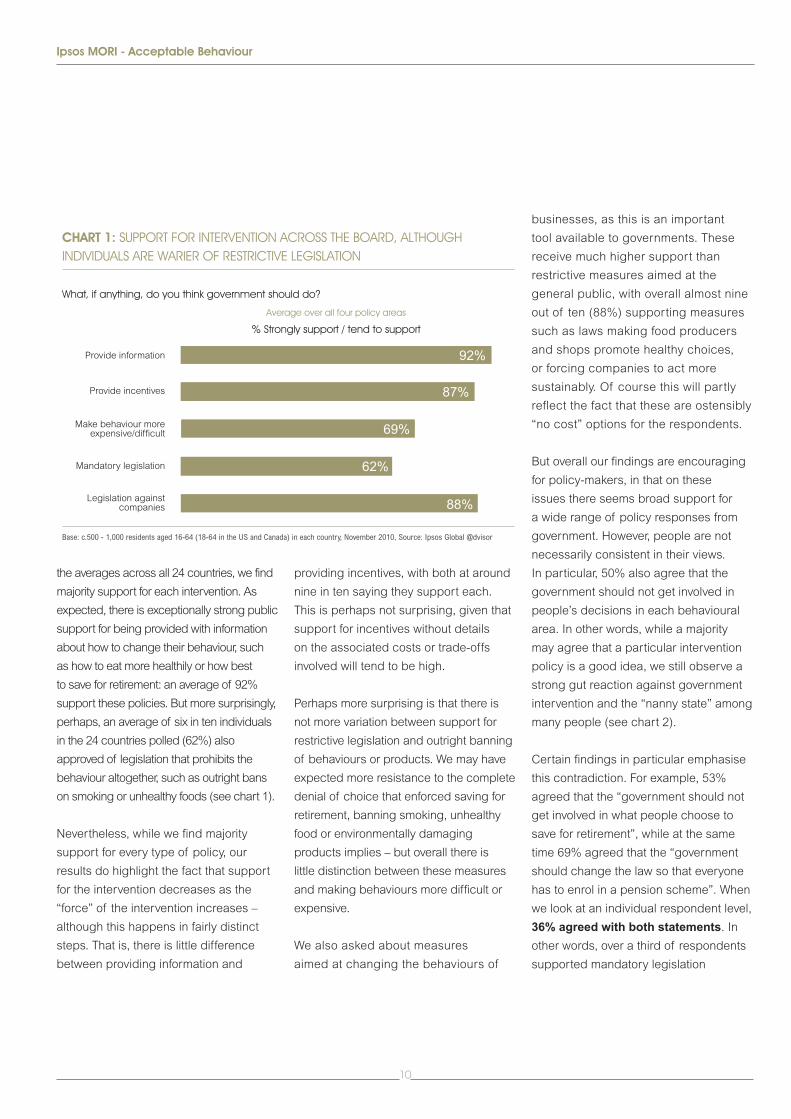
the averages across all 24 countries, we find
majority support for each intervention. As
expected, there is exceptionally strong public
support for being provided with information
about how to change their behaviour, such
as how to eat more healthily or how best
to save for retirement: an average of 92%
support these policies. But more surprisingly,
perhaps, an average of six in ten individuals
in the 24 countries polled (62%) also
approved of legislation that prohibits the
behaviour altogether, such as outright bans
on smoking or unhealthy foods (see chart 1).
Nevertheless, while we find majority
support for every type of policy, our
results do highlight the fact that support
for the intervention decreases as the
“force” of the intervention increases –
although this happens in fairly distinct
steps. That is, there is little difference
between providing information and
providing incentives, with both at around
nine in ten saying they support each.
This is perhaps not surprising, given that
support for incentives without details
on the associated costs or trade-offs
involved will tend to be high.
Perhaps more surprising is that there is
not more variation between support for
restrictive legislation and outright banning
of behaviours or products. We may have
expected more resistance to the complete
denial of choice that enforced saving for
retirement, banning smoking, unhealthy
food or environmentally damaging
products implies – but overall there is
little distinction between these measures
and making behaviours more difficult or
expensive.
We also asked about measures
aimed at changing the behaviours of
businesses, as this is an important
tool available to governments. These
receive much higher support than
restrictive measures aimed at the
general public, with overall almost nine
out of ten (88%) supporting measures
such as laws making food producers
and shops promote healthy choices,
or forcing companies to act more
sustainably. Of course this will partly
reflect the fact that these are ostensibly
“no cost” options for the respondents.
But overall our findings are encouraging
for policy-makers, in that on these
issues there seems broad support for
a wide range of policy responses from
government. However, people are not
necessarily consistent in their views.
In particular, 50% also agree that the
government should not get involved in
people’s decisions in each behavioural
area. In other words, while a majority
may agree that a particular intervention
policy is a good idea, we still observe a
strong gut reaction against government
intervention and the “nanny state” among
many people (see chart 2).
Certain findings in particular emphasise
this contradiction. For example, 53%
agreed that the “government should not
get involved in what people choose to
save for retirement”, while at the same
time 69% agreed that the “government
should change the law so that everyone
has to enrol in a pension scheme”. When
we look at an individual respondent level,
36%agreedwithbothstatements. In
other words, over a third of respondents
supported mandatory legislation
What, if anything, do you think government should do?
% Strongly support / tend to support
CHART 1: SUPPORT FOR INTERVENTION ACROSS THE BOARD, ALTHOUGH INDIVIDUALS ARE WARIER OF RESTRICTIVE LEGISLATION
Base: c.500 - 1,000 residents aged 16-64 (18-64 in the US and Canada) in each country, November 2010, Source: Ipsos Global @dvisor
Legislation againstcompanies
Mandatory legislation
Make behaviour moreexpensive/difficult
Provide incentives
Provide information 92%
87%
69%
62%
88%
Average over all four policy areas
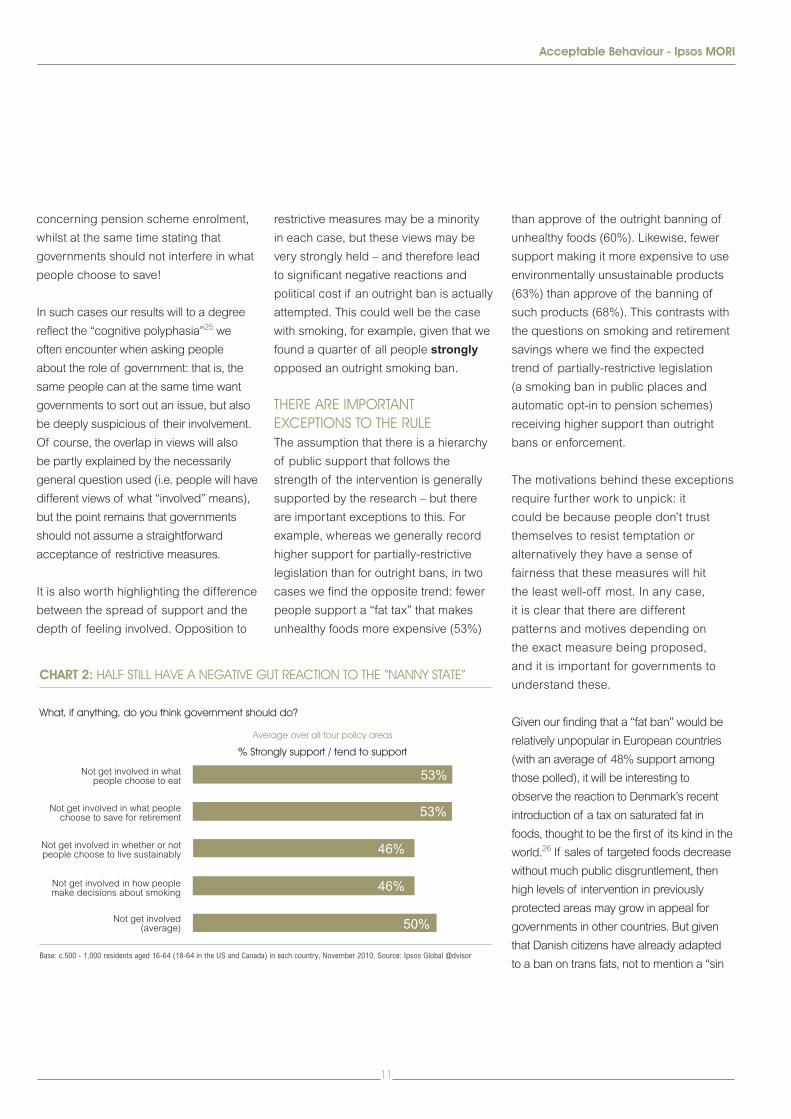
What, if anything, do you think government should do?
CHART 2: HALF STILL HAVE A NEGATIVE GUT REACTION TO THE “NANNY STATE”
Base: c.500 - 1,000 residents aged 16-64 (18-64 in the US and Canada) in each country, November 2010, Source: Ipsos Global @dvisor
Not get involved(average)
Not get involved in how peoplemake decisions about smoking
Not get involved in whatpeople choose to eat
Not get involved in what peoplechoose to save for retirement
Not get involved in whether or notpeople choose to live sustainably
53%
53%
46%
46%
50%
% Strongly support / tend to support
Average over all four policy areas
11
Acceptable Behaviour - Ipsos MORI
concerning pension scheme enrolment,
whilst at the same time stating that
governments should not interfere in what
people choose to save!
In such cases our results will to a degree
reflect the “cognitive polyphasia”25 we
often encounter when asking people
about the role of government: that is, the
same people can at the same time want
governments to sort out an issue, but also
be deeply suspicious of their involvement.
Of course, the overlap in views will also
be partly explained by the necessarily
general question used (i.e. people will have
different views of what “involved” means),
but the point remains that governments
should not assume a straightforward
acceptance of restrictive measures.
It is also worth highlighting the difference
between the spread of support and the
depth of feeling involved. Opposition to
restrictive measures may be a minority
in each case, but these views may be
very strongly held – and therefore lead
to significant negative reactions and
political cost if an outright ban is actually
attempted. This could well be the case
with smoking, for example, given that we
found a quarter of all people strongly
opposed an outright smoking ban.
there Are importANt exceptioNS to the ruleThe assumption that there is a hierarchy
of public support that follows the
strength of the intervention is generally
supported by the research – but there
are important exceptions to this. For
example, whereas we generally record
higher support for partially-restrictive
legislation than for outright bans, in two
cases we find the opposite trend: fewer
people support a “fat tax” that makes
unhealthy foods more expensive (53%)
than approve of the outright banning of
unhealthy foods (60%). Likewise, fewer
support making it more expensive to use
environmentally unsustainable products
(63%) than approve of the banning of
such products (68%). This contrasts with
the questions on smoking and retirement
savings where we find the expected
trend of partially-restrictive legislation
(a smoking ban in public places and
automatic opt-in to pension schemes)
receiving higher support than outright
bans or enforcement.
The motivations behind these exceptions
require further work to unpick: it
could be because people don’t trust
themselves to resist temptation or
alternatively they have a sense of
fairness that these measures will hit
the least well-off most. In any case,
it is clear that there are different
patterns and motives depending on
the exact measure being proposed,
and it is important for governments to
understand these.
Given our finding that a “fat ban” would be
relatively unpopular in European countries
(with an average of 48% support among
those polled), it will be interesting to
observe the reaction to Denmark’s recent
introduction of a tax on saturated fat in
foods, thought to be the first of its kind in the
world.26 If sales of targeted foods decrease
without much public disgruntlement, then
high levels of intervention in previously
protected areas may grow in appeal for
governments in other countries. But given
that Danish citizens have already adapted
to a ban on trans fats, not to mention a “sin
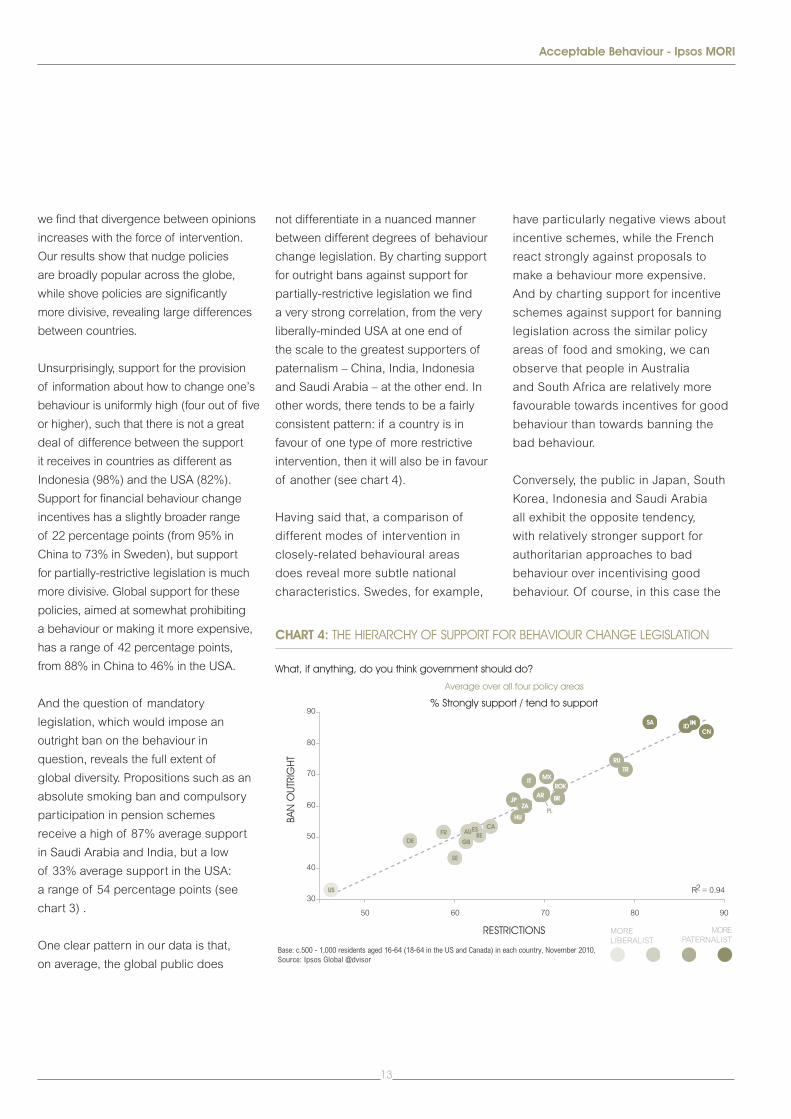
Base: c.500 - 1,000 residents aged 16-64 (18-64 in the US and Canada) in each country, November 2010, Source: Ipsos Global @dvisor
SA IN ID CN RU TR MX IT PL AR BR JP ZA HU CA ES AU FR BE DE GB SE USROK
87 87 86 84
7572 69 68
64 63 63 62 6056
53 53 52 52 51 49 4943
33
66
CHART 3: SUPPORT FOR OUTRIGHT PROHIBITION SHOWS THE FULL EXTENT OFPOLITICAL DIVERSITY
Government should ban...
% Strongly support / tend to support
Average over all four policy areas
12
Ipsos MORI - Acceptable Behaviour
tax” on sugary items, such as sweets and
fizzy drinks, the context in this country may
differ significantly from that in many of the
countries in our poll.
StroNger iNterveNtioNS DiviDe globAl opiNioN
Our study also makes clear that there are
marked differences between countries
in levels of support for different types of
intervention. This data emphasises the
diverse challenges faced by policy-makers
across the world in their promotion of
behaviour change, but they also provide
insight into the varied factors that drive
opinion about behaviour change policies.
Looking at the differences between the
24 nations in our Global @dvisor survey,
RESTRICTIONS
Base: c.500 - 1,000 residents aged 16-64 (18-64 in the US and Canada) in each country, November 2010, Source: Ipsos Global @dvisor
BAN
OUT
RIG
HT
30
40
50
50 60 70 80 90
60
70
80
90
R2 = 0.94
PL
ROK
BR
MXIT
ZAJP
HUCA
BEESAU
GBFR
SE
DE
US
ININ
AR
RUTR
SA IDCN
MORELIBERALIST
MOREPATERNALIST
CHART 4: THE HIERARCHY OF SUPPORT FOR BEHAVIOUR CHANGE LEGISLATION
What, if anything, do you think government should do?
% Strongly support / tend to support
Average over all four policy areas
13
Acceptable Behaviour - Ipsos MORI
we find that divergence between opinions
increases with the force of intervention.
Our results show that nudge policies
are broadly popular across the globe,
while shove policies are significantly
more divisive, revealing large differences
between countries.
Unsurprisingly, support for the provision
of information about how to change one’s
behaviour is uniformly high (four out of five
or higher), such that there is not a great
deal of difference between the support
it receives in countries as different as
Indonesia (98%) and the USA (82%).
Support for financial behaviour change
incentives has a slightly broader range
of 22 percentage points (from 95% in
China to 73% in Sweden), but support
for partially-restrictive legislation is much
more divisive. Global support for these
policies, aimed at somewhat prohibiting
a behaviour or making it more expensive,
has a range of 42 percentage points,
from 88% in China to 46% in the USA.
And the question of mandatory
legislation, which would impose an
outright ban on the behaviour in
question, reveals the full extent of
global diversity. Propositions such as an
absolute smoking ban and compulsory
participation in pension schemes
receive a high of 87% average support
in Saudi Arabia and India, but a low
of 33% average support in the USA:
a range of 54 percentage points (see
chart 3) .
One clear pattern in our data is that,
on average, the global public does
not differentiate in a nuanced manner
between different degrees of behaviour
change legislation. By charting support
for outright bans against support for
partially-restrictive legislation we find
a very strong correlation, from the very
liberally-minded USA at one end of
the scale to the greatest supporters of
paternalism – China, India, Indonesia
and Saudi Arabia – at the other end. In
other words, there tends to be a fairly
consistent pattern: if a country is in
favour of one type of more restrictive
intervention, then it will also be in favour
of another (see chart 4).
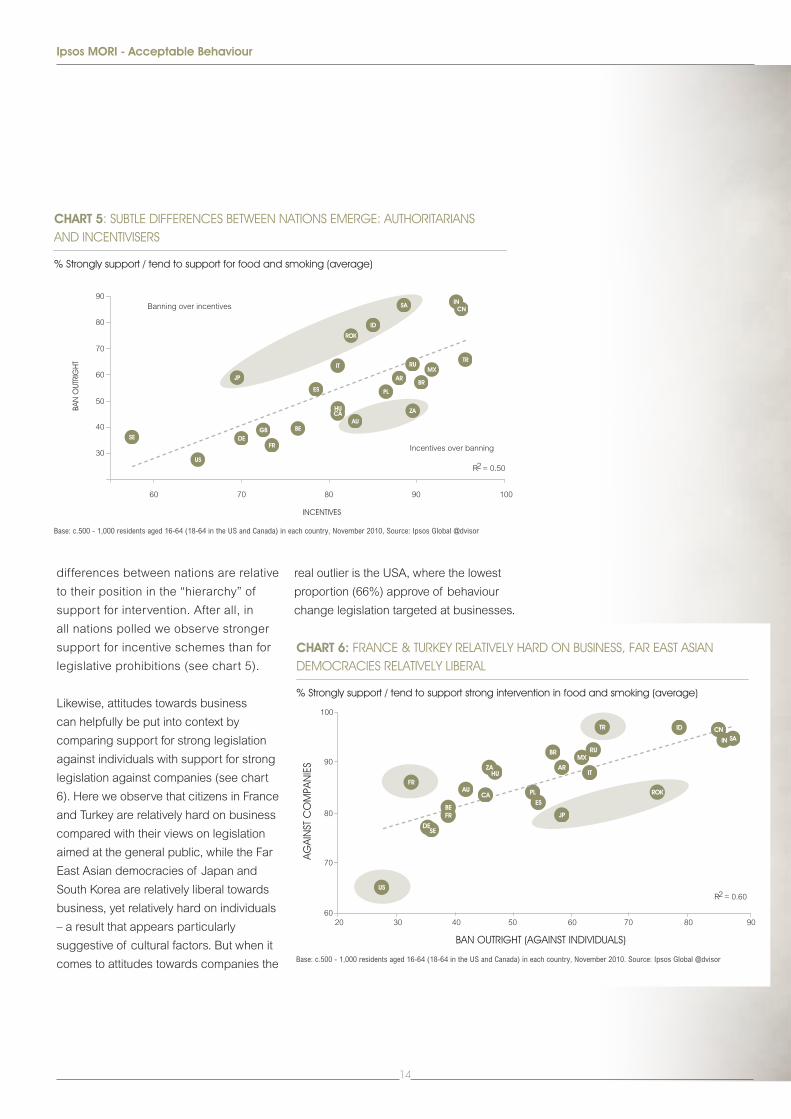
Having said that, a comparison of
different modes of intervention in
closely-related behavioural areas
does reveal more subtle national
characteristics. Swedes, for example,
have particularly negative views about
incentive schemes, while the French
react strongly against proposals to
make a behaviour more expensive.
And by charting support for incentive
schemes against support for banning
legislation across the similar policy
areas of food and smoking, we can
observe that people in Australia
and South Africa are relatively more
favourable towards incentives for good
behaviour than towards banning the
bad behaviour.
Conversely, the public in Japan, South
Korea, Indonesia and Saudi Arabia
all exhibit the opposite tendency,
with relatively stronger support for
authoritarian approaches to bad
behaviour over incentivising good
behaviour. Of course, in this case the
Base: c.500 - 1,000 residents aged 16-64 (18-64 in the US and Canada) in each country, November 2010, Source: Ipsos Global @dvisor
CHART 5: SUBTLE DIFFERENCES BETWEEN NATIONS EMERGE: AUTHORITARIANSAND INCENTIVISERS
% Strongly support / tend to support for food and smoking (average)
INCENTIVES
Banning over incentives
Incentives over banning
BAN
OUT
RIG
HT
60 70 80 90 100
AR
AUBE
BR
CA
FRDE
GB
ID
IT
JP
PL
RU
SA
ROK
ZA
ES
SE
TR
US
90
70
50
30
40
60
80
HU
CNIN
MX
R2 = 0.50
PL
ESCA
US
Base: c.500 - 1,000 residents aged 16-64 (18-64 in the US and Canada) in each country, November 2010. Source: Ipsos Global @dvisor
CHART 6: FRANCE & TURKEY RELATIVELY HARD ON BUSINESS, FAR EAST ASIANDEMOCRACIES RELATIVELY LIBERAL
% Strongly support / tend to support strong intervention in food and smoking (average)
BAN OUTRIGHT (AGAINST INDIVIDUALS)
AGAI
NST
CO
MPA
NIE
S
100
90
80
70
6020 30 5040 7060 80 90
FRAU
ZA
SEDE
BEFR
HU
BR
AR
JP
IT
MXRU
TR ID
ROK
CNSAIN
R2 = 0.60
14
Ipsos MORI - Acceptable Behaviour
differences between nations are relative
to their position in the “hierarchy” of
support for intervention. After all, in
all nations polled we observe stronger
support for incentive schemes than for
legislative prohibitions (see chart 5).
Likewise, attitudes towards business
can helpfully be put into context by
comparing support for strong legislation
against individuals with support for strong
legislation against companies (see chart
6). Here we observe that citizens in France
and Turkey are relatively hard on business
compared with their views on legislation
aimed at the general public, while the Far
East Asian democracies of Japan and
South Korea are relatively liberal towards
business, yet relatively hard on individuals
– a result that appears particularly
suggestive of cultural factors. But when it
comes to attitudes towards companies the
real outlier is the USA, where the lowest
proportion (66%) approve of behaviour
change legislation targeted at businesses.

Acceptable Behaviour - Ipsos MORI
16
Ipsos MORI - Acceptable Behaviour
Understanding variations in acceptability
of behaviour change interventions across
different countries is useful – but it’s also
important to consider what underlying
factors may be causing these. This section
looks at some possible explanations,
revealing a significant association between
public acceptability and wealth, but also
with the political culture and distribution of
power within a society. We also demonstrate
that there is little relationship between two
other indicators – trust in government and
income inequality – which, prior to the
research, we might have expected would
have had some clear association with public
acceptability. Finally, we outline how views
vary by demographic sub-groups, looking
across the whole sample for patterns in how
different types of people respond.
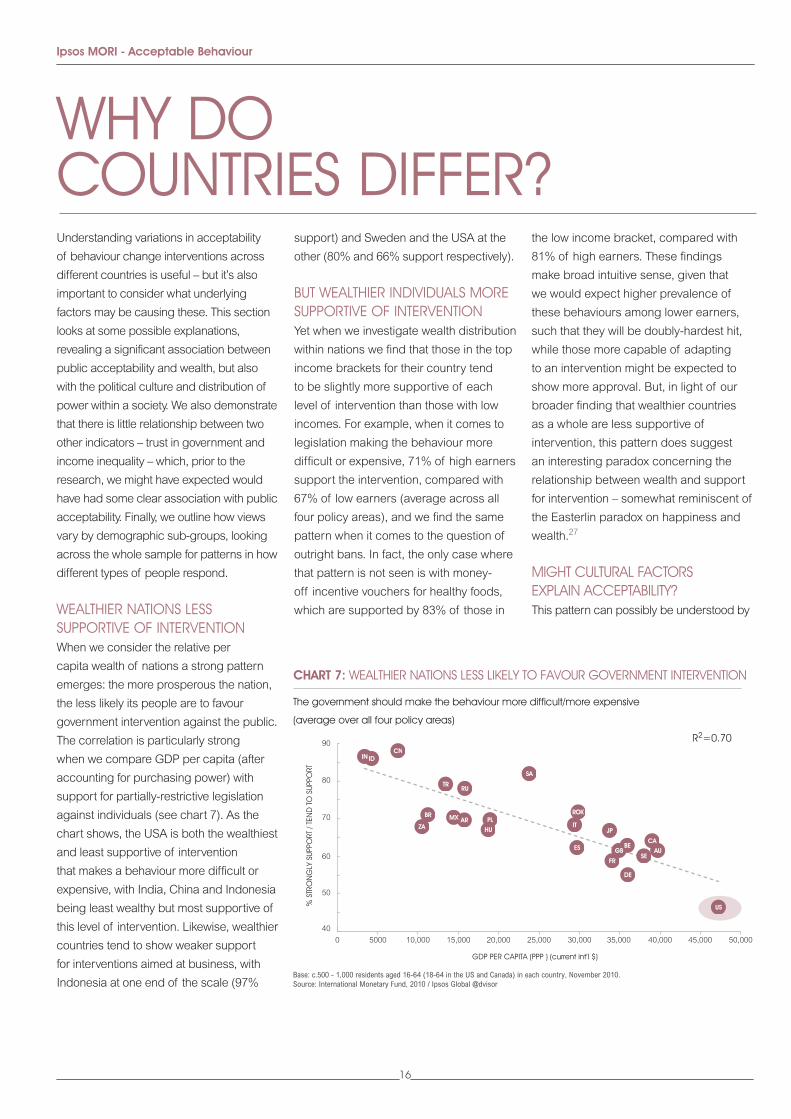
WeAlthier NAtioNS leSS Supportive of iNterveNtioNWhen we consider the relative per
capita wealth of nations a strong pattern
emerges: the more prosperous the nation,
the less likely its people are to favour
government intervention against the public.
The correlation is particularly strong
when we compare GDP per capita (after
accounting for purchasing power) with
support for partially-restrictive legislation
against individuals (see chart 7). As the
chart shows, the USA is both the wealthiest
and least supportive of intervention
that makes a behaviour more difficult or
expensive, with India, China and Indonesia
being least wealthy but most supportive of
this level of intervention. Likewise, wealthier
countries tend to show weaker support
for interventions aimed at business, with
Indonesia at one end of the scale (97%
support) and Sweden and the USA at the
other (80% and 66% support respectively).
but WeAlthier iNDiviDuAlS more Supportive of iNterveNtioNYet when we investigate wealth distribution
within nations we find that those in the top
income brackets for their country tend
to be slightly more supportive of each
level of intervention than those with low
incomes. For example, when it comes to
legislation making the behaviour more
difficult or expensive, 71% of high earners
support the intervention, compared with
67% of low earners (average across all
four policy areas), and we find the same
pattern when it comes to the question of
outright bans. In fact, the only case where
that pattern is not seen is with money-
off incentive vouchers for healthy foods,
which are supported by 83% of those in
the low income bracket, compared with
81% of high earners. These findings
make broad intuitive sense, given that
we would expect higher prevalence of
these behaviours among lower earners,
such that they will be doubly-hardest hit,
while those more capable of adapting
to an intervention might be expected to
show more approval. But, in light of our
broader finding that wealthier countries
as a whole are less supportive of
intervention, this pattern does suggest
an interesting paradox concerning the
relationship between wealth and support
for intervention – somewhat reminiscent of
the Easterlin paradox on happiness and
wealth.27
might culturAl fActorS explAiN AcceptAbility?This pattern can possibly be understood by
Why Do couNtrieS Differ?
Base: c.500 - 1,000 residents aged 16-64 (18-64 in the US and Canada) in each country, November 2010. Source: International Monetary Fund, 2010 / Ipsos Global @dvisor
CHART 7: WEALTHIER NATIONS LESS LIKELY TO FAVOUR GOVERNMENT INTERVENTION
The government should make the behaviour more difficult/more expensive
(average over all four policy areas)
GDP PER CAPITA (PPP ) (current int’l $)
% S
TRO
NG
LY S
UPPO
RT /
TEN
D T
O S
UPPO
RT
JP
ES
IT
ROK
SA
5000 10,000 15,000 20,000 25,000 30,000 35,000 40,000 45,000 50,0000
40
50
60
70
80
90
AU
BR
CA
CN
FR
DE
HU
RU
ZA
SE
TR
US
ID
ARMX PL
GBBE
IN
R2=0.70
16
17
Acceptable Behaviour - Ipsos MORI
investigating other cultural factors behind
the acceptability of intervention. Identifying
and measuring cultural characteristics is
not straightforward, but there are a few
useful measures we have examined, which
suggest a strong relationship between
national public acceptability and the political
and social power structures of the state.
Geert Hofstede’s ‘Power Distance Index’
(PDI) is a measure of the extent to which
members of society accept and expect
that power is distributed unequally.28
The index was developed with particular
reference to cultures within businesses,
but includes wider measures around class
and political history. A high power distance
will indicate that inequality due to power
or status has come to be entrenched.
Cultures with a high PDI tend towards
centralised, top-down control, whereas low
power distance implies greater equality
and empowerment of citizens.
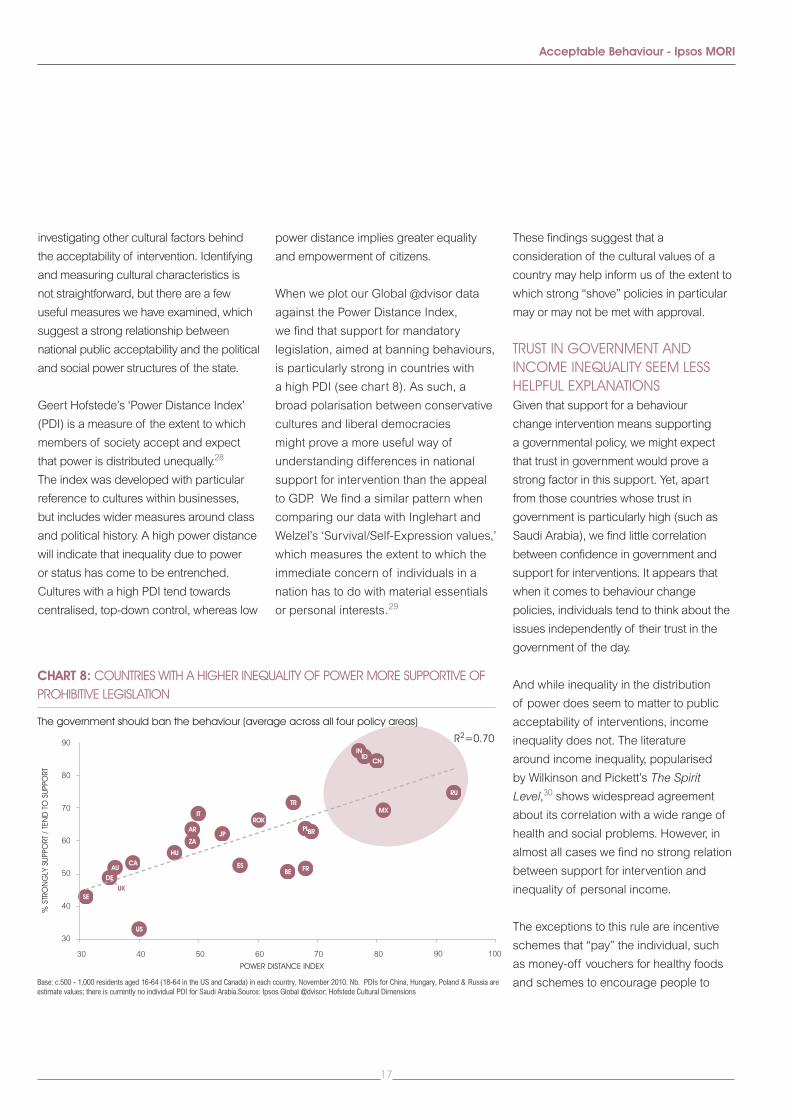
When we plot our Global @dvisor data
against the Power Distance Index,
we find that support for mandatory
legislation, aimed at banning behaviours,
is particularly strong in countries with
a high PDI (see chart 8). As such, a
broad polarisation between conservative
cultures and liberal democracies
might prove a more useful way of
understanding differences in national
support for intervention than the appeal
to GDP. We find a similar pattern when
comparing our data with Inglehart and
Welzel’s ‘Survival/Self-Expression values,’
which measures the extent to which the
immediate concern of individuals in a
nation has to do with material essentials
or personal interests.29
These findings suggest that a
consideration of the cultural values of a
country may help inform us of the extent to
which strong “shove” policies in particular
may or may not be met with approval.
truSt iN goverNmeNt AND iNcome iNequAlity Seem leSS helpful explANAtioNSGiven that support for a behaviour
change intervention means supporting
a governmental policy, we might expect
that trust in government would prove a
strong factor in this support. Yet, apart
from those countries whose trust in
government is particularly high (such as
Saudi Arabia), we find little correlation
between confidence in government and
support for interventions. It appears that
when it comes to behaviour change
policies, individuals tend to think about the
issues independently of their trust in the
government of the day.
And while inequality in the distribution
of power does seem to matter to public
acceptability of interventions, income
inequality does not. The literature
around income inequality, popularised
by Wilkinson and Pickett’s The Spirit
Level,30 shows widespread agreement
about its correlation with a wide range of
health and social problems. However, in
almost all cases we find no strong relation
between support for intervention and
inequality of personal income.
The exceptions to this rule are incentive
schemes that “pay” the individual, such
as money-off vouchers for healthy foods
and schemes to encourage people to Base: c.500 - 1,000 residents aged 16-64 (18-64 in the US and Canada) in each country, November 2010. Nb. PDIs for China, Hungary, Poland & Russia are estimate values; there is currently no individual PDI for Saudi Arabia.Source: Ipsos Global @dvisor; Hofstede Cultural Dimensions
CHART 8: COUNTRIES WITH A HIGHER INEQUALITY OF POWER MORE SUPPORTIVE OF PROHIBITIVE LEGISLATION
The government should ban the behaviour (average across all four policy areas)
POWER DISTANCE INDEX
% S
TRO
NG
LY S
UPPO
RT /
TEN
D T
O S
UPPO
RT
AR
AU BECA
CN
FR
HU
ID
IT
JP
MX
PL
RU
ZA
ROK
ES
SE
TR
US
30
30
40
50
60
70
80
90
40 50 60 70 80 90 100
DE
UK
BR
IN
R2=0.70
18
Ipsos MORI - Acceptable Behaviour
stop smoking. There we find that the
nations with the highest measured levels
of income inequality – Mexico, Argentina,
Brazil and South Africa31 – are also among
those showing the strongest support for
directly-rewarding financial incentives. As
such, in these countries, it appears that a
financial aid to help narrow the difference
in opportunities between the ‘haves’
and the ‘have nots’ would be particularly
welcome. Nevertheless, more generally,
inequality of income does not help explain
why support for intervention decreases
with wealth.
there Are Some coNSiSteNt vAriAtioNS by geNDer AND Age
If understanding the overall cultural and
political climate of the nation is the first
challenge for policy makers interested
in behaviour change, then the second is
that of getting to grips with the diversity
of the population. As we have seen,
attitudes towards intervention can differ
substantially by country, but our Global
@dvisor data also reveal differences
by socio-demographic group, such as
between high- and low-income groups,
as discussed above. It is important to
note, however, that we are generally
dealing with small percentage point
differences here – socio-demographic
differences, where they occur, are
generally not as pronounced as
differences between countries.
This lack of difference is interesting in
itself, since in policy areas where we might
expect pronounced socio-demographic
differences there is often no significant
difference in opinion. When it comes to
policies about retirement, for example,
we might expect younger people to be
less supportive of policies forcing them to
save for a pension, but in fact we find little
difference in support by age – globally,
68% of those aged under 35 support
mandatory enrolment in a pension scheme,
compared with 70% of 50-64 year olds.
Nevertheless, the data do reveal small,
clear differences in attitudes to levels
of intervention depending on people’s
genders and ages, on their incomes, and
on their education and employment status.
These kinds of demographic differences
are often consistent across countries.
For instance, when it comes to the
question of incentives to eat more
healthily, similar gender differences exist
across different countries. In Saudi Arabia,
where the population tends to be strongly
in favour of government intervention, 79%
of women strongly support government
incentives to eat healthily, versus 64%
of men. In the UK, where support for
intervention generally tends to be much
lower, 35% of women strongly support
healthy eating incentives, versus 25% of
men. This question of money-off vouchers
for healthy foods also divides young and
old, with 86% of under-35s supporting
this proposal, and 74% of 50-64 year-olds
in approval.
Indeed, while differences in support
for intervention by gender tend to be
minimal, greater divergence in opinion
can be observed between age-groups.
Older people, for example, are generally
more supportive of interventions that ban
the behaviour in question outright. The
exception is the case of smoking: when
it comes to smoking, younger people
are more supportive of every level of
intervention than those in the oldest age
bracket, with disagreement growing as
the “force” of intervention increases.
While 56% of under-35s support an
outright smoking ban, just 45% of 50-64
year-olds are in favour.
prevAleNce mAy be A fActor – but Not AlWAySThese age patterns are likely to reflect
differences in the cultural outlook of
different generations – but they will
also reflect the prevalence of the “bad”
behaviour that we’re examining. Our
findings suggest that, when it comes
to some behaviours, prevalence may
explain support – but not in all cases.
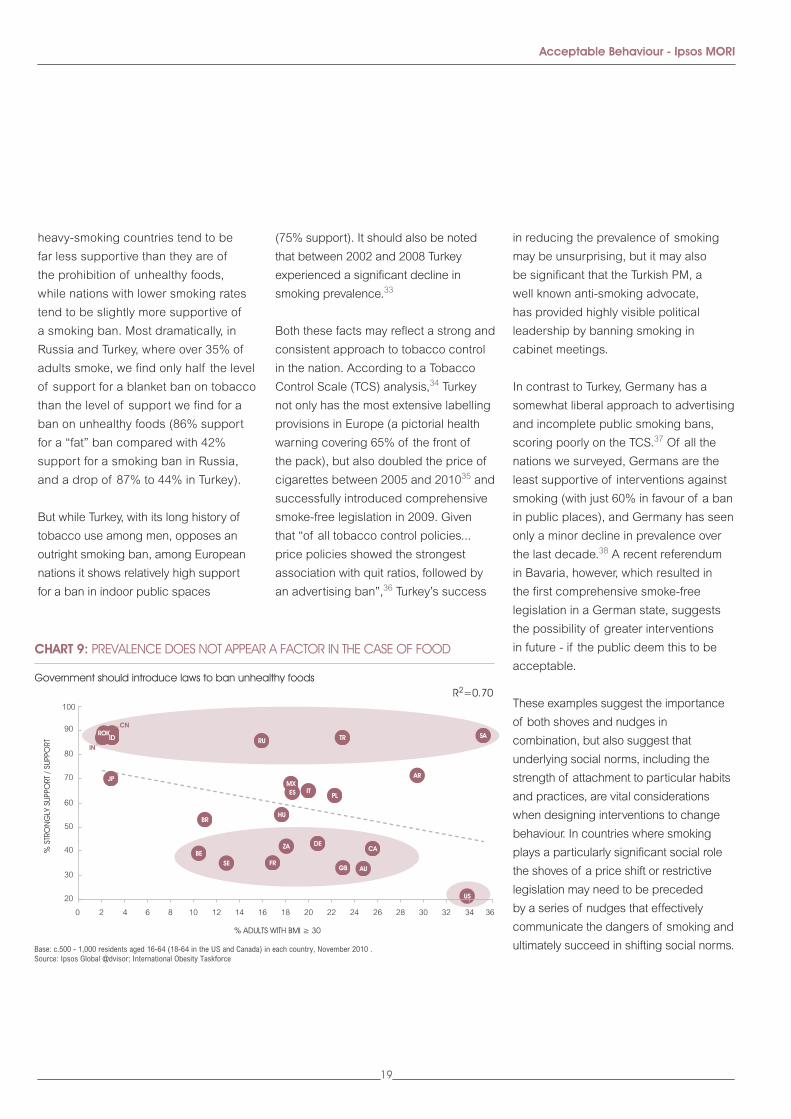
No proposition divides nations more than
that of “The government should introduce
laws to ban unhealthy foods.” While 89%
of Chinese and Korean citizens support
this statement, just 21% of Americans
are in favour: a range of 68 percentage
points. But in this case, prevalence
of obesity, seems to have little effect
on support. For example, just 13% of
Swedes are obese, but they support
a “fat ban” hardly any more than do
their significantly more obese American
counterparts (34% obesity).32
In contrast, when it comes to the
question of an outright smoking ban,
18
19
Acceptable Behaviour - Ipsos MORI
heavy-smoking countries tend to be
far less supportive than they are of
the prohibition of unhealthy foods,
while nations with lower smoking rates
tend to be slightly more supportive of
a smoking ban. Most dramatically, in
Russia and Turkey, where over 35% of
adults smoke, we find only half the level
of support for a blanket ban on tobacco
than the level of support we find for a
ban on unhealthy foods (86% support
for a “fat” ban compared with 42%
support for a smoking ban in Russia,
and a drop of 87% to 44% in Turkey).
But while Turkey, with its long history of
tobacco use among men, opposes an
outright smoking ban, among European
nations it shows relatively high support
for a ban in indoor public spaces
(75% support). It should also be noted
that between 2002 and 2008 Turkey
experienced a significant decline in
smoking prevalence.33
Both these facts may reflect a strong and
consistent approach to tobacco control
in the nation. According to a Tobacco
Control Scale (TCS) analysis,34 Turkey
not only has the most extensive labelling
provisions in Europe (a pictorial health
warning covering 65% of the front of
the pack), but also doubled the price of
cigarettes between 2005 and 201035 and
successfully introduced comprehensive
smoke-free legislation in 2009. Given
that “of all tobacco control policies...
price policies showed the strongest
association with quit ratios, followed by
an advertising ban”,36 Turkey’s success
in reducing the prevalence of smoking
may be unsurprising, but it may also
be significant that the Turkish PM, a
well known anti-smoking advocate,
has provided highly visible political
leadership by banning smoking in
cabinet meetings.
In contrast to Turkey, Germany has a
somewhat liberal approach to advertising
and incomplete public smoking bans,
scoring poorly on the TCS.37 Of all the
nations we surveyed, Germans are the
least supportive of interventions against
smoking (with just 60% in favour of a ban
in public places), and Germany has seen
only a minor decline in prevalence over
the last decade.38 A recent referendum
in Bavaria, however, which resulted in
the first comprehensive smoke-free
legislation in a German state, suggests
the possibility of greater interventions
in future - if the public deem this to be
acceptable.
These examples suggest the importance
of both shoves and nudges in
combination, but also suggest that
underlying social norms, including the
strength of attachment to particular habits
and practices, are vital considerations
when designing interventions to change
behaviour. In countries where smoking
plays a particularly significant social role
the shoves of a price shift or restrictive
legislation may need to be preceded
by a series of nudges that effectively
communicate the dangers of smoking and
ultimately succeed in shifting social norms.Base: c.500 - 1,000 residents aged 16-64 (18-64 in the US and Canada) in each country, November 2010 . Source: Ipsos Global @dvisor; International Obesity Taskforce
CHART 9: PREVALENCE DOES NOT APPEAR A FACTOR IN THE CASE OF FOOD
Government should introduce laws to ban unhealthy foods
% ADULTS WITH BMI ≥ 30
% S
TRO
NG
LY S
UPPO
RT /
SUPP
ORT
C09 PREVALENCE DOES NOT APPEAR A FACTOR IN THE CASE OF FOOD
AR
AU
BE
BR
CA
CN
FR
DE
GB
HU
IT
JP
PL
RUROK
ZA
SA
ES
SE
TR
US
0
30
40
50
60
70
80
90
100
20
2 4 6 8 10 12 14 16 18 20 22 24 26 28 30 32 34 36
MX
IDIN
R2=0.70
19

20
Ipsos MORI - Acceptable Behaviour
21
Acceptable Behaviour - Ipsos MORI
coNcluSioNSOur report presents a number of clear
messages about the public acceptability
of behaviour change interventions. Firstly,
and perhaps surprisingly, there are relatively
high levels of stated support across a wide
spectrum of the world’s population for
even the more forceful behaviour change
interventions we asked about.
However, there is also a significant range
of response between countries. Public
support for outright prohibition is as high
as 87% in Saudi Arabia and India, for
example, but is only 33% in the USA. As
outlined in the report, it initially seems
that socio-economic factors may help
explain this. The more prosperous a
country is, the less likely its public are
to support the full range of behaviour
change interventions. But, interestingly,
wealthier individuals across countries
tend to be slightly more supportive of
each level of behavioural intervention
than those with lower incomes.
The most likely explanation for this
apparent contradiction is that neither
are straightforward causal relationships.
At an individual level, the greater
acceptance of government action on
these issues among the better-off will
be explained not only by wealth but
also a further mix of factors, including
education levels and knowledge of
the issues. And the reverse pattern at
national levels is likely to reflect wider
cultural contexts. In particular, the
distribution of power within the country
appears to be highly related to the
public acceptability of legislation that
reduces behavioural freedom. Countries
with more authoritarian cultures and
centralised political structures - as
measured by the Power Distance Index39
- tend to have very high levels of support
for the most forceful types of intervention.
These countries also tend to be in the
less developed world, and so have lower
incomes.
Another finding we may have predicted
in advance is that public acceptability
tends to fall as more freedoms are lost
due to the intervention. However, there
are cases where people are slightly more
in favour of “choice editing” through
banning unhealthy or less sustainable
products than they are of increasing their
price. This could reflect concerns about
the inequity of using a price mechanism
(i.e. that it will hit the poorest harder) – or
just that people do not trust themselves to
make the “right” choice and would rather
the temptation of a more expensive option
was removed entirely.
But a further message is somewhat
at odds with our first conclusion. That
is, despite the relatively high levels of
stated support for behaviour change
interventions, there is still a significant
reaction against a ‘nanny state’ among
many. Across all the areas we asked
about - diet, retirement saving, sustainable
living and smoking - around half believed
government should ‘not get involved’ in
people’s decisions about how to behave.
This probably reflects a couple of
interrelated points. Firstly, it is not lost on us
that there are issues with using structured
survey questions to measure people’s real
beliefs on this subject. A key premise of
behavioural economics is exactly that we
don’t have full cognitive understanding of
how we actually make decisions, and there
is a parallel literature in survey methods
that make similar points about the shortcuts
people take when answering surveys on
these types of topics.
However, the contrast here is very
stark and it seems unlikely to be driven
by the complexity of the questions or
concepts themselves. Hence a second,
possibly more persuasive explanation
is that this is a striking example of
“cognitive polyphasia,” which is where
people hold two opposing views about
an issue without being conscious of
the contradiction or suffering from
dissonance. The finding that 36% of
people agree both that government
shouldn’t get involved in what people
save for retirement and that the
government should change the law so
that everyone has to enrol in a pension
makes the point very clearly.
We see this phenomenon a lot across our
qualitative and quantitative studies, and it
tends to be most prevalent, firstly, where
we are looking at issues people don’t
normally give a lot of active thought to,
and secondly where there are emotional
responses that may lead to different
conclusions than rational responses
(which includes anything related to
“government” intervention for many
people). This reflects psychology’s theory
of dual processes,40 recently popularised
by Kahnemann’s discussion of “fast”
(System 1) and “slow” (System 2) thinking,
which in turn result in either more intuitive
or more reflective responses.41
We frequently observe this dynamic in
deliberative workshops when considering
issues of government intervention in citizen
21
22
Ipsos MORI - Acceptable Behaviour
behaviour. Even over the course of a short
discussion, an initial, automatic response
tends to be tempered through deliberation
and debate, leading to a more reflective,
and often different, response. This might
seem to suggest that if people are not
really sure what they think, and can be
swayed by a few hours in a workshop, then
public acceptability cannot really matter.
And there are seemingly plenty of
examples where bold moves by
government that go against the grain of
public opinion have been successful,
not just in terms of affecting the
behaviour, but also in shifting public
views of acceptability. To take just one
example, opinion tracking studies on
public space smoking bans in countries
such as the UK and Ireland show
opposition declining significantly after the
intervention has been introduced and the
public experience the benefits.
However, this misses the point that these
smoking bans were preceded by years of
softer interventions from communications
campaigns, price mechanisms, more
targeted bans on smoking on transport,
seeing public space bans introduced
in other countries and so on. Indeed,
the debate encouraged by raising the
possibility of a ban itself caused views to
shift significantly in favour in a relatively
short space of time.42
There are a number of studies that show
a “cycle of public acceptability”43 where
public support changes significantly
before, during and after any intervention.
In particular, the increased acceptance
of interventions after their introduction
can be explained in a number of ways.
In a study of opinion on the introduction
of congestion charging in Stockholm,
for example, explanations for increased
acceptance included the realisation that
the benefits were greater than anticipated
and the fact that people have a tendency
to “accept the inevitable,” since it
takes significant energy to maintain
their opposition. This acceptance is
accommodated through a corresponding
shift in the underlying belief system of
the individual which had previously made
them reluctant to lose what they saw as a
“free good” (travel into the city).
The evidence in our report also suggests
that the variety of cultural norms seen
across different countries place people
in different baseline states of acceptance
of government intervention – which
also helps make acceptability alone a
relatively weak measure. An example
that illustrates this is again a public
space smoking ban, this time in China.
Here a ban has been introduced, but
is widely ignored – despite the very
high acceptability of that type of action
among the population seen in our survey.
There will be a number of explanations
for why the ban hasn’t worked in China,
but a large part is likely to be that social
norms have not shifted in the way we’ve
seen in other countries in the run-up to
similar interventions. Most telling perhaps
is that only a quarter of Chinese people
are aware of the health impacts of
smoking and second-hand smoke.44
All this lends weight to the idea, presented
in the House of Lords report on behaviour
change, that “a measure which does not
have public support is, in general, less
likely to succeed.”45 But, as the quote
also implies, acceptability is not the whole
story. Reviews that focus on whether or
not interventions have “passed a public
acceptance test” 46 rather miss the point
in suggesting that ‘acceptance’ is a state
rather than a process.
In most cases when considering the
actual likely success of an intervention,
a better concept is how “prepared”
the public are for it. This will include
acceptability of the action, but also
further measures such as recognition of
the issue, understanding of the potential
benefits of dealing with it and belief in
the effectiveness of the actual measure
proposed. As this analysis has shown,
these need to be measured carefully and
with a close understanding, not just of
the issue itself, but also of the cultural
context of the people affected.
A clear message here is that there are
no magic bullets or single levers to pull
that will result in a desired change in a
specific behaviour. But by drawing on a
broader notion of public preparedness,
that understands public acceptability
as part of a cycle of change and not
simply as a static indicator of support,
politicians and policy-makers can
increase the effectiveness of behaviour
change interventions. Leaders need
to combine subtlety with courage, and
understanding what the public really
thinks is vital for knowing which is
needed, and when.
22

23
Acceptable Behaviour - Ipsos MORI
23
24
Ipsos MORI - Acceptable Behaviour
refereNceS 1. www.geert-hofstede.com
2. (2010) The United States of Diabetes: Challenges and opportunities in the decade ahead. United Health Working Paper 5, Nov 2010, p.9. www.unitedhealthgroup.com/hrm/UNH_WorkingPaper5.pdf
3. Thaler, R.H. and Mullainathan, S. ‘How Behavioural Economics differs from Traditional Economics, in The Concise Encyclopedia of Economics (2nd Edition). http://www.econlib.org/library/Enc/BehaviouralEconomics.html (Accessed 09.06.11)
4. Thaler, R.H., and Sunstein, C.R. (2008) Nudge: improving decisions about health, wealth, and happiness. New Haven: Yale University Press.
5. Thaler, R.H., and Sunstein, C.R. (2008) p.3.
6. Thaler, R.H., and Sunstein, C.R. (2008) p.6.
7. Hernandez, M. (2009) ‘A Conversation with Daniel Kahneman’ http://cfed.org/blog/inclusiveeconomy/conversation_with_daniel_kahneman/ (Accessed 09.06.11)
8. Lehrer, J. (2011) ‘Is Nudging Really Enough,’ in The Wall Street Journal, 16th April 2011. http://online.wsj.com/article/SB10001424052748703385404576259030599041442.html?mod=WSJ_newsreel_lifeStyle (Accessed 08.06.11.)
9. Marteau et al. (2011) Judging nudging: can nudging improve population health? BMJ 2011; 342:d228
10 Marteau et al. (2011)
11 Thaler, R.T. and Benartzi, S. (2001) ‘Save More Tomorrow: Using Behavioural Economics to Increase Employee Saving’ http://www.anderson.ucla.edu/faculty/shlomo.benartzi/savemore.htm (Accessed 09.06.11)
12 Le Grand, J. and Disney, K. (2011) ‘A Small Change for a Big Result: The case of M&S shows that choice can encourage positive environmental behaviour’ http://blogs.lse.ac.uk/politicsandpolicy/2011/02/03/influencing-behaviour-incentives-plastic-bags-ms/ (Accessed 09.06.11)
13 Ebel, B., Kersh, R., Brescoll, V.L. and Dixon, L.B. (2009) ‘Calorie Labeling and Food Choices,’ in Health Affairs (28:6). http://content.healthaffairs.org/content/28/6/w1110.abstract (Accessed 09.06.11)
14. Ayres, I., Raseman, S. and Shih, A. (2009) ‘Evidence from Two Large Field Experiments that Peer Comparison Feedback can Reduce Residential Energy Usage’: NBER Working Paper 15386. http://cbey.research.yale.edu/uploads/Environmental%20Economics%20Seminar/w15386.pdf (Accessed 09.06.11)
15. Loewenstein, G. and Ubel, P. (2010) ‘Economics Behaving Badly,’ in The New York Times, 14th July 2010. http://www.nytimes.com/2010/07/15/opinion/15loewenstein.html (Accessed 09.06.11)
16. Loewenstein, G. and Ubel, P. (2010)
17. Cowen, T. (2010) ‘Are we relying too much on behavioural economics?’ http://marginalrevolution.com/marginalrevolution/2010/07/are-we-relying-too-much-on-Behavioural-economics.html (Accessed 09.06.11)
18. House of Lords Science and Technology Select Committee. (2011) ‘Behaviour Change,’ 2nd Report of Session 2010-12. London: The Authority of the House of Lords: p.35 http://www.publications.parliament.uk/pa/ld201012/ldselect/ldsctech/179/179.pdf
19. Dolan, P., Hallsworth, M., Halpern, D., King, D. and Vlaev, I. (2010) ‘MINDSPACE: Influencing behaviour through public policy.’ Cabinet Office/Institute for Government: p.13.
20. http://Behaviourgrid.org/
21. http://Behaviourmodel.org/
22. http://alliance.weforum.org/Wellness-Tools/wellness-tools.htm
23. Dolan, P., Hallsworth, M., Halpern, D., King, D. and Vlaev, I. (2010) ‘MINDSPACE: Influencing behaviour through public policy.’ Cabinet Office/Institute for Government
24. House of Lords Science and Technology Select Committee. (2011): p.14.
25. “Cognitive polyphasia” describes the phenomenon of individuals exhibiting contradictory modes of thinking about a subject from different perspectives – opinions that are locally but not globally consistent.
26. LA Times, 3rd October 2011. http://www.latimes.com/health/boostershots/la-heb-fat-tax-denmark-20111013,0,2603132.story Accessed 10.11.11.
27. Easterlin, R.A. (1974) ‘Does Economic Growth Improve the Human Lot? Some Empirical Evidence,’ in P. A. David and M.W. Reder (eds.), Nations and Households in Economic Growth: Essays in Honor of MosesAbramovitz. New York: Academic Press. Also available at: http://graphics8.nytimes.com/images/2008/04/16/business/Easterlin1974.pdf. Broadly the Easterlin Paradox suggests that while richer people within a country tend to be happier, there is little relationship between national wealth and happiness, and national income growth is not associated with increases in happiness.
28. www.geert-hofstede.com
29. http://www.worldvaluessurvey.org/wvs/articles/folder_published/article_base_54. Data available here: http://www.worldvaluessurvey.org/wvs/articles/folder_published/article_base_54/files/ValueScores_5_waves.doc (accessed 09.06.11).
30. Wilkinson, R. and Pickett, K. (2009) The Spirit Level. London: Allen Lane.
31. According to the World Bank’s Gini index 2002–2007 (figures published in the 2009 ‘World Development Indicators report):
http://hdrstats.undp.org/en/indicators/161.html
32. International Obesity Taskforce: USA data 2007-8; Sweden data 2002. http://www.iaso.org/iotf/obesity/ (Accessed 15.07.11.)
33. WHO: ‘Tobacco Atlas 2002’ (http://www.who.int/tobacco/en/atlas40.pdf); ‘Report on the Global Tobacco Epidemic 2010’ (http://www.who.int/tobacco/mpower/mpower_report_full_2008.pdf).
34. Tobacco Control Scale 2010 in Europe http://www.ensp.org/node/576
35 Joossens, L. and Raw, M. (2011) ‘The Tobacco Control Scale 2010 in Europe.’ Association of European Cancer Leagues: p.14. http://www.ensp.org/sites/default/files/TCS_2010_in_Europe_FINAL.pdf
36. Schaap, M.M., Kunst, A.E., Leinsalu, M., Regidor, E., Ekholm, O., Dzurova, D., Helmert, U., Klumbiene, J., Santana, P., Mackenbach, J.P. (2008) ‘Effect of nationwide tobacco control policies on smoking cessation in high and low educated groups in 18 European countries,’ in Tobacco Control 17: 248-255. http://tobaccocontrol.bmj.com/content/17/4/248.abstract
37. Tobacco Control Scale 2010 in Europe http://www.ensp.org/node/576
38. Ibid.
39. www.geert-hofstede.com
40. http://www.mendeley.com/research/a-perspective-on-judgment-and-choice-mapping-bounded-rationality/#page-1
41 Lewis, M. (2011) The King of Human Error, Vanity Fair http://www.vanityfair.com/business/features/2011/12/michael-lewis-201112.print, accessed 14.11.2011.
42 Cabinet Office (2008) Achieving Culture Change: A policy framework, pp83-4 - http://webarchive.nationalarchives.gov.uk/+/http://www.cabinetoffice.gov.uk/media/cabinetoffice/strategy/assets/achieving_culture_change.pdf
43. From Goodwin P. (2006) ―The gestation process for road pricing schemes‖, Local Transport Today, 1 June vol 444: 17 cited in International Transport Forum (2011) Public Acceptability of Sustainable Transport Measures: A Review of the Literature - http://www.internationaltransportforum.org/jtrc/DiscussionPapers/DP201120.pdf
44. www.bbc.co.uk/news/13251926
45. House of Lords Science and Technology Select Committee. (2011): p.14
46 London Collaborative (2010) The Capital Ambition Guide to Behaviour Change - http://www.youngfoundation.org/files/images/Behaviour_Guide_130510_HighRes.pdf
The Ipsos Global @advisor is a monthly online survey conducted by Ipsos MORI via the Ipsos Online Panel system in 24 countries around the world. The countries reporting herein are Argentina, Australia, Belgium, Brazil, Canada, China, France, Great Britain, Germany, Hungary, India, Indonesia, Italy, Japan, Mexico, Poland, Russia, Saudi Arabia, South Africa, South Korea, Spain, Sweden, Turkey and the United States of America.
For the results of this survey, an international sample of 18,787 adults aged 18-64 in the US and Canada, and age 16-64 in all other countries, were interviewed. Approximately 1000+ individuals participated on a country by country basis via the Ipsos Online Panel with the exception of Argentina, Belgium, Indonesia, Mexico, Poland, Saudi Arabia, South Africa, South Korea, Sweden and Turkey, where each has a sample approximately 500+.
Weighting was employed to balance demographics and ensure the sample’s composition reflects that of the adult population according to the most recent country Census data available and to provide results intended to approximate the sample universe, (in the small number of developing countries where access to the internet is limited respondents are more likely to be affluent and well connected than the average member of the population).
techNicAl Note
24

25
Acceptable Behavior - Ipsos MORI SRI

26
Ipsos MORI SRI - Acceptable Behavior
About ipSoS mori’S SociAl reSeArch iNStitute The Social Research Institute works closely with national government, local public services and the not-for-profit sector.
Its 200 research staff focus on public service and policy issues. Each has expertise in a particular part of the public sector,
ensuring we have a detailed understanding of specific sectors and policy challenges. This, combined with our methodological
and communications expertise, ensures that our research makes a difference for decision makers and communities.
iNformAtioNIpsos MORI
79-81 Borough Road
London SE1 1FY
t: +44 (0)20 7347 3000
f: +44 (0)20 7347 3800
www.ipsos-mori.com