Accelerated Light Fading Test Results...Printer: Epson Stylus Photo 1400 Ink: Epson OEM Claria...
24
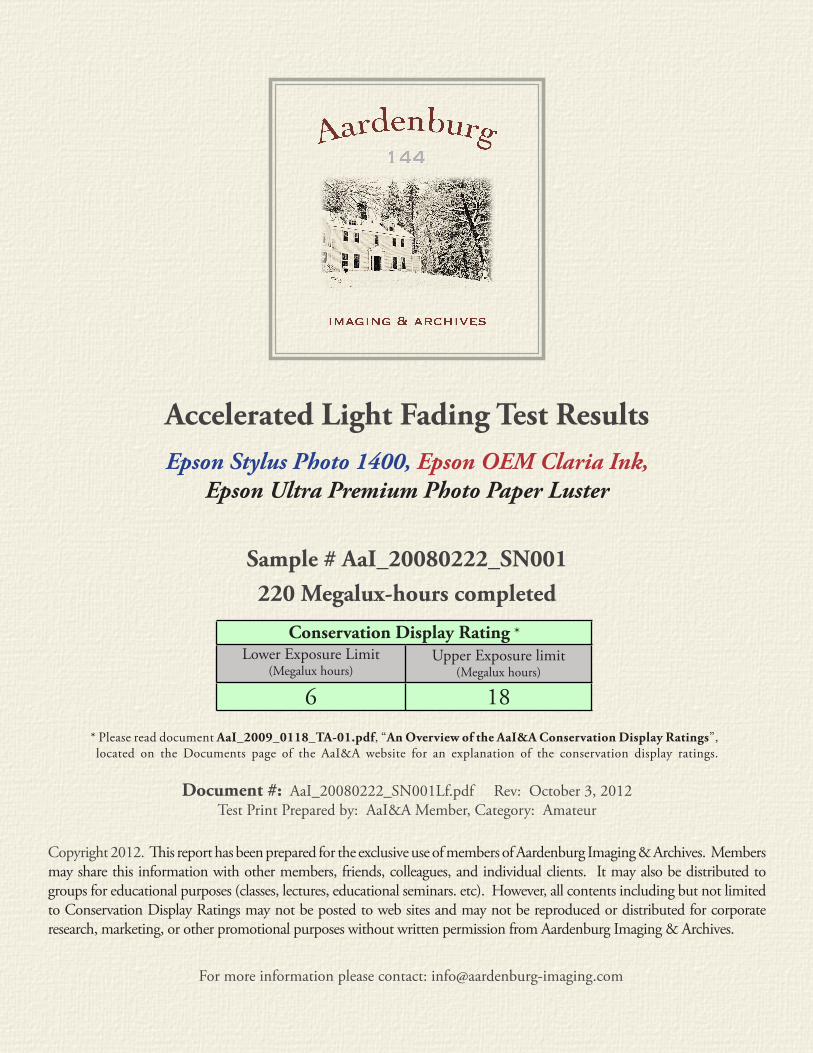
Accelerated Light Fading Test Results For more information please contact: [email protected] Epson Stylus Photo 1400, Epson OEM Claria Ink, Epson Ultra Premium Photo Paper Luster Sample # AaI_20080222_SN001 220 Megalux-hours completed Document #: AaI_20080222_SN001Lf.pdf Rev: October 3, 2012 Test Print Prepared by: AaI&A Member, Category: Amateur Copyright 2012. is report has been prepared for the exclusive use of members of Aardenburg Imaging & Archives. Members may share this information with other members, friends, colleagues, and individual clients. It may also be distributed to groups for educational purposes (classes, lectures, educational seminars. etc). However, all contents including but not limited to Conservation Display Ratings may not be posted to web sites and may not be reproduced or distributed for corporate research, marketing, or other promotional purposes without written permission from Aardenburg Imaging & Archives. Conservation Display Rating * Lower Exposure Limit (Megalux hours) Upper Exposure limit (Megalux hours) 6 18 * Please read document AaI_2009_0118_TA-01.pdf, “An Overview of the AaI&A Conservation Display Ratings”, located on the Documents page of the AaI&A website for an explanation of the conservation display ratings.
Transcript of Accelerated Light Fading Test Results...Printer: Epson Stylus Photo 1400 Ink: Epson OEM Claria...
Accelerated Light Fading Test Results
For more information please contact: [email protected]
Epson Stylus Photo 1400, Epson OEM Claria Ink,Epson Ultra Premium Photo Paper Luster
Sample # AaI_20080222_SN001220 Megalux-hours completed
Document #: AaI_20080222_SN001Lf.pdf Rev: October 3, 2012Test Print Prepared by: AaI&A Member, Category: Amateur
Copyright 2012. This report has been prepared for the exclusive use of members of Aardenburg Imaging & Archives. Members may share this information with other members, friends, colleagues, and individual clients. It may also be distributed to groups for educational purposes (classes, lectures, educational seminars. etc). However, all contents including but not limited to Conservation Display Ratings may not be posted to web sites and may not be reproduced or distributed for corporate research, marketing, or other promotional purposes without written permission from Aardenburg Imaging & Archives.
Conservation Display Rating *Lower Exposure Limit
(Megalux hours)Upper Exposure limit
(Megalux hours)
6 18
* Please read document AaI_2009_0118_TA-01.pdf, “An Overview of the AaI&A Conservation Display Ratings”, located on the Documents page of the AaI&A website for an explanation of the conservation display ratings.
About this Report
This report contains light fastness information about a single test print produced by a specific digital printing system. “System” refers to all hardware, software, and materials used to make the finished print. The hardware, software, material components, and printmaker’s skills contribute to the final image quality and image permanence. The tested sample is made with current or recently discontinued stocks of commercially available products unless otherwise stated. Each sample has been prepared by Aardenburg Imaging & Archives or one of its members in accordance with customary print making practices unless otherwise noted. The sample may also contain additional finishing materials such as overcoats and laminates which are also noted when used. Finally, the sample has been tested under standardized conditions that are defined on the Sample Description page (see page 2). AaI&A makes every effort to ensure but cannot guarantee that the samples are properly identified and documented and that test results are accurate. For this reason, AaI&A also strives to test independently produced sample replicates in order to increase sampling confidence and to provide information on process variability. Please compare the results in this report to replicate test samples when the data become available.
Understanding the Test Results
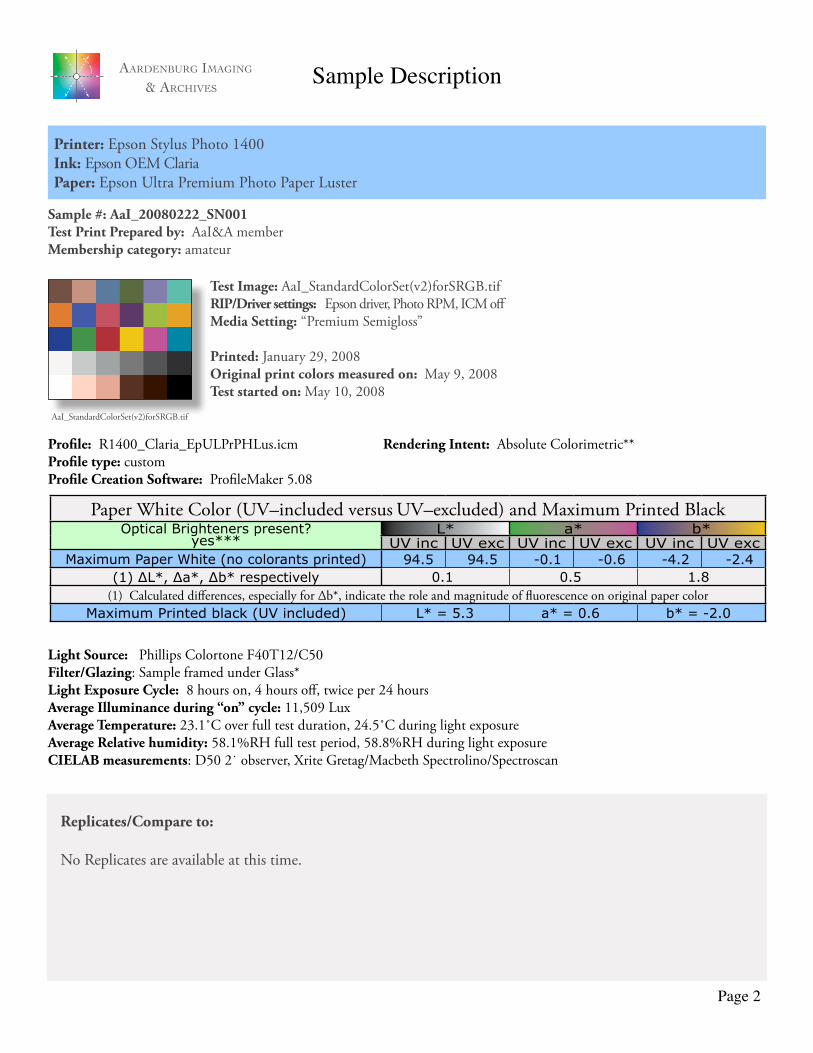
The magnitude and visual appearance of fading depends not only on the chosen printing system but the chosen image as well. In other words, different images are comprised of different colors, and the fading relationships between those colors dictate how the image will look as it fades. The sample print in this test report was made by reproducing the digital image shown on the left. It contains 30 standard colors. 24 of the colors are colorimetrically matched to the Macbeth ColorChecker™ chart viewed under D50 illumination. The remaining six colors supplement the ColorChecker™ array with four additional skin tone colors, one patch for paper white, and another for maximum black. The additional colors also round out the distribution of L* lightness values in the test target.
Information about the fading characteristics of the product is provided in three ways:
1) You can visually assess the fading. The target images reproduced in this report are digitally reconstructed from the spectrally measured color data rather than scanning or otherwise reproducing the physical print by conventional techniques. This method ensures a colorimetrically accurate representation of the print appearance as the print fades. A calibrated monitor is recommended to experience the best possible reproduction of the test sample appearance. The side-by-side presentation of the target images simulates looking at the light-exposed print along side a perfect duplicate of the unexposed original print. The “Before/After” Layer mode takes advantage of Adobe Reader Layer technology. Toggle the “Before/After” layer on and off using the layers feature of Adobe Reader to directly switch between the light exposed print colors and the initial print colors for the image located on the right side of each page. Also, use Adobe Reader’s full screen mode to cycle through the pages and “animate” the fading.
2) I* Color and tonal accuracy scores are reported. This report includes I* metric scores that compare the color and tonal re-lationships of the light exposed samples to the color and tonal relationships existing in the original print prior to light exposure. Perfect I* scores of 100% can be approached when no significant fading occurs. Average scores above 90% generally indicate excellent retention of original quality, 80% good, 70% fair, etc., but your conclusions may vary depending on your image quality requirements. I* color rates the retained color accuracy (hue and chroma) while I* tone rates the retained tonal accuracy (lightness and contrast). The score is on a percentile scale where 100% is a perfect match between the comparison image (e.g., “after” light exposure) and the reference image (e.g., “before” any light exposure). 0% I* color means no color accuracy is left. 0% I* tone means essentially no tonality remains and all image information content is lost. Negative I* values have significance as well and contribute to the average I* score when they occur. Negative I* color values mean false color has occurred, for example, when a skin tone turns green or a neutral gray becomes distinctly colorful. Negative I* tone scores mean visual contrast between colors has become inverted (i.e., like the tonal relationships in a photographic film negative). Serious image quality problems must arise before false colors and/or tones appear. For more information on the I* metric, please refer to the AaI&A web site.
3) Color changes are also reported using the classic color difference model, ∆E. Note that ∆E values lose perceptual scaling significance when they become large (e.g., > 15). Also, the ∆E equation does not unambiguously measure changes in image contrast. This limitation is generally not a problem for paints and textiles, but can be a serious oversight when evaluating photographic images. It was a major reason behind the development of the I* metric.
Page 1
AArdenburg ImAgIng
& ArchIves
Page 1
AaI_StandardColorSet(v2)forSRGB.tif
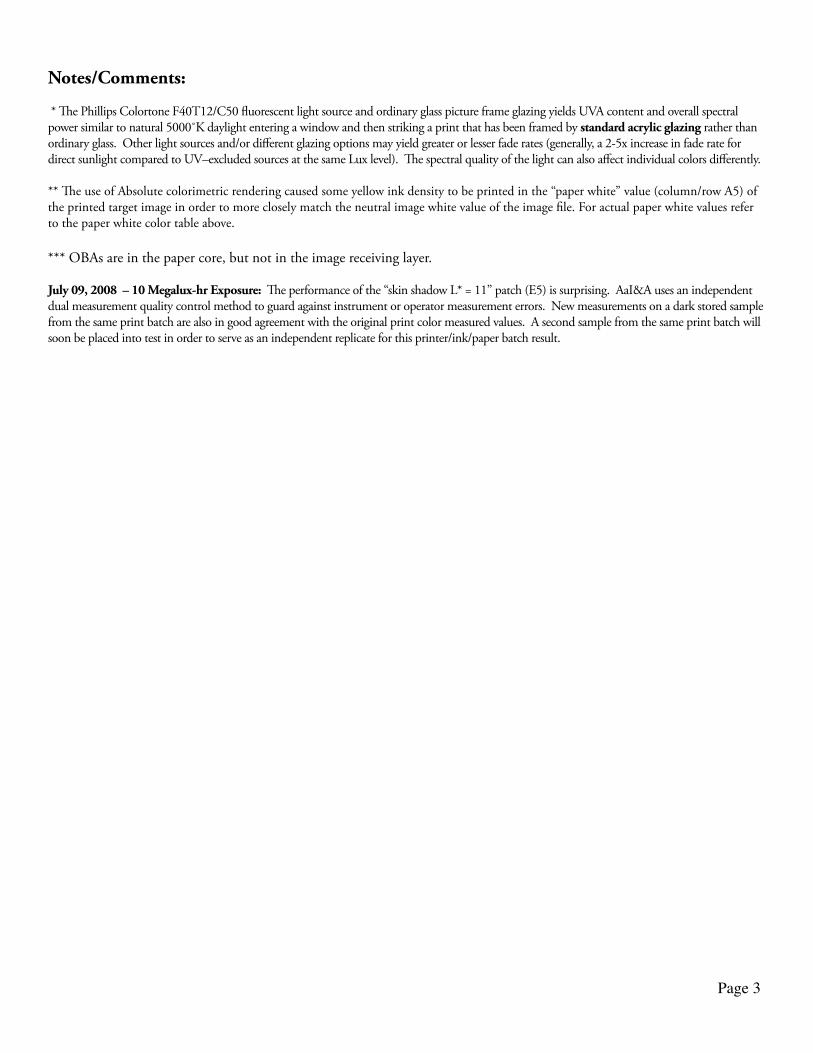
Sample #: AaI_20080222_SN001Test Print Prepared by: AaI&A memberMembership category: amateur
Test Image: AaI_StandardColorSet(v2)forSRGB.tifRIP/Driver settings: Epson driver, Photo RPM, ICM offMedia Setting: “Premium Semigloss”
Printed: January 29, 2008Original print colors measured on: May 9, 2008Test started on: May 10, 2008
Profile: R1400_Claria_EpULPrPHLus.icm Rendering Intent: Absolute Colorimetric**Profile type: customProfile Creation Software: ProfileMaker 5.08
Light Source: Phillips Colortone F40T12/C50 Filter/Glazing: Sample framed under Glass*Light Exposure Cycle: 8 hours on, 4 hours off, twice per 24 hoursAverage Illuminance during “on” cycle: 11,509 LuxAverage Temperature: 23.1˚C over full test duration, 24.5˚C during light exposureAverage Relative humidity: 58.1%RH full test period, 58.8%RH during light exposureCIELAB measurements: D50 2˙ observer, Xrite Gretag/Macbeth Spectrolino/Spectroscan
Page 2
AArdenburg ImAgIng
& ArchIves
Paper White Color (UV–included versus UV–excluded) and Maximum Printed BlackOptical Brighteners present?
yes***L* a* b*
UV inc UV exc UV inc UV exc UV inc UV excMaximum Paper White (no colorants printed) 94.5 94.5 -0.1 -0.6 -4.2 -2.4
(1) ∆L*, ∆a*, ∆b* respectively 0.1 0.5 1.8(1) Calculated differences, especially for ∆b*, indicate the role and magnitude of fluorescence on original paper color
Maximum Printed black (UV included) L* = 5.3 a* = 0.6 b* = -2.0
Printer: Epson Stylus Photo 1400Ink: Epson OEM ClariaPaper: Epson Ultra Premium Photo Paper Luster
Sample Description
AaI_StandardColorSet(v2)forSRGB.tif
Replicates/Compare to: No Replicates are available at this time.
Notes/Comments:
* The Phillips Colortone F40T12/C50 fluorescent light source and ordinary glass picture frame glazing yields UVA content and overall spectral power similar to natural 5000˚K daylight entering a window and then striking a print that has been framed by standard acrylic glazing rather than ordinary glass. Other light sources and/or different glazing options may yield greater or lesser fade rates (generally, a 2-5x increase in fade rate for direct sunlight compared to UV–excluded sources at the same Lux level). The spectral quality of the light can also affect individual colors differently.
** The use of Absolute colorimetric rendering caused some yellow ink density to be printed in the “paper white” value (column/row A5) of the printed target image in order to more closely match the neutral image white value of the image file. For actual paper white values refer to the paper white color table above.
*** OBAs are in the paper core, but not in the image receiving layer.
July 09, 2008 – 10 Megalux-hr Exposure: The performance of the “skin shadow L* = 11” patch (E5) is surprising. AaI&A uses an independent dual measurement quality control method to guard against instrument or operator measurement errors. New measurements on a dark stored sample from the same print batch are also in good agreement with the original print color measured values. A second sample from the same print batch will soon be placed into test in order to serve as an independent replicate for this printer/ink/paper batch result.
Page 3
Page 4
Table to Convert Megalux-hours of Light Exposure to estimated “Years on Display” Indoor Light Levels for Print Display Multiply
Mlux-hrs by
Megalux-hours in test
Light Exposure Description 10 20 30 40 50 60 70 80 90 100≤ 10 Lux
24 hours per dayInterior rooms, storage areas, or hallways without win-dows, illuminated sparingly by artificial lighting
11.42 114 228 342 457 571 685 799 913 1027 1142
50 Lux 12 hours per day
“Museum Standard” display condition
4.57 46 91 137 183 228 274 325 365 411 457
120 Lux12 hours per day
“Kodak Display Years” (1)
Average home illumination level for photos is ~ 60 lux. 90% of all displayed photos do not exceed 120 lux (1).
1.90 19 38 57 76 95 114 133 152 171 190
228 Lux12 hours per day
Relatively bright home or office. Note the simple 1:1 relationship between “years on display” and Mlux-hr values at this condition.
1.00 10 20 30 40 50 60 70 80 90 100
450 Lux 12 hours per day
“WIR Display Years” (2)
Also equals 500 lux for 11.8 hours per day
A bright home or commer-cial office building illumina-tion level is 200-500 lux. Also, good illumination for color critical viewing and color matching tasks begins at about 500 lux.
0.51 5 10 15 20 25 30 35 41 46 51
2000 Lux 12 hours per day
Commercial Gallery. Also, critical color evaluation stan-dards call for 2000 lux and a D50 illumination source.
0.114 1.1 2.3 3.4 4.6 5.7 6.8 8.0 9.1 10.3 11.4
5000 Lux 12 hours per day
E.g., Sunlight through a win-dow striking print at an angle.
0.046 0.5 0.9 1.4 1.8 2.3 2.7 3.2 3.7 4.1 4.6
10,000 Lux 12 hours per day
South-facing window in U.S.A. , e.g., storefront display with photos directly facing window.
0.023 0.2 0.5 0.7 0.9 1.1 1.4 1.6 1.8 2.1 2.3
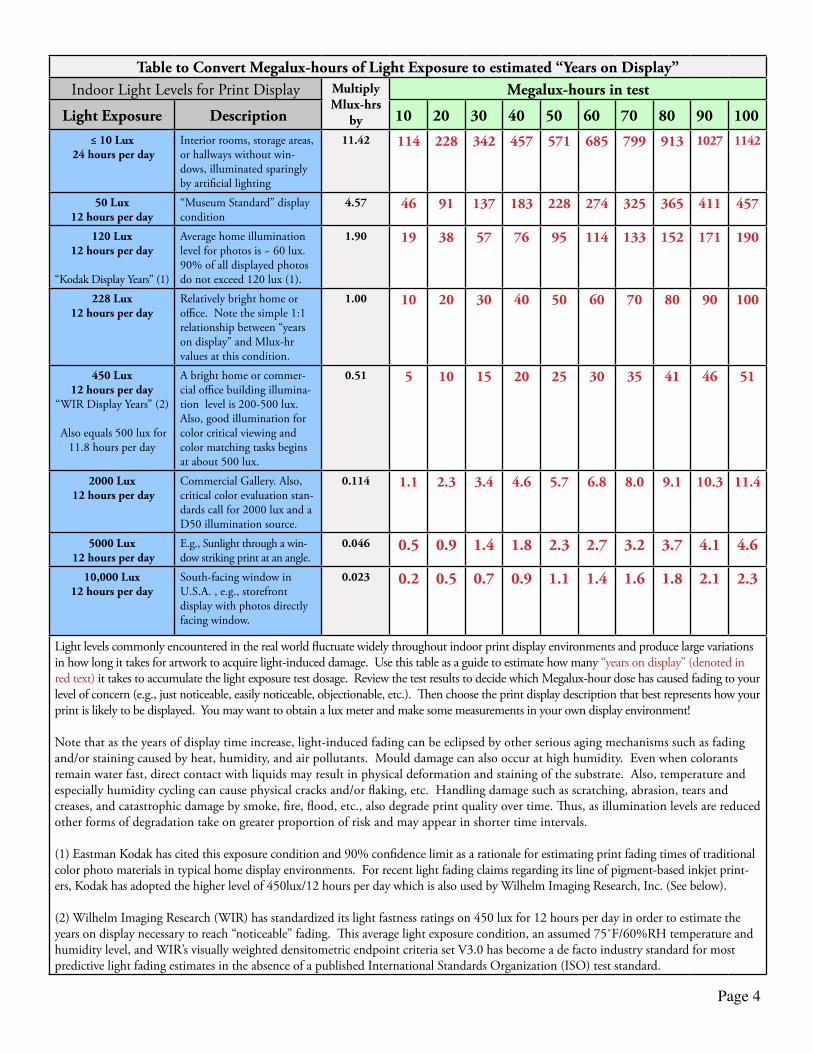
Light levels commonly encountered in the real world fluctuate widely throughout indoor print display environments and produce large variations in how long it takes for artwork to acquire light-induced damage. Use this table as a guide to estimate how many “years on display” (denoted in red text) it takes to accumulate the light exposure test dosage. Review the test results to decide which Megalux-hour dose has caused fading to your level of concern (e.g., just noticeable, easily noticeable, objectionable, etc.). Then choose the print display description that best represents how your print is likely to be displayed. You may want to obtain a lux meter and make some measurements in your own display environment!
Note that as the years of display time increase, light-induced fading can be eclipsed by other serious aging mechanisms such as fading and/or staining caused by heat, humidity, and air pollutants. Mould damage can also occur at high humidity. Even when colorants remain water fast, direct contact with liquids may result in physical deformation and staining of the substrate. Also, temperature and especially humidity cycling can cause physical cracks and/or flaking, etc. Handling damage such as scratching, abrasion, tears and creases, and catastrophic damage by smoke, fire, flood, etc., also degrade print quality over time. Thus, as illumination levels are reduced other forms of degradation take on greater proportion of risk and may appear in shorter time intervals.
(1) Eastman Kodak has cited this exposure condition and 90% confidence limit as a rationale for estimating print fading times of traditional color photo materials in typical home display environments. For recent light fading claims regarding its line of pigment-based inkjet print-ers, Kodak has adopted the higher level of 450lux/12 hours per day which is also used by Wilhelm Imaging Research, Inc. (See below).
(2) Wilhelm Imaging Research (WIR) has standardized its light fastness ratings on 450 lux for 12 hours per day in order to estimate the years on display necessary to reach “noticeable” fading. This average light exposure condition, an assumed 75˚F/60%RH temperature and humidity level, and WIR’s visually weighted densitometric endpoint criteria set V3.0 has become a de facto industry standard for most predictive light fading estimates in the absence of a published International Standards Organization (ISO) test standard.
AArdenburg ImAgIng
& ArchIves
A B C D E F
1
2
3
4
5
A B C D E F
1
2
3
4
5
Page 5
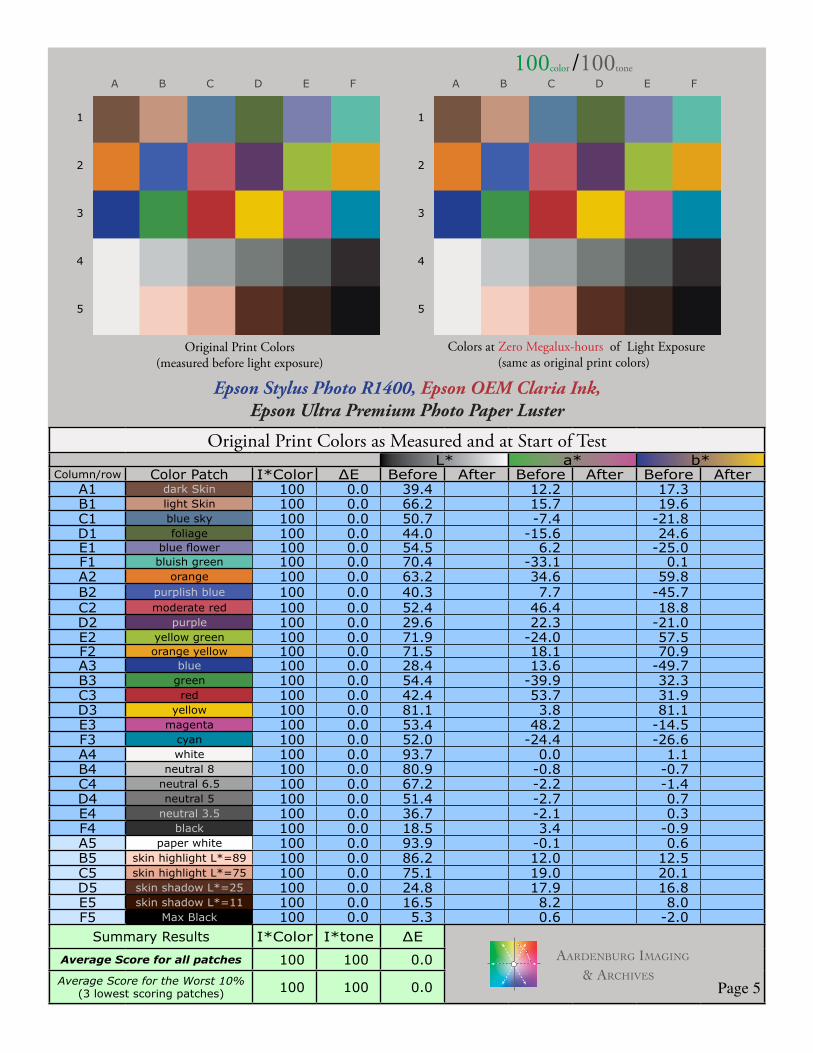
Original Print Colors(measured before light exposure)
100color /100tone
Original Print Colors as Measured and at Start of TestL* a* b*
Column/row Color Patch I*Color ∆E Before After Before After Before AfterA1 dark Skin 100 0.0 39.4 12.2 17.3B1 light Skin 100 0.0 66.2 15.7 19.6C1 blue sky 100 0.0 50.7 -7.4 -21.8D1 foliage 100 0.0 44.0 -15.6 24.6E1 blue flower 100 0.0 54.5 6.2 -25.0F1 bluish green 100 0.0 70.4 -33.1 0.1A2 orange 100 0.0 63.2 34.6 59.8B2 purplish blue 100 0.0 40.3 7.7 -45.7C2 moderate red 100 0.0 52.4 46.4 18.8D2 purple 100 0.0 29.6 22.3 -21.0E2 yellow green 100 0.0 71.9 -24.0 57.5F2 orange yellow 100 0.0 71.5 18.1 70.9A3 blue 100 0.0 28.4 13.6 -49.7B3 green 100 0.0 54.4 -39.9 32.3C3 red 100 0.0 42.4 53.7 31.9D3 yellow 100 0.0 81.1 3.8 81.1E3 magenta 100 0.0 53.4 48.2 -14.5F3 cyan 100 0.0 52.0 -24.4 -26.6A4 white 100 0.0 93.7 0.0 1.1B4 neutral 8 100 0.0 80.9 -0.8 -0.7C4 neutral 6.5 100 0.0 67.2 -2.2 -1.4D4 neutral 5 100 0.0 51.4 -2.7 0.7E4 neutral 3.5 100 0.0 36.7 -2.1 0.3F4 black 100 0.0 18.5 3.4 -0.9A5 paper white 100 0.0 93.9 -0.1 0.6B5 skin highlight L*=89 100 0.0 86.2 12.0 12.5C5 skin highlight L*=75 100 0.0 75.1 19.0 20.1D5 skin shadow L*=25 100 0.0 24.8 17.9 16.8E5 skin shadow L*=11 100 0.0 16.5 8.2 8.0F5 Max Black 100 0.0 5.3 0.6 -2.0
Summary Results I*Color I*tone ∆E
Average Score for all patches 100 100 0.0
Average Score for the Worst 10%(3 lowest scoring patches) 100 100 0.0
Epson Stylus Photo R1400, Epson OEM Claria Ink,Epson Ultra Premium Photo Paper Luster
Colors at Zero Megalux-hours of Light Exposure(same as original print colors)”

AArdenburg ImAgIng
& ArchIves
A B C D E F
1
2
3
4
5
A B C D E F
1
2
3
4
5
Page 6
Original Print Colors(measured before light exposure)
100color /100tone
Original Print Colors as Measured and at Start of TestL* a* b*
Column/row Color Patch I*Color ∆E Before After Before After Before AfterA1 dark Skin 100 0.0 39.4 12.2 17.3B1 light Skin 100 0.0 66.2 15.7 19.6C1 blue sky 100 0.0 50.7 -7.4 -21.8D1 foliage 100 0.0 44.0 -15.6 24.6E1 blue flower 100 0.0 54.5 6.2 -25.0F1 bluish green 100 0.0 70.4 -33.1 0.1A2 orange 100 0.0 63.2 34.6 59.8B2 purplish blue 100 0.0 40.3 7.7 -45.7C2 moderate red 100 0.0 52.4 46.4 18.8D2 purple 100 0.0 29.6 22.3 -21.0E2 yellow green 100 0.0 71.9 -24.0 57.5F2 orange yellow 100 0.0 71.5 18.1 70.9A3 blue 100 0.0 28.4 13.6 -49.7B3 green 100 0.0 54.4 -39.9 32.3C3 red 100 0.0 42.4 53.7 31.9D3 yellow 100 0.0 81.1 3.8 81.1E3 magenta 100 0.0 53.4 48.2 -14.5F3 cyan 100 0.0 52.0 -24.4 -26.6A4 white 100 0.0 93.7 0.0 1.1B4 neutral 8 100 0.0 80.9 -0.8 -0.7C4 neutral 6.5 100 0.0 67.2 -2.2 -1.4D4 neutral 5 100 0.0 51.4 -2.7 0.7E4 neutral 3.5 100 0.0 36.7 -2.1 0.3F4 black 100 0.0 18.5 3.4 -0.9A5 paper white 100 0.0 93.9 -0.1 0.6B5 skin highlight L*=89 100 0.0 86.2 12.0 12.5C5 skin highlight L*=75 100 0.0 75.1 19.0 20.1D5 skin shadow L*=25 100 0.0 24.8 17.9 16.8E5 skin shadow L*=11 100 0.0 16.5 8.2 8.0F5 Max Black 100 0.0 5.3 0.6 -2.0
Summary Results I*Color I*tone ∆E
Average Score for all patches 100 100 0.0
Average Score for the Worst 10%(3 lowest scoring patches) 100 100 0.0
Epson Stylus Photo R1400, Epson OEM Claria Ink,Epson Ultra Premium Photo Paper Luster
Colors at Zero Megalux-hours of Light Exposure(same as original print colors)”Colors after 10 Megalux-hours
light exposure”
92.6color /95.0tone
10 Mlux-hrs Light Exposure (i.e., after) Compared to Original Print Colors (i.e., before)L* a* b*
Column/row Color Patch I*Color ∆E Before After Before After Before AfterA1 dark Skin 93.8 2.0 39.4 40.2 12.2 13.2 17.3 15.9B1 light Skin 93.3 2.5 66.2 67.3 15.7 15.6 19.6 17.5C1 blue sky 93.3 2.1 50.7 51.3 -7.4 -5.7 -21.8 -22.9D1 foliage 93.9 2.3 44.0 44.6 -15.6 -13.9 24.6 23.1E1 blue flower 99.4 1.0 54.5 55.2 6.2 6.6 -25.0 -25.5F1 bluish green 96.1 1.9 70.4 70.8 -33.1 -32.0 0.1 -1.4A2 orange 96.1 3.5 63.2 64.6 34.6 33.8 59.8 56.7B2 purplish blue 97.5 1.8 40.3 40.9 7.7 9.4 -45.7 -45.5C2 moderate red 98.0 1.9 52.4 53.5 46.4 46.5 18.8 17.3D2 purple 96.3 1.9 29.6 30.6 22.3 23.8 -21.0 -21.3E2 yellow green 94.7 4.0 71.9 73.2 -24.0 -24.2 57.5 53.7F2 orange yellow 95.3 4.2 71.5 73.0 18.1 16.8 70.9 67.2A3 blue 97.9 1.7 28.4 29.0 13.6 15.1 -49.7 -49.5B3 green 95.0 3.1 54.4 55.0 -39.9 -37.8 32.3 30.0C3 red 98.7 1.8 42.4 43.7 53.7 53.6 31.9 30.6D3 yellow 94.8 4.9 81.1 82.2 3.8 2.2 81.1 76.7E3 magenta 100.0 1.1 53.4 54.4 48.2 48.1 -14.5 -14.2F3 cyan 94.1 2.6 52.0 52.3 -24.4 -21.9 -26.6 -27.6A4 white 97.8 0.7 93.7 93.9 0.0 0.1 1.1 0.4B4 neutral 8 94.1 1.2 80.9 81.4 -0.8 -0.7 -0.7 -1.7C4 neutral 6.5 90.9 1.5 67.2 67.8 -2.2 -1.5 -1.4 -2.6D4 neutral 5 81.4 2.3 51.4 52.1 -2.7 -0.9 0.7 -0.7E4 neutral 3.5 81.1 2.4 36.7 37.4 -2.1 -0.1 0.3 -0.9F4 black 86.0 2.0 18.5 19.4 3.4 5.2 -0.9 -1.0A5 paper white 99.2 0.6 93.9 94.1 -0.1 -0.1 0.6 0.1B5 skin highlight L*=89 94.7 1.5 86.2 86.7 12.0 11.5 12.5 11.2C5 skin highlight L*=75 95.2 2.0 75.1 76.0 19.0 18.5 20.1 18.3D5 skin shadow L*=25 91.8 2.7 24.8 25.8 17.9 20.2 16.8 17.8E5 skin shadow L*=11 40.5 7.6 16.5 18.5 8.2 14.5 8.0 11.7F5 Max Black 97.6 0.8 5.3 5.6 0.6 1.1 -2.0 -1.5
Summary Results I*Color I*tone ∆E
Average Score for all patches 92.6 95.0 2.3
Average Score for the Worst 10%(3 lowest scoring patches) 67.7 88.4 5.6
AArdenburg ImAgIng
& ArchIves
A B C D E F
1
2
3
4
5
A B C D E F
1
2
3
4
5
Page 7
Original Print Colors(measured before light exposure)
100color /100tone
Original Print Colors as Measured and at Start of TestL* a* b*
Column/row Color Patch I*Color ∆E Before After Before After Before AfterA1 dark Skin 100 0.0 39.4 12.2 17.3B1 light Skin 100 0.0 66.2 15.7 19.6C1 blue sky 100 0.0 50.7 -7.4 -21.8D1 foliage 100 0.0 44.0 -15.6 24.6E1 blue flower 100 0.0 54.5 6.2 -25.0F1 bluish green 100 0.0 70.4 -33.1 0.1A2 orange 100 0.0 63.2 34.6 59.8B2 purplish blue 100 0.0 40.3 7.7 -45.7C2 moderate red 100 0.0 52.4 46.4 18.8D2 purple 100 0.0 29.6 22.3 -21.0E2 yellow green 100 0.0 71.9 -24.0 57.5F2 orange yellow 100 0.0 71.5 18.1 70.9A3 blue 100 0.0 28.4 13.6 -49.7B3 green 100 0.0 54.4 -39.9 32.3C3 red 100 0.0 42.4 53.7 31.9D3 yellow 100 0.0 81.1 3.8 81.1E3 magenta 100 0.0 53.4 48.2 -14.5F3 cyan 100 0.0 52.0 -24.4 -26.6A4 white 100 0.0 93.7 0.0 1.1B4 neutral 8 100 0.0 80.9 -0.8 -0.7C4 neutral 6.5 100 0.0 67.2 -2.2 -1.4D4 neutral 5 100 0.0 51.4 -2.7 0.7E4 neutral 3.5 100 0.0 36.7 -2.1 0.3F4 black 100 0.0 18.5 3.4 -0.9A5 paper white 100 0.0 93.9 -0.1 0.6B5 skin highlight L*=89 100 0.0 86.2 12.0 12.5C5 skin highlight L*=75 100 0.0 75.1 19.0 20.1D5 skin shadow L*=25 100 0.0 24.8 17.9 16.8E5 skin shadow L*=11 100 0.0 16.5 8.2 8.0F5 Max Black 100 0.0 5.3 0.6 -2.0
Summary Results I*Color I*tone ∆E
Average Score for all patches 100 100 0.0
Average Score for the Worst 10%(3 lowest scoring patches) 100 100 0.0
Epson Stylus Photo R1400, Epson OEM Claria Ink,Epson Ultra Premium Photo Paper Luster
Colors at Zero Megalux-hours of Light Exposure(same as original print colors)”
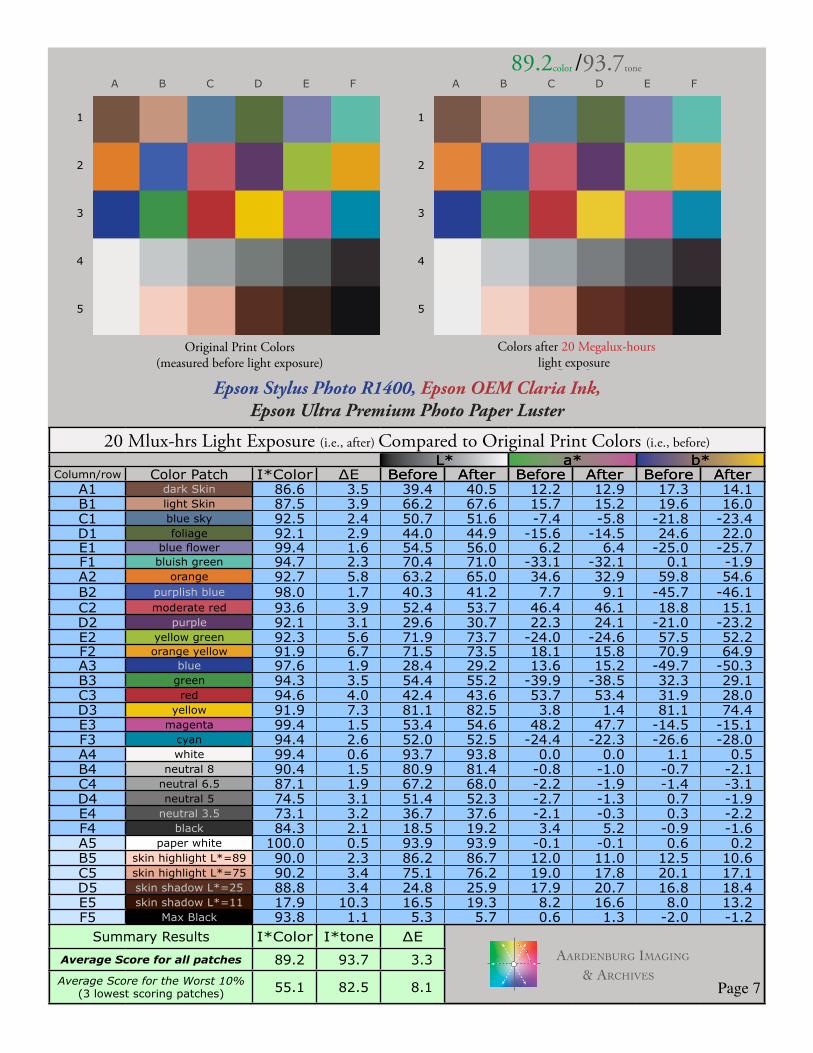
20 Mlux-hrs Light Exposure (i.e., after) Compared to Original Print Colors (i.e., before)L* a* b*
Column/row Color Patch I*Color ∆E Before After Before After Before AfterA1 dark Skin 86.6 3.5 39.4 40.5 12.2 12.9 17.3 14.1B1 light Skin 87.5 3.9 66.2 67.6 15.7 15.2 19.6 16.0C1 blue sky 92.5 2.4 50.7 51.6 -7.4 -5.8 -21.8 -23.4D1 foliage 92.1 2.9 44.0 44.9 -15.6 -14.5 24.6 22.0E1 blue flower 99.4 1.6 54.5 56.0 6.2 6.4 -25.0 -25.7F1 bluish green 94.7 2.3 70.4 71.0 -33.1 -32.1 0.1 -1.9A2 orange 92.7 5.8 63.2 65.0 34.6 32.9 59.8 54.6B2 purplish blue 98.0 1.7 40.3 41.2 7.7 9.1 -45.7 -46.1C2 moderate red 93.6 3.9 52.4 53.7 46.4 46.1 18.8 15.1D2 purple 92.1 3.1 29.6 30.7 22.3 24.1 -21.0 -23.2E2 yellow green 92.3 5.6 71.9 73.7 -24.0 -24.6 57.5 52.2F2 orange yellow 91.9 6.7 71.5 73.5 18.1 15.8 70.9 64.9A3 blue 97.6 1.9 28.4 29.2 13.6 15.2 -49.7 -50.3B3 green 94.3 3.5 54.4 55.2 -39.9 -38.5 32.3 29.1C3 red 94.6 4.0 42.4 43.6 53.7 53.4 31.9 28.0D3 yellow 91.9 7.3 81.1 82.5 3.8 1.4 81.1 74.4E3 magenta 99.4 1.5 53.4 54.6 48.2 47.7 -14.5 -15.1F3 cyan 94.4 2.6 52.0 52.5 -24.4 -22.3 -26.6 -28.0A4 white 99.4 0.6 93.7 93.8 0.0 0.0 1.1 0.5B4 neutral 8 90.4 1.5 80.9 81.4 -0.8 -1.0 -0.7 -2.1C4 neutral 6.5 87.1 1.9 67.2 68.0 -2.2 -1.9 -1.4 -3.1D4 neutral 5 74.5 3.1 51.4 52.3 -2.7 -1.3 0.7 -1.9E4 neutral 3.5 73.1 3.2 36.7 37.6 -2.1 -0.3 0.3 -2.2F4 black 84.3 2.1 18.5 19.2 3.4 5.2 -0.9 -1.6A5 paper white 100.0 0.5 93.9 93.9 -0.1 -0.1 0.6 0.2B5 skin highlight L*=89 90.0 2.3 86.2 86.7 12.0 11.0 12.5 10.6C5 skin highlight L*=75 90.2 3.4 75.1 76.2 19.0 17.8 20.1 17.1D5 skin shadow L*=25 88.8 3.4 24.8 25.9 17.9 20.7 16.8 18.4E5 skin shadow L*=11 17.9 10.3 16.5 19.3 8.2 16.6 8.0 13.2F5 Max Black 93.8 1.1 5.3 5.7 0.6 1.3 -2.0 -1.2
Summary Results I*Color I*tone ∆E
Average Score for all patches 89.2 93.7 3.3
Average Score for the Worst 10%(3 lowest scoring patches) 55.1 82.5 8.1
Colors after 20 Megalux-hours light exposure”
89.2color /93.7tone
AArdenburg ImAgIng
& ArchIves
A B C D E F
1
2
3
4
5
A B C D E F
1
2
3
4
5
Page 8
Original Print Colors(measured before light exposure)
100color /100tone
Original Print Colors as Measured and at Start of TestL* a* b*
Column/row Color Patch I*Color ∆E Before After Before After Before AfterA1 dark Skin 100 0.0 39.4 12.2 17.3B1 light Skin 100 0.0 66.2 15.7 19.6C1 blue sky 100 0.0 50.7 -7.4 -21.8D1 foliage 100 0.0 44.0 -15.6 24.6E1 blue flower 100 0.0 54.5 6.2 -25.0F1 bluish green 100 0.0 70.4 -33.1 0.1A2 orange 100 0.0 63.2 34.6 59.8B2 purplish blue 100 0.0 40.3 7.7 -45.7C2 moderate red 100 0.0 52.4 46.4 18.8D2 purple 100 0.0 29.6 22.3 -21.0E2 yellow green 100 0.0 71.9 -24.0 57.5F2 orange yellow 100 0.0 71.5 18.1 70.9A3 blue 100 0.0 28.4 13.6 -49.7B3 green 100 0.0 54.4 -39.9 32.3C3 red 100 0.0 42.4 53.7 31.9D3 yellow 100 0.0 81.1 3.8 81.1E3 magenta 100 0.0 53.4 48.2 -14.5F3 cyan 100 0.0 52.0 -24.4 -26.6A4 white 100 0.0 93.7 0.0 1.1B4 neutral 8 100 0.0 80.9 -0.8 -0.7C4 neutral 6.5 100 0.0 67.2 -2.2 -1.4D4 neutral 5 100 0.0 51.4 -2.7 0.7E4 neutral 3.5 100 0.0 36.7 -2.1 0.3F4 black 100 0.0 18.5 3.4 -0.9A5 paper white 100 0.0 93.9 -0.1 0.6B5 skin highlight L*=89 100 0.0 86.2 12.0 12.5C5 skin highlight L*=75 100 0.0 75.1 19.0 20.1D5 skin shadow L*=25 100 0.0 24.8 17.9 16.8E5 skin shadow L*=11 100 0.0 16.5 8.2 8.0F5 Max Black 100 0.0 5.3 0.6 -2.0
Summary Results I*Color I*tone ∆E
Average Score for all patches 100 100 0.0
Average Score for the Worst 10%(3 lowest scoring patches) 100 100 0.0
Epson Stylus Photo R1400, Epson OEM Claria Ink,Epson Ultra Premium Photo Paper Luster
Colors at Zero Megalux-hours of Light Exposure(same as original print colors)”
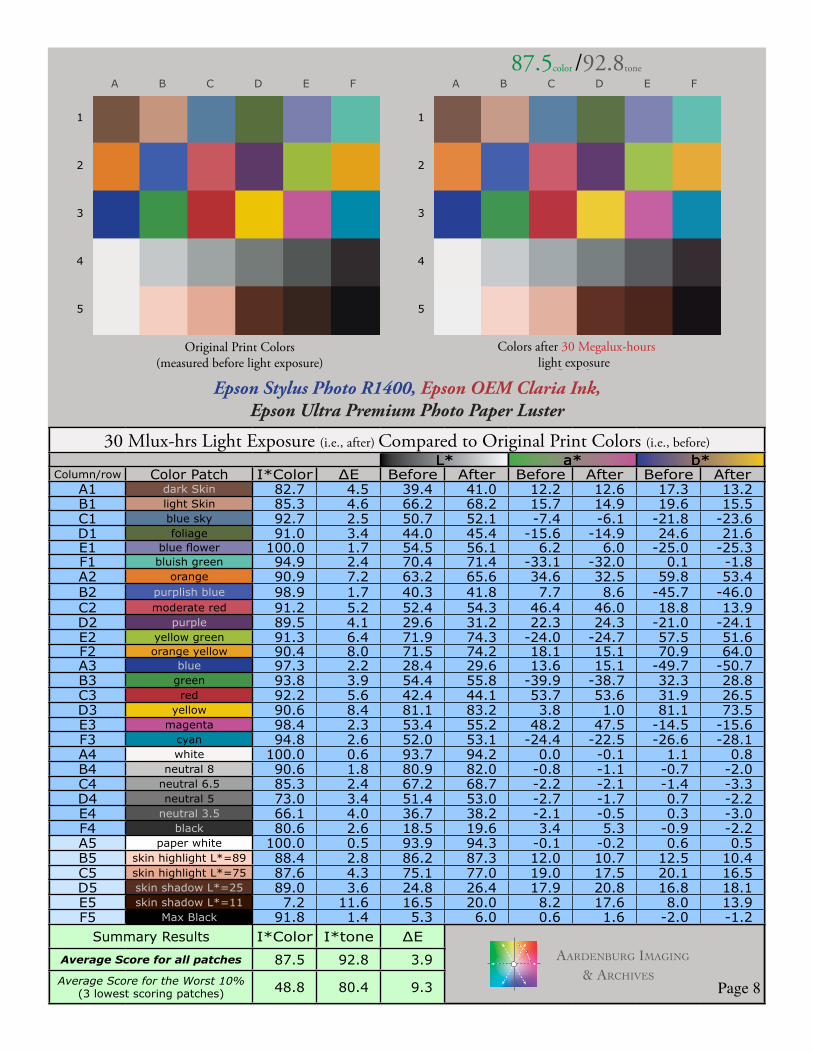
30 Mlux-hrs Light Exposure (i.e., after) Compared to Original Print Colors (i.e., before)L* a* b*
Column/row Color Patch I*Color ∆E Before After Before After Before AfterA1 dark Skin 82.7 4.5 39.4 41.0 12.2 12.6 17.3 13.2B1 light Skin 85.3 4.6 66.2 68.2 15.7 14.9 19.6 15.5C1 blue sky 92.7 2.5 50.7 52.1 -7.4 -6.1 -21.8 -23.6D1 foliage 91.0 3.4 44.0 45.4 -15.6 -14.9 24.6 21.6E1 blue flower 100.0 1.7 54.5 56.1 6.2 6.0 -25.0 -25.3F1 bluish green 94.9 2.4 70.4 71.4 -33.1 -32.0 0.1 -1.8A2 orange 90.9 7.2 63.2 65.6 34.6 32.5 59.8 53.4B2 purplish blue 98.9 1.7 40.3 41.8 7.7 8.6 -45.7 -46.0C2 moderate red 91.2 5.2 52.4 54.3 46.4 46.0 18.8 13.9D2 purple 89.5 4.1 29.6 31.2 22.3 24.3 -21.0 -24.1E2 yellow green 91.3 6.4 71.9 74.3 -24.0 -24.7 57.5 51.6F2 orange yellow 90.4 8.0 71.5 74.2 18.1 15.1 70.9 64.0A3 blue 97.3 2.2 28.4 29.6 13.6 15.1 -49.7 -50.7B3 green 93.8 3.9 54.4 55.8 -39.9 -38.7 32.3 28.8C3 red 92.2 5.6 42.4 44.1 53.7 53.6 31.9 26.5D3 yellow 90.6 8.4 81.1 83.2 3.8 1.0 81.1 73.5E3 magenta 98.4 2.3 53.4 55.2 48.2 47.5 -14.5 -15.6F3 cyan 94.8 2.6 52.0 53.1 -24.4 -22.5 -26.6 -28.1A4 white 100.0 0.6 93.7 94.2 0.0 -0.1 1.1 0.8B4 neutral 8 90.6 1.8 80.9 82.0 -0.8 -1.1 -0.7 -2.0C4 neutral 6.5 85.3 2.4 67.2 68.7 -2.2 -2.1 -1.4 -3.3D4 neutral 5 73.0 3.4 51.4 53.0 -2.7 -1.7 0.7 -2.2E4 neutral 3.5 66.1 4.0 36.7 38.2 -2.1 -0.5 0.3 -3.0F4 black 80.6 2.6 18.5 19.6 3.4 5.3 -0.9 -2.2A5 paper white 100.0 0.5 93.9 94.3 -0.1 -0.2 0.6 0.5B5 skin highlight L*=89 88.4 2.8 86.2 87.3 12.0 10.7 12.5 10.4C5 skin highlight L*=75 87.6 4.3 75.1 77.0 19.0 17.5 20.1 16.5D5 skin shadow L*=25 89.0 3.6 24.8 26.4 17.9 20.8 16.8 18.1E5 skin shadow L*=11 7.2 11.6 16.5 20.0 8.2 17.6 8.0 13.9F5 Max Black 91.8 1.4 5.3 6.0 0.6 1.6 -2.0 -1.2
Summary Results I*Color I*tone ∆E
Average Score for all patches 87.5 92.8 3.9
Average Score for the Worst 10%(3 lowest scoring patches) 48.8 80.4 9.3
Colors after 30 Megalux-hours light exposure”
87.5color /92.8tone

AArdenburg ImAgIng
& ArchIves
A B C D E F
1
2
3
4
5
A B C D E F
1
2
3
4
5
Page 9
Original Print Colors(measured before light exposure)
100color /100tone
Original Print Colors as Measured and at Start of TestL* a* b*
Column/row Color Patch I*Color ∆E Before After Before After Before AfterA1 dark Skin 100 0.0 39.4 12.2 17.3B1 light Skin 100 0.0 66.2 15.7 19.6C1 blue sky 100 0.0 50.7 -7.4 -21.8D1 foliage 100 0.0 44.0 -15.6 24.6E1 blue flower 100 0.0 54.5 6.2 -25.0F1 bluish green 100 0.0 70.4 -33.1 0.1A2 orange 100 0.0 63.2 34.6 59.8B2 purplish blue 100 0.0 40.3 7.7 -45.7C2 moderate red 100 0.0 52.4 46.4 18.8D2 purple 100 0.0 29.6 22.3 -21.0E2 yellow green 100 0.0 71.9 -24.0 57.5F2 orange yellow 100 0.0 71.5 18.1 70.9A3 blue 100 0.0 28.4 13.6 -49.7B3 green 100 0.0 54.4 -39.9 32.3C3 red 100 0.0 42.4 53.7 31.9D3 yellow 100 0.0 81.1 3.8 81.1E3 magenta 100 0.0 53.4 48.2 -14.5F3 cyan 100 0.0 52.0 -24.4 -26.6A4 white 100 0.0 93.7 0.0 1.1B4 neutral 8 100 0.0 80.9 -0.8 -0.7C4 neutral 6.5 100 0.0 67.2 -2.2 -1.4D4 neutral 5 100 0.0 51.4 -2.7 0.7E4 neutral 3.5 100 0.0 36.7 -2.1 0.3F4 black 100 0.0 18.5 3.4 -0.9A5 paper white 100 0.0 93.9 -0.1 0.6B5 skin highlight L*=89 100 0.0 86.2 12.0 12.5C5 skin highlight L*=75 100 0.0 75.1 19.0 20.1D5 skin shadow L*=25 100 0.0 24.8 17.9 16.8E5 skin shadow L*=11 100 0.0 16.5 8.2 8.0F5 Max Black 100 0.0 5.3 0.6 -2.0
Summary Results I*Color I*tone ∆E
Average Score for all patches 100 100 0.0
Average Score for the Worst 10%(3 lowest scoring patches) 100 100 0.0
Epson Stylus Photo R1400, Epson OEM Claria Ink,Epson Ultra Premium Photo Paper Luster
Colors at Zero Megalux-hours of Light Exposure(same as original print colors)”
40 Mlux-hrs Light Exposure (i.e., after) Compared to Original Print Colors (i.e., before)L* a* b*
Column/row Color Patch I*Color ∆E Before After Before After Before AfterA1 dark Skin 74.3 6.2 39.4 41.2 12.2 12.0 17.3 11.4B1 light Skin 81.4 5.6 66.2 68.5 15.7 14.5 19.6 14.6C1 blue sky 91.3 3.0 50.7 52.3 -7.4 -6.5 -21.8 -24.2D1 foliage 87.3 4.5 44.0 45.6 -15.6 -15.7 24.6 20.4E1 blue flower 99.2 2.2 54.5 56.6 6.2 5.6 -25.0 -25.4F1 bluish green 93.9 2.8 70.4 71.6 -33.1 -32.0 0.1 -2.1A2 orange 88.5 8.9 63.2 65.8 34.6 31.8 59.8 51.8B2 purplish blue 99.1 1.9 40.3 42.0 7.7 8.1 -45.7 -46.5C2 moderate red 87.4 7.1 52.4 54.4 46.4 45.7 18.8 12.0D2 purple 84.1 5.6 29.6 31.3 22.3 24.3 -21.0 -25.9E2 yellow green 89.7 7.4 71.9 74.6 -24.0 -24.8 57.5 50.6F2 orange yellow 88.3 9.6 71.5 74.6 18.1 14.5 70.9 62.6A3 blue 96.1 2.9 28.4 29.9 13.6 15.0 -49.7 -51.7B3 green 92.5 4.7 54.4 56.1 -39.9 -39.2 32.3 27.9C3 red 88.1 8.0 42.4 43.9 53.7 53.5 31.9 24.0D3 yellow 89.0 9.8 81.1 83.5 3.8 0.6 81.1 72.2E3 magenta 96.9 3.0 53.4 55.5 48.2 47.1 -14.5 -16.2F3 cyan 94.8 2.8 52.0 53.3 -24.4 -22.9 -26.6 -28.5A4 white 100.0 0.6 93.7 94.3 0.0 -0.1 1.1 0.9B4 neutral 8 88.8 2.1 80.9 82.3 -0.8 -1.1 -0.7 -2.2C4 neutral 6.5 82.0 2.9 67.2 69.0 -2.2 -2.3 -1.4 -3.6D4 neutral 5 65.1 4.3 51.4 53.3 -2.7 -2.1 0.7 -3.1E4 neutral 3.5 52.5 5.3 36.7 38.5 -2.1 -1.0 0.3 -4.6F4 black 75.5 3.0 18.5 19.5 3.4 4.7 -0.9 -3.4A5 paper white 100.0 0.5 93.9 94.4 -0.1 -0.2 0.6 0.6B5 skin highlight L*=89 86.0 3.3 86.2 87.6 12.0 10.4 12.5 10.1C5 skin highlight L*=75 84.8 5.2 75.1 77.3 19.0 17.1 20.1 15.8D5 skin shadow L*=25 92.1 2.9 24.8 26.2 17.9 20.2 16.8 17.6E5 skin shadow L*=11 7.2 11.7 16.5 20.0 8.2 17.7 8.0 13.8F5 Max Black 90.9 1.5 5.3 6.0 0.6 1.5 -2.0 -1.0
Summary Results I*Color I*tone ∆E
Average Score for all patches 84.9 92.2 4.6
Average Score for the Worst 10%(3 lowest scoring patches) 41.6 79.2 10.3
Colors after 40 Megalux-hours light exposure”
84.9color /92.2tone

AArdenburg ImAgIng
& ArchIves
A B C D E F
1
2
3
4
5
A B C D E F
1
2
3
4
5
Page 10
Original Print Colors(measured before light exposure)
100color /100tone
Original Print Colors as Measured and at Start of TestL* a* b*
Column/row Color Patch I*Color ∆E Before After Before After Before AfterA1 dark Skin 100 0.0 39.4 12.2 17.3B1 light Skin 100 0.0 66.2 15.7 19.6C1 blue sky 100 0.0 50.7 -7.4 -21.8D1 foliage 100 0.0 44.0 -15.6 24.6E1 blue flower 100 0.0 54.5 6.2 -25.0F1 bluish green 100 0.0 70.4 -33.1 0.1A2 orange 100 0.0 63.2 34.6 59.8B2 purplish blue 100 0.0 40.3 7.7 -45.7C2 moderate red 100 0.0 52.4 46.4 18.8D2 purple 100 0.0 29.6 22.3 -21.0E2 yellow green 100 0.0 71.9 -24.0 57.5F2 orange yellow 100 0.0 71.5 18.1 70.9A3 blue 100 0.0 28.4 13.6 -49.7B3 green 100 0.0 54.4 -39.9 32.3C3 red 100 0.0 42.4 53.7 31.9D3 yellow 100 0.0 81.1 3.8 81.1E3 magenta 100 0.0 53.4 48.2 -14.5F3 cyan 100 0.0 52.0 -24.4 -26.6A4 white 100 0.0 93.7 0.0 1.1B4 neutral 8 100 0.0 80.9 -0.8 -0.7C4 neutral 6.5 100 0.0 67.2 -2.2 -1.4D4 neutral 5 100 0.0 51.4 -2.7 0.7E4 neutral 3.5 100 0.0 36.7 -2.1 0.3F4 black 100 0.0 18.5 3.4 -0.9A5 paper white 100 0.0 93.9 -0.1 0.6B5 skin highlight L*=89 100 0.0 86.2 12.0 12.5C5 skin highlight L*=75 100 0.0 75.1 19.0 20.1D5 skin shadow L*=25 100 0.0 24.8 17.9 16.8E5 skin shadow L*=11 100 0.0 16.5 8.2 8.0F5 Max Black 100 0.0 5.3 0.6 -2.0
Summary Results I*Color I*tone ∆E
Average Score for all patches 100 100 0.0
Average Score for the Worst 10%(3 lowest scoring patches) 100 100 0.0
Epson Stylus Photo R1400, Epson OEM Claria Ink,Epson Ultra Premium Photo Paper Luster
Colors at Zero Megalux-hours of Light Exposure(same as original print colors)”
50 Mlux-hrs Light Exposure (i.e., after) Compared to Original Print Colors (i.e., before)L* a* b*
Column/row Color Patch I*Color ∆E Before After Before After Before AfterA1 dark Skin 68.1 7.6 39.4 41.5 12.2 11.9 17.3 10.1B1 light Skin 77.9 6.6 66.2 68.8 15.7 14.2 19.6 13.8C1 blue sky 90.0 3.4 50.7 52.6 -7.4 -6.4 -21.8 -24.5D1 foliage 83.9 5.5 44.0 45.9 -15.6 -15.9 24.6 19.4E1 blue flower 98.7 2.8 54.5 57.2 6.2 5.4 -25.0 -25.4F1 bluish green 92.6 3.3 70.4 71.8 -33.1 -31.7 0.1 -2.5A2 orange 86.3 10.4 63.2 66.2 34.6 31.3 59.8 50.4B2 purplish blue 99.1 2.2 40.3 42.3 7.7 8.0 -45.7 -46.5C2 moderate red 85.0 8.4 52.4 54.7 46.4 45.5 18.8 10.8D2 purple 80.0 6.9 29.6 31.6 22.3 24.6 -21.0 -27.2E2 yellow green 87.9 8.6 71.9 74.9 -24.0 -24.8 57.5 49.5F2 orange yellow 86.1 11.2 71.5 75.0 18.1 13.9 70.9 61.1A3 blue 95.3 3.4 28.4 30.1 13.6 15.0 -49.7 -52.2B3 green 90.6 5.6 54.4 56.3 -39.9 -39.2 32.3 27.0C3 red 84.9 10.0 42.4 44.0 53.7 53.4 31.9 22.0D3 yellow 86.9 11.4 81.1 83.9 3.8 0.1 81.1 70.6E3 magenta 96.0 3.5 53.4 55.8 48.2 46.8 -14.5 -16.5F3 cyan 93.7 3.2 52.0 53.6 -24.4 -22.7 -26.6 -28.8A4 white 100.0 0.7 93.7 94.4 0.0 -0.1 1.1 1.0B4 neutral 8 86.8 2.5 80.9 82.6 -0.8 -1.1 -0.7 -2.4C4 neutral 6.5 77.2 3.4 67.2 69.4 -2.2 -2.3 -1.4 -4.0D4 neutral 5 57.6 5.1 51.4 53.7 -2.7 -2.0 0.7 -3.8E4 neutral 3.5 38.1 6.7 36.7 38.8 -2.1 -0.8 0.3 -5.9F4 black 66.6 3.8 18.5 19.7 3.4 4.8 -0.9 -4.3A5 paper white 100.0 0.6 93.9 94.5 -0.1 -0.2 0.6 0.6B5 skin highlight L*=89 83.0 3.9 86.2 87.9 12.0 10.1 12.5 9.7C5 skin highlight L*=75 81.3 6.2 75.1 77.7 19.0 16.7 20.1 14.9D5 skin shadow L*=25 93.1 2.8 24.8 26.5 17.9 20.0 16.8 16.9E5 skin shadow L*=11 3.0 12.2 16.5 20.4 8.2 18.1 8.0 14.0F5 Max Black 89.5 1.6 5.3 6.0 0.6 1.7 -2.0 -1.0
Summary Results I*Color I*tone ∆E
Average Score for all patches 82.0 91.2 5.4
Average Score for the Worst 10%(3 lowest scoring patches) 32.9 77.6 11.6
Colors after 50 Megalux-hours light exposure”
82.0color /91.2tone

AArdenburg ImAgIng
& ArchIves
A B C D E F
1
2
3
4
5
A B C D E F
1
2
3
4
5
Page 11
Original Print Colors(measured before light exposure)
100color /100tone
Original Print Colors as Measured and at Start of TestL* a* b*
Column/row Color Patch I*Color ∆E Before After Before After Before AfterA1 dark Skin 100 0.0 39.4 12.2 17.3B1 light Skin 100 0.0 66.2 15.7 19.6C1 blue sky 100 0.0 50.7 -7.4 -21.8D1 foliage 100 0.0 44.0 -15.6 24.6E1 blue flower 100 0.0 54.5 6.2 -25.0F1 bluish green 100 0.0 70.4 -33.1 0.1A2 orange 100 0.0 63.2 34.6 59.8B2 purplish blue 100 0.0 40.3 7.7 -45.7C2 moderate red 100 0.0 52.4 46.4 18.8D2 purple 100 0.0 29.6 22.3 -21.0E2 yellow green 100 0.0 71.9 -24.0 57.5F2 orange yellow 100 0.0 71.5 18.1 70.9A3 blue 100 0.0 28.4 13.6 -49.7B3 green 100 0.0 54.4 -39.9 32.3C3 red 100 0.0 42.4 53.7 31.9D3 yellow 100 0.0 81.1 3.8 81.1E3 magenta 100 0.0 53.4 48.2 -14.5F3 cyan 100 0.0 52.0 -24.4 -26.6A4 white 100 0.0 93.7 0.0 1.1B4 neutral 8 100 0.0 80.9 -0.8 -0.7C4 neutral 6.5 100 0.0 67.2 -2.2 -1.4D4 neutral 5 100 0.0 51.4 -2.7 0.7E4 neutral 3.5 100 0.0 36.7 -2.1 0.3F4 black 100 0.0 18.5 3.4 -0.9A5 paper white 100 0.0 93.9 -0.1 0.6B5 skin highlight L*=89 100 0.0 86.2 12.0 12.5C5 skin highlight L*=75 100 0.0 75.1 19.0 20.1D5 skin shadow L*=25 100 0.0 24.8 17.9 16.8E5 skin shadow L*=11 100 0.0 16.5 8.2 8.0F5 Max Black 100 0.0 5.3 0.6 -2.0
Summary Results I*Color I*tone ∆E
Average Score for all patches 100 100 0.0
Average Score for the Worst 10%(3 lowest scoring patches) 100 100 0.0
Epson Stylus Photo R1400, Epson OEM Claria Ink,Epson Ultra Premium Photo Paper Luster
Colors at Zero Megalux-hours of Light Exposure(same as original print colors)”
60 Mlux-hrs Light Exposure (i.e., after) Compared to Original Print Colors (i.e., before)L* a* b*
Column/row Color Patch I*Color ∆E Before After Before After Before AfterA1 dark Skin 65.4 8.2 39.4 41.8 12.2 11.8 17.3 9.5B1 light Skin 76.6 7.0 66.2 69.1 15.7 14.1 19.6 13.5C1 blue sky 90.6 3.4 50.7 52.9 -7.4 -6.6 -21.8 -24.4D1 foliage 82.9 5.9 44.0 46.1 -15.6 -15.9 24.6 19.1E1 blue flower 97.8 3.2 54.5 57.6 6.2 5.1 -25.0 -24.9F1 bluish green 92.8 3.3 70.4 72.0 -33.1 -31.5 0.1 -2.3A2 orange 85.2 11.2 63.2 66.5 34.6 31.0 59.8 49.8B2 purplish blue 99.7 2.4 40.3 42.7 7.7 7.6 -45.7 -46.3C2 moderate red 83.7 9.0 52.4 55.0 46.4 45.3 18.8 10.2D2 purple 79.1 7.3 29.6 31.9 22.3 24.5 -21.0 -27.5E2 yellow green 87.3 9.0 71.9 75.1 -24.0 -24.6 57.5 49.1F2 orange yellow 84.9 12.1 71.5 75.3 18.1 13.6 70.9 60.3A3 blue 95.8 3.3 28.4 30.4 13.6 14.7 -49.7 -52.0B3 green 90.2 5.9 54.4 56.5 -39.9 -39.1 32.3 26.8C3 red 83.6 10.9 42.4 44.3 53.7 53.4 31.9 21.2D3 yellow 86.1 12.1 81.1 84.0 3.8 0.0 81.1 70.0E3 magenta 95.6 3.9 53.4 56.2 48.2 46.4 -14.5 -16.5F3 cyan 94.4 3.2 52.0 53.9 -24.4 -22.8 -26.6 -28.6A4 white 100.0 0.8 93.7 94.4 0.0 -0.1 1.1 1.4B4 neutral 8 89.9 2.4 80.9 82.8 -0.8 -1.2 -0.7 -2.1C4 neutral 6.5 78.1 3.5 67.2 69.6 -2.2 -2.4 -1.4 -3.9D4 neutral 5 55.6 5.4 51.4 54.0 -2.7 -2.2 0.7 -4.0E4 neutral 3.5 34.2 7.2 36.7 39.1 -2.1 -0.9 0.3 -6.3F4 black 64.3 4.1 18.5 19.9 3.4 4.9 -0.9 -4.5A5 paper white 100.0 0.7 93.9 94.5 -0.1 -0.2 0.6 1.0B5 skin highlight L*=89 83.0 3.9 86.2 88.0 12.0 9.9 12.5 9.8C5 skin highlight L*=75 80.2 6.6 75.1 77.9 19.0 16.5 20.1 14.7D5 skin shadow L*=25 92.4 3.1 24.8 26.8 17.9 20.2 16.8 17.1E5 skin shadow L*=11 -3.9 13.2 16.5 20.9 8.2 18.7 8.0 14.5F5 Max Black 88.2 1.8 5.3 6.2 0.6 1.8 -2.0 -0.9
Summary Results I*Color I*tone ∆E
Average Score for all patches 81.1 90.5 5.8
Average Score for the Worst 10%(3 lowest scoring patches) 28.6 75.4 12.5
Colors after 60 Megalux-hours light exposure”
81.1color /90.5tone

AArdenburg ImAgIng
& ArchIves
A B C D E F
1
2
3
4
5
A B C D E F
1
2
3
4
5
Page 12
Original Print Colors(measured before light exposure)
100color /100tone
Original Print Colors as Measured and at Start of TestL* a* b*
Column/row Color Patch I*Color ∆E Before After Before After Before AfterA1 dark Skin 100 0.0 39.4 12.2 17.3B1 light Skin 100 0.0 66.2 15.7 19.6C1 blue sky 100 0.0 50.7 -7.4 -21.8D1 foliage 100 0.0 44.0 -15.6 24.6E1 blue flower 100 0.0 54.5 6.2 -25.0F1 bluish green 100 0.0 70.4 -33.1 0.1A2 orange 100 0.0 63.2 34.6 59.8B2 purplish blue 100 0.0 40.3 7.7 -45.7C2 moderate red 100 0.0 52.4 46.4 18.8D2 purple 100 0.0 29.6 22.3 -21.0E2 yellow green 100 0.0 71.9 -24.0 57.5F2 orange yellow 100 0.0 71.5 18.1 70.9A3 blue 100 0.0 28.4 13.6 -49.7B3 green 100 0.0 54.4 -39.9 32.3C3 red 100 0.0 42.4 53.7 31.9D3 yellow 100 0.0 81.1 3.8 81.1E3 magenta 100 0.0 53.4 48.2 -14.5F3 cyan 100 0.0 52.0 -24.4 -26.6A4 white 100 0.0 93.7 0.0 1.1B4 neutral 8 100 0.0 80.9 -0.8 -0.7C4 neutral 6.5 100 0.0 67.2 -2.2 -1.4D4 neutral 5 100 0.0 51.4 -2.7 0.7E4 neutral 3.5 100 0.0 36.7 -2.1 0.3F4 black 100 0.0 18.5 3.4 -0.9A5 paper white 100 0.0 93.9 -0.1 0.6B5 skin highlight L*=89 100 0.0 86.2 12.0 12.5C5 skin highlight L*=75 100 0.0 75.1 19.0 20.1D5 skin shadow L*=25 100 0.0 24.8 17.9 16.8E5 skin shadow L*=11 100 0.0 16.5 8.2 8.0F5 Max Black 100 0.0 5.3 0.6 -2.0
Summary Results I*Color I*tone ∆E
Average Score for all patches 100 100 0.0
Average Score for the Worst 10%(3 lowest scoring patches) 100 100 0.0
Epson Stylus Photo R1400, Epson OEM Claria Ink,Epson Ultra Premium Photo Paper Luster
Colors at Zero Megalux-hours of Light Exposure(same as original print colors)”
70 Mlux-hrs Light Exposure (i.e., after) Compared to Original Print Colors (i.e., before)L* a* b*
Column/row Color Patch I*Color ∆E Before After Before After Before AfterA1 dark Skin 63.3 8.7 39.4 42.2 12.2 11.7 17.3 9.1B1 light Skin 75.1 7.5 66.2 69.4 15.7 13.9 19.6 13.1C1 blue sky 91.5 3.6 50.7 53.3 -7.4 -6.7 -21.8 -24.2D1 foliage 82.1 6.2 44.0 46.5 -15.6 -16.0 24.6 18.9E1 blue flower 96.6 3.9 54.5 58.2 6.2 4.9 -25.0 -24.4F1 bluish green 92.6 3.5 70.4 72.2 -33.1 -31.2 0.1 -2.2A2 orange 83.9 12.2 63.2 66.8 34.6 30.6 59.8 48.9B2 purplish blue 99.7 2.8 40.3 43.1 7.7 7.1 -45.7 -45.9C2 moderate red 82.4 9.8 52.4 55.4 46.4 45.0 18.8 9.6D2 purple 78.0 7.7 29.6 32.3 22.3 24.6 -21.0 -27.8E2 yellow green 86.6 9.5 71.9 75.3 -24.0 -24.4 57.5 48.6F2 orange yellow 83.6 13.2 71.5 75.6 18.1 13.3 70.9 59.3A3 blue 96.3 3.3 28.4 30.7 13.6 14.4 -49.7 -51.9B3 green 89.8 6.2 54.4 56.8 -39.9 -39.0 32.3 26.6C3 red 82.4 11.7 42.4 44.7 53.7 53.4 31.9 20.4D3 yellow 85.2 12.9 81.1 84.3 3.8 -0.1 81.1 69.2E3 magenta 94.9 4.5 53.4 56.6 48.2 46.0 -14.5 -16.6F3 cyan 94.8 3.3 52.0 54.2 -24.4 -22.9 -26.6 -28.5A4 white 100.0 0.9 93.7 94.5 0.0 -0.1 1.1 1.6B4 neutral 8 91.0 2.6 80.9 83.1 -0.8 -1.2 -0.7 -1.9C4 neutral 6.5 77.8 3.8 67.2 69.9 -2.2 -2.5 -1.4 -4.0D4 neutral 5 53.5 5.7 51.4 54.4 -2.7 -2.3 0.7 -4.2E4 neutral 3.5 29.8 7.7 36.7 39.5 -2.1 -0.9 0.3 -6.8F4 black 61.5 4.4 18.5 20.1 3.4 5.2 -0.9 -4.6A5 paper white 99.7 0.8 93.9 94.6 -0.1 -0.2 0.6 1.2B5 skin highlight L*=89 81.7 4.2 86.2 88.1 12.0 9.7 12.5 9.7C5 skin highlight L*=75 78.6 7.1 75.1 78.2 19.0 16.2 20.1 14.3D5 skin shadow L*=25 91.1 3.7 24.8 27.3 17.9 20.5 16.8 17.4E5 skin shadow L*=11 -14.7 14.5 16.5 21.5 8.2 19.6 8.0 15.4F5 Max Black 85.1 2.1 5.3 6.2 0.6 1.9 -2.0 -0.6
Summary Results I*Color I*tone ∆E
Average Score for all patches 79.8 89.7 6.3
Average Score for the Worst 10%(3 lowest scoring patches) 22.9 73.3 13.5
Colors after 70 Megalux-hours light exposure”
79.8color /89.7tone
AArdenburg ImAgIng
& ArchIves
A B C D E F
1
2
3
4
5
A B C D E F
1
2
3
4
5
Page 13
Original Print Colors(measured before light exposure)
100color /100tone
Original Print Colors as Measured and at Start of TestL* a* b*
Column/row Color Patch I*Color ∆E Before After Before After Before AfterA1 dark Skin 100 0.0 39.4 12.2 17.3B1 light Skin 100 0.0 66.2 15.7 19.6C1 blue sky 100 0.0 50.7 -7.4 -21.8D1 foliage 100 0.0 44.0 -15.6 24.6E1 blue flower 100 0.0 54.5 6.2 -25.0F1 bluish green 100 0.0 70.4 -33.1 0.1A2 orange 100 0.0 63.2 34.6 59.8B2 purplish blue 100 0.0 40.3 7.7 -45.7C2 moderate red 100 0.0 52.4 46.4 18.8D2 purple 100 0.0 29.6 22.3 -21.0E2 yellow green 100 0.0 71.9 -24.0 57.5F2 orange yellow 100 0.0 71.5 18.1 70.9A3 blue 100 0.0 28.4 13.6 -49.7B3 green 100 0.0 54.4 -39.9 32.3C3 red 100 0.0 42.4 53.7 31.9D3 yellow 100 0.0 81.1 3.8 81.1E3 magenta 100 0.0 53.4 48.2 -14.5F3 cyan 100 0.0 52.0 -24.4 -26.6A4 white 100 0.0 93.7 0.0 1.1B4 neutral 8 100 0.0 80.9 -0.8 -0.7C4 neutral 6.5 100 0.0 67.2 -2.2 -1.4D4 neutral 5 100 0.0 51.4 -2.7 0.7E4 neutral 3.5 100 0.0 36.7 -2.1 0.3F4 black 100 0.0 18.5 3.4 -0.9A5 paper white 100 0.0 93.9 -0.1 0.6B5 skin highlight L*=89 100 0.0 86.2 12.0 12.5C5 skin highlight L*=75 100 0.0 75.1 19.0 20.1D5 skin shadow L*=25 100 0.0 24.8 17.9 16.8E5 skin shadow L*=11 100 0.0 16.5 8.2 8.0F5 Max Black 100 0.0 5.3 0.6 -2.0
Summary Results I*Color I*tone ∆E
Average Score for all patches 100 100 0.0
Average Score for the Worst 10%(3 lowest scoring patches) 100 100 0.0
Epson Stylus Photo R1400, Epson OEM Claria Ink,Epson Ultra Premium Photo Paper Luster
Colors at Zero Megalux-hours of Light Exposure(same as original print colors)”
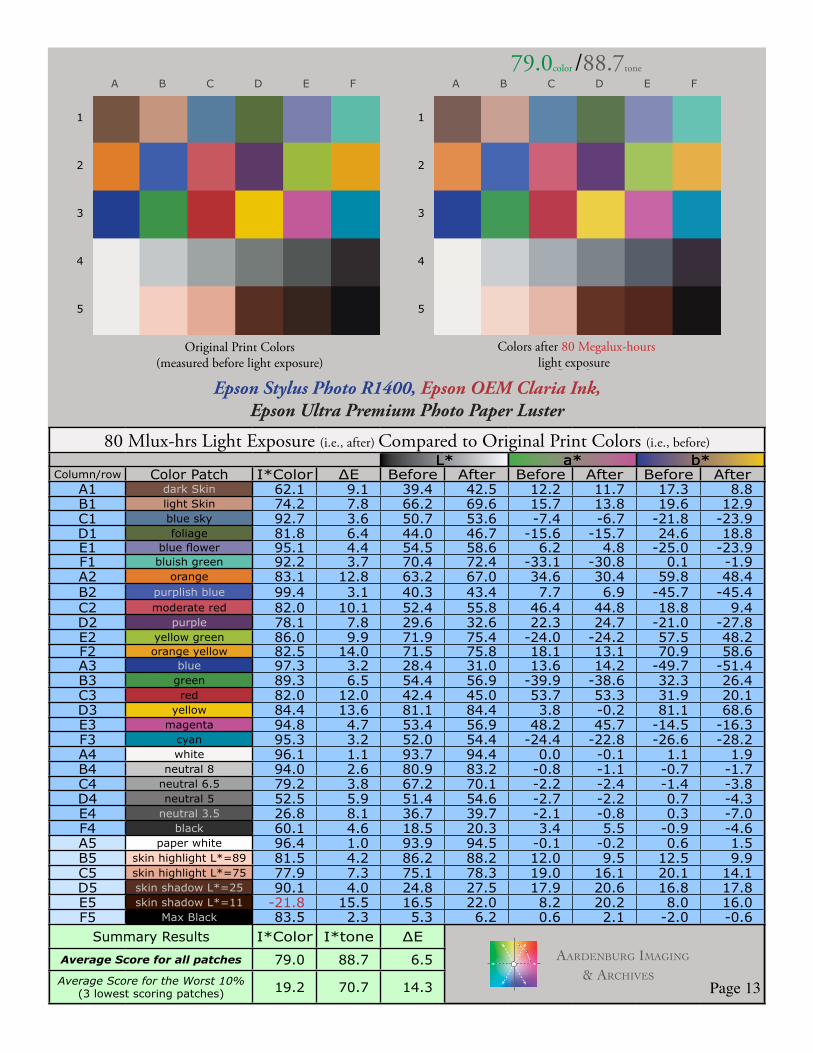
80 Mlux-hrs Light Exposure (i.e., after) Compared to Original Print Colors (i.e., before)L* a* b*
Column/row Color Patch I*Color ∆E Before After Before After Before AfterA1 dark Skin 62.1 9.1 39.4 42.5 12.2 11.7 17.3 8.8B1 light Skin 74.2 7.8 66.2 69.6 15.7 13.8 19.6 12.9C1 blue sky 92.7 3.6 50.7 53.6 -7.4 -6.7 -21.8 -23.9D1 foliage 81.8 6.4 44.0 46.7 -15.6 -15.7 24.6 18.8E1 blue flower 95.1 4.4 54.5 58.6 6.2 4.8 -25.0 -23.9F1 bluish green 92.2 3.7 70.4 72.4 -33.1 -30.8 0.1 -1.9A2 orange 83.1 12.8 63.2 67.0 34.6 30.4 59.8 48.4B2 purplish blue 99.4 3.1 40.3 43.4 7.7 6.9 -45.7 -45.4C2 moderate red 82.0 10.1 52.4 55.8 46.4 44.8 18.8 9.4D2 purple 78.1 7.8 29.6 32.6 22.3 24.7 -21.0 -27.8E2 yellow green 86.0 9.9 71.9 75.4 -24.0 -24.2 57.5 48.2F2 orange yellow 82.5 14.0 71.5 75.8 18.1 13.1 70.9 58.6A3 blue 97.3 3.2 28.4 31.0 13.6 14.2 -49.7 -51.4B3 green 89.3 6.5 54.4 56.9 -39.9 -38.6 32.3 26.4C3 red 82.0 12.0 42.4 45.0 53.7 53.3 31.9 20.1D3 yellow 84.4 13.6 81.1 84.4 3.8 -0.2 81.1 68.6E3 magenta 94.8 4.7 53.4 56.9 48.2 45.7 -14.5 -16.3F3 cyan 95.3 3.2 52.0 54.4 -24.4 -22.8 -26.6 -28.2A4 white 96.1 1.1 93.7 94.4 0.0 -0.1 1.1 1.9B4 neutral 8 94.0 2.6 80.9 83.2 -0.8 -1.1 -0.7 -1.7C4 neutral 6.5 79.2 3.8 67.2 70.1 -2.2 -2.4 -1.4 -3.8D4 neutral 5 52.5 5.9 51.4 54.6 -2.7 -2.2 0.7 -4.3E4 neutral 3.5 26.8 8.1 36.7 39.7 -2.1 -0.8 0.3 -7.0F4 black 60.1 4.6 18.5 20.3 3.4 5.5 -0.9 -4.6A5 paper white 96.4 1.0 93.9 94.5 -0.1 -0.2 0.6 1.5B5 skin highlight L*=89 81.5 4.2 86.2 88.2 12.0 9.5 12.5 9.9C5 skin highlight L*=75 77.9 7.3 75.1 78.3 19.0 16.1 20.1 14.1D5 skin shadow L*=25 90.1 4.0 24.8 27.5 17.9 20.6 16.8 17.8E5 skin shadow L*=11 -21.8 15.5 16.5 22.0 8.2 20.2 8.0 16.0F5 Max Black 83.5 2.3 5.3 6.2 0.6 2.1 -2.0 -0.6
Summary Results I*Color I*tone ∆E
Average Score for all patches 79.0 88.7 6.5
Average Score for the Worst 10%(3 lowest scoring patches) 19.2 70.7 14.3
Colors after 80 Megalux-hours light exposure”
79.0color /88.7tone

AArdenburg ImAgIng
& ArchIves
A B C D E F
1
2
3
4
5
A B C D E F
1
2
3
4
5
Page 14
Original Print Colors(measured before light exposure)
100color /100tone
Original Print Colors as Measured and at Start of TestL* a* b*
Column/row Color Patch I*Color ∆E Before After Before After Before AfterA1 dark Skin 100 0.0 39.4 12.2 17.3B1 light Skin 100 0.0 66.2 15.7 19.6C1 blue sky 100 0.0 50.7 -7.4 -21.8D1 foliage 100 0.0 44.0 -15.6 24.6E1 blue flower 100 0.0 54.5 6.2 -25.0F1 bluish green 100 0.0 70.4 -33.1 0.1A2 orange 100 0.0 63.2 34.6 59.8B2 purplish blue 100 0.0 40.3 7.7 -45.7C2 moderate red 100 0.0 52.4 46.4 18.8D2 purple 100 0.0 29.6 22.3 -21.0E2 yellow green 100 0.0 71.9 -24.0 57.5F2 orange yellow 100 0.0 71.5 18.1 70.9A3 blue 100 0.0 28.4 13.6 -49.7B3 green 100 0.0 54.4 -39.9 32.3C3 red 100 0.0 42.4 53.7 31.9D3 yellow 100 0.0 81.1 3.8 81.1E3 magenta 100 0.0 53.4 48.2 -14.5F3 cyan 100 0.0 52.0 -24.4 -26.6A4 white 100 0.0 93.7 0.0 1.1B4 neutral 8 100 0.0 80.9 -0.8 -0.7C4 neutral 6.5 100 0.0 67.2 -2.2 -1.4D4 neutral 5 100 0.0 51.4 -2.7 0.7E4 neutral 3.5 100 0.0 36.7 -2.1 0.3F4 black 100 0.0 18.5 3.4 -0.9A5 paper white 100 0.0 93.9 -0.1 0.6B5 skin highlight L*=89 100 0.0 86.2 12.0 12.5C5 skin highlight L*=75 100 0.0 75.1 19.0 20.1D5 skin shadow L*=25 100 0.0 24.8 17.9 16.8E5 skin shadow L*=11 100 0.0 16.5 8.2 8.0F5 Max Black 100 0.0 5.3 0.6 -2.0
Summary Results I*Color I*tone ∆E
Average Score for all patches 100 100 0.0
Average Score for the Worst 10%(3 lowest scoring patches) 100 100 0.0
Epson Stylus Photo R1400, Epson OEM Claria Ink,Epson Ultra Premium Photo Paper Luster
Colors at Zero Megalux-hours of Light Exposure(same as original print colors)”
90 Mlux-hrs Light Exposure (i.e., after) Compared to Original Print Colors (i.e., before)L* a* b*
Column/row Color Patch I*Color ∆E Before After Before After Before AfterA1 dark Skin 57.2 10.2 39.4 42.8 12.2 11.6 17.3 7.8B1 light Skin 71.7 8.5 66.2 70.0 15.7 13.6 19.6 12.3C1 blue sky 91.6 4.1 50.7 54.0 -7.4 -6.6 -21.8 -24.1D1 foliage 79.3 7.2 44.0 46.9 -15.6 -15.8 24.6 18.1E1 blue flower 94.6 4.9 54.5 59.0 6.2 4.7 -25.0 -23.8F1 bluish green 91.0 4.2 70.4 72.6 -33.1 -30.4 0.1 -2.1A2 orange 81.3 14.0 63.2 67.3 34.6 30.0 59.8 47.2B2 purplish blue 98.8 3.5 40.3 43.7 7.7 6.7 -45.7 -45.3C2 moderate red 80.1 11.1 52.4 56.0 46.4 44.6 18.8 8.5D2 purple 75.7 8.6 29.6 32.9 22.3 24.7 -21.0 -28.5E2 yellow green 84.7 10.7 71.9 75.7 -24.0 -24.1 57.5 47.4F2 orange yellow 80.7 15.3 71.5 76.0 18.1 12.7 70.9 57.3A3 blue 97.3 3.4 28.4 31.2 13.6 14.0 -49.7 -51.5B3 green 88.1 7.1 54.4 57.1 -39.9 -38.5 32.3 25.8C3 red 80.0 13.3 42.4 45.2 53.7 53.1 31.9 18.9D3 yellow 83.3 14.5 81.1 84.5 3.8 -0.4 81.1 67.7E3 magenta 94.0 5.3 53.4 57.3 48.2 45.3 -14.5 -16.4F3 cyan 94.8 3.5 52.0 54.6 -24.4 -22.7 -26.6 -28.3A4 white 96.9 1.0 93.7 94.4 0.0 -0.1 1.1 1.9B4 neutral 8 93.9 2.8 80.9 83.4 -0.8 -1.1 -0.7 -1.7C4 neutral 6.5 76.5 4.2 67.2 70.4 -2.2 -2.4 -1.4 -4.1D4 neutral 5 46.9 6.5 51.4 54.9 -2.7 -2.2 0.7 -4.8E4 neutral 3.5 17.9 9.0 36.7 40.0 -2.1 -0.7 0.3 -7.9F4 black 54.8 5.2 18.5 20.5 3.4 5.6 -0.9 -5.2A5 paper white 96.9 1.0 93.9 94.5 -0.1 -0.2 0.6 1.4B5 skin highlight L*=89 79.2 4.7 86.2 88.3 12.0 9.2 12.5 9.6C5 skin highlight L*=75 75.6 8.0 75.1 78.6 19.0 15.8 20.1 13.6D5 skin shadow L*=25 90.6 4.0 24.8 27.6 17.9 20.5 16.8 17.7E5 skin shadow L*=11 -25.4 16.0 16.5 22.4 8.2 20.5 8.0 16.2F5 Max Black 82.4 2.4 5.3 6.4 0.6 2.2 -2.0 -0.6
Summary Results I*Color I*tone ∆E
Average Score for all patches 77.0 87.9 7.1
Average Score for the Worst 10%(3 lowest scoring patches) 13.1 69.2 15.3
Colors after 90 Megalux-hours light exposure”
77.0color /87.9tone

AArdenburg ImAgIng
& ArchIves
A B C D E F
1
2
3
4
5
A B C D E F
1
2
3
4
5
Page 15
Original Print Colors(measured before light exposure)
100color /100tone
Original Print Colors as Measured and at Start of TestL* a* b*
Column/row Color Patch I*Color ∆E Before After Before After Before AfterA1 dark Skin 100 0.0 39.4 12.2 17.3B1 light Skin 100 0.0 66.2 15.7 19.6C1 blue sky 100 0.0 50.7 -7.4 -21.8D1 foliage 100 0.0 44.0 -15.6 24.6E1 blue flower 100 0.0 54.5 6.2 -25.0F1 bluish green 100 0.0 70.4 -33.1 0.1A2 orange 100 0.0 63.2 34.6 59.8B2 purplish blue 100 0.0 40.3 7.7 -45.7C2 moderate red 100 0.0 52.4 46.4 18.8D2 purple 100 0.0 29.6 22.3 -21.0E2 yellow green 100 0.0 71.9 -24.0 57.5F2 orange yellow 100 0.0 71.5 18.1 70.9A3 blue 100 0.0 28.4 13.6 -49.7B3 green 100 0.0 54.4 -39.9 32.3C3 red 100 0.0 42.4 53.7 31.9D3 yellow 100 0.0 81.1 3.8 81.1E3 magenta 100 0.0 53.4 48.2 -14.5F3 cyan 100 0.0 52.0 -24.4 -26.6A4 white 100 0.0 93.7 0.0 1.1B4 neutral 8 100 0.0 80.9 -0.8 -0.7C4 neutral 6.5 100 0.0 67.2 -2.2 -1.4D4 neutral 5 100 0.0 51.4 -2.7 0.7E4 neutral 3.5 100 0.0 36.7 -2.1 0.3F4 black 100 0.0 18.5 3.4 -0.9A5 paper white 100 0.0 93.9 -0.1 0.6B5 skin highlight L*=89 100 0.0 86.2 12.0 12.5C5 skin highlight L*=75 100 0.0 75.1 19.0 20.1D5 skin shadow L*=25 100 0.0 24.8 17.9 16.8E5 skin shadow L*=11 100 0.0 16.5 8.2 8.0F5 Max Black 100 0.0 5.3 0.6 -2.0
Summary Results I*Color I*tone ∆E
Average Score for all patches 100 100 0.0
Average Score for the Worst 10%(3 lowest scoring patches) 100 100 0.0
Epson Stylus Photo R1400, Epson OEM Claria Ink,Epson Ultra Premium Photo Paper Luster
Colors at Zero Megalux-hours of Light Exposure(same as original print colors)”
100 Mlux-hrs Light Exposure (i.e., after) Compared to Original Print Colors (i.e., before)L* a* b*
Column/row Color Patch I*Color ∆E Before After Before After Before AfterA1 dark Skin 51.0 11.5 39.4 43.2 12.2 11.3 17.3 6.5B1 light Skin 68.9 9.3 66.2 70.4 15.7 13.3 19.6 11.7C1 blue sky 91.3 4.5 50.7 54.5 -7.4 -6.9 -21.8 -24.3D1 foliage 76.4 8.1 44.0 47.4 -15.6 -16.2 24.6 17.3E1 blue flower 92.9 5.6 54.5 59.5 6.2 4.4 -25.0 -23.5F1 bluish green 90.2 4.6 70.4 73.0 -33.1 -30.1 0.1 -2.2A2 orange 79.5 15.3 63.2 67.7 34.6 29.4 59.8 46.1B2 purplish blue 97.7 4.2 40.3 44.2 7.7 6.2 -45.7 -45.2C2 moderate red 77.8 12.3 52.4 56.4 46.4 44.3 18.8 7.3D2 purple 72.6 9.6 29.6 33.3 22.3 24.7 -21.0 -29.5E2 yellow green 83.5 11.6 71.9 76.0 -24.0 -24.0 57.5 46.7F2 orange yellow 79.2 16.5 71.5 76.5 18.1 12.3 70.9 56.3A3 blue 96.8 3.8 28.4 31.6 13.6 13.8 -49.7 -51.8B3 green 86.7 7.9 54.4 57.5 -39.9 -38.7 32.3 25.0C3 red 77.4 14.9 42.4 45.3 53.7 53.2 31.9 17.3D3 yellow 82.1 15.5 81.1 84.9 3.8 -0.6 81.1 66.7E3 magenta 93.1 6.0 53.4 57.8 48.2 44.9 -14.5 -16.7F3 cyan 95.1 3.8 52.0 55.1 -24.4 -22.9 -26.6 -28.3A4 white 93.7 1.3 93.7 94.5 0.0 -0.1 1.1 2.2B4 neutral 8 95.9 3.1 80.9 83.9 -0.8 -1.1 -0.7 -1.5C4 neutral 6.5 76.2 4.7 67.2 71.0 -2.2 -2.5 -1.4 -4.1D4 neutral 5 41.8 7.3 51.4 55.5 -2.7 -2.5 0.7 -5.3E4 neutral 3.5 8.2 10.0 36.7 40.5 -2.1 -1.0 0.3 -8.8F4 black 47.5 5.9 18.5 20.7 3.4 5.4 -0.9 -6.0A5 paper white 94.2 1.3 93.9 94.6 -0.1 -0.2 0.6 1.7B5 skin highlight L*=89 77.9 5.0 86.2 88.7 12.0 8.9 12.5 9.6C5 skin highlight L*=75 73.7 8.7 75.1 79.1 19.0 15.5 20.1 13.2D5 skin shadow L*=25 92.0 4.0 24.8 27.9 17.9 20.3 16.8 17.0E5 skin shadow L*=11 -25.7 16.1 16.5 22.6 8.2 20.6 8.0 16.1F5 Max Black 82.6 2.5 5.3 6.6 0.6 2.2 -2.0 -0.5
Summary Results I*Color I*tone ∆E
Average Score for all patches 75.0 87.1 7.8
Average Score for the Worst 10%(3 lowest scoring patches) 8.1 69.1 16.0
Colors after 100 Megalux-hours light exposure”
75.0color /87.1tone

AArdenburg ImAgIng
& ArchIves
A B C D E F
1
2
3
4
5
A B C D E F
1
2
3
4
5
Page 16
Original Print Colors(measured before light exposure)
100color /100tone
Original Print Colors as Measured and at Start of TestL* a* b*
Column/row Color Patch I*Color ∆E Before After Before After Before AfterA1 dark Skin 100 0.0 39.4 12.2 17.3B1 light Skin 100 0.0 66.2 15.7 19.6C1 blue sky 100 0.0 50.7 -7.4 -21.8D1 foliage 100 0.0 44.0 -15.6 24.6E1 blue flower 100 0.0 54.5 6.2 -25.0F1 bluish green 100 0.0 70.4 -33.1 0.1A2 orange 100 0.0 63.2 34.6 59.8B2 purplish blue 100 0.0 40.3 7.7 -45.7C2 moderate red 100 0.0 52.4 46.4 18.8D2 purple 100 0.0 29.6 22.3 -21.0E2 yellow green 100 0.0 71.9 -24.0 57.5F2 orange yellow 100 0.0 71.5 18.1 70.9A3 blue 100 0.0 28.4 13.6 -49.7B3 green 100 0.0 54.4 -39.9 32.3C3 red 100 0.0 42.4 53.7 31.9D3 yellow 100 0.0 81.1 3.8 81.1E3 magenta 100 0.0 53.4 48.2 -14.5F3 cyan 100 0.0 52.0 -24.4 -26.6A4 white 100 0.0 93.7 0.0 1.1B4 neutral 8 100 0.0 80.9 -0.8 -0.7C4 neutral 6.5 100 0.0 67.2 -2.2 -1.4D4 neutral 5 100 0.0 51.4 -2.7 0.7E4 neutral 3.5 100 0.0 36.7 -2.1 0.3F4 black 100 0.0 18.5 3.4 -0.9A5 paper white 100 0.0 93.9 -0.1 0.6B5 skin highlight L*=89 100 0.0 86.2 12.0 12.5C5 skin highlight L*=75 100 0.0 75.1 19.0 20.1D5 skin shadow L*=25 100 0.0 24.8 17.9 16.8E5 skin shadow L*=11 100 0.0 16.5 8.2 8.0F5 Max Black 100 0.0 5.3 0.6 -2.0
Summary Results I*Color I*tone ∆E
Average Score for all patches 100 100 0.0
Average Score for the Worst 10%(3 lowest scoring patches) 100 100 0.0
Epson Stylus Photo R1400, Epson OEM Claria Ink,Epson Ultra Premium Photo Paper Luster
Colors at Zero Megalux-hours of Light Exposure(same as original print colors)”
110 Mlux-hrs Light Exposure (i.e., after) Compared to Original Print Colors (i.e., before)L* a* b*
Column/row Color Patch I*Color ∆E Before After Before After Before AfterA1 dark Skin 47.1 12.4 39.4 43.6 12.2 11.1 17.3 5.7B1 light Skin 67.6 9.7 66.2 70.8 15.7 13.1 19.6 11.4C1 blue sky 91.5 4.7 50.7 54.8 -7.4 -6.9 -21.8 -24.2D1 foliage 74.1 8.8 44.0 47.7 -15.6 -16.4 24.6 16.6E1 blue flower 90.8 6.2 54.5 60.0 6.2 4.1 -25.0 -23.1F1 bluish green 89.5 4.9 70.4 73.2 -33.1 -29.9 0.1 -2.2A2 orange 78.2 16.3 63.2 68.0 34.6 29.1 59.8 45.3B2 purplish blue 96.8 4.6 40.3 44.5 7.7 5.9 -45.7 -44.9C2 moderate red 76.7 12.9 52.4 56.7 46.4 44.1 18.8 6.8D2 purple 70.7 10.2 29.6 33.5 22.3 24.7 -21.0 -30.1E2 yellow green 82.1 12.4 71.9 76.3 -24.0 -23.9 57.5 45.8F2 orange yellow 77.6 17.7 71.5 76.7 18.1 11.9 70.9 55.2A3 blue 96.5 4.1 28.4 31.8 13.6 13.5 -49.7 -51.9B3 green 85.5 8.6 54.4 57.7 -39.9 -38.7 32.3 24.4C3 red 75.3 16.2 42.4 45.5 53.7 53.1 31.9 16.0D3 yellow 80.7 16.7 81.1 85.1 3.8 -0.9 81.1 65.7E3 magenta 92.6 6.4 53.4 58.2 48.2 44.5 -14.5 -16.5F3 cyan 95.0 4.1 52.0 55.4 -24.4 -22.9 -26.6 -28.4A4 white 91.3 1.6 93.7 94.6 0.0 -0.2 1.1 2.4B4 neutral 8 97.8 3.3 80.9 84.1 -0.8 -1.0 -0.7 -1.3C4 neutral 6.5 75.2 5.0 67.2 71.3 -2.2 -2.5 -1.4 -4.2D4 neutral 5 37.9 7.8 51.4 55.8 -2.7 -2.5 0.7 -5.7E4 neutral 3.5 -1.2 10.9 36.7 40.8 -2.1 -1.0 0.3 -9.8F4 black 40.0 6.6 18.5 20.8 3.4 5.1 -0.9 -6.9A5 paper white 91.4 1.5 93.9 94.7 -0.1 -0.3 0.6 2.0B5 skin highlight L*=89 76.6 5.3 86.2 88.9 12.0 8.6 12.5 9.5C5 skin highlight L*=75 72.4 9.2 75.1 79.5 19.0 15.2 20.1 12.9D5 skin shadow L*=25 94.5 3.6 24.8 27.9 17.9 19.6 16.8 16.2E5 skin shadow L*=11 -23.2 15.8 16.5 22.7 8.2 20.4 8.0 15.9F5 Max Black 82.3 2.6 5.3 6.7 0.6 2.2 -2.0 -0.6
Summary Results I*Color I*tone ∆E
Average Score for all patches 73.4 86.2 8.3
Average Score for the Worst 10%(3 lowest scoring patches) 4.5 68.5 16.9
Colors after 110 Megalux-hours light exposure”
73.4color /86.2tone

AArdenburg ImAgIng
& ArchIves
A B C D E F
1
2
3
4
5
A B C D E F
1
2
3
4
5
Page 17
Original Print Colors(measured before light exposure)
100color /100tone
Original Print Colors as Measured and at Start of TestL* a* b*
Column/row Color Patch I*Color ∆E Before After Before After Before AfterA1 dark Skin 100 0.0 39.4 12.2 17.3B1 light Skin 100 0.0 66.2 15.7 19.6C1 blue sky 100 0.0 50.7 -7.4 -21.8D1 foliage 100 0.0 44.0 -15.6 24.6E1 blue flower 100 0.0 54.5 6.2 -25.0F1 bluish green 100 0.0 70.4 -33.1 0.1A2 orange 100 0.0 63.2 34.6 59.8B2 purplish blue 100 0.0 40.3 7.7 -45.7C2 moderate red 100 0.0 52.4 46.4 18.8D2 purple 100 0.0 29.6 22.3 -21.0E2 yellow green 100 0.0 71.9 -24.0 57.5F2 orange yellow 100 0.0 71.5 18.1 70.9A3 blue 100 0.0 28.4 13.6 -49.7B3 green 100 0.0 54.4 -39.9 32.3C3 red 100 0.0 42.4 53.7 31.9D3 yellow 100 0.0 81.1 3.8 81.1E3 magenta 100 0.0 53.4 48.2 -14.5F3 cyan 100 0.0 52.0 -24.4 -26.6A4 white 100 0.0 93.7 0.0 1.1B4 neutral 8 100 0.0 80.9 -0.8 -0.7C4 neutral 6.5 100 0.0 67.2 -2.2 -1.4D4 neutral 5 100 0.0 51.4 -2.7 0.7E4 neutral 3.5 100 0.0 36.7 -2.1 0.3F4 black 100 0.0 18.5 3.4 -0.9A5 paper white 100 0.0 93.9 -0.1 0.6B5 skin highlight L*=89 100 0.0 86.2 12.0 12.5C5 skin highlight L*=75 100 0.0 75.1 19.0 20.1D5 skin shadow L*=25 100 0.0 24.8 17.9 16.8E5 skin shadow L*=11 100 0.0 16.5 8.2 8.0F5 Max Black 100 0.0 5.3 0.6 -2.0
Summary Results I*Color I*tone ∆E
Average Score for all patches 100 100 0.0
Average Score for the Worst 10%(3 lowest scoring patches) 100 100 0.0
Epson Stylus Photo R1400, Epson OEM Claria Ink,Epson Ultra Premium Photo Paper Luster
Colors at Zero Megalux-hours of Light Exposure(same as original print colors)”
120 Mlux-hrs Light Exposure (i.e., after) Compared to Original Print Colors (i.e., before)L* a* b*
Column/row Color Patch I*Color ∆E Before After Before After Before AfterA1 dark Skin 42.0 13.6 39.4 43.9 12.2 11.0 17.3 4.6B1 light Skin 65.0 10.5 66.2 71.0 15.7 13.0 19.6 10.8C1 blue sky 90.7 5.2 50.7 55.2 -7.4 -7.0 -21.8 -24.4D1 foliage 71.9 9.5 44.0 47.9 -15.6 -16.5 24.6 16.0E1 blue flower 90.3 6.6 54.5 60.4 6.2 4.0 -25.0 -23.0F1 bluish green 88.6 5.3 70.4 73.5 -33.1 -29.6 0.1 -2.3A2 orange 76.5 17.5 63.2 68.3 34.6 28.8 59.8 44.2B2 purplish blue 96.1 5.1 40.3 44.9 7.7 5.5 -45.7 -44.9C2 moderate red 74.6 14.0 52.4 57.0 46.4 43.9 18.8 5.8D2 purple 68.1 11.1 29.6 33.8 22.3 24.9 -21.0 -30.9E2 yellow green 81.2 13.1 71.9 76.5 -24.0 -23.8 57.5 45.3F2 orange yellow 76.3 18.7 71.5 77.1 18.1 11.5 70.9 54.3A3 blue 96.2 4.4 28.4 32.1 13.6 13.3 -49.7 -52.1B3 green 84.7 9.0 54.4 57.9 -39.9 -38.7 32.3 24.0C3 red 73.2 17.6 42.4 45.8 53.7 53.1 31.9 14.7D3 yellow 79.7 17.5 81.1 85.3 3.8 -1.1 81.1 64.9E3 magenta 91.6 7.0 53.4 58.6 48.2 44.1 -14.5 -16.9F3 cyan 95.0 4.3 52.0 55.7 -24.4 -22.9 -26.6 -28.4A4 white 91.5 1.6 93.7 94.6 0.0 -0.1 1.1 2.4B4 neutral 8 97.9 3.6 80.9 84.4 -0.8 -1.0 -0.7 -1.3C4 neutral 6.5 73.5 5.4 67.2 71.7 -2.2 -2.5 -1.4 -4.4D4 neutral 5 33.4 8.3 51.4 56.2 -2.7 -2.6 0.7 -6.1E4 neutral 3.5 -9.1 11.8 36.7 41.2 -2.1 -1.0 0.3 -10.5F4 black 34.1 7.2 18.5 20.9 3.4 5.4 -0.9 -7.4A5 paper white 91.1 1.5 93.9 94.7 -0.1 -0.3 0.6 2.0B5 skin highlight L*=89 74.8 5.7 86.2 89.1 12.0 8.4 12.5 9.3C5 skin highlight L*=75 70.3 9.8 75.1 79.7 19.0 15.0 20.1 12.4D5 skin shadow L*=25 93.2 4.1 24.8 28.3 17.9 19.9 16.8 16.1E5 skin shadow L*=11 -26.2 16.3 16.5 22.9 8.2 20.8 8.0 16.0F5 Max Black 80.8 2.7 5.3 6.7 0.6 2.4 -2.0 -0.5
Summary Results I*Color I*tone ∆E
Average Score for all patches 71.6 85.6 8.9
Average Score for the Worst 10%(3 lowest scoring patches) -0.7 67.4 17.9
Colors after 120 Megalux-hours light exposure”
71.6color /85.6tone

AArdenburg ImAgIng
& ArchIves
A B C D E F
1
2
3
4
5
A B C D E F
1
2
3
4
5
Page 18
Original Print Colors(measured before light exposure)
100color /100tone
Original Print Colors as Measured and at Start of TestL* a* b*
Column/row Color Patch I*Color ∆E Before After Before After Before AfterA1 dark Skin 100 0.0 39.4 12.2 17.3B1 light Skin 100 0.0 66.2 15.7 19.6C1 blue sky 100 0.0 50.7 -7.4 -21.8D1 foliage 100 0.0 44.0 -15.6 24.6E1 blue flower 100 0.0 54.5 6.2 -25.0F1 bluish green 100 0.0 70.4 -33.1 0.1A2 orange 100 0.0 63.2 34.6 59.8B2 purplish blue 100 0.0 40.3 7.7 -45.7C2 moderate red 100 0.0 52.4 46.4 18.8D2 purple 100 0.0 29.6 22.3 -21.0E2 yellow green 100 0.0 71.9 -24.0 57.5F2 orange yellow 100 0.0 71.5 18.1 70.9A3 blue 100 0.0 28.4 13.6 -49.7B3 green 100 0.0 54.4 -39.9 32.3C3 red 100 0.0 42.4 53.7 31.9D3 yellow 100 0.0 81.1 3.8 81.1E3 magenta 100 0.0 53.4 48.2 -14.5F3 cyan 100 0.0 52.0 -24.4 -26.6A4 white 100 0.0 93.7 0.0 1.1B4 neutral 8 100 0.0 80.9 -0.8 -0.7C4 neutral 6.5 100 0.0 67.2 -2.2 -1.4D4 neutral 5 100 0.0 51.4 -2.7 0.7E4 neutral 3.5 100 0.0 36.7 -2.1 0.3F4 black 100 0.0 18.5 3.4 -0.9A5 paper white 100 0.0 93.9 -0.1 0.6B5 skin highlight L*=89 100 0.0 86.2 12.0 12.5C5 skin highlight L*=75 100 0.0 75.1 19.0 20.1D5 skin shadow L*=25 100 0.0 24.8 17.9 16.8E5 skin shadow L*=11 100 0.0 16.5 8.2 8.0F5 Max Black 100 0.0 5.3 0.6 -2.0
Summary Results I*Color I*tone ∆E
Average Score for all patches 100 100 0.0
Average Score for the Worst 10%(3 lowest scoring patches) 100 100 0.0
Epson Stylus Photo R1400, Epson OEM Claria Ink,Epson Ultra Premium Photo Paper Luster
Colors at Zero Megalux-hours of Light Exposure(same as original print colors)”
140 Mlux-hrs Light Exposure (i.e., after) Compared to Original Print Colors (i.e., before)L* a* b*
Column/row Color Patch I*Color ∆E Before After Before After Before AfterA1 dark Skin 38.2 14.6 39.4 44.8 12.2 11.0 17.3 3.8B1 light Skin 63.6 11.1 66.2 71.8 15.7 12.7 19.6 10.5C1 blue sky 93.8 5.6 50.7 56.0 -7.4 -7.0 -21.8 -23.7D1 foliage 70.0 10.3 44.0 48.6 -15.6 -15.9 24.6 15.4E1 blue flower 85.3 8.1 54.5 61.4 6.2 3.6 -25.0 -21.6F1 bluish green 86.8 6.1 70.4 74.0 -33.1 -28.6 0.1 -1.9A2 orange 74.4 19.1 63.2 68.9 34.6 28.1 59.8 42.9B2 purplish blue 93.2 6.5 40.3 45.7 7.7 4.7 -45.7 -43.5C2 moderate red 73.3 14.9 52.4 57.9 46.4 43.2 18.8 5.3D2 purple 69.5 11.1 29.6 34.8 22.3 24.7 -21.0 -30.5E2 yellow green 79.6 14.1 71.9 76.9 -24.0 -23.1 57.5 44.3F2 orange yellow 74.0 20.5 71.5 77.7 18.1 11.1 70.9 52.6A3 blue 97.9 4.7 28.4 32.9 13.6 12.4 -49.7 -50.8B3 green 83.1 10.0 54.4 58.4 -39.9 -37.7 32.3 23.3C3 red 71.7 18.7 42.4 46.5 53.7 52.8 31.9 13.7D3 yellow 77.9 19.0 81.1 85.7 3.8 -1.1 81.1 63.4E3 magenta 90.2 8.2 53.4 59.5 48.2 43.0 -14.5 -16.2F3 cyan 96.1 4.8 52.0 56.3 -24.4 -22.8 -26.6 -27.7A4 white 86.0 2.1 93.7 94.7 0.0 -0.2 1.1 2.9B4 neutral 8 100.0 4.0 80.9 84.8 -0.8 -0.9 -0.7 -0.8C4 neutral 6.5 76.4 5.9 67.2 72.4 -2.2 -2.5 -1.4 -4.1D4 neutral 5 31.8 8.9 51.4 57.0 -2.7 -2.6 0.7 -6.3E4 neutral 3.5 -16.1 12.7 36.7 42.0 -2.1 -0.7 0.3 -11.1F4 black 28.5 7.9 18.5 21.6 3.4 6.0 -0.9 -7.7A5 paper white 85.9 2.0 93.9 94.7 -0.1 -0.3 0.6 2.5B5 skin highlight L*=89 72.8 6.1 86.2 89.4 12.0 7.9 12.5 9.4C5 skin highlight L*=75 68.1 10.6 75.1 80.3 19.0 14.5 20.1 11.9D5 skin shadow L*=25 92.4 5.1 24.8 29.3 17.9 20.1 16.8 16.1E5 skin shadow L*=11 -38.6 18.0 16.5 24.1 8.2 21.8 8.0 17.1F5 Max Black 77.3 3.2 5.3 7.1 0.6 2.6 -2.0 -0.3
Summary Results I*Color I*tone ∆E
Average Score for all patches 69.4 83.7 9.8
Average Score for the Worst 10%(3 lowest scoring patches) -8.7 63.9 19.5
Colors after 140 Megalux-hours light exposure”
69.4color /83.7tone

AArdenburg ImAgIng
& ArchIves
A B C D E F
1
2
3
4
5
A B C D E F
1
2
3
4
5
Page 19
Original Print Colors(measured before light exposure)
100color /100tone
Original Print Colors as Measured and at Start of TestL* a* b*
Column/row Color Patch I*Color ∆E Before After Before After Before AfterA1 dark Skin 100 0.0 39.4 12.2 17.3B1 light Skin 100 0.0 66.2 15.7 19.6C1 blue sky 100 0.0 50.7 -7.4 -21.8D1 foliage 100 0.0 44.0 -15.6 24.6E1 blue flower 100 0.0 54.5 6.2 -25.0F1 bluish green 100 0.0 70.4 -33.1 0.1A2 orange 100 0.0 63.2 34.6 59.8B2 purplish blue 100 0.0 40.3 7.7 -45.7C2 moderate red 100 0.0 52.4 46.4 18.8D2 purple 100 0.0 29.6 22.3 -21.0E2 yellow green 100 0.0 71.9 -24.0 57.5F2 orange yellow 100 0.0 71.5 18.1 70.9A3 blue 100 0.0 28.4 13.6 -49.7B3 green 100 0.0 54.4 -39.9 32.3C3 red 100 0.0 42.4 53.7 31.9D3 yellow 100 0.0 81.1 3.8 81.1E3 magenta 100 0.0 53.4 48.2 -14.5F3 cyan 100 0.0 52.0 -24.4 -26.6A4 white 100 0.0 93.7 0.0 1.1B4 neutral 8 100 0.0 80.9 -0.8 -0.7C4 neutral 6.5 100 0.0 67.2 -2.2 -1.4D4 neutral 5 100 0.0 51.4 -2.7 0.7E4 neutral 3.5 100 0.0 36.7 -2.1 0.3F4 black 100 0.0 18.5 3.4 -0.9A5 paper white 100 0.0 93.9 -0.1 0.6B5 skin highlight L*=89 100 0.0 86.2 12.0 12.5C5 skin highlight L*=75 100 0.0 75.1 19.0 20.1D5 skin shadow L*=25 100 0.0 24.8 17.9 16.8E5 skin shadow L*=11 100 0.0 16.5 8.2 8.0F5 Max Black 100 0.0 5.3 0.6 -2.0
Summary Results I*Color I*tone ∆E
Average Score for all patches 100 100 0.0
Average Score for the Worst 10%(3 lowest scoring patches) 100 100 0.0
Epson Stylus Photo R1400, Epson OEM Claria Ink,Epson Ultra Premium Photo Paper Luster
Colors at Zero Megalux-hours of Light Exposure(same as original print colors)”
160 Mlux-hrs Light Exposure (i.e., after) Compared to Original Print Colors (i.e., before)L* a* b*
Column/row Color Patch I*Color ∆E Before After Before After Before AfterA1 dark Skin 26.9 17.2 39.4 45.6 12.2 10.4 17.3 1.5B1 light Skin 62.0 11.8 66.2 72.5 15.7 12.0 19.6 10.3C1 blue sky 96.6 6.1 50.7 56.8 -7.4 -7.7 -21.8 -23.1D1 foliage 64.5 12.1 44.0 49.3 -15.6 -16.6 24.6 13.8E1 blue flower 75.7 10.3 54.5 62.3 6.2 2.2 -25.0 -19.5F1 bluish green 86.5 6.3 70.4 74.4 -33.1 -28.2 0.1 -0.9A2 orange 71.7 21.1 63.2 69.6 34.6 27.2 59.8 41.2B2 purplish blue 89.5 8.1 40.3 46.4 7.7 3.4 -45.7 -42.4C2 moderate red 70.5 16.5 52.4 58.6 46.4 42.5 18.8 4.0D2 purple 65.1 12.5 29.6 35.3 22.3 24.5 -21.0 -31.9E2 yellow green 78.2 15.1 71.9 77.4 -24.0 -22.9 57.5 43.4F2 orange yellow 71.7 22.3 71.5 78.3 18.1 10.2 70.9 51.2A3 blue 96.4 5.4 28.4 33.3 13.6 11.5 -49.7 -50.8B3 green 81.2 11.1 54.4 58.9 -39.9 -38.0 32.3 22.3C3 red 67.2 21.5 42.4 46.9 53.7 52.7 31.9 10.9D3 yellow 76.4 20.3 81.1 86.1 3.8 -1.6 81.1 62.2E3 magenta 88.4 9.4 53.4 60.3 48.2 41.9 -14.5 -15.4F3 cyan 98.6 5.0 52.0 56.9 -24.4 -23.4 -26.6 -26.7A4 white 56.0 4.7 93.7 94.4 0.0 -0.5 1.1 5.7B4 neutral 8 83.9 4.8 80.9 85.2 -0.8 -1.1 -0.7 1.4C4 neutral 6.5 88.1 6.1 67.2 73.1 -2.2 -2.8 -1.4 -2.9D4 neutral 5 29.8 9.6 51.4 57.8 -2.7 -3.0 0.7 -6.4E4 neutral 3.5 -31.2 14.3 36.7 42.7 -2.1 -1.1 0.3 -12.6F4 black 11.1 9.5 18.5 21.7 3.4 5.9 -0.9 -9.5A5 paper white 56.2 4.7 93.9 94.5 -0.1 -0.6 0.6 5.3B5 skin highlight L*=89 73.7 6.1 86.2 89.6 12.0 7.1 12.5 11.3C5 skin highlight L*=75 69.0 10.7 75.1 80.9 19.0 13.7 20.1 12.7D5 skin shadow L*=25 90.1 5.6 24.8 29.5 17.9 19.3 16.8 14.3E5 skin shadow L*=11 -35.2 17.7 16.5 24.1 8.2 21.8 8.0 16.3F5 Max Black 76.8 3.3 5.3 7.2 0.6 2.7 -2.0 -0.3
Summary Results I*Color I*tone ∆E
Average Score for all patches 64.5 81.9 11.0
Average Score for the Worst 10%(3 lowest scoring patches) -18.4 62.5 21.6
Colors after 160 Megalux-hours light exposure”
64.5color /81.9tone

AArdenburg ImAgIng
& ArchIves
A B C D E F
1
2
3
4
5
A B C D E F
1
2
3
4
5
Page 20
Original Print Colors(measured before light exposure)
100color /100tone
Original Print Colors as Measured and at Start of TestL* a* b*
Column/row Color Patch I*Color ∆E Before After Before After Before AfterA1 dark Skin 100 0.0 39.4 12.2 17.3B1 light Skin 100 0.0 66.2 15.7 19.6C1 blue sky 100 0.0 50.7 -7.4 -21.8D1 foliage 100 0.0 44.0 -15.6 24.6E1 blue flower 100 0.0 54.5 6.2 -25.0F1 bluish green 100 0.0 70.4 -33.1 0.1A2 orange 100 0.0 63.2 34.6 59.8B2 purplish blue 100 0.0 40.3 7.7 -45.7C2 moderate red 100 0.0 52.4 46.4 18.8D2 purple 100 0.0 29.6 22.3 -21.0E2 yellow green 100 0.0 71.9 -24.0 57.5F2 orange yellow 100 0.0 71.5 18.1 70.9A3 blue 100 0.0 28.4 13.6 -49.7B3 green 100 0.0 54.4 -39.9 32.3C3 red 100 0.0 42.4 53.7 31.9D3 yellow 100 0.0 81.1 3.8 81.1E3 magenta 100 0.0 53.4 48.2 -14.5F3 cyan 100 0.0 52.0 -24.4 -26.6A4 white 100 0.0 93.7 0.0 1.1B4 neutral 8 100 0.0 80.9 -0.8 -0.7C4 neutral 6.5 100 0.0 67.2 -2.2 -1.4D4 neutral 5 100 0.0 51.4 -2.7 0.7E4 neutral 3.5 100 0.0 36.7 -2.1 0.3F4 black 100 0.0 18.5 3.4 -0.9A5 paper white 100 0.0 93.9 -0.1 0.6B5 skin highlight L*=89 100 0.0 86.2 12.0 12.5C5 skin highlight L*=75 100 0.0 75.1 19.0 20.1D5 skin shadow L*=25 100 0.0 24.8 17.9 16.8E5 skin shadow L*=11 100 0.0 16.5 8.2 8.0F5 Max Black 100 0.0 5.3 0.6 -2.0
Summary Results I*Color I*tone ∆E
Average Score for all patches 100 100 0.0
Average Score for the Worst 10%(3 lowest scoring patches) 100 100 0.0
Epson Stylus Photo R1400, Epson OEM Claria Ink,Epson Ultra Premium Photo Paper Luster
Colors at Zero Megalux-hours of Light Exposure(same as original print colors)”
180 Mlux-hrs Light Exposure (i.e., after) Compared to Original Print Colors (i.e., before)L* a* b*
Column/row Color Patch I*Color ∆E Before After Before After Before AfterA1 dark Skin 19.2 19.0 39.4 46.6 12.2 10.1 17.3 -0.2B1 light Skin 55.3 13.7 66.2 73.3 15.7 11.6 19.6 8.6C1 blue sky 93.5 7.2 50.7 57.7 -7.4 -7.6 -21.8 -23.8D1 foliage 60.4 13.5 44.0 50.1 -15.6 -16.8 24.6 12.6E1 blue flower 79.6 10.4 54.5 63.2 6.2 2.5 -25.0 -20.6F1 bluish green 83.5 7.6 70.4 75.1 -33.1 -27.5 0.1 -1.9A2 orange 68.2 23.5 63.2 70.3 34.6 26.2 59.8 39.0B2 purplish blue 89.0 8.9 40.3 47.3 7.7 3.0 -45.7 -42.6C2 moderate red 66.8 18.5 52.4 59.4 46.4 41.7 18.8 2.3D2 purple 62.4 13.6 29.6 36.1 22.3 24.4 -21.0 -32.8E2 yellow green 75.5 16.9 71.9 77.9 -24.0 -22.8 57.5 41.7F2 orange yellow 68.4 24.8 71.5 78.9 18.1 9.5 70.9 48.9A3 blue 95.6 6.2 28.4 34.0 13.6 11.1 -49.7 -51.0B3 green 78.8 12.5 54.4 59.6 -39.9 -37.7 32.3 21.1C3 red 64.1 23.5 42.4 47.5 53.7 52.3 31.9 9.0D3 yellow 73.8 22.5 81.1 86.5 3.8 -2.0 81.1 60.1E3 magenta 86.5 10.7 53.4 61.2 48.2 41.2 -14.5 -16.4F3 cyan 96.8 5.9 52.0 57.6 -24.4 -23.0 -26.6 -27.5A4 white 81.6 2.5 93.7 94.7 0.0 -0.3 1.1 3.3B4 neutral 8 100.0 4.9 80.9 85.8 -0.8 -0.9 -0.7 -0.5C4 neutral 6.5 72.9 7.3 67.2 73.8 -2.2 -2.7 -1.4 -4.4D4 neutral 5 15.8 11.2 51.4 58.7 -2.7 -3.1 0.7 -7.8E4 neutral 3.5 -45.5 15.9 36.7 43.6 -2.1 -1.1 0.3 -14.0F4 black 2.7 10.4 18.5 22.3 3.4 6.0 -0.9 -10.3A5 paper white 81.6 2.4 93.9 94.7 -0.1 -0.4 0.6 2.9B5 skin highlight L*=89 66.9 7.4 86.2 90.0 12.0 6.8 12.5 9.1C5 skin highlight L*=75 62.0 12.7 75.1 81.5 19.0 13.3 20.1 10.7D5 skin shadow L*=25 90.2 6.0 24.8 30.0 17.9 19.2 16.8 14.3E5 skin shadow L*=11 -38.8 18.4 16.5 24.9 8.2 22.1 8.0 16.6F5 Max Black 74.7 3.8 5.3 7.8 0.6 2.9 -2.0 -0.3
Summary Results I*Color I*tone ∆E
Average Score for all patches 62.7 80.3 12.1
Average Score for the Worst 10%(3 lowest scoring patches) -27.2 60.1 23.9
Colors after 180 Megalux-hours light exposure”
62.7color /80.3tone

AArdenburg ImAgIng
& ArchIves
A B C D E F
1
2
3
4
5
A B C D E F
1
2
3
4
5
Page 21
Original Print Colors(measured before light exposure)
100color /100tone
Original Print Colors as Measured and at Start of TestL* a* b*
Column/row Color Patch I*Color ∆E Before After Before After Before AfterA1 dark Skin 100 0.0 39.4 12.2 17.3B1 light Skin 100 0.0 66.2 15.7 19.6C1 blue sky 100 0.0 50.7 -7.4 -21.8D1 foliage 100 0.0 44.0 -15.6 24.6E1 blue flower 100 0.0 54.5 6.2 -25.0F1 bluish green 100 0.0 70.4 -33.1 0.1A2 orange 100 0.0 63.2 34.6 59.8B2 purplish blue 100 0.0 40.3 7.7 -45.7C2 moderate red 100 0.0 52.4 46.4 18.8D2 purple 100 0.0 29.6 22.3 -21.0E2 yellow green 100 0.0 71.9 -24.0 57.5F2 orange yellow 100 0.0 71.5 18.1 70.9A3 blue 100 0.0 28.4 13.6 -49.7B3 green 100 0.0 54.4 -39.9 32.3C3 red 100 0.0 42.4 53.7 31.9D3 yellow 100 0.0 81.1 3.8 81.1E3 magenta 100 0.0 53.4 48.2 -14.5F3 cyan 100 0.0 52.0 -24.4 -26.6A4 white 100 0.0 93.7 0.0 1.1B4 neutral 8 100 0.0 80.9 -0.8 -0.7C4 neutral 6.5 100 0.0 67.2 -2.2 -1.4D4 neutral 5 100 0.0 51.4 -2.7 0.7E4 neutral 3.5 100 0.0 36.7 -2.1 0.3F4 black 100 0.0 18.5 3.4 -0.9A5 paper white 100 0.0 93.9 -0.1 0.6B5 skin highlight L*=89 100 0.0 86.2 12.0 12.5C5 skin highlight L*=75 100 0.0 75.1 19.0 20.1D5 skin shadow L*=25 100 0.0 24.8 17.9 16.8E5 skin shadow L*=11 100 0.0 16.5 8.2 8.0F5 Max Black 100 0.0 5.3 0.6 -2.0
Summary Results I*Color I*tone ∆E
Average Score for all patches 100 100 0.0
Average Score for the Worst 10%(3 lowest scoring patches) 100 100 0.0
Epson Stylus Photo R1400, Epson OEM Claria Ink,Epson Ultra Premium Photo Paper Luster
Colors at Zero Megalux-hours of Light Exposure(same as original print colors)”
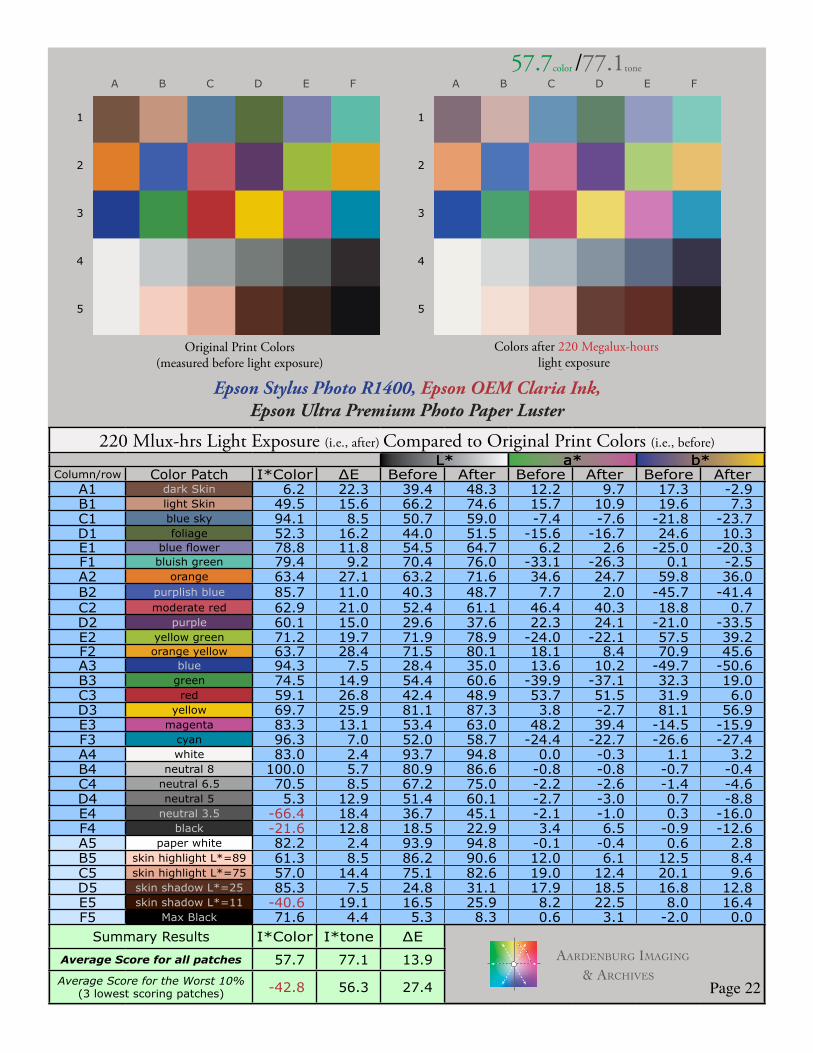
200 Mlux-hrs Light Exposure (i.e., after) Compared to Original Print Colors (i.e., before)L* a* b*
Column/row Color Patch I*Color ∆E Before After Before After Before AfterA1 dark Skin 15.0 20.3 39.4 47.6 12.2 9.9 17.3 -1.0B1 light Skin 53.1 14.6 66.2 74.0 15.7 11.3 19.6 8.2C1 blue sky 95.2 7.9 50.7 58.5 -7.4 -7.5 -21.8 -23.4D1 foliage 57.6 14.6 44.0 50.9 -15.6 -16.4 24.6 11.8E1 blue flower 80.8 10.9 54.5 64.0 6.2 2.9 -25.0 -20.6F1 bluish green 81.1 8.5 70.4 75.6 -33.1 -26.7 0.1 -2.1A2 orange 66.0 25.2 63.2 71.0 34.6 25.5 59.8 37.6B2 purplish blue 86.9 10.2 40.3 48.1 7.7 2.5 -45.7 -41.6C2 moderate red 65.3 19.6 52.4 60.4 46.4 41.0 18.8 1.8D2 purple 63.3 13.9 29.6 37.0 22.3 24.2 -21.0 -32.5E2 yellow green 73.4 18.3 71.9 78.4 -24.0 -22.2 57.5 40.5F2 orange yellow 66.1 26.6 71.5 79.5 18.1 9.0 70.9 47.3A3 blue 95.3 6.9 28.4 34.6 13.6 10.7 -49.7 -50.3B3 green 76.9 13.6 54.4 60.1 -39.9 -37.0 32.3 20.2C3 red 62.6 24.6 42.4 48.5 53.7 51.8 31.9 8.1D3 yellow 71.8 24.1 81.1 86.9 3.8 -2.2 81.1 58.5E3 magenta 84.9 12.0 53.4 62.2 48.2 40.2 -14.5 -15.9F3 cyan 96.4 6.5 52.0 58.2 -24.4 -22.7 -26.6 -27.2A4 white 80.5 2.6 93.7 94.7 0.0 -0.3 1.1 3.4B4 neutral 8 100.0 5.3 80.9 86.2 -0.8 -0.9 -0.7 -0.3C4 neutral 6.5 73.5 7.9 67.2 74.5 -2.2 -2.6 -1.4 -4.4D4 neutral 5 12.7 11.9 51.4 59.4 -2.7 -2.9 0.7 -8.1E4 neutral 3.5 -51.1 16.8 36.7 44.4 -2.1 -0.9 0.3 -14.5F4 black -4.7 11.3 18.5 22.8 3.4 6.6 -0.9 -10.8A5 paper white 79.5 2.6 93.9 94.7 -0.1 -0.4 0.6 3.1B5 skin highlight L*=89 64.5 7.8 86.2 90.2 12.0 6.4 12.5 8.9C5 skin highlight L*=75 59.7 13.5 75.1 82.0 19.0 12.8 20.1 10.2D5 skin shadow L*=25 90.0 6.6 24.8 30.7 17.9 19.1 16.8 14.2E5 skin shadow L*=11 -47.1 19.7 16.5 25.9 8.2 22.8 8.0 17.3F5 Max Black 71.2 4.3 5.3 8.1 0.6 3.2 -2.0 -0.1
Summary Results I*Color I*tone ∆E
Average Score for all patches 60.7 78.4 12.9
Average Score for the Worst 10%(3 lowest scoring patches) -34.3 56.5 25.5
Colors after 200 Megalux-hours light exposure”
60.7color /78.4tone
AArdenburg ImAgIng
& ArchIves
A B C D E F
1
2
3
4
5
A B C D E F
1
2
3
4
5
Page 22
Original Print Colors(measured before light exposure)
100color /100tone
Original Print Colors as Measured and at Start of TestL* a* b*
Column/row Color Patch I*Color ∆E Before After Before After Before AfterA1 dark Skin 100 0.0 39.4 12.2 17.3B1 light Skin 100 0.0 66.2 15.7 19.6C1 blue sky 100 0.0 50.7 -7.4 -21.8D1 foliage 100 0.0 44.0 -15.6 24.6E1 blue flower 100 0.0 54.5 6.2 -25.0F1 bluish green 100 0.0 70.4 -33.1 0.1A2 orange 100 0.0 63.2 34.6 59.8B2 purplish blue 100 0.0 40.3 7.7 -45.7C2 moderate red 100 0.0 52.4 46.4 18.8D2 purple 100 0.0 29.6 22.3 -21.0E2 yellow green 100 0.0 71.9 -24.0 57.5F2 orange yellow 100 0.0 71.5 18.1 70.9A3 blue 100 0.0 28.4 13.6 -49.7B3 green 100 0.0 54.4 -39.9 32.3C3 red 100 0.0 42.4 53.7 31.9D3 yellow 100 0.0 81.1 3.8 81.1E3 magenta 100 0.0 53.4 48.2 -14.5F3 cyan 100 0.0 52.0 -24.4 -26.6A4 white 100 0.0 93.7 0.0 1.1B4 neutral 8 100 0.0 80.9 -0.8 -0.7C4 neutral 6.5 100 0.0 67.2 -2.2 -1.4D4 neutral 5 100 0.0 51.4 -2.7 0.7E4 neutral 3.5 100 0.0 36.7 -2.1 0.3F4 black 100 0.0 18.5 3.4 -0.9A5 paper white 100 0.0 93.9 -0.1 0.6B5 skin highlight L*=89 100 0.0 86.2 12.0 12.5C5 skin highlight L*=75 100 0.0 75.1 19.0 20.1D5 skin shadow L*=25 100 0.0 24.8 17.9 16.8E5 skin shadow L*=11 100 0.0 16.5 8.2 8.0F5 Max Black 100 0.0 5.3 0.6 -2.0
Summary Results I*Color I*tone ∆E
Average Score for all patches 100 100 0.0
Average Score for the Worst 10%(3 lowest scoring patches) 100 100 0.0
Epson Stylus Photo R1400, Epson OEM Claria Ink,Epson Ultra Premium Photo Paper Luster
Colors at Zero Megalux-hours of Light Exposure(same as original print colors)”
220 Mlux-hrs Light Exposure (i.e., after) Compared to Original Print Colors (i.e., before)L* a* b*
Column/row Color Patch I*Color ∆E Before After Before After Before AfterA1 dark Skin 6.2 22.3 39.4 48.3 12.2 9.7 17.3 -2.9B1 light Skin 49.5 15.6 66.2 74.6 15.7 10.9 19.6 7.3C1 blue sky 94.1 8.5 50.7 59.0 -7.4 -7.6 -21.8 -23.7D1 foliage 52.3 16.2 44.0 51.5 -15.6 -16.7 24.6 10.3E1 blue flower 78.8 11.8 54.5 64.7 6.2 2.6 -25.0 -20.3F1 bluish green 79.4 9.2 70.4 76.0 -33.1 -26.3 0.1 -2.5A2 orange 63.4 27.1 63.2 71.6 34.6 24.7 59.8 36.0B2 purplish blue 85.7 11.0 40.3 48.7 7.7 2.0 -45.7 -41.4C2 moderate red 62.9 21.0 52.4 61.1 46.4 40.3 18.8 0.7D2 purple 60.1 15.0 29.6 37.6 22.3 24.1 -21.0 -33.5E2 yellow green 71.2 19.7 71.9 78.9 -24.0 -22.1 57.5 39.2F2 orange yellow 63.7 28.4 71.5 80.1 18.1 8.4 70.9 45.6A3 blue 94.3 7.5 28.4 35.0 13.6 10.2 -49.7 -50.6B3 green 74.5 14.9 54.4 60.6 -39.9 -37.1 32.3 19.0C3 red 59.1 26.8 42.4 48.9 53.7 51.5 31.9 6.0D3 yellow 69.7 25.9 81.1 87.3 3.8 -2.7 81.1 56.9E3 magenta 83.3 13.1 53.4 63.0 48.2 39.4 -14.5 -15.9F3 cyan 96.3 7.0 52.0 58.7 -24.4 -22.7 -26.6 -27.4A4 white 83.0 2.4 93.7 94.8 0.0 -0.3 1.1 3.2B4 neutral 8 100.0 5.7 80.9 86.6 -0.8 -0.8 -0.7 -0.4C4 neutral 6.5 70.5 8.5 67.2 75.0 -2.2 -2.6 -1.4 -4.6D4 neutral 5 5.3 12.9 51.4 60.1 -2.7 -3.0 0.7 -8.8E4 neutral 3.5 -66.4 18.4 36.7 45.1 -2.1 -1.0 0.3 -16.0F4 black -21.6 12.8 18.5 22.9 3.4 6.5 -0.9 -12.6A5 paper white 82.2 2.4 93.9 94.8 -0.1 -0.4 0.6 2.8B5 skin highlight L*=89 61.3 8.5 86.2 90.6 12.0 6.1 12.5 8.4C5 skin highlight L*=75 57.0 14.4 75.1 82.6 19.0 12.4 20.1 9.6D5 skin shadow L*=25 85.3 7.5 24.8 31.1 17.9 18.5 16.8 12.8E5 skin shadow L*=11 -40.6 19.1 16.5 25.9 8.2 22.5 8.0 16.4F5 Max Black 71.6 4.4 5.3 8.3 0.6 3.1 -2.0 0.0
Summary Results I*Color I*tone ∆E
Average Score for all patches 57.7 77.1 13.9
Average Score for the Worst 10%(3 lowest scoring patches) -42.8 56.3 27.4
Colors after 220 Megalux-hours light exposure”
57.7color /77.1tone
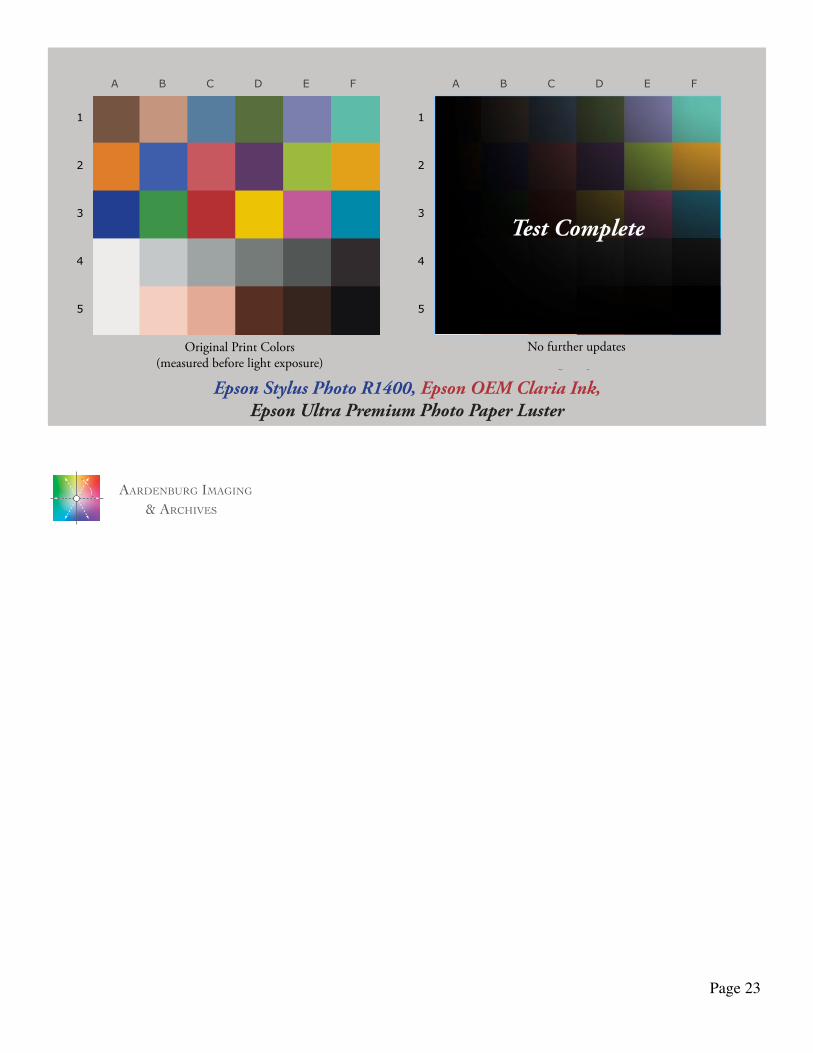
AArdenburg ImAgIng
& ArchIves
A B C D E F
1
2
3
4
5
A B C D E F
1
2
3
4
5
Page 23
Original Print Colors(measured before light exposure)
100color /100tone
Original Print Colors as Measured and at Start of TestL* a* b*
Column/row Color Patch I*Color ∆E Before After Before After Before AfterA1 dark Skin 100 0.0 39.4 12.2 17.3B1 light Skin 100 0.0 66.2 15.7 19.6C1 blue sky 100 0.0 50.7 -7.4 -21.8D1 foliage 100 0.0 44.0 -15.6 24.6E1 blue flower 100 0.0 54.5 6.2 -25.0F1 bluish green 100 0.0 70.4 -33.1 0.1A2 orange 100 0.0 63.2 34.6 59.8B2 purplish blue 100 0.0 40.3 7.7 -45.7C2 moderate red 100 0.0 52.4 46.4 18.8D2 purple 100 0.0 29.6 22.3 -21.0E2 yellow green 100 0.0 71.9 -24.0 57.5F2 orange yellow 100 0.0 71.5 18.1 70.9A3 blue 100 0.0 28.4 13.6 -49.7B3 green 100 0.0 54.4 -39.9 32.3C3 red 100 0.0 42.4 53.7 31.9D3 yellow 100 0.0 81.1 3.8 81.1E3 magenta 100 0.0 53.4 48.2 -14.5F3 cyan 100 0.0 52.0 -24.4 -26.6A4 white 100 0.0 93.7 0.0 1.1B4 neutral 8 100 0.0 80.9 -0.8 -0.7C4 neutral 6.5 100 0.0 67.2 -2.2 -1.4D4 neutral 5 100 0.0 51.4 -2.7 0.7E4 neutral 3.5 100 0.0 36.7 -2.1 0.3F4 black 100 0.0 18.5 3.4 -0.9A5 paper white 100 0.0 93.9 -0.1 0.6B5 skin highlight L*=89 100 0.0 86.2 12.0 12.5C5 skin highlight L*=75 100 0.0 75.1 19.0 20.1D5 skin shadow L*=25 100 0.0 24.8 17.9 16.8E5 skin shadow L*=11 100 0.0 16.5 8.2 8.0F5 Max Black 100 0.0 5.3 0.6 -2.0
Summary Results I*Color I*tone ∆E
Average Score for all patches 100 100 0.0
Average Score for the Worst 10%(3 lowest scoring patches) 100 100 0.0
Epson Stylus Photo R1400, Epson OEM Claria Ink,Epson Ultra Premium Photo Paper Luster
Colors at Zero Megalux-hours of Light Exposure(same as original print colors)”
Test Complete
Page 23
AArdenburg ImAgIng
& ArchIves
No further updates