Acc spritzer
22
TAYLOR’S UNIVERSITY | SABD | FNBE | BASIC ACCOUNTING SCHOOL OF ARCHITECTURE, BUILDING AND DESIGN Foundation in Natural & Built Environment (FNBE) TOPIC: FINANCIAL RATIO ANALYSIS Group Members: 1. Nabila Hanim binti Salleh@Man (0321368) 2. Nadhirah binti Mohd Zain (0321366) 3. Nur Azreen binti Samiu (0321370) Subject :Basic Accounting (FNBE0145) Lecturer : Mr. Chang Jau Ho Submission Date: 4 th June 2015
Transcript of Acc spritzer
TAYLOR’S UNIVERSITY | SABD | FNBE | BASIC ACCOUNTING
SCHOOL OF ARCHITECTURE, BUILDING AND DESIGNFoundation in Natural & Built Environment (FNBE)
TOPIC: FINANCIAL RATIO ANALYSIS
Group Members: 1. Nabila Hanim binti Salleh@Man (0321368)2. Nadhirah binti Mohd Zain (0321366)3. Nur Azreen binti Samiu (0321370)
Subject :Basic Accounting (FNBE0145)
Lecturer : Mr. Chang Jau Ho
Submission Date: 4th June 2015

TAYLOR’S UNIVERSITY | SABD | FNBE | BASIC ACCOUNTING
Table Of Content
Content Page
Company Background 2
Accounting Report Data 3
Ratio Analysis : Calculation 5
Ratio Analysis : Interpretation 9
P/E ratio 11
Investment Recommendation 12
Appendix 13
Reference 21
TAYLOR’S UNIVERSITY | SABD | FNBE | BASIC ACCOUNTING
Company Background
Spritzer is the largest bottled water producer in Malaysia. Spritzer Berhad was founded
by Datuk Lim Kok Boon in 1989. He started to bottle mineral water in a small set-up in Taiping,
Perak. On 26 May 1993, Spritzer was incorporated as a private limited company as Spritzer
Sdn Bhd before the Company was converted into a public limited company on 11 July 1994 as
Spritzer Bhd. Spritzer Bhd was listed on the 2nd Board of the Kuala Lumpur Stock Exchange. It
is also an investment holding company and on 1 September 2000, Spritzer was listed on Bursa
Malaysia.
Spritzer Bhd Group also consists of six wholly-owned subsidiary companies which are
Chuan Sin Sdn Bhd, Golden PET Industries Sdn Bhd, Chuan Sin Cactus Sdn Bhd, PET Master
Sdn Bhd, Angenet Sdn Bhd and Hidro Dinamik Sdn Bhd as at 31 May 2014. The Company
involved in the manufacturing and distribution of natural mineral water, sparkling natural
mineral water, distilled drinking water, carbonated fruit-flavored drinks, non-carbonated
fruit-flavored drinks, functional drinks, toothbrushes, preforms and packaging bottles. On the
other hand, Spritzer Bhd Group also bottled drinking water under the brand name ‘Summer’ as
their defensive business strategy.
The company runs in three sections which is manufacturing. This section involved in the
production of natural mineral water, carbonated flavored water, distilled water, drinking water
and polyethylene terephthalene (PET) bottles. The second section covers trading business
such as sales of bottled water and other consumer products. While the another section covers
investment and properties holding.
The Spritzer Group is a member of Asia Middle East Bottled Water Association (ABWA)
and an international affiliate member of The American Beverages Association. Since its
incorporation in 1993, it has received many awards and certifications. Spritzer was recently
recognized at the World Branding Awards with a Brand of the Year 2015 National Award in the
Water category. Also, one of its subsidiaries company, Chuan Sin Sdn. Bhd., is the first
company in Asia to have held certification by NSF International, recognized by the US FDA,
WHO, FAO and Health Canada.

TAYLOR’S UNIVERSITY | SABD | FNBE | BASIC ACCOUNTING
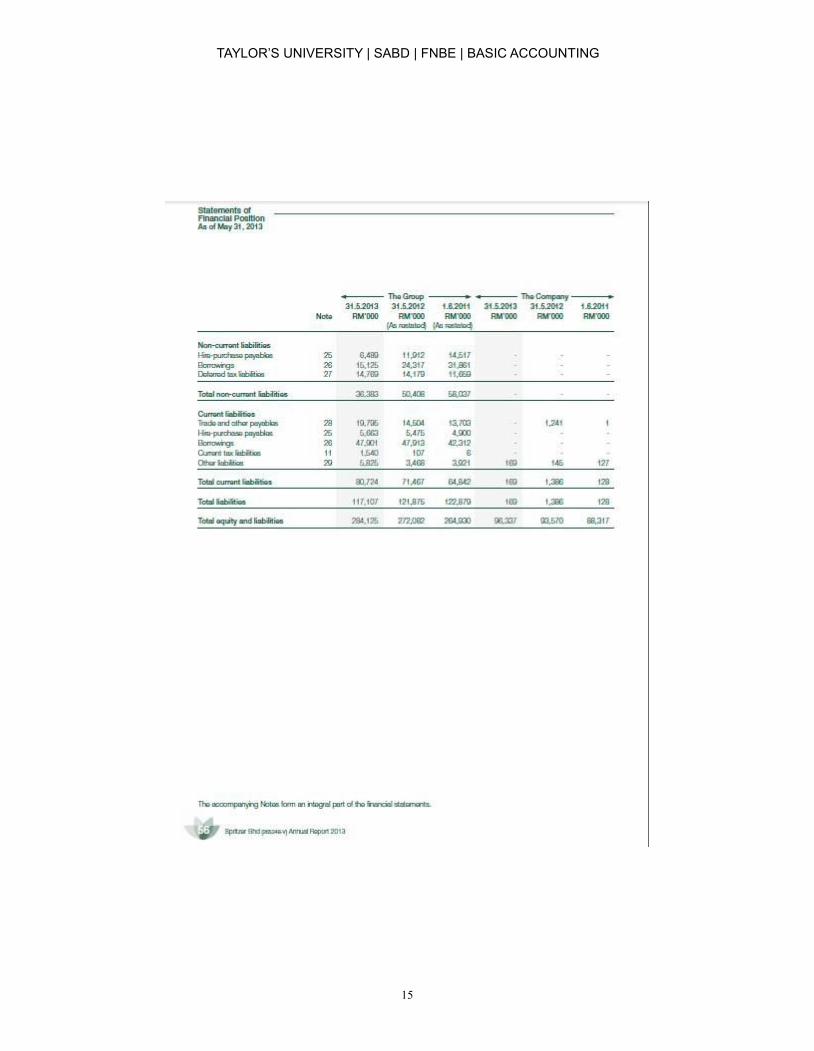
ACCOUNTING REPORT DATA
Balance sheet of Spritzer Berhad for year 2013 and 2014.

TAYLOR’S UNIVERSITY | SABD | FNBE | BASIC ACCOUNTING
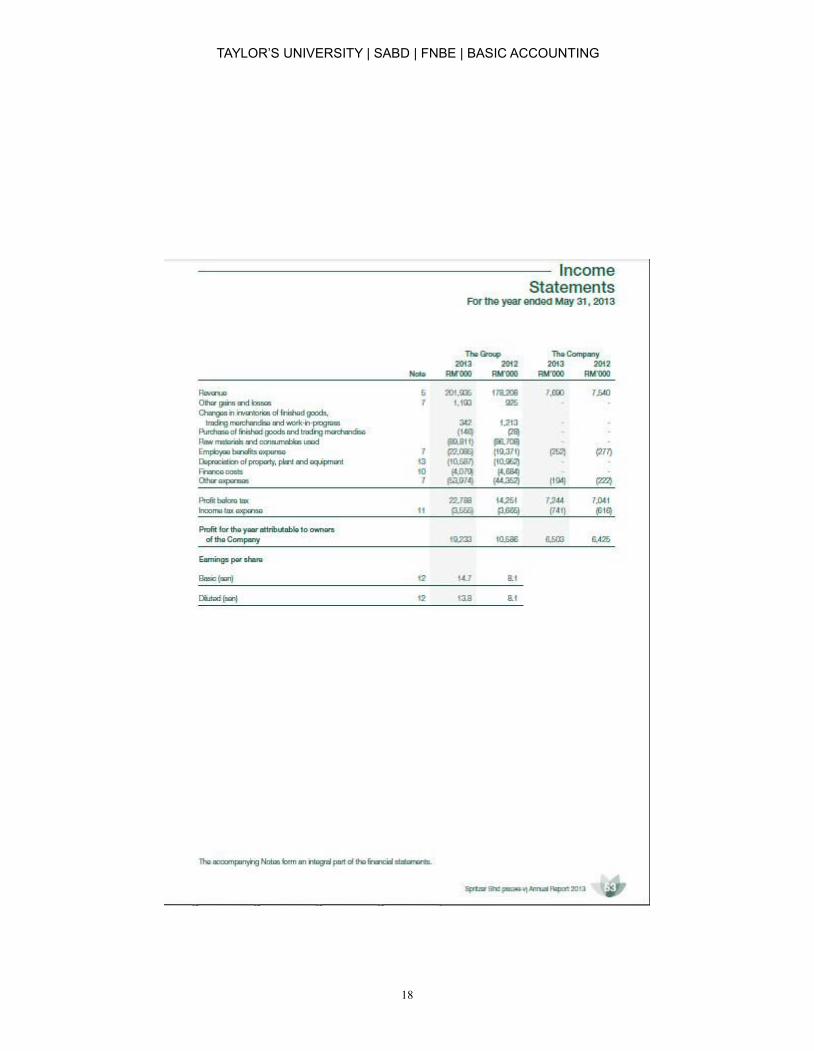
P&L Statement of Spritzer Berhad for year 2013 and 2014
Additional information :
1) Total owner equity for the year 2012 is RM 150,207,000.2) Inventory balance for 2012 is RM 20,980,000; debtors balance for 2012: RM 51,211,000.3) Interest expenses for the years 2013 and 2014 are RM 3, 733,000 and RM 3,135,000

TAYLOR’S UNIVERSITY | SABD | FNBE | BASIC ACCOUNTING
6
ii) 2014
Gross profit
=238,750,000-105,442,000-102,000+368,000
= 133,574,000
GPM = 133,574,000238,750,000
= 55.9 %
ii) 2014
= 21,566,000238,750,000
= 9%
X 100%
X 100%
ii) 2014
= 21,566,000(187,792,000+167,018,000)
2
= 21,566,000177,405,000
= 12.2%
X 100%
X 100%
X 100%X 100%
X 100%X 100%
Ratio Analysis : Calculation
a) Profitability Ratios
1) Return on equity (ROE)
i) 2013
= 19,233,000(167,018,000+150,207,000)
2
= 19,233,000158,612,500
=12.1%
2) Net Profit Margin (NPM)
i) 2013
= 19,233,000201,935,000
= 9.5%
3) Gross Profit Margin (GPM)
i) 2013
Gross profit
= 201,935,000-89,811,000-146,000+342,000
=112,320,000
GPM = 112,320,000201,935,000
= 55.6 %
Formula : (Net profit ÷ Average O/E) x 100%
Formula : (Net profit ÷ Net sales) x 100%
Formula : (Gross profit ÷ Net sales) x 100%

TAYLOR’S UNIVERSITY | SABD | FNBE | BASIC ACCOUNTING
7
ii) 2014
= 28,531,000238,750,000
= 12%
X 100% X 100%
X 100%
201,935,000 X 100%
201,935,000
ii) 2014
= 3,503,000238,750,000
=1.5%
X 100% X 100%
4) Selling expenses ratio (SER)
i) 2013
= 22,085,000201,935,000
= 10.9%
5) General expenses ratio (GER)
i) 2013
= (10,587,000 + 53,974,000)
= 64,561,000
= 32%
6) Financial expenses ratio (FER)
i) 2013
= 4,079,000201,935,000
= 2%
Formula : (Selling Exp ÷ Net sales) x 100%
ii) 2014
=(11,304,000+62,997,000)238,750,000
= 74,301,000238,750,000
= 31.1%
X 100%
X 100%
Formula : (Financial Exp ÷ Net sales) x 100%
Formula : (General Exp ÷ Net sales) x 100%Formula : (General Exp ÷ Net sales) x 100%

TAYLOR’S UNIVERSITY | SABD | FNBE | BASIC ACCOUNTING
8
X 100%
b) Stability Ratios
1) Working capital
i) 2013
= 97,727,00080,724,000
= 1.21 : 1
2) Total debt
i) 2013
= 117,107,000284,125,000
= 41.2%
3) Stock turnover
i) 2013
= 365 Days ÷ (89,811,000+146,000-342,000)[(25,190,000+20,980,000) ÷ 2]
=365 Days ÷ 89,615,00023,085,000
= 94 days.
Formula : Total current assets ÷ Total current liabilities
Formula : 365 Days ÷ (COGS ÷ Average Inventory)
Formula : (Total liabilities ÷ Total assets) x 100%
ii) 2014
= 106,200,00085,917,000
= 1.24 : 1
ii) 2014
= 119,830,000307,622,000
= 39%
X 100%
ii) 2014
=365 days÷ (105,442,000+102,000-368,000)[(27,419,000+25,190,000)÷2]
=365 days÷ 105,176,00026,304,500
=91.3 Days

TAYLOR’S UNIVERSITY | SABD | FNBE | BASIC ACCOUNTING
9
4) Debtor turnover
i) 2013
= 365 days ÷ (½ × 201,935,000)[(60,207,000+51,211,000) ÷2]
= 365 days ÷ 100,967,00055,709,000
= 201.4 Days
5) Interest coverage
i) 2013
= (3,733,000+19,233,000)3,733,000
= 22,966,0003,733,000
= 6.2 times
Formula : (Interest Exp + Net profit) ÷ Interest Exp
ii) 2014
= (3,135,000+21,566,000)3,135,000
= 24,701,0003,135,000
= 7.9 times
Formula : 365 Days ÷ (Credit sales ÷ Average Debtor)
ii) 2014
=365 days ÷ (½ × 238,750,000)[(66,033,000+60,207,000)÷2]
=365 Days ÷ 119,375,00063,120,000
=193 days

TAYLOR’S UNIVERSITY | SABD | FNBE | BASIC ACCOUNTING
10
Ratio Analysis: Interpretation
a) Profitability Ratios
The table below shows the interpretation of the trends from year 2013 to 2014 periods.
ProfitabilityRatios
2013 2014 Interpretation
Return onEquity (ROE)
12.1% 12.2% From year 2013 to 2014, percentage of ROE increased from12.1% to 12.2%. The owner getting more return from hiscapital compare to last year.
Net ProfitMargin (NPM)
9.5% 9% The percentage of NPM during 2013 to 2014 period hasdecreased from 9.5% to 9%. This mean that the business isgetting worse at controlling its overall expenses.
Gross ProfitMargin (GPM)
55.6% 55.9% During the period 2013 to 2014, percentage of GPMincreased from 55.6% to 55.9%. The business ability tocontrol COGS expenses is getting better.
Selling Exp.Ratio (SER)
10.9% 12% From the year 2013 to 2014, the percentage of SER increasedfrom 10.9% to 12%. This mean that the business ability tocontrol it selling expenses is getting worst.
General Exp.Ratio (GER)
32% 31.1% The percentage of GER during 2013 to 2014 period hasdecreased from 32% to 31.1%. This mean that the businessability is getting better at controlling general expenses.
Financial Exp.Ratio (FER)
2% 1.5% During the period 2013 to 2014, percentage of FER decreasedfrom 2% to 1.5%. This mean that the business ability to control itsfinancial expenses is getting better .

TAYLOR’S UNIVERSITY | SABD | FNBE | BASIC ACCOUNTING
11
b) Stability Ratios
The table below shows the interpretation of the trends from 2013-2014 periods.
StabilityRatios
2013 2014 Interpretation
WorkingCapital(WCR)
1.21 : 1 1.24 : 1 During the period 2013 to 2014, the business working capitalhas increased from 1.21:1 to 1.24:1. This mean, the businessability to pay off current liabilities getting better. In addition, itdoes not satisfy the minimum 2:1 ratio.
Total Debt(TDR)
41.2% 39% From the year 2013 to 2014, the business total debt ratiodecreased from 41.2% to 39%. This mean that the businesstotal debt has reduced. Moreover, it does not exceed 50%maximum limit.
StockTurnover(STR)
94days
91.3days
During 2013 to 2014 period, the days of stock turnover hasdecreased from 94 days to 91.3 days. This means thebusiness is selling its products at a faster rate than last year.
DebtorTurnover(DTR)
201.4days
193days
During the period 2013 to 2014, the days of debtor turnoverhas decreased from 201.4 days to 193 days. This mean thatthe business is taking less time to collect its debt compare tolast year.
InterestCoverage(ICR)
6.2times
7.9times
During the period 2013 to 2014, the business interestcoverage has increased from 6.2 times to 7.9 times. Thismeans the business ability to pay the interest is getting better.Furthermore, it satisfy minimum requirement of 5 times.

TAYLOR’S UNIVERSITY | SABD | FNBE | BASIC ACCOUNTING
12
P/E Ratio
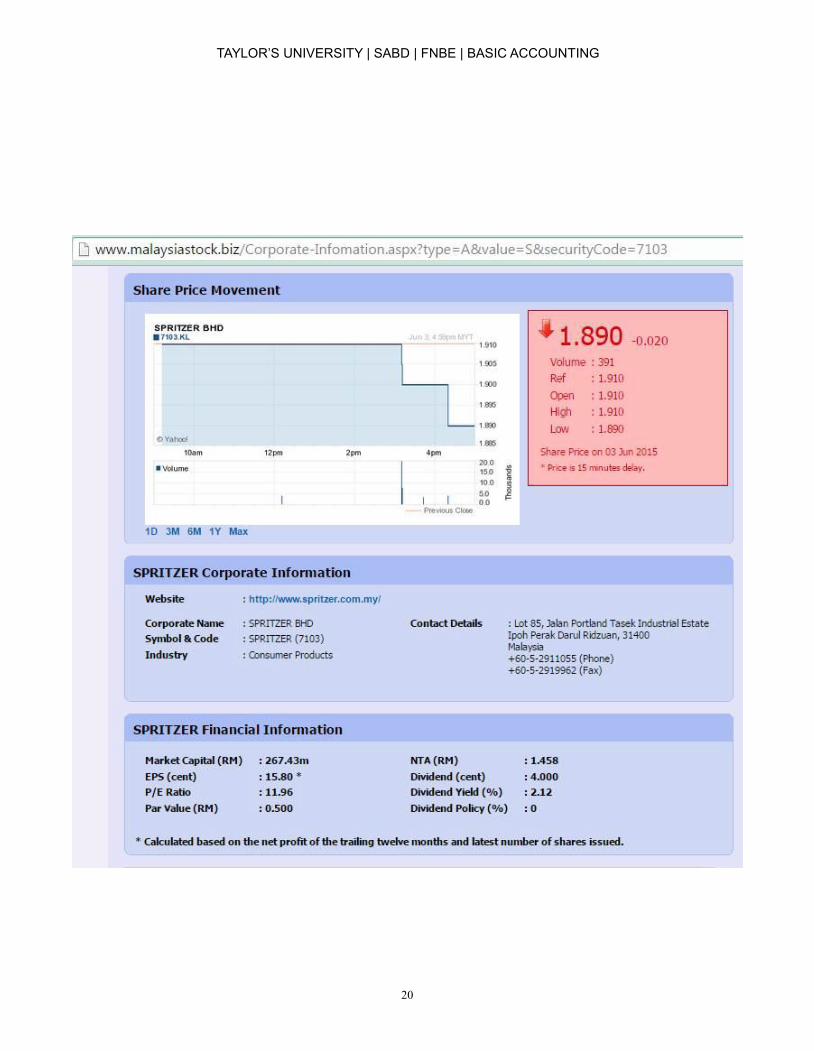
Spritzer Berhad’s current share price is RM1.89 per share and its earnings per share is
RM0.163
P/E ratio = RM1.890RM0.1630
= 11.6
Interpretation: The calculation above shows the P/E ratio for Spritzer Berhad is 11.6. This
means that an investor will need to wait for 11.6 years to claim back his original principal.
Formula : Current share price/Earning per share

TAYLOR’S UNIVERSITY | SABD | FNBE | BASIC ACCOUNTING
13
Investment Recommendation
a) PROFITABILITYAs the gathered data show, the net profit is increasing from 2013 to 2014 and it is more than
12% which is a big grow during a year. Based on the ratios calculated, the Company’s return onequity shows more return in capital and its ability to control its COGS expenses is getting betterin 2014 than 2013. However, the net profit margin show that the company getting worse atcontrolling its overall expenses, which is bad. Even though selling expenses ratio show thecompany ability to control selling expenses is getting worse, the general expenses ratio andfinancial expenses ratio show a lot of improvement for the last two years. Thus, it helps to coverup the loss caused by selling expenses.
b) STABILITY
Spritzer Bhd is doing incredibly good in stability from the period 2013 to 2014. The total debt,stock turnover, debtor turnover and interest coverage are showing improvements respectively.The business total debt has reduced, it is selling products at a faster rate compared to theprevious year, taking less time to collect debt and its ability to pay off interest is getting better.Working capital which is the ability to pay off current liabilities is getting better too however it stilldoes not satisfy the 2:1 minimum requirement.
c) SHARE PRICE
Based on the P/E ratio which is 11.6 times, it is considered cheap as it is still below 15.Spritzer Bhd has a moderate profitability and a high stability therefore I strongly suggest theinvestors to invest in this company. If an investor was to buy a share in the company, he wouldjust have to wait for about 11 years to claim back his original principal and this definitely wouldnot be a problem since Spritzer Bhd is fairly profitable and strongly stable in financial.

TAYLOR’S UNIVERSITY | SABD | FNBE | BASIC ACCOUNTING
14
Appendix
TAYLOR’S UNIVERSITY | SABD | FNBE | BASIC ACCOUNTING
15

TAYLOR’S UNIVERSITY | SABD | FNBE | BASIC ACCOUNTING
16

TAYLOR’S UNIVERSITY | SABD | FNBE | BASIC ACCOUNTING
17
TAYLOR’S UNIVERSITY | SABD | FNBE | BASIC ACCOUNTING
18

TAYLOR’S UNIVERSITY | SABD | FNBE | BASIC ACCOUNTING
19
TAYLOR’S UNIVERSITY | SABD | FNBE | BASIC ACCOUNTING
20

TAYLOR’S UNIVERSITY | SABD | FNBE | BASIC ACCOUNTING
21

TAYLOR’S UNIVERSITY | SABD | FNBE | BASIC ACCOUNTING
22
Reference
Annual report 2013 (2013). Retrieved 27 May 2015, fromhttp://www.spritzer.com.my/wp-content/uploads/2014/05/SPRITZER_AR_2013.pdf
Annual report 2014 (2014). Retrieved 27 May 2015, fromhttp://www.spritzer.com.my/wp-content/uploads/2014/05/SPRITZER_AR_2014.pdf
Spritzer bhd (sptz.kl) (n.d.). Retrieved 31 May 2015, fromhttp://www.reuters.com/finance/stocks/companyProfile?symbol=SPTZ.KL
Share Price Movement. (n.d.). Retrieved June 3, 2015, fromhttp://www.malaysiastock.biz/Corporate-Infomation.aspx?type=A&value=S&securityCode=7103
Khoo, D. (2013, February 16). Spritzer’s competitive edge. The Star. Retrieved June 4, 2015,fromhttp://www.thestar.com.my/Business-News/2013/02/16/Spritzers-competitive-edge/?style=biz