Academic Writing Tasks 1 No 123467
10
Task 1 Allow 20 minutes to complete this task. The line chart below shows the percentage of unemployed workers in 3 countries over a five year period. Summarize the information by choosing and identifying the main features and make comparisons where relevant. Write a minimum of 150 words. 0% 1% 2% 3% 4% 5% 6% 2004 2005 2006 2007 2008 Levels of Unemployment in 3 Countries from 2004-2008 Country A Country B Country C
Transcript of Academic Writing Tasks 1 No 123467

Task 1
Allow 20 minutes to complete this task.
The line chart below shows the percentage of unemployed workers in 3 countries over a
five year period.
Summarize the information by choosing and identifying the main features and make
comparisons where relevant.
Write a minimum of 150 words.
0%
1%
2%
3%
4%
5%
6%
2004 2005 2006 2007 2008
Levels of Unemployment in 3 Countries from 2004-2008
Country A
Country B
Country C
Simone
Text Box
© IELTS-Blog.com, All Rights Reserved

Task 1
Allow 20 minutes to complete this task.
The line chart below shows the Gross Domestic Product growth rates and emigration rates
in a Latin American country over the 20th century.
Summarize the information by choosing and identifying the main features and make
comparisons where relevant.
Write a minimum of 150 words.
2.69% 2.78%2.43%
0.00% 0.00%
3.79%
2.03%
1.12%
4.56%
0.02%0.03% 0.23%
1.20%
5.65%
4.17%
0.49%1.09%
4.57%
2.12%
15.45%
0.00%
2.00%
4.00%
6.00%
8.00%
10.00%
12.00%
14.00%
16.00%
18.00%
1900 1910 1920 1930 1940 1950 1960 1970 1980 1990
Economic and Emigration Growth Rates in a Latin American Country in the 20th Century.
GDP Growth Rates
Emigration Growth Rates
Simone
Text Box
© IELTS-Blog.com, All Rights Reserved

511
154
857
272
0
100
200
300
400
500
600
700
800
900
Indonesia Singapore South Korea Thailand
Units in Billions of US dollars
GDP of Four Asian countries in 2008
GDP
Simone
Text Box
© IELTS-Blog.com, All Rights Reserved
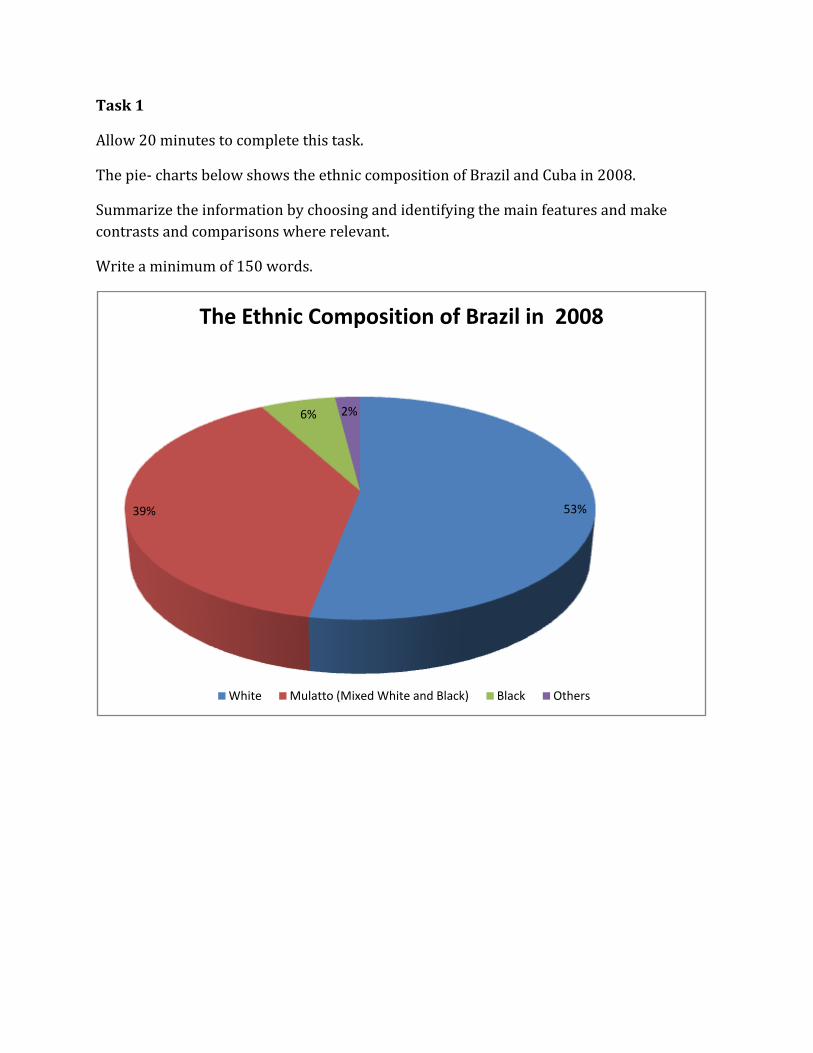
Task 1
Allow 20 minutes to complete this task.
The pie- charts below shows the ethnic composition of Brazil and Cuba in 2008.
Summarize the information by choosing and identifying the main features and make
contrasts and comparisons where relevant.
Write a minimum of 150 words.
53%39%
6% 2%
The Ethnic Composition of Brazil in 2008
White Mulatto (Mixed White and Black) Black Others
Simone
Text Box
© IELTS-Blog.com, All Rights Reserved

65.00%
25.00%
10.00%
The Ethnic Composition of Cuba in 2008
White
Mulatto( a mixture of White and Black) and Mestizo (a mixture of White and Amerindian)
Black
Simone
Text Box
© IELTS-Blog.com, All Rights Reserved
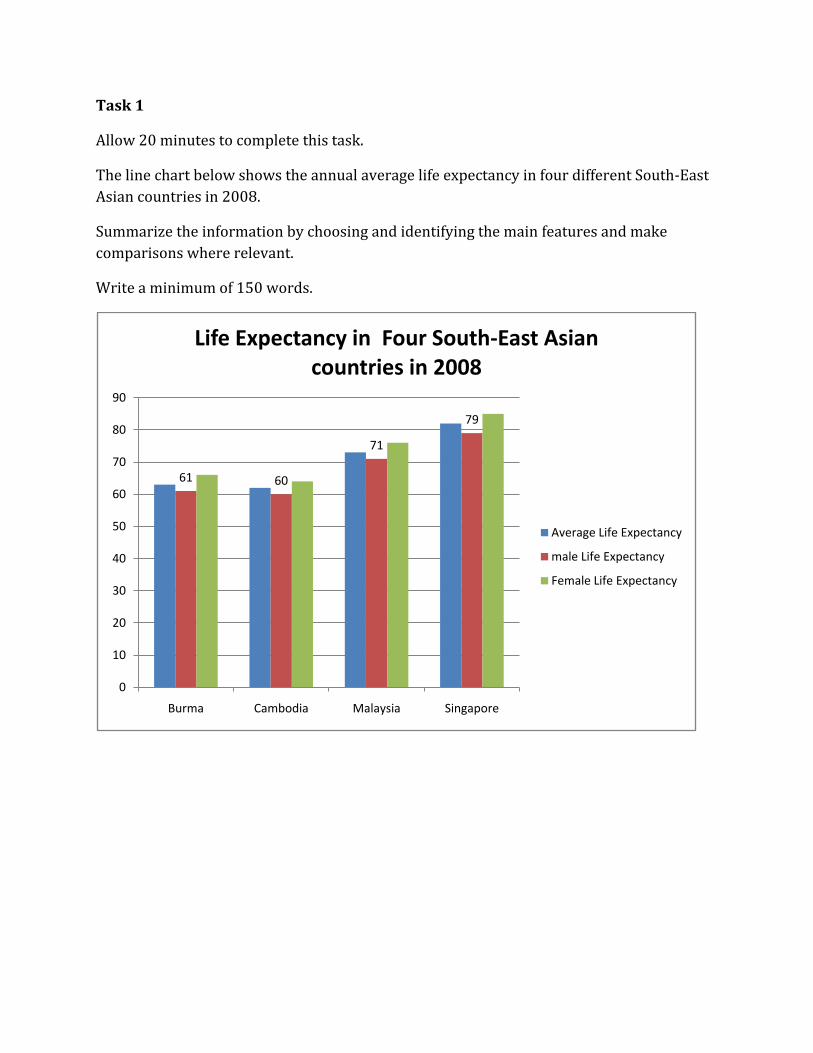
Task 1
Allow 20 minutes to complete this task.
The line chart below shows the annual average life expectancy in four different South-East
Asian countries in 2008.
Summarize the information by choosing and identifying the main features and make
comparisons where relevant.
Write a minimum of 150 words.
61 60
71
79
0
10
20
30
40
50
60
70
80
90
Burma Cambodia Malaysia Singapore
Life Expectancy in Four South-East Asian countries in 2008
Average Life Expectancy
male Life Expectancy
Female Life Expectancy
Simone
Text Box
© IELTS-Blog.com, All Rights Reserved
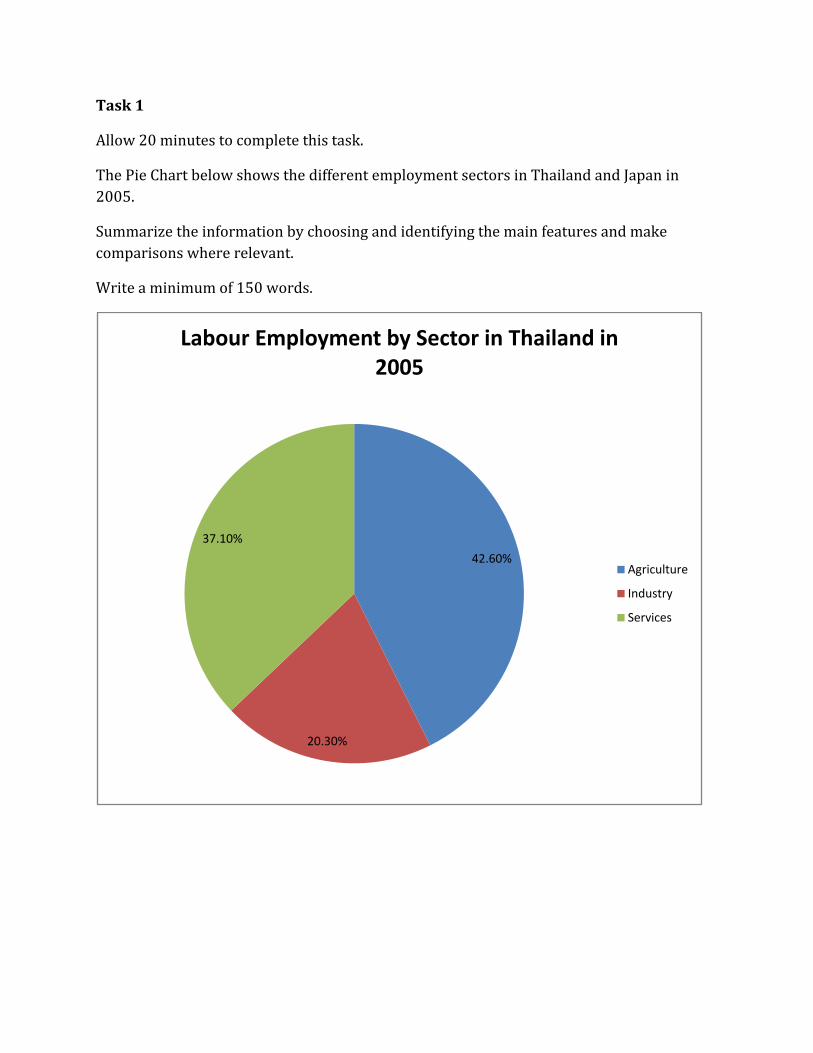
Task 1
Allow 20 minutes to complete this task.
The Pie Chart below shows the different employment sectors in Thailand and Japan in
2005.
Summarize the information by choosing and identifying the main features and make
comparisons where relevant.
Write a minimum of 150 words.
42.60%
20.30%
37.10%
Labour Employment by Sector in Thailand in 2005
Agriculture
Industry
Services
Simone
Text Box
© IELTS-Blog.com, All Rights Reserved

4.50%
28.00%
66.50%
Labour Division by Employment in Japan in 2005
Agriculture
Industry
Services
Simone
Text Box
© IELTS-Blog.com, All Rights Reserved

Task 1
Allow 20 minutes to complete this task.
The line chart below shows the percentage of Gross Domestic Product spent on Education
in 2007 in four countries in Asia and the growth in Gross Domestic Product in 2008 in the
same countries.
Summarize the information by choosing and identifying the main features and make
comparisons where relevant.
Write a minimum of 150 words.
2.30%
5.00%
3.40%
4.20%
0.00%
1.00%
2.00%
3.00%
4.00%
5.00%
6.00%
Kazakhstan Mongolia Nepal Thailand
Educational Expenditure as a Percentage of GDP in 2005
Educational Expenditure as a Percentage of GDP
Simone
Text Box
© IELTS-Blog.com, All Rights Reserved
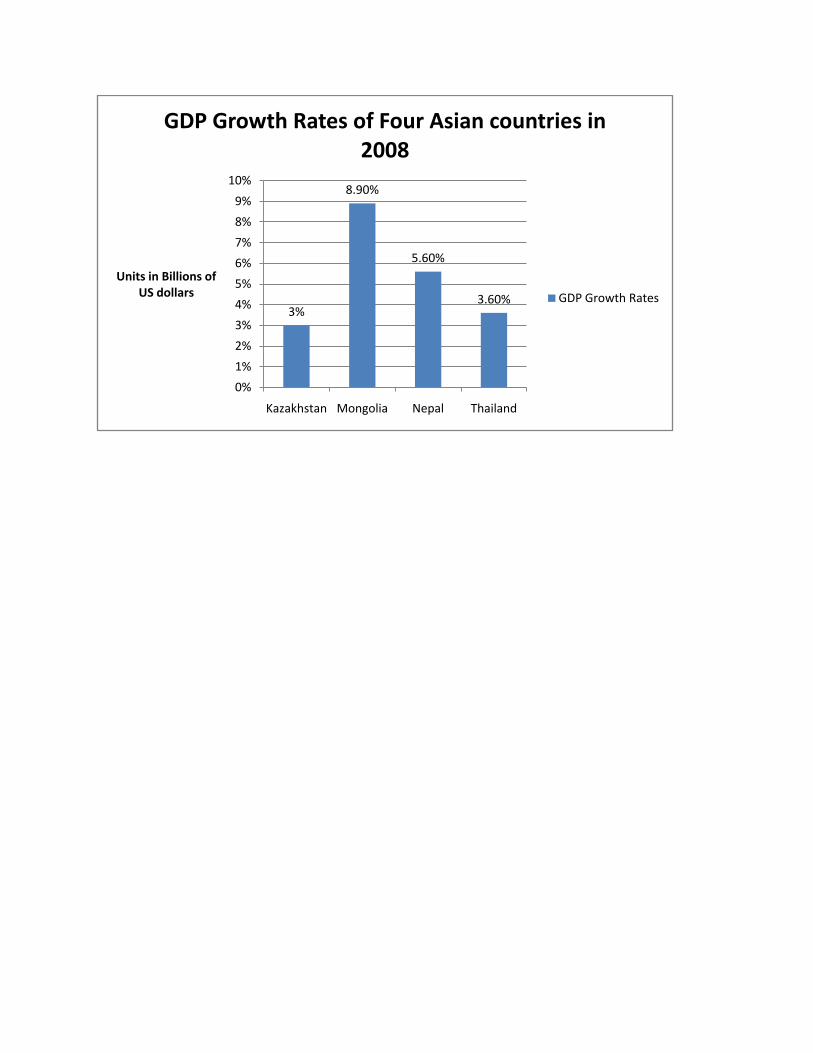
3%
8.90%
5.60%
3.60%
0%
1%
2%
3%
4%
5%
6%
7%
8%
9%
10%
Kazakhstan Mongolia Nepal Thailand
Units in Billions of US dollars
GDP Growth Rates of Four Asian countries in 2008
GDP Growth Rates
Simone
Text Box
© IELTS-Blog.com, All Rights Reserved