Academic Update - BoardDocs, a Diligent Brand · Every day, every student should read more, write...
40
School Board Goal: Improve Student Achievement 1 9/19/2018 Academic Update Division of Accountability & Information Division of Academic Affairs September 19, 2018
Transcript of Academic Update - BoardDocs, a Diligent Brand · Every day, every student should read more, write...

School Board Goal:Improve Student Achievement
19/19/2018
Academic Update
Division of Accountability & InformationDivision of Academic Affairs
September 19, 2018

2
Accountability Data Calculations
ExampleFederal ESSAPass Rate
State Accreditation Pass Rate - Old
State Accreditation Pass Rate - New
Adjustments allowed• Failed Retests• Failed Initial
Attempt w/passed retest
• Students 1st Year in US
Adjustments allowed• Failed Retests• Failed Initial
Attempt w/passed retest
• Students 1st Year in US
• Failed Transfers• Failed EL• Recovery• State Approved
Substitute Tests
Adjustments allowed• Failed Retests• Failed Initial
Attempt w/passed retest
• Students 1st Year in US
• Failed Transfers• Failed EL• Recovery• State Approved
Substitute Tests• Growth (4-8)• EL Progress (2-12)

2017-18 Standards of Learning by Subgroups
Note: Data sources are VDOE and NPS internal reporting. Results include recovery points and other SOA adjustments.
READING – State Accreditation Combined Rate
9/19/2018 3
0%10%20%30%40%50%60%70%80%90%
100%
2015-16 2016-17 2017-18
Asian Black Hispanic White

2017-18 Standards of Learning by Subgroups
Note: Data sources are VDOE and NPS internal reporting. Results include recovery points and other SOA adjustments.
READING – State Accreditation Combined Rate
9/19/2018 4
0%
10%
20%
30%
40%
50%
60%
70%
80%
90%
100%
2015-16 2016-17 2017-18
Black Hispanic White
B-W Gap23%
B-W Gap 21%
Gap 20%

2017-18 Standards of Learning by Subgroups
Note: Data sources are VDOE and NPS internal reporting. Results include recovery points and other SOA adjustments.
READING – State Accreditation Combined Rate
9/19/2018 5
0%10%20%30%40%50%60%70%80%90%
100%
2015-16 2016-17 2017-18
Eco. Disadv. Eng. Learners Students w/Disabilities
Gifted Learners Military Connected

2017-18 Standards of Learning by Subgroups
Note: Data sources are VDOE and NPS internal reporting. Results include recovery points and other SOA adjustments.
READING
9/19/2018 6
0%
10%
20%
30%
40%
50%
60%
70%
80%
90%
100%
2015-16 2016-17 2017-18
Economically Disadv Non-Disadv
Gap 18%
Gap 17%
Gap18%

2017-18 Standards of Learning by Subgroups
Note: Data sources are VDOE and NPS internal reporting. Results include recovery points and other SOA adjustments.
Mathematics – SOA Adjusted
9/19/2018 7
0%10%20%30%40%50%60%70%80%90%
100%
2015-16 2016-17 2017-18
Asian Black Hispanic White

2017-18 Standards of Learning by Subgroups
Note: Data sources are VDOE and NPS internal reporting. Results include recovery points and other SOA adjustments.
Mathematics
9/19/2018 8
0%
10%
20%
30%
40%
50%
60%
70%
80%
90%
100%
2015-16 2016-17 2017-18
Black Hispanic White
B-W Gap24%
B-W Gap 21%
Gap 21%

2017-18 Standards of Learning by Subgroups
Note: Data sources are VDOE and NPS internal reporting. Results include recovery points and other SOA adjustments.
Mathematics – SOA Adjusted
9/19/2018 9
0%10%20%30%40%50%60%70%80%90%
100%
2015-16 2016-17 2017-18
Eco. Disadv. Eng. Learners Students w/Disabilities
Gifted Learners Military Connected

2017-18 Standards of Learning by Subgroups
Note: Data sources are VDOE and NPS internal reporting. Results include recovery points and other SOA adjustments.
Mathematics
9/19/2018 10
0%10%20%30%40%50%60%70%80%90%
100%
2015-16 2016-17 2017-18
Eco. Disadv. Non-Disadv.
Gap18%
Gap 16%
Gap 17%
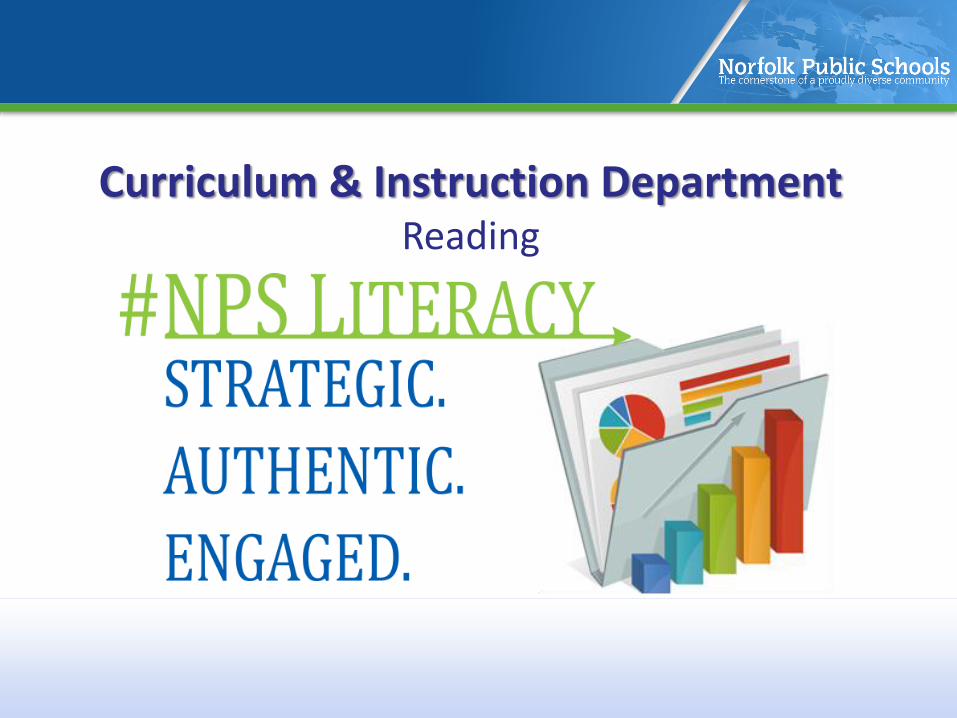
Curriculum & Instruction DepartmentReading

English Department Focus
Strategic Reading and writing
are not passive activities
Every day, every student should read more, write more, and discuss more.
Authentic Engaged
Personally meaningful reading and writing
Real world application of reading, writing, and research
Authentic text
Balanced Literacy
Clear, focused curriculum
Research based instructional strategies

2017 English Curriculum Overview
Organization of the 2017 K-12 English Standards of Learning
• Communication & Multimodal Literacy
Discussion & Collaboration
Prepare, deliver, and critique oral and multimodal presentations
• Reading
The student will read…
• Writing
The student will write…
• Research
Create and investigate research questions
Access information
Validate sources, credit sources, and synthesize information into a research based product

2017 English Standards Timeline
2017-18
K-8 Pacing Guides• Units built across genres• Focused on comprehension strategiesReading Specialists and Department Chairs• Training focusing on new standards, VDOE crosswalk
documents/resources, and curriculum framework
2018-19
Crosswalk Year of 2010 Standards to 2017• K-8 Full Implementation of 2017 Standards• 9-12 Curriculum follow 2010 Standards/Units built across
genres• Fall VDOE Institutes district representatives attending• Crosswalk documents and resources provided• Grade specific PD and planning focusing on new standards
2019-20 • Full implementation of 2017 English Standards K-12
Spring 2020 • 2017 English Standards tested
29 Reading Specialists
and 17 Department
Chairs to support work

2018 English Professional Development
Curriculum Instruction Assessment
• Planning Protocol• Unpacking 2017
Standards to align written, taught and tested curriculum
• Building-based grade level planning support
• Explicit Instruction• Gradual Release• Comprehension Strategies• Vocabulary
• Grades 3- EOC the Big 3• Drawing conclusions and
making inferences• Determining Importance: main
idea & details• Vocabulary: using context to
determine meaning of unknown words
• Replicable PD for Reading Specialists and Department Chairs
• Guiding reading training for all new teachers and long-term substitutes
• Using Atlas Protocol to analyze and respond to literacy data• SOL Data• STAR Reading• District Benchmarks• Formative
Assessment• Literacy Assessment 101:
• DRA• DSA• PALS• Concept of Word• Running Records
• ABC Data Meetings & Core Content Administrator Rotations
The Stages of Literacy DevelopmentGuided Reading and Components of Literacy Block
2018 Summer Literacy Conference
Professional Learning Day

Reading and Math Specialists Position Redesign
Model / Coach / Feedback
Grade Level Planning Day
Student Groups Specialist Meetings
Duties and Expectations
• Build Capacity for Tier I
• Priority- New teachers and long-term subs
Duties and Expectations
• Specialists offer teachers aligned activities and strategies
• Assistance with aligning lesson plans
Duties and Expectations
• Specialists work with identified groups of students in need of intervention
Duties and Expectations
• Specialists meet with Senior Coordinator and teacher specialists monthly for PD, updates, & to review data

Reading and Math Specialists Position Redesign
Model / Coach / Feedback
Grade Level Planning Day Student Groups Specialist Meetings
Quantifying the work
• Specialists submit logs, including next steps
• Feedback from admin on alignment
Quantifying the work
• Quarterly Grade level planning logs
• Informal feedback from teachers on lesson support they receive
• Growth in student performance data for the building
Quantifying the work
• Weekly log of student groups & focus of groups
• Student Achievement Data
Quantifying the work
• Senior Coordinator provides quarterly update on attendance and participation
• Specialist PD Logs uploaded monthly in Google Drive
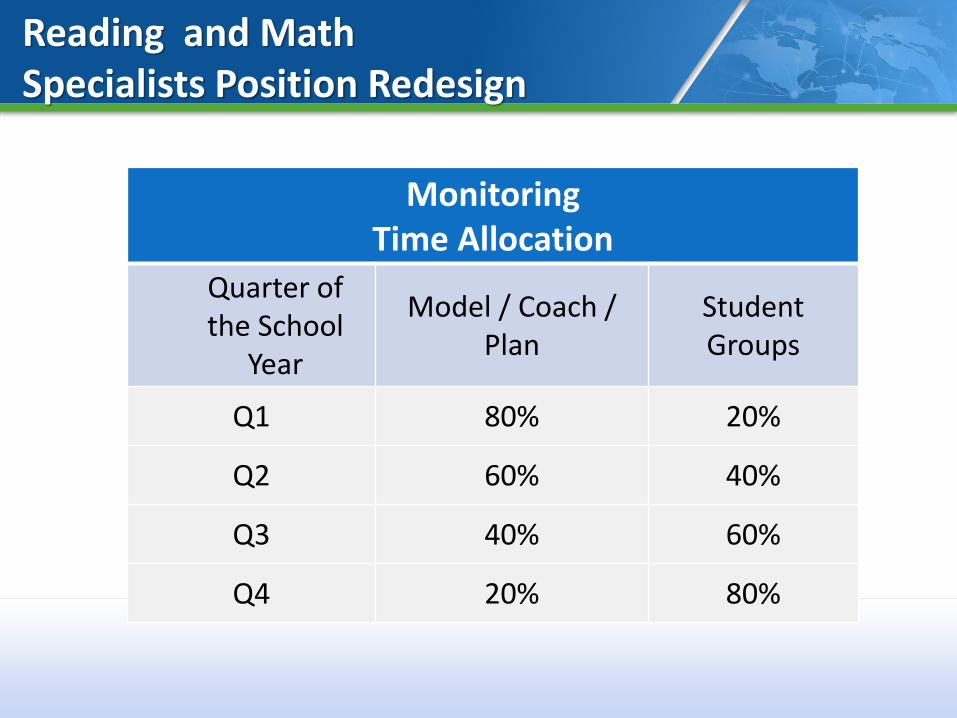
Reading and Math Specialists Position Redesign
MonitoringTime Allocation
Quarter of the School
Year
Model / Coach / Plan
Student Groups
Q1 80% 20%
Q2 60% 40%
Q3 40% 60%
Q4 20% 80%

Curriculum & Instruction DepartmentMathematics
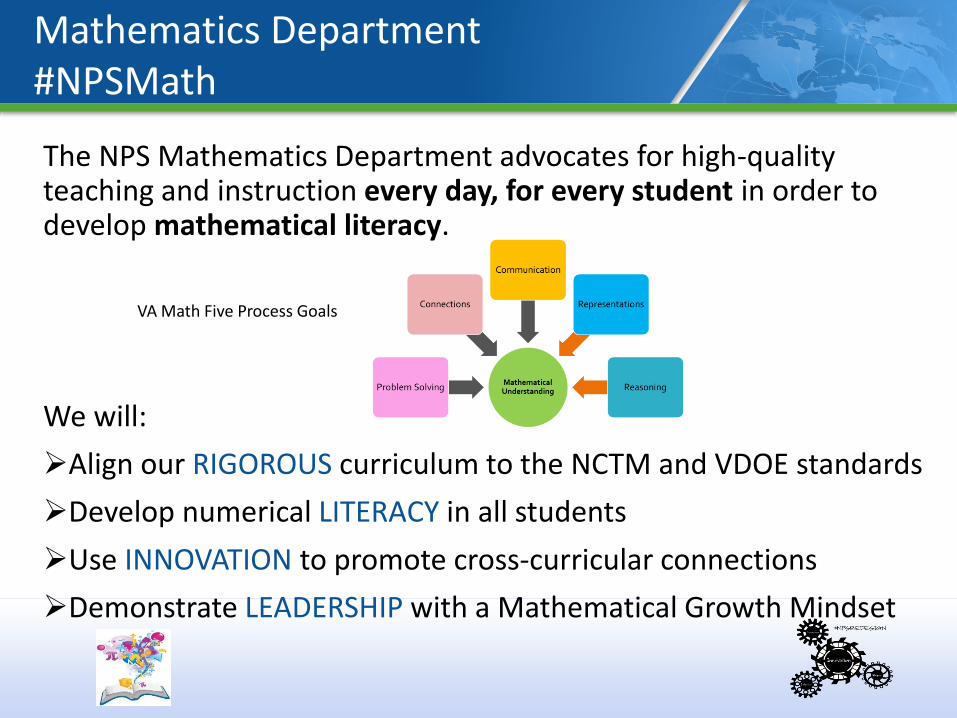
The NPS Mathematics Department advocates for high-quality teaching and instruction every day, for every student in order to develop mathematical literacy.
We will:
Align our RIGOROUS curriculum to the NCTM and VDOE standards
Develop numerical LITERACY in all students
Use INNOVATION to promote cross-curricular connections
Demonstrate LEADERSHIP with a Mathematical Growth Mindset
VA Math Five Process Goals
Mathematics Department #NPSMath
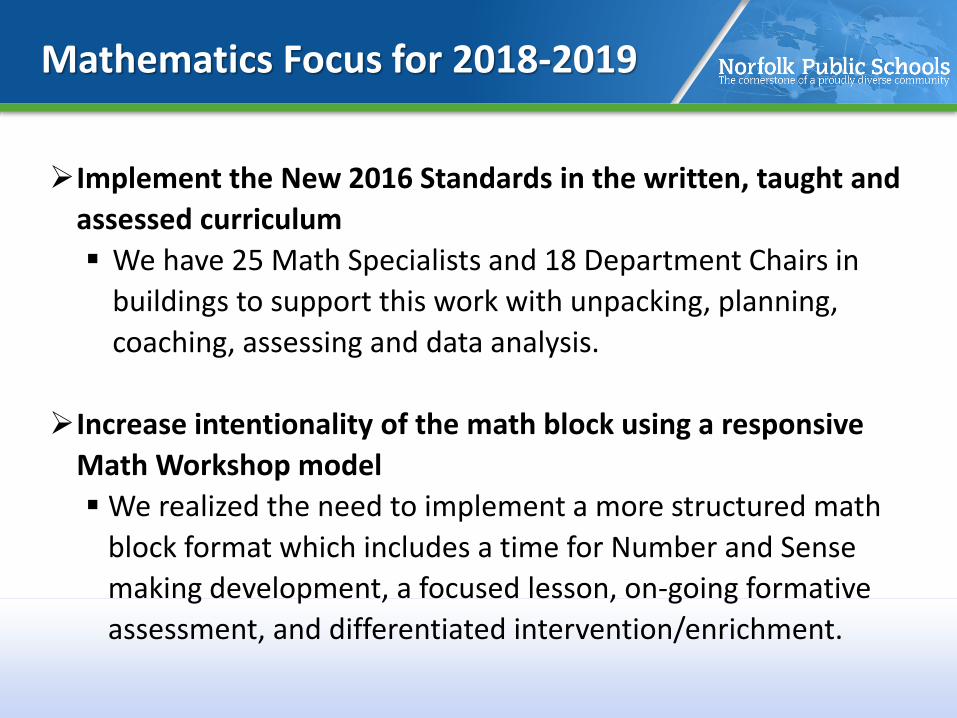
Implement the New 2016 Standards in the written, taught and
assessed curriculum
We have 25 Math Specialists and 18 Department Chairs in
buildings to support this work with unpacking, planning,
coaching, assessing and data analysis.
Increase intentionality of the math block using a responsive
Math Workshop model
We realized the need to implement a more structured math
block format which includes a time for Number and Sense
making development, a focused lesson, on-going formative
assessment, and differentiated intervention/enrichment.
Mathematics Focus for 2018-2019

Mathematics Curriculum Changes
2017-2018 SY 2018-2019 SY
• NPS given permission by VDOE to fully
implement new 2016 Standards in K-2nd
Grade
• Grades 3 - End of course implemented
Crosswalk Year in which 2009 and 2016
standards taught
• Only 2009 standards assessed in Spring
2018
• Full Implementation of the new 2016
Math Standards – All Grades
• Spring 2019 will be first time to assess
2016 Standards

Mathematics Curriculum Changes (cont’d)
Preparation for the Upcoming changes included:
• Fall 2016: VDOE Institutes attended by district representatives
• Spring 2017: training with Math Specialists and Dept. Chairs - VDOE crosswalk documents/resources
• August 2017: PD training with teachers using VDOE crosswalk documents/resources
• 2017 -2018 SY: Crosswalk Pacing Guides provided• 2017-2018 SY: PD/Planning in buildings utilizing VDOE
crosswalk documents/resources for teachers• August 2018: Grade specific PD/Planning on upcoming
Quarter 1 content (2016 standards)

Math workshop is a model of instruction and a philosophy of how math class can be structured to maximize opportunities for differentiated instruction, formative assessment, and student-centered learning which can include intervention and enrichment.
Reference: Five Steps to Math Workshop, Math Solutions
Math Workshop
Number Sense
Routines
Focus Lesson
Guided Math
Learning Stations
Reflections
Task and Share
Components of Math Workshop
Math Workshop

2018-2019 Math Professional Development
Curriculum Instruction Assessment
• Unpacking 2016Standards to align taughtand tested curriculum using VDOE protocol
• Building based - Grade level planning support
• Organizing Study Groups Led by teacher
leaders Focus on upcoming
content Open to new,
veteran, SPED and long term substitute teachers
• Math Workshop Analyze and adjust the
Math Block to fit students’ needs
• Content Focus Areas Increased focus on
Fractions Increased focus on
application of skills in Practical Single and Multistep Problems
Various skills as determined by building level data
• Training on development of aligned items to use for assessment Embedded in grade level
planning and study groups
• ABC Data Meetings and Core Content Administrator Rotations
• Using Atlas Protocol to analyze and respond to math data: Grade Level and Cohort
Data from Spring 2018 SOLs STAR Math District Benchmarks Formative Assessment
Examples: Unit Assessments Exit Tickets Student Work
Summer 2018 Professional Development on Math Workshop
and Number Sense Routines

Graduation Measures
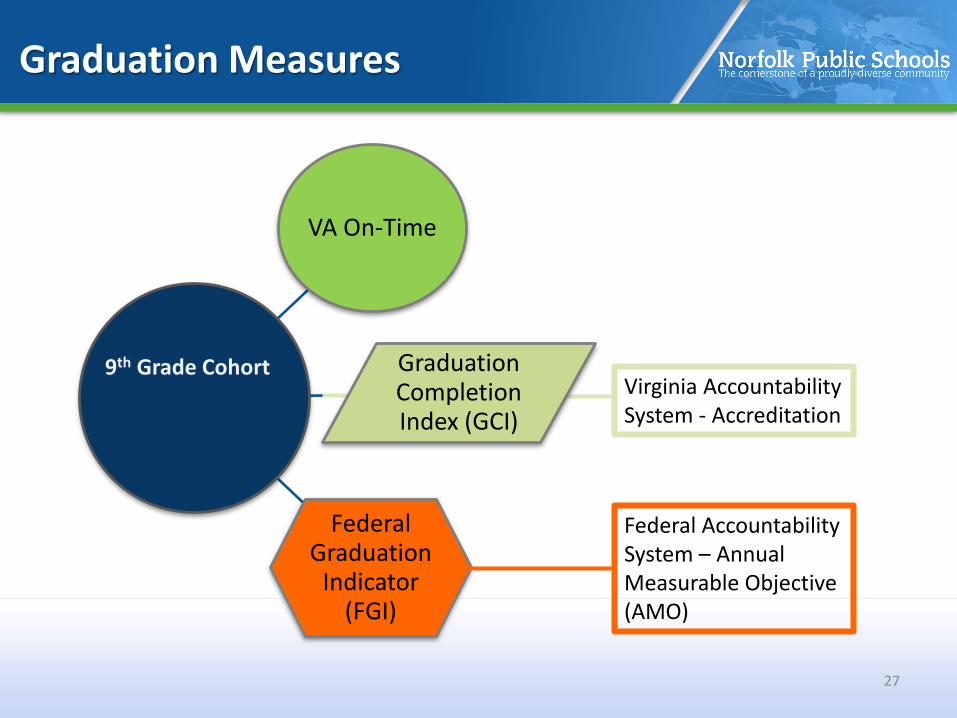
Graduation Measures
VA On-Time
Graduation Completion Index (GCI)
Federal Graduation
Indicator (FGI)
27
9th Grade CohortVirginia Accountability System - Accreditation
Federal Accountability System – Annual Measurable Objective (AMO)

Graduation Data Components
28
Components Federal Graduation Indicator (FGI) 84%
Graduation Completion Index (GCI) 88%
VA On-Time Graduation (OTGR)
9th Grade Cohort
Advanced Diploma
Standard Diploma
Modified Standard *
Special Diploma
GED
GAD General Achievement Diploma
ISAEP
Certificate of Completion
Transfer Adjustments
Still-In School
LEP & SPED Adjustments
4, 5, 6 Year Rates 3-Yr Average
Note: Modified Standard Diploma will no longer be available.

Preliminary Graduation Measures
Schools
PreliminaryOn-Time Rate Release Date
10-1-2018
Preliminary Graduation Completion Index
(GCI) 88% Release Date 9-27-2018
Preliminary Federal Graduation Indicator
(FGI) 84% Released Date 2019
District 82% 88% TBD
BT Washington 79% 88% TBD
Granby 86% 90% TBD
Lake Taylor 82% 90% TBD
Maury 83% 87% TBD
Norview 80% 87% TBD
29

Every Student Succeeds Act (ESSA)Federal Accountability Indicators
30
Status2018-19
(Based on 2017-18 Data)
ComprehensiveSupport and Improvement
TBD
Targeted Support and Improvement
TBD
Source: VDOE Website - Transition to ESSAThe new Every Student Succeeds Act of 2015 (ESSA) eliminates many No Child Left Behind Act-era requirements and provides greater flexibility ... ESSA designates 2016-2017 as a transition year …… and 2017-2018 school year as the implementation year….. Schools are identified for support every three years beginning with 2018-19 school year (2017-18 assessment year).
Note: Will be announced 9/27/2018

Every Student Succeeds Act (ESSA)Federal Accountability Indicators
31
Indicators2018-19
(Based on 2017-18 Data)
Academic Indicators Pass Rates – SOL Reading and Math, VAAP
Growth in Reading and Mathematics
High school graduation rate (FGI)
Progress in English Learners (ACCESS for ELLs)
Indicators of School Quality or Student Success
Chronic Absenteeism
School Accreditation Rating
Federal Accountability IndicatorsUnder ESSA, school are identified for support and improvement based on multiple performance indicators.
Source: VDOE

Every Student Succeeds Act (ESSA)Federal Accountability Indicators
32
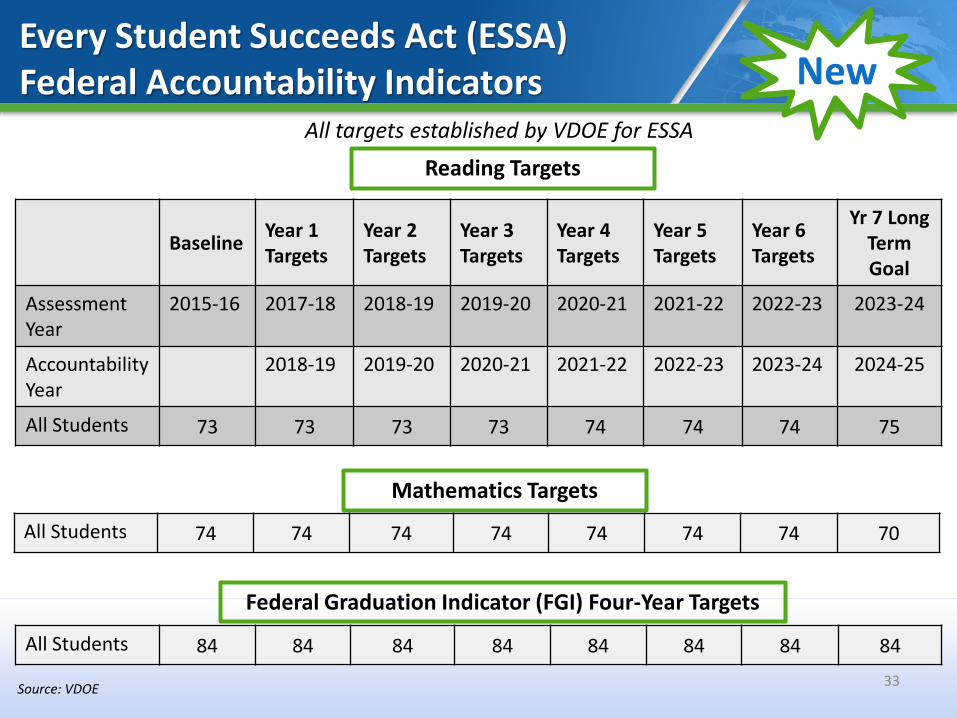
Long Term Goals and Interim Measures of ProgressIn accordance with ESSA requirements, long term goals and interim measures of progress were established for reading and mathematics. For each subject, the long term goal is the same as the state accreditation benchmark.
• Baseline rate is based on assessment data from 2015-16• State accreditation benchmark is the long-term goal for each subgroup• Increasing interim targets at seven intervals for reading and mathematics
starting with 2017-18 assessment year• New mathematics assessments will be administered during the 2018-19
assessment year, and new reading assessments will be administered during the 2019-20 assessment year. Revised targets for mathematics and reading will be established following the first administration of the new tests.
Source: VDOE
Every Student Succeeds Act (ESSA)Federal Accountability Indicators
33
BaselineYear 1 Targets
Year 2Targets
Year 3 Targets
Year 4 Targets
Year 5 Targets
Year 6 Targets
Yr 7 Long Term Goal
Assessment Year
2015-16 2017-18 2018-19 2019-20 2020-21 2021-22 2022-23 2023-24
Accountability Year
2018-19 2019-20 2020-21 2021-22 2022-23 2023-24 2024-25
All Students 73 73 73 73 74 74 74 75
Reading Targets
Mathematics Targets
All Students 74 74 74 74 74 74 74 70
Federal Graduation Indicator (FGI) Four-Year Targets
All Students 84 84 84 84 84 84 84 84
Source: VDOE
All targets established by VDOE for ESSA
New
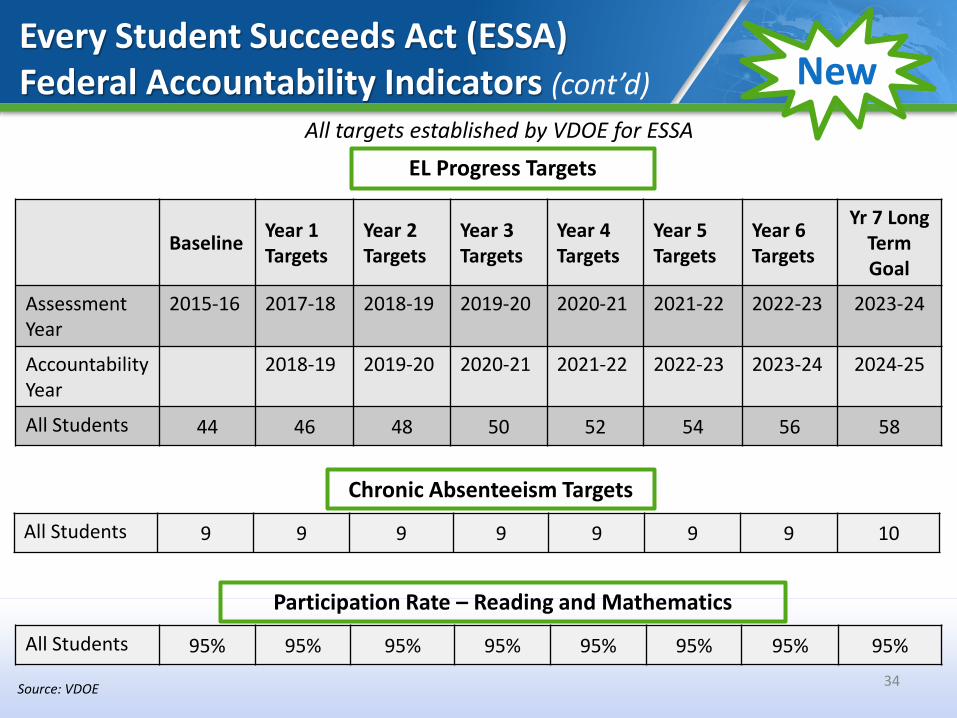
Every Student Succeeds Act (ESSA)Federal Accountability Indicators (cont’d)
34
BaselineYear 1 Targets
Year 2Targets
Year 3 Targets
Year 4 Targets
Year 5 Targets
Year 6 Targets
Yr 7 Long Term Goal
Assessment Year
2015-16 2017-18 2018-19 2019-20 2020-21 2021-22 2022-23 2023-24
Accountability Year
2018-19 2019-20 2020-21 2021-22 2022-23 2023-24 2024-25
All Students 44 46 48 50 52 54 56 58
EL Progress Targets
Chronic Absenteeism Targets
All Students 9 9 9 9 9 9 9 10
Participation Rate – Reading and Mathematics
All Students 95% 95% 95% 95% 95% 95% 95% 95%
Source: VDOE
All targets established by VDOE for ESSA
New

Comparison of CalculationsAccreditation vs ESSA

36
Who is included?
State Accreditation Federal ESSA
SOL tests taken grades 3-8 during the Summer, Fall, and Spring
SOL tests taken grades 3-8 during the Summer, Fall, and Spring
SOL tests taken (EOC) grades 9-12 during Summer, Fall, and Spring
SOL tests taken (EOC) grades 9-12 during the Summer, Fall, and Spring by Federal Graduation Indicator (FGI) Cohort minus dropouts, Long Term Absences (LTA)
SOL, VAAP, VSEP, and substitute test takers
SOL and VAAP test takers
English Learners Progress 3-12 English Learners Progress K-12
Chronic Absenteeism K-12 Chronic Absenteeism K-12
Source: VDOE
37
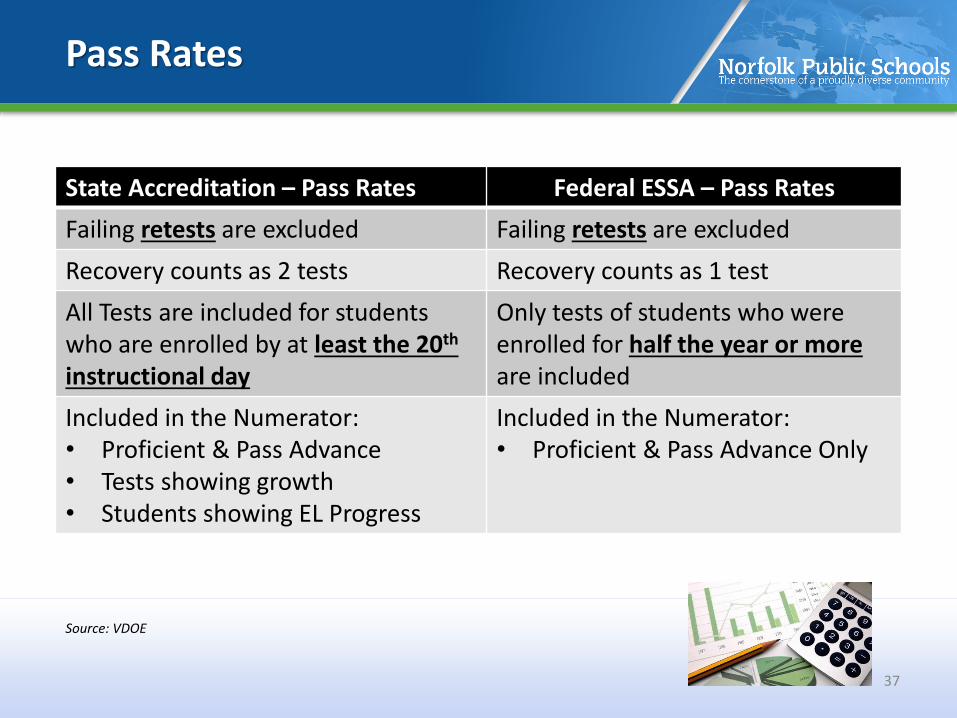
Pass Rates
State Accreditation – Pass Rates Federal ESSA – Pass Rates
Failing retests are excluded Failing retests are excluded
Recovery counts as 2 tests Recovery counts as 1 test
All Tests are included for students who are enrolled by at least the 20th
instructional day
Only tests of students who were enrolled for half the year or more are included
Included in the Numerator:• Proficient & Pass Advance• Tests showing growth• Students showing EL Progress
Included in the Numerator:• Proficient & Pass Advance Only
Source: VDOE

38
Substitute Tests & Graduation Indication
State Accreditation – Substitute Tests Federal ESSA – Substitute Tests
State board (VDOE) approved test can be used in lieu of an SOL test
Only AP, IB, SAT and ACT
Available for all subjects (Ex: ACT WorkKeys Business Writing subs for Writing SOL)
Only for Math
State Accreditation – Graduation Federal ESSA – Graduation
Graduation Completion Indicator (GCI)
Federal Graduation Indicator (FGI)
Current Year (School Year just ended) Lags a Year in 2018Will use current year in 2019 and beyond
Source: VDOE

39
Small N & Other Details
State Accreditation – Small N Federal ESSA – Small N
30 (to be statistically significant) 30 (to be statistically significant)
Recovery Tests count as one test If current year is Too Small, the 3 year is not considered.
State Accreditation – Other Details Federal ESSA – Other Details
Safe Harbor Provision (R10) No Safe Harbor
No participation calculation Participation calculations (95%) for reading and mathematics
Board Approved and found in the Standards of Accreditation
Approved by USED based on the Every Student Succeeds Act
Note: • The Safe Harbor Provision (R10) is when a school is given credit for reducing the
failure rate by 10% or more as long as the combined rate is at least 50%. • The too small value for public reporting is 10.• The too small value to be considered in accreditation is less than 30 students in the
3-year average and the combined rate is less than 65 for the current year.Source: VDOE

Accountability Information & Reports Timeline
Date Information / Report
August 1, 2018 Preliminary division-level and school-level pass rates (Internal Use Only)
August 1, 2018 Preliminary 2018-19 state accreditation ratings (Internal Use Only)
August 22, 2018 Press Release of State & Division Pass Rates
September 4, 2018 Finalize graduation data for state accreditation & report cards
September 27, 2018 Press Release state accreditation & federal ratings; Schools identified for Comprehensive Assistance or Additional Targeted Assistance under ESSA
October 1, 2018 Press Release on Cohort Graduation & Dropout Rates
40