AC 150/5060-5 g/23/83 - Federal Aviation Administration 150/5060-5 g/23/83 FIGURE 367A RUNWAY OPERAT...
50
A C 150/5060-5 g/23/83 FIGURE 367A RUNWAY OPERAT IOtJS RATE i%lRE 367El RUNWAY OPERATIONS RATE 0 TO 35 OPERATIONS PER HOUR 36 TO 55 OPERATIOPIS PER HOUR 250 250 30 so 0 0 20 40 60 80 lool20 140160 0 180 0 20 40 60 80 100 120 140 160 180 MIX INDEX -- PERCENTK+3D) NIX INDEX -- PERCENTK+3D) FIGURE 367C RUNWAY OPERATIONS RATE FWRE 367D RUNWAY OPERATIONS RATE 56 TO 75 OPERATIONS PER HOUR 76 TO 95 OPERATIONS PER HOUR MIX iNDEX -- PERCENTK+3D) 0 0 5 10 15 20 25 30 35 40 MIX INDEX PERCENTK+3D) -- FIGURE 3-57. HOURLY CAPACITY OF A TAXIWAY CROSSING AN ACTIVE RUNWAY WITHOUT ARRIVALS, Chap 3
-
Upload
truongduong -
Category
Documents
-
view
227 -
download
0
Transcript of AC 150/5060-5 g/23/83 - Federal Aviation Administration 150/5060-5 g/23/83 FIGURE 367A RUNWAY OPERAT...

A C 150/5060-5 g/23/83
FIGURE 367A RUNWAY OPERAT IOtJS RATE i%lRE 367El RUNWAY OPERATIONS RATE0 TO 35 OPERATIONS PER HOUR 36 TO 55 OPERATIOPIS PER HOUR
250 250
30 so
00 20 40 60 80 lool20 140160
0180 0 20 40 60 80 100 120 140 160 180
MIX INDEX -- PERCENTK+3D) NIX INDEX -- PERCENTK+3D)
FIGURE 367C RUNWAY OPERATIONS RATE FWRE 367D RUNWAY OPERATIONS RATE56 TO 75 OPERATIONS PER HOUR 76 TO 95 OPERATIONS PER HOUR
MIX iNDEX -- PERCENTK+3D)
00 5 10 15 20 25 30 35 40
MIX INDEX PERCENTK+3D)--
FIGURE 3-57. HOURLY CAPACITY OF A TAXIWAY CROSSING AN ACTIVE RUNWAY WITHOUT ARRIVALS,
Chap 3

9/23/83 AC 150/5060-S
- 4,o+^w-I-4e%gjis a 3,oacg-xsa3:
co 210$EiWF4a$2 1 . 0
35 40 45 50 55 60HON-WIDEBODY AIRCRAFT GATE OCCUPANCY
0 2 0 40 60 80 1 0 0GATE MIX
(PERCLNT NON-WIDEBODY AIRCRAFT)
\ .
111 G*x S x N = Hourly Capacity1
NUMBER OF GATES ( N )
NOTES:AVERAGE GATE OCCUPANCY TIME
(1) R -FOR WIDEBODY AIRCRAFT
AVERAGE GATE OCCUPANCY TIMEFOR NON-WIDEBODY AIRCRAFT
(2) IF OPERATIONS DO NOT INCLUDE WIDEBODYAIRCRAFT, GATE MIX = 100 AND R = 1.0
35 40 45 5 0 55 60NON-WIDEBODY AIRCRAFT GATE OCCUPANCY
(M I N U T E S )
FIGURE 3-58, !~OURLY C A P A C I T Y O F G A T E S .
C-P 357

AC 150/5060-S g/23/83
8
6
048 068 080 10n
DELAY FACTOR
FIGURE 3-69, AVERAGE AIRCRAFT DELAY IN AN HOUR.
58 Chap 3

DURATION OF OVLRLOAD CHAOCT W O HoucIm
.
i
1
LO 1.1 1,2 1,3 1.4 1,s
DELAY FACTOR OUR186 ovERLo PnAsE WAY FACTOR DURIRG WERlDAD PMS
0urunoN OF OVCRLOAD CWAUTHRCC WOURrn
DURATlDN W OVERIBAD CHAIUCF O U R HOURm
DURATION Oc OVCRLOAD Pt-tA6CCIVC HOUR040
I3s
30
2s
20
ls
10
SI
IAcT
I I 0001.0 la1 18.2 1,3 104 1,s LO 101 L2 1.3 1.4 1,s LO 101 L2 1J 1,4 1.5
WAY FACloll OUR1116 0VER.w) PHASE #lAY FACTOR DURM WE&w) PHASE WAY FACTOR DURM OVERl(Ms PHASE
WE: FOR DISCUSSIQI MD EXMUS Of TM TEm ‘OVERLW RUSE’ MD ‘SAti PERlooS’, SEE PARWAPH 28,C 011 PM 59.1
FIGURE 3-70, AVERAGE AIRCRAFT DELAY DURING SATURATED CONDITIONS~

12/l/93 ’ AC 150/5060-5 CHG 1
A R R I V A L DELAY INOEX502 ARRIVALS 602 ARRIVALS402 ARRIVALS
-s
0.6
#2 a4w3 0.2
NIX INDEX--PERCE?If (c+m NIX INDEX--fERCENl (C+S'D)
EPARTURL D E L A Y INa IOEX40% ARRIVALS 9X ARRIVALS 6llI ARRIVALS
0 2040 608oIDo~lm~mRIX INDEX--PERCENT K+3D)
020406080ltDlp1ull6D~HIX INDEX--fTRCE!W K+3D)
0 20406080lmm140~mHIX INDEX--?ERCE!if K+3D>
FIGURE 3-71. DELAY INDICES FOR RUNWAY-USE DIAGRAM NOS. 1, 9, 11, 12,31,42,47,48,53,54,66,68.70.71 FOR VFR CONDITIONS.
ARRIVAL DELAY INDEX = 1 .00
D PAR-T-URE DELAY I Norx
602 ARRIVALS= 1.0z
*s
0.6
8# 0.4aZ2 0.223 0 20406030~~NllEN8J
fllX INDEX-PERCEiCT K+3Dl
lie% ARR IVAIS SO% ARRIVALS
0 20% 60~0xn120iulL6o~Mx INDEX--PEKE?iT K&30)
FiGURE3-72. DEJMY !NDICES tO RRUNWAY-USEWWAM NOS.2.32~33,67,72,?‘3,87,aa~C~~FFi CONDITIONS.
C h a p 3 61

AC 150/5060-5 CHG 2 12!li’95
ARRIVAL OEtAY tNDEX = t.00
0 otx40% ARRIVALS 50% ARRIVALS
2 1.0E= 0.8g-
Y
NIX IMEG-PERCE?U K+3D)L
FIGURE 3-73. DEiAY INDICES FOR RUNWAY-USE DIAGRAM NO. 3 FOR VFFi CONDITIONS.
ARRIVAL DiELAY-lNDE% = 1.00
D E P A R T U R E DELAY INDEX40% ARRIVALS 60% iiRR1VAi.S9% ARRIVALS
% 0.2'20 2040 60801DDzpMlHla
11X INDEX--PERCENT (C+3D)
FIGURE 3-74. DEMY iNDiCES FOR RUNWAY-USE DIAGRAM NOS. $,74,75,85,86.89.90, 100. 101 FOR VFR CONDITIONS.
Chap 362

12: Ii95 AC 150/5060-5 CHG 3
ARRIVAL DELAY tNOEX40% ARRIVALS SO2 ARRIVALS 60% itRRIVALS
a 1.0uYx 0.88L
FOR 3/c iUft0 ot LO OR roRz sADt - 1.0t k I L 1 Z0 2040 608olmKo1~mm
= 0.2MX INDEX--PE!KENT K+3D)
DEPARTURE “DELAY tf?JOEX = t.00
FIGURE 3-75. DELAY INDICES FOR’RUNWAY-USE DIAGRAM NOS. 5,7,76,91 FOR VF2 CONDITIONS.
ARRIVAL D E L A Y ItJOEXuz ARRIVALS 502 ARRIVACS 6(1x ARRIVALS
= 0.8g- 0.6s
= 0.8k!!L
0EPARTURE DELAY I N
50% ARRIVALS
OEX60% ARRIVALS
z 0.6c I
mu o/c RATro o? 0 m 1.31.0 I I
rm olc UTIO ot d m 1,s301 - 1.0 I I
FIGURE 3-76. DELAY INDICES FOR RUNWAY-USE DIAGRAM NOS. 13,15 FOR VFR CONDITIONS.
63Chap 3

AC 150/5060-5 CHG 2 E/1/95
A R R I V A L DELAY tNQVC4U% ARRIVALS 50% ARRIVALS 60% ARRIVALS
= 1.0
z 0.6
t I ?OR D/C MT70 O? 0 m 1.5AD1 - 1.0 I Iii
d 0.4w-b= 0.2
OEPARTURE D E L A Y I N40% ARRIVALS SO% ARRIVALS
ocx60% ARR1W.S
s 1.0n
s 1.0sE -0.8s
0 20406080100KDltro160m!llX INDEX--PERCENT (MD)
FIGURE 3-77. DEiAY INDICES FOR RUNWAY-USE D~AG~M NOS. 16,79,94 FOR VFR CONDITIONS.
A R R I V A L D E L A Y INOEX50% ARRIVALS40% ARRIVALS 60% ARRIVALS
= 0.8g
= 0.88L
6 0.6 * 0.6ss AD1 * 1.0 I Iiiid 0.4
wg 0.2
nix It(MX--PERCENT (CGD)
D E P A R T U R E D E L A Y INDEX40% ARRIVAK 50% ARRIVALS 60% ARRIVALS
= 0.8g
ts. 0.8s-s 0.6s 0.6 * 0.6
58
0 20406080100~14l~mRIX IREX--PERCENT (C+3D)
0 20406080IulIp1~mm?!IX INDEX--PERCENT 03t))
FiGURE 3-78. DELAY INDICES FOR RUNWAY-USE DIAGRAM NOS. 18,19,21,22,23,77,78,92,93 FOR VFR CONDITIONS.
64 Chap 3

lUU95 AC 150/5060-5 CHG2
A R R I V A L D E L A Y INDEX402 ARRIVALS
c 1.0SUZ ARRIVALS
9 = 1.0z ,93 0.8 =
30.8
5 0.6 gs 0.6
B aw dd 0.4 0.4
7 0.2 wZ2 0.2NIX INDEX--fmcENT Km) NIX Imla--PERCENT 20 40 6080
(MD)aDla1ulmm
nrx IHEX--ERcEHT (C+3D)
DEPARTURt DELAY tNOEX
2 1.0 sax ARRIVALSa 2 1.0z = lo0u
0.8 :2i
5 0.6 80.8 z
E0.8
s :8 s
0.6 z 0.68
s# 0.4 2 0.4
a& 0.4
4 Ziii 0.2 s
Z0m40608010Dlp1~160181~~ 0.2 3 0.2
!ux UmEx--PERCEIIT K+3ll) RIX INIEX--3mENT (C+3D) 8RIX INDEX--PERCENT (C+m
FiGURE 3-79. DEtAY INDICES FOR RUNWAY-USE DIAGRAM NOS. 24,27 FOR VFR CONDITjONS.
ARRIVAL OCLAY INDEX
2 1.09 = 1.0- s4 0.8 =
5 0.6 ‘g *
0.8
0.6u
s
d 0.4B
w < 0.4
g 0.2 wg 0.2
MX INDEX--PERCENT (C+JDl NIX INDa--Km K+3ll)* NIX INDEX--PERCENT (C+3Dl
DCPARTURC DELAY I N D E X
so% ARRIvAu
'VX INDEX--PERCENT K+3D) 0 20~60801001201ullso181FflX INDEX--%RCENT K+3Dl
FIGURE 3.80. DEtAY INDICES FOR RUNWAY-USE DIAGRAM NOS. Z&28.41,82,97 FOR VFR CONDITIONS.
Chap 3 65

AC 150/5060-5 CHG 2 12/l/95
A R R I V A L OCtAY INDEX
402 ARRIVALS 502 ARRIVALS 602 ARRIVALS“, 1.09z3 0.8
z5
0.6
24d 0.4wg 0.2
0 0 2 0 40 6080 lrfJl2o1ull6omMX INDEH’ERCEU K+30) HIX INIlE&-PERCENT K+3D) I4 I X INDEX-PERCENT (C+3D)
D E P A R T U R E DELAY INDEX-
= 1.0S=8 0.8L-* 0.65Ed3 0.4Z3 0.2# 0 2uw,wsolalml4olellao#
MX INEX--PERCE?iT K+3D) RIX INDEX-PERCEKI’ (C+fD)
FiGURE 341. DELAY INDICES FOR RUNWAY-USE DlAGRM NO. 29 FOR VFR CONDITIOf’JS.
ARRIVAL DELAY INDEX * 1 .00
.D E P A R T U R E OELAY INDEX
FIGURE 3-82. DELAY INDICES FOR RUNWAY-USE DIAGRAM NOS. 34,35 FOR VFR CONDITIONS-
66 chap 3

g/23/83 AC 150/5060-S
ARRIVAL -DELAY- ---.-
1NOEX40% ARRIVALS 50% ARRIVALS 6OZ ARRIVALS
= 1.0g
w 0.6sxd 0.4w IOI D/C RAnd 01 0.6 OR n#r
ADI - 1.04 I I 1 I I I A 1
0 2040 6080100l2D1rl)l6o18)VIX INDEX--PERCENT (MD)
0 20406080lamo140l6D18)NIX INDEX--PERCENT K+3D)
0 20406080l@uo1~ItiomNIX INDEX--PERCENT (C+pD)
,PARTURE OELAV I ND E X40% ARRIVALS 50% ARRIVALS
1.0
0.8
0.6
0.4
& I 1 +
I 1 . I I~ FOR D/t RATIO OF 0.6 OR mRE
s 0.6
DDI - 1.00.21 ' ' ' ' n ' ' 1 1
0 20406c80lml2o14018018)MIX INDEX--PERCENT K+3D)
0 2 0 4 0 6080loDlzo140m18)MIX INDEX--PERCENT (MD)
020406080lml2o1~mmYIX INDEX--PERCENT K+3D)
FIGURE 3-83, DELAY' INDICES FOR RUNWAY-USE DIAGRAM NOS.: 36-38 FOR VFR CONDITIONS.
ARRIVAL DELAY iNDEX40% ARRIVALS 50% ARRIVALS 60% ARRIVALS
. . . . - -POR DtC RATIO OF 1.2 OR lQRt
0 2 0 4 0 6@80ulo1201u)16018)
FOR DfC RATIO OF 1.2 OR MOREAD1 - 1.0
0 20 40 60 80 lOD120140160183IIIX INKX--PERCENT K+3D) NIX INDEX--PERCENT K+3D) MIX INDEX--PERCENT K+3D)
DEPARTURE DELAY INDEX40% ARRIVALS SO!: ARRIVALS 60% ARRIVALS
: 016s8L& 0,4xL 1 FOR D/C RATIO OF 0.8 OR MORE1 I
II ““” DDI - 1.0 1 I G =0 20 40 60 80 100 120 140
0.2160 180
MIX INDEX--PERCENT K+3D)&
111’--MDDI - 1.0 s2 0.2
0 20 40 60 80 100 120 MI 160 18) 8MIX INDEX--PERCENT W3D)
0 20406080ulo1201401~~flIX INDEX--PERCENT K+3D)
FIGURE 3-84, DELAY INDICES FOR RUNWAI-USE DIAGRAM NOS,: 39,110 FOR VFK CONDITIONS,
3

AC 150/5060-S g/23/83
ARRIVAL DELAY INDEX40x ARRIVALS 50% ARRIVALS 60% ARRIVALS
f= 1.03
x 0.8g
a t r \ Ll
I
w
I 1 . - 1 . - 1
mu D/C uno O? 0 To 1.5cAD1 - 1.0
L
ct I FOR D/C -RATIO OF 1.4 OR MOREAD1 - 1.0 I I
~~ -0 2040 6080lall2o140m18) 0 20 40 60 80 lW2O140180~
MIX INDEX--PERCENT (MD) NIX INSEX-PERCENT K+fD) NIX INDEX--PERCENT K+3D)
EPARTURE DELAY IND E X60% ARRIVALS40% ARRIVALS SO% ARRIVALS
x 0.81s+ 0.6
3 0.8s2 0.6
dorii!!
1 iiiiif
0.4
&= 0.2El
FOE D/C RATIO OF 1.0 OR MDRXDo1 - 1.0
v a I a L I : _
0 20406080lamm4OKo18)MIX INDEX--PERCENT (MD)
I
20%
.z0 20406080mIp14018019)
NIX INDEX--PERCENT (MD)0 20406080m~140mm
NIX INDEX--PERCENT (MD)
huRE 3-85, DELAY INDICES FOR RUNWAY-USE DIAGRAM NOS.: 43,49,55,61 FOR WR CONDITIONS
AR40% ARRIVALS
RIWtL DELAY INDEXSax ARRIVALS 6OZ ARRIVALS
f= LO3
f0.8
FOR D/C RATIO O? 1.4 OR WREADI - 1.0
. 1 1 1 R 1 I _ ,
020406080100lpltlom18)C’lIX Irn--PERCENT K+3D)
0 20406080mIp1rl)180mRIX MM--PERCENT K+3D)
0 2040 608fmn~14018018MIX INDEX--PERCENT K+3D)
DEPARTURE DELAY INDEX40% ARRIVALS 50% ARRIVALS 60% ARRIVALS
b ! I I ., FOU D/C RATIO W 1.0 OR noRt
DDI - 1.0* IrrlAA,,
0 20406080mm1~16D~0 20406080mm1umiolmMIX INDEX--PERCENT (C+3InMIX INDEX--PERCENT (C+3D)
0 20406080mm1u)160181MIX INDEX--f'ERCEKl (MD)
0 20406080~12D140m180MX INDEX--PERCENT (MD)
Fr GURE 3-85, D E L A Y I N D I C E S F O R R U N W A Y - U S E DIAGRAM NOS.: 44-46,W52,53-58,&Z-64 FOR VFK CONDITIONS.
Chap 3
g/23/83 AC 150/5060-S
A R R I V A L D E L A Y I N D E X40% ARRIVALS 50% ARRIVALS 60% ARRIVALS
* 0.69xs 0.4w
D/C RATIO1.4 OR nom1.2 I I
ycl.0 OR LESS
MX INEX--PERCENT K+3D) NIX INIW-PERCENT (MD) HIX INDEX--PERCENT (MD)
D E P A R T U R E D E L A Y I N D E X40% ARRIVALS 50% ARRIVALS 60% ARRIVALS
0 2040 6080loo12014016018MIX INDEX--f’ERCENT (MD)
?OU D/C RATIO O? 1.0 OR MORE.DDI - 1.0
4 - ' ' ' ' A b0 2 0 4 0 6080lamo-1u)16018)
NIX INDEX--PERCENT (MD)0 20406080mlp14016Dm
MIX INKX-PERCENT (MD)
FIGURE 3-87, DELAY INDICES FOR RUNWAY-USE DIAGRAM NOS.: 59,60,65 FOR VFR CONDITIONS,
A R R I V A L D E L A Y I N D E X40% ARRIVALS 602 ARRIVALS50% ARR IVALS
c 4.
I.I
I’011 D/C RATIO OF 0 TO 1.5LAD1 - 1.0
r
.
L 1 A 40 20 40 60 80 loo I20 140160 18)
f'% INDEX--PERCENT W3D)
f= 1.0g
x 0.8xLW
s 0.8f-w 0.64W
; 0.4w
* 0.6424-l 0.45FOR D/C RATIO OF 1.2 OR MORE.
AD1 - 1.0
0 2 0 4 0 60801001201u)160~MIX INDEX--PERCENT K+3D)
-2 0.2
0 2 0 4 0 6 0 8 0 loo120140160180NIX INDEX--PERCENT (MD)
D E P A R T U R E D E L A Y I N D E X40% ARRIVALS 50% A R R I V A L S 60% ARR I VALS
t IFOR D/C RATIO OF 1.0 OR MORE
DDI - 1.0 I I 10 20 40 60 80 loo 120 140 160 180
MIX INDEX--PERCENT K+3D)0 20 4 0 60 80 lC0 120 140 160 18
"l1X INDEX--PERCENT K+3D>0 20 4 0 60 8 0 100 120 140 160 18
MIX INDEX--PERCENT K+3D)
FIGURE 5-88. D E L A Y INDId FOR RUNWAY-USE DIAGRAM NOS.: i30,81,95.( O R VFH CONDIT IONS,
chap 369

AC 150/5060-5 g/23/83
ARRIVAL DELAY INDEX = 1 .00
D E P A R T U R E DELAY INDEX40% ARRIVALS 50% ARRIVALS 60% ARRIVALS
b 20 40 60 80 lO0 120 140 l60 180MIX INDEX--PERCENT K+3D)
&o 20406080m120140160180MIX INDEX--PERCENT K+3D)
020406080~lptimtiRIX INDEX-PERCENT (MD)
: IGURE s-89, &LAY INDICE .S FOR RUNWAY-USE DIAGRAM NOS.: 83,84,98,919,102 FOR VFR CONDITIONS.
s 0.6sK-j Ot4J-g 0.2
40% ARRIVALS
0 20 40 60 80 100 l2014Ol@ll80MIX INDEX--PERCENT K+3D)
ARRIVAL DELAY I N D E X- 50% ARRIVALS
NIX INDEX--PERCENT K+3D)
60% ARRIVALSl
.
1 I . 1 1 r
FOR D/C RATIO OF 0 TO 1.5
T0 20 40 60 80 100120140180180
MIX INDEX--PERCENT W3D)
D E P A R T U R E DELAY I N D E X40% ARRIVALS 50% ARRIVALS 60% ARRIVALS
;! 20 4~ 60 80 100 120 140 ifa 18“?I:! JNDF.X- -?FRCENT K+3D)
0 20 40 6080100120140160l8iFIIX INDEX--PERCENT (MD)
0 20406080lm1201rlo160183MIX INDEX--PERCENT K+3D)
* IG;J f p;& ;E. .+.: ;NDICES F9R i<‘JNWAY-USE DIAGRAH N O S . : 1,53,54 FOR IFR CONDSTIONS.
Chap 3

12/1/95 AC 150/5060-5 CHG 3
ARRIVAL DELAY INDE% = LOO
D E P A R T U R E D E L A Y I N D E XMX ARRIVALS 50% ARR-IVALj 60% ARRIVALS
= 1.0Q
= 1.0Q
+(piJ 0.8 =is
0.8
w25
0.6 ;: 0.6
x15x
ii! 0.4 2 0.4
go2Zs 0.2
x •020406080m~l~m~~RIX !NDEx--PERCENT tc+m
0 20406080ltDlp1~180l&l~MIX INDEX--f’ERCENl CC+rO> RIX INIEX--PERCENT tc+m
FlGURE 3-91. DELAY INDICES FOR RUNWAY-USE DIAGRAM NOS. 2,3,5,9,32 - 3537 - 43,49,55,61 - 68,72.74,76,77,79,80,82-85,87089,91,92,94,95,97- 100,102 FOR IFR CONDITIONS.
.
ARRIVAL t-‘LAY INDEX = I.00
D E P A R T U R E DELAY I N D E X9% ARRIVALS
= 1.060% ARRIVALS
Ia
=E!
0.8
E:3
0.6
xu 0.4sg 0.28 *20406080Mm140150m~ 0 204060801DO1201~18018)
51X IWDEX-PERCENT K+3D) BIX INDEX-PERCfNT (MD) MX INDEX-PERCEWT (C+3D>
FIGURE 3-92. DELAY INDICES FOR RUNWAY-USE DlAGiiAM NOS. 4,75,90 FOR IFR CONDITIONS.
Chap 3

AC 150/5060-5 CHG 1 E/1/95
ARRIVAL DELAY tNDEX = I.00
DEPARTURE DELAY INDEX40% ARRIVALS SO% ARRIVALS 60% ARRIVALS
2 1.0== 0.8iii1:W* 0.6sas 0.4Z3 0.2M
BIX INDEX--PERCE?lT U33D)
FIGURE J-93. DELAY INDICES FOR RUNWAY-USE DIAGRAM NO. 7 FOR IFR CONDITIONS.
A R R I V A L D E L A Y I N D E X
= 1.03x 0.8'gw 0.6158d 0.4wQc4 0.2
0 20 40 60 80 XII 12olu) 160 i81’ 0 204060801Ixl120ltro160180 0 2 0 40 6080 llIl1201~16018)I”UX INDEX--PERCENT K+3D> MX INDEX--PERCENT (C+3D) MIX INDEX--PERCENT K+3D)
D E P A R T U R E ‘ D E L A Y I N D E X40% ARRIVALS 50% ARRIVALS
ma P/C Ufln .rF 3 33 t.53PT - : .-*
20.4, ; w._ I . ;a I ! t ’ 2 0-t k :
b! f I Z
1 ma 3/c Mm- OF 3.0 OR .!mRl! ;bc
a
2 3.2 L , 1 sI 301 - I.9 I ‘at
ki 0 20 Nl 50 80 lfll izo Ml Bl0.2.
Bl 2 01 1 t 1 t 1 + 2
20 a6030 iali2olu)~~~~0.2
0 204060801001201~160m‘lrIX !!lDEx--‘E~Cplr CCdD, 31x INDEX--wCE3T (cq) i’!IX INDEX--PERCE!lT iC+3D)
FIGURE 3-94. DELAY INDICES FOR RUNWAY&SE DIAGRAM NO. 8 FOR IFR CONDITIONS.
72 Chap 3

n/1/95 AC 150/5060-5 CHG 2
ARRfVAL OFfLAY INOEX * I.00
DEPARTURE DELAY INDEX
60% ARRIVALS
@JfTj
50X ARRIVALS
FIGURE 3.95. DEMY INDICES FOR RUNWAY-USE DIAGRAM NOS. 11,21,29,70,71 FOR IFR CONDITIONS.
ARRIVAL DELAY ItdDEX6UZ ARRIVALS4iF ARRIVALS 502 ARRIVALS
= 1.0g
= 1.03* 0.8*L-
.. . . . . . . . . . . .- . . . . . . . . .
-. I... ..- . . ‘:-I’ I
b I i ;:.;...i ..,.. -.aIf .
I I..-
- -
WC RAtw l
1.4 01 mu -I I 1.1-9/ f � - �: -
c,
II
i ’1.0 OR tus -w I
I I1 I 1 i. I L l
= 0.8HL-
= 0.8xL-* 0.6s8;;t 0.4w-3 0.2
Nix MIEX--PERCENT (C+XI)
DEPARTURE DELAY INDEXWf ARR IVALS 50X ARRIVALS 602 ARR I VALS
-+ 0.6sxw 0.4a
020406080I(lDf2o1uHfouRtX INEX--PERCENT (MD>
0 20406080lfIl~1~160mNIX MDEXG’ERCENT <C+3D)
FIGURE 3-96. DEIAY INDICES FOR RUNWAY-USE DIAGRAM NO. 12 FOR IFR CONDITIONS.
Chap 3
AC 150/5060-5 CHG 3 12/l/93
ARRIVAi DELAY INDEX = 1’.00
EPARTURE D E L A Y JN0EX5Ot A R R I V A L S 60x A R R I V A L S
g 1 . 0== 0 . 8g
= 0 . 6
2s 0.4
a
1 . 0
0 . 8
0 . 6
0 . 4
0 . 2020406080~~1uli6omNIX INDEX--PERCE?VT K+3DI
0 20406080100lp1ul160mNIX INDEX--PERCUCT K+3D)
A R R I V A L D E L A Y I N D E X4UZ A R R I V A L S Sax A R R I V A L S 602 ARRrvALs
I 1.0s
=8 0.812 0.6
I I I.
PARTURE D E L A Y I NOEX60x A R R I V A L S402 ARRlvAK 92 A R R I V A L S
2 1.0S 1 . 0
0 . 8
0 . 6iii! 0.8
ClIX INDEX--PERCENT (MD,
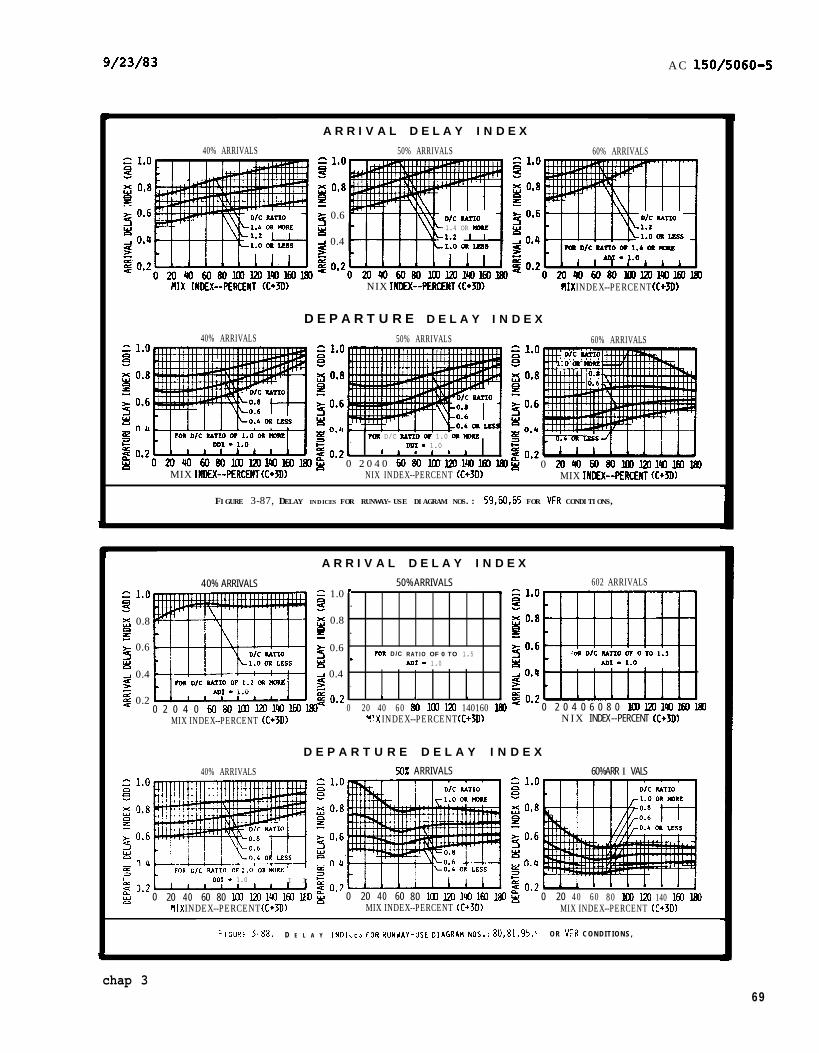
FIGURE 3-98. DELAY INOICES FOR RUNWAY-USE DIAGRAM NOS.: 15.28 FOR IFR CONOITIONS
74 -P3

g/23/83 AC 150/5060-5
c
Chap 3
s 1.0s
x 0.8p
D40% ARRIVALS
ARRIVAL DELAY INDEX = 1 .00
IOI D/C RATIO OI 1.0 OR loItDDI - 1.0
l l
0 2 0 4 0 6080lamo1~180lao51x INDEX--PERCENT (MD)
EPARTURE DELAV IN50% ARRIVALS
h 1.0%
80.8
* 0.69
0 20406080lalnmo16018)0 20406080lalnmo16018)MIX INDEX--PERCENT K+3D)MIX INDEX--PERCENT K+3D)
E X
60% ARRIVALS1.0
0.8
0.6
0.4
0.20 20406080tim140mm
11X INDEX--PERm K+3D)
FIGURE 3-99, DELAY INDICES FOR RUNWAY-USE DIAGRAM NOS.: 18,22,26,31,36,44-46,50-52,56-58 FOR IFR CONDITIONS,
40% ARRIVALS 50% ARRIVALS1.0
0.8
0.6
004
0.2
ARRIVAL PELAV INDEX I 1.00
0 2 0 4 0 6080mlzo140160180~MIX INDEX--PERCENT K+3D)
PARTURE DELAY IN
0 20 40 6080lamo14016D180MIX INDEX--PERCENT K+3D)
DEX60% ARRIVALS
020406080100m140180mMIX INDEX--PERCENT K+3D)
FIGURE 3-100, DELAY INDICES FOR RUNWAY-USE DIAGRAM NOS.: 19,23 FOR IFK CONDITIONS.
75

AC 150/5060-5 g/23/83
.
ARRIVAL DELAY IN-X = 1.00
DEPARTURE DELAY INDEX40% ARRIVALS 50% ARRIVALS 60% ARRIVALS
z1 1.08
2E 0.8
* 0.6sE## 0.4s3 0.2led
MIX INDEX--PERCENT K+3D) MIX INDEX--PERCENT (MD) MIX INDEX--PERCENT K+3D).
FIGURE 3-101, DELAY INDICES FOR RUNWAY-USE DlAGRAM No%: 78,81,86,93,96,101 FOR IFR CONDITIONS,
ARRIVAL DELAY INDEX50% ARRIVALS 60% ARRIVALS
r; 1.0s
=8 0.8LWw 096si!!!.& 0@4wzs o . 2
0 20 40 6080 lfW2OlUI16018)MIX INDEX--PERCENT K+3D) NIX INDEX--PERCENT <MD> MIX INDEX--PERCE?jl tC+3D>
DEPARTURE DELAY INDEX
F&j 0.4 L& 0.4
3 0.2z
x 0s 0.2
z
2 0 4 0 6080loo12010l6o180~ 02 0.2
0 204060801001201401601%)MIX INDEX--PERCENT (MD)
20406080laJ120140160181~MIX INDEX--PERCENT K+3D) MCX INDEX--PERCENT W3D)
FIGURE j-102, &LAY INDICES FOR HUNYAY-USE. DIAGHAPI NOS.: Q/,U,b9,60 1 OR IFR C O N D I T I O N S ,
-Chap 3

g/23/83
CHAPTER 4. SPECIAL APPLICATIONS
AC 150/5060-S
4-l. GENERAL. This chapter provides calculations of runway capacity for situationsinvolving PVC conditions, the absence of radar coverage and/or II& and airportswith one runway or a runway restricted to small aircraft. Appendix 3 containsexamples of these calculationsk
4-2. PVC CONDITIONS. Runway hourly capacity in PVC conditions is reduced byincreased in-trail separations of approaches and departures and increased runwayoccupancy times. Calculate PVC runway component hourly capacity as follows:
a. Select the runway-use configuration in figure 4-1 which best representsthe airport and identify the'figure number for determining capacity in PVC condi-tions, To adjust for staggered thresholds, see paragraph 4-6.
b 0 Determine the percent of class C and D aircraft and calculate the mixindex.
c. Determine the percent arrivals.
d Determine the runway hourly capacity from the figure identified inparagraih b above.
4-3. ABSENCE OF RADAR COVERAGE OR ILS. mcept for single runway airports usedalmost exclusively by class A and B aircraft (which are covered in paragraph 4-5),calculate the hourly capacity of the runway component in the absence of radarcoverage or ILS as follows:
a. Select the runway-use configuration in figure 4-1 which best representsthe airport and identify the figure number for determining capacity with an inopera-tive navaid.
b Determine whether the radar or the ILS is operative and determine whethera straiiht-in or a circling approach is authorized.
c. Determine the percent of class C and D aircraft and calculate the mixindex.
d htermine the runway hakly capacity from the figure identified inparagraph b above.
4-4. PARALLEL RUNWAY AIRPORTS WITH ONE RUNWAYRESTRI~EDTOUSEBYSM&LAIRCRAFT.Calculate the hourly capacity of a parallel runway configuration when one of therunways is unable to accommodate class C and D aircraft as follows:
a. Select the runway-use configuration in figure 4-1 which best representsthe airport and identify the figure number for determining capacity in restrictedrunway use. To adjust for staggered thresholds, see paragraph 4-6.
b. Determine the percent of class C and D aircraft and calculate the mixindex.
c. Determine the percent arrivals.
Chap 4Para 4-1

AC 150/5060-5 g/23/83
e. Determine the runway hourly capacity from the figure identified inparagraph b above.
4-5. SINGLE RUNWAY AIRPORT--SNRLL AIRCRAFT ONLY. Calculate the capacity of a smallairport used almost exclusively by Class A and B aircraft without radar coverage orILS as follows:
a. Conditions.
(1) The airport is used almost exclusively by Class A and B aircraft.
(2) The airport does not have radar coverge or an ILS, but it has anapproved approach procedure.
(3) Arrivals equal departures.
(4) There are no airspace limitations affecting runway use.
b 0 Capacity Calculations.
(1) Select the airport configuration from figure 4-26 that best repre-sents the airport.
(2), Determine the percent of touch-and-go operations.
(3) Ibead the range of hourly VFR and IFR capacities from figure 4-26.
4-6. THRESHOLD STAGGER. FM ATC procedures permit simultanears departures andsimultaneous departure--arrival operations on parallel runways spaced 2,500 feetapart with even thresholds and at lesser/greater separations if the thresholds arestaggered. When thresholds are staggered 8 the equivalent unstaggered separation iscalculated increasing or decreasing the actual separation depending upon whether thearriving aircraft is approaching the near’ or faic threshold. ‘Stagger adjustments areonly applicable when the parallel runway separations that are at least 1000 feetapart and less than 4300 feet apart.
a. Calculation.
(1) If the approaches are to the near threshold and the separation isless than 4299 feet, the equivalent separation is the actual separation increased by100 feet for each 500 feet of threshold stagger up to a maximum of 4299 feet.
(2) If the approaches are to the far threshold and the -paration isgreater than 1000 feet, the equivalent separation iS the actual separartiondecreased by 100 feet for each 500 feet of threshold stagger down to a minimum of703 feet..
18cm@4mr 4-4

g/23/83 AC 150/5060-s
brunway&e
Application. Apply the equivalent separation to determine which parallelconfiguration to use. Note: the calculation for equivalency need only
determine whether the equivalent runway separation is 2500 feet or greater or 2499feet .or less.
c. Examples.
case 1. Staggered thresholds, approaches to near threshold,
L+- 1000 feet m-----wj 24b0 feet
(1000/500)~2 - 200Separation for equivalency is increased by 200 feet2400 + 200 - 2600 feet
case 2. Staggered thresholds, approaches to far threshold.
LlOOO f e e t 41 2500 feet
(-1000/500)~2 - -200Sepatation for equivalency is decreased by 200 feet2500 - 200 - 2300 feet
-P4Parra I-6 79 .

AC 150/5060-S g/23/83
w Figure No. for CapacityPoor 0 Restricted
Diagi Runway Spacing Visibility Inoperative Runway-useRunway-use Diagram No. L(S) in feet Conditions Navaidsk 1 IFR
*+ + l- NA 49 2 4-15 - -.
b 6 2a 700 to 2499 4- 3S ' I 4-16 - -b + 2b 2500 or more 4- 4 1m+ + b 3 700 to 2499 4- 3 4-16 - -
s *I 4 2500 or more 4- 5
tl ++ I 6 5 2500 700 to to 2499 2999 4- I- 3 6I I 4-16 - -S 7 I. 3000 to 4299 1
+ 4 4300 or more ’ 4- 8
+ + c 9 700 to 2499 4- 310 2500 to 2999 a- 9 4-17 ' 4-21s '1 4-1611 3000 to
t )t' 12 4300 or4299 4-10 4-18
.more 4-11 4-224
t) +t;
+ c 4-28 : 2500 to 3499 4-23
- - 4-193500 or more 4-24
3500 or more - -' 4-20 4-25. /
% A 43646 Oto 1999 0 4-12 11 i--w % Y + :*-j 44647 45648 5000 2000 8000 4999 to to : 8000 to i 4-13 4-14 4-15 - -1
% A 49C52 0 1999 to 0I !
4-12
Y<% ty-f % + : SO&53 5lc54 2000 5000 4999 8000 to to
Ito 1 4-14 4-13
c = 700' to 2499'+ = Type of operation that can 0ccuIc.
- - wlmmy used only w A and B aircraft.
IFigure 4-l. Special application8

g/23/83 Ac 150/5060-S
CAPACITY IN PVC
loo -loo - 11
II . .. .
1 /+PERCHCT ARR1W.S-PERCENT ARRIVALS
1
I1 1 1
0, L I 100 20 40 60 80100i2014016016020 40 60 80100i20140160180
MIX Irn - PERCENT K+3D)
FIGURE G--2, HO U R L Y CAQAC I T Y O F RUNWAYTUSEDIAGRAM NO. 1,
CAPACITY IN PVC
I .: .
1 APERCENT ARRI ‘VMS
~ ~~~F I GURE 4-4, HOURLY CAPAC jfY OF RUNWAY-USE
DIAGRAM NO, 2s.
h e
CAPACITY IN PVC
90
MIX INDEX -- PERCENT K+3D)
IFIGURE 4-3, HOURLY CAPACI TV OF RUNWAY-USE
DIAGRAM NOS. 2A, 3, 5, 9,
4
.CAPACITY IN PVC
NIX INEX -- PERcENr (MD)
I 1~IGUM 4-5. HOURLY CAPACITY OF RUNUAY-USE
DIAGRAM NO. 4./
Chap 4

AC, 150/5060-S g/23/83
CAPACITY IN PVC
100
90IVALS
8 0
2 70
i=s-a 60s4 ow
* Pd rs dM
z!2 30
2Ol
10 ’
0, *0 20 40 60 80 loo 120 140 160 180
MIX IEX -- PERCEKT K+3D)
F I G U R E 4-5, HOURLY C A P A C I T Y OF RUNWAY-USEDIAGRAM NO, 6,
CAPACITY IN PVC
NIX IMEX -- PERCENT K+3D)
FIGURE 4-8, HOURLY CAPACITY OF RUNWAY-USE
DIAGRAM NO, 8,
CAPACITY IN PVC
10
‘0, 1 A I I 10 20 40 60 80 100 120 140 160 180
NIX INDEX -- PERCENT K+3D)
FIGURE 4-7, HOURLY CAPACITY OF RUNWAY-USEDIAGRAM NO. 7,
CAPACITY IN PVC
.FIGURE q-9, HOURLY CAPACITY OF RUNWAY-USC
DIAGRAM NO. 10,

g/23/83 AC 150/5060-S
m
l
ha
CAPACITY IN PVC
60I
4&302010
0, 1 A0 20 40 60 80 loo 120 140 160180
NIX INMX -- PERCENT (MD)
FIGURE 4-10, HOURLY CAPACITY OF RUNWAY-USEDIAGRAM No. 11,
CAPACITY INPVC
20,020
.40 60 80 100 l20 140 160 la
NIX 1m -- PERCENT K+3D)I
FIGURE 4-L HOURLY CAPACITY OF RUNWAY-USEDIAGRAM itO. 12,’
CAPACITY IN PVC
IV&S
0 20 40 60 80 loo 120 140 160 180MIX mu -- PERCENT (C+3D)
FIGURE+-12. HOURLY CAPACITY OF RUNWAY-USEDIAGRAM NOS. 43, 45, 49, 52,
/k
CAPACITY IN PVC
IVALS
0 40 60 80 loo 120 143 160 180MIX INDEX -- PERCENT K+3Dl
LFIGURE 4-13, HOURLY CAPAC I TY OF RUNWAY-USF.
DIAGRAM NOS. 44, 47, 50, 53,
a3(-P 4

AC 150/5060-S g/23/83 ’
CAPACITY IN PVC
I MIX INDEX -- PERCENT UMD)I
I FIGURE 4-14. HOURLY CAPACITY OF RUNWAY-USEDIACRAH N O S . 45, 48, 51, 54, I
Chap 4

9123183 AC 150/5060-S
FIGURE A3-2A.HOURLY CAPACITY IN RADAR ENVIRONMENT
too* 7 d
901 . 1 . .
- CTMIGHT-IN APPROACH80
2 70ES2 % 6os itis325%s 6 40
%- 30
FIGURE AJ-2B 8HOURLY CAPACITY IN NONRADAR ENVIRMKNT
lOO* 7 . l
,
901 \
* SlRAI6HT-IN APPROACW80 1
,20
10
Oo 11 20 40 11 60 80 11 100 120 11 140 160 1 180 I
MIX INDEX -- PERCENT (MD> nrx INDEX. -- PERCENT (MD)
F 1 GURE 4-15, HOURLY CAPACITY OF RUNWAY-USE DIAGRAM NOS. 1, 43-54,
FIGURE AE3A oHOURLY CAPACITY IN RADAR ENVIRONRENt
FIGURE A3-3B,HOURLY CAPACITY IN NONRADAR ENVIROMENT
lOO* 7 9
r 1. .- - StRA I WI’- SN APPROACH
8oL L .
I I
0 20 40 80 100 120 140 160 180 01 ‘01 I I
20 40 6 0 801om2o140160180’NIX INDEX -- PERCENT (MD) I’lIX INDEX -- PERCENT K+3Dl
FIGURE 4-l:. HOURLY CAPACITY OF RUNWAY-USE DIAGRAM NOS. 2A, 2B, 3-12,
Chap 4

AC 150/5060-S g/23/83
RUNWAY ESTRICTED USE IN VfR
VALS
FIGURE 4-17, HOURLY CAPACITY OF RUNWAY-USEDIAGRAM NO. 9,
RUNWAY RESTRICTED USE IN VFR
60,
304 i0 20 40 60 80 100 120.140(160‘180
MIX INDEX -- PERCENT (MD)
VALS
FIGURE 4-19, HOURLY CAPACITY OF RUNYAY-USE
DIAGRM NO% 28, 2%
RUNWAY RESTRICTED USE IN VFR
RUNWAY RESTRICTED USE IN VFR
MIX INDEX -- PERCENT K+3D)

g/23/83 &c 150/5060-S
1
RUNWAY RESTRICTED USE IN IFR
.oot *l m19ok I I (
I 1r-PERCENT ARRIV-PERCENT ARRIV
40 -I 1
10 1
04ol 1 1 ’1 A I ,’ 1 ’ J00 2020 4040 6060 8010080100 120140160180120140160180
, MIX INDEX-- PERCENT K+3D)
‘ALS
FIGURE 4-21, HOURLY CAPACITY OF RUNWAY-USE
DIAGRAM NOS. 9, 10, 11,
RUMAY RESTRICTED USE IN IFR
- PERCENT ARRIVALS
k ,
-if
s 30,nn
al 1 I I I 1 1 1 1 10 20 40 60 80100120140160180
MIX INDEX -- PERCENT K+3D)
FIGURE 4-23, HOURLY CAPACITY OF RUNWAY-USEDIAGRAM NO. 28,
Chap 4
RUNWAY RESTRICTED USE IN IFR
200, .
180 I 3-PERCENT ARRIVALS
MIX INDEX -- PERCENT K+3D)
FIGURE 4-22, HOURLY CAPAC I TY OF RUNWAY-USE
\ DIAGRAM NOti 12./\
RUNWAY RESTRICTED USE Ifi IFR
f VALS
0 20 40 60 80 100 120 140 160 180MIX INDEX -- PERCENT K+3D)
IFIGURE 4-24. qOURLY CAPACITY W RUNWAY-USE
DIAGRAM NO. 2%.I
83

HOURLY CAPACITY(OPERATIONS PER HOUR)

g/23/83 AC 150/5060-5
CONFIG,HOURLY CAPACITY IN VFR HOURLYI
No,AIRFIELD CONFIGURATION PERCENT TOUCH-AND-GO CAPAC ITY. 1
0 TO 25 26 TO 50 IN IFR -I
;y ;F A?
( OPERATIONS PER HOUR )
l 54 TO 66 66 TO 85 20 TO 24
2 'T 'T LT LT 591072 '72~092 20~024
3 iA& LAA Lq 40 TO 50 50 TO 67 20 TO 24
4 IL? cT r! 82 TO 97 97 TO 117 20 TO 24
5 77 71 TO 85 85 TO lO6 20 TO 24B
6 '3 'T LT 60 TO 72 72 TO 92 20 TO 24
clB BASING AREA
DIRECTION OF OFWWIONw TURNAR0UND
Figure 4-26. Huxly capacity of single runway airports, without radar coverage01: US, serving small aircraft only.
Chap 489 (and 90)

I
IIIIIIIIIIIIIIIIIIIIIIIIIIIIIIIIIIIIIIIII1IIIIIIIII
121 l/95 AC 150/5060-5 CHG 2
CHAPTER 5. COMPUTER PROGRAMS FOR AIRPORT CAPACITY AND AIRCRAFT DELAY
S-1. GENERAL. This chapter identifies computer models for determinin g airport capacity, aircraft deiay, and thesensitivity of a proposed physical/operational change to an airport or air t&c procedure.
5-2 SIMULATION MODEL (STMMODJ SIMMOD is a simulation model used by &e FM, airlines, airports,a&item, and engineers to design airport impiovements, calculate travel times and flow rates for an airport or an &portcomponent, and/or devefop procedural alternatives for domestic and international air traffic management, in&&g theadjacent airspace. Specific applications of the SIMMOD mode1 range from studies of a single runway airport with itsnetwork of taxiway and gates, to studies of terminal areas having multiple airports with complex airspace routings.
a. SIMMODaddresses both the physical design and procedural aspects of all air traffic operations, allowingdecision-makers to determine projected benefits and impacts in terms of airport capacity and in aircraft travel time, delay,and fuel consumption. The model incorporates the FAA’s Integrated Noise Model (INM) as a post-processing function,alIowing us& to determine the impact of aircraft noise in the-planning process. SIMMOD is available in two versionswhich include magnetic media, manuals, and all required software licenses and libraries. The Summagraphics MG-364836”~ 48” or Summagraphics Professional 12”~ 18” digitizer, and CAD/CAM (Autocad) are recommended for data input-.and optional display.
.
(1) SIMMOD Version 1 .2 for 386125 IBM compatible microcomputers with 80387 math coprocessors,4 MB RAM, 80 MB hard disk, 1.2 LMB (5.25”) or 1.44 MB (3.5”) floppy disk drive, VGA graphics system (board andmonitor), Mouse (Microsoft-compatible), and a Epson/HP Lasejet or compatible printer. DOS 3. I or higher (DOS 4.0is not recommended) or OS/2. .
(2) SIMIUOD Version 2.1 operates on SUN Spare and HP9000/700 series computers. Parts of this versionoperate on IBM RS6000 machines having 32 MB RAM and 1.2 GB Hard drives.
b . Model Source. The SIMMOD model and information on the model may be obtained from:
FAA, Program Analysis ad Operations Research (ASD-400)800 Independence Avenue SWWashington, D.C. 20591.Telephone number (202) 358-5225Internet Address: http://www .orlab. faa.gov/homepage.html
5 3 DPORT MOD& This model is a general purpose airport simulation that can be used for any airport. Itr&&es a DOS platform and-can produce animated graphic output. The input data include phy&ai airfield layout, ATCrules and procedures, and aircraft performance characteristics. The input can also be modified in a user interface mode.Either actual or randomly-generated flight schedules can be used to drive the model. Among the unique features of theAirport Machine are detailed landing deceleration modeling, deceleration and exit selection, spacing of arrivals to allowrunway crossing, controlled departure queuing, and user interface to allow optimization of outcomes. Information on thismodel may be obtained from:
FAA Technical Center, Atm: Mr. John Vander VeerAviation System Analysis and Modeling Branch (ACT-520A)Atlantic City International Airport, N. J. 08405Telephone number (609) 485-5645
54 . AIRFIELD DELAY SIMULATION MODEL (ADSIM). ADSIM is a discrete-event simulation model thatcalculates travel time, delay and flow rate. It may also be used to analyze the components of an airport, airport operations,and operations in the adjacent airspace. The model implements the Monte Carlo sampling techniques. The procedurallogic and physical network are used to simulate traffic using a series of probabilistic parameters such as gate service time,arrival runway separation time and may others. The output enables users to generate performance data based on hourly
Chap 5Par 5-l 91
AC 150/5060-5 CHG 2 12f l/95
IIIIIIIIIIIIIIIIIIIIIIIIIIIII
flow rates, delays encountered on different routes, travei time, and others.
5-5. Am-D CAPACITY MOD& This upgraded FAA Airfield Capacity Model is a computer program whichanalytically calcuiates themaximum operational capacity 0f.a runway system under a wide range of conditions. The mode1user has considerable tieedom to vary the parameters of the computation, such as number and usage of runways, aircraftmix and speeds, and the characteristics of the ATC system.
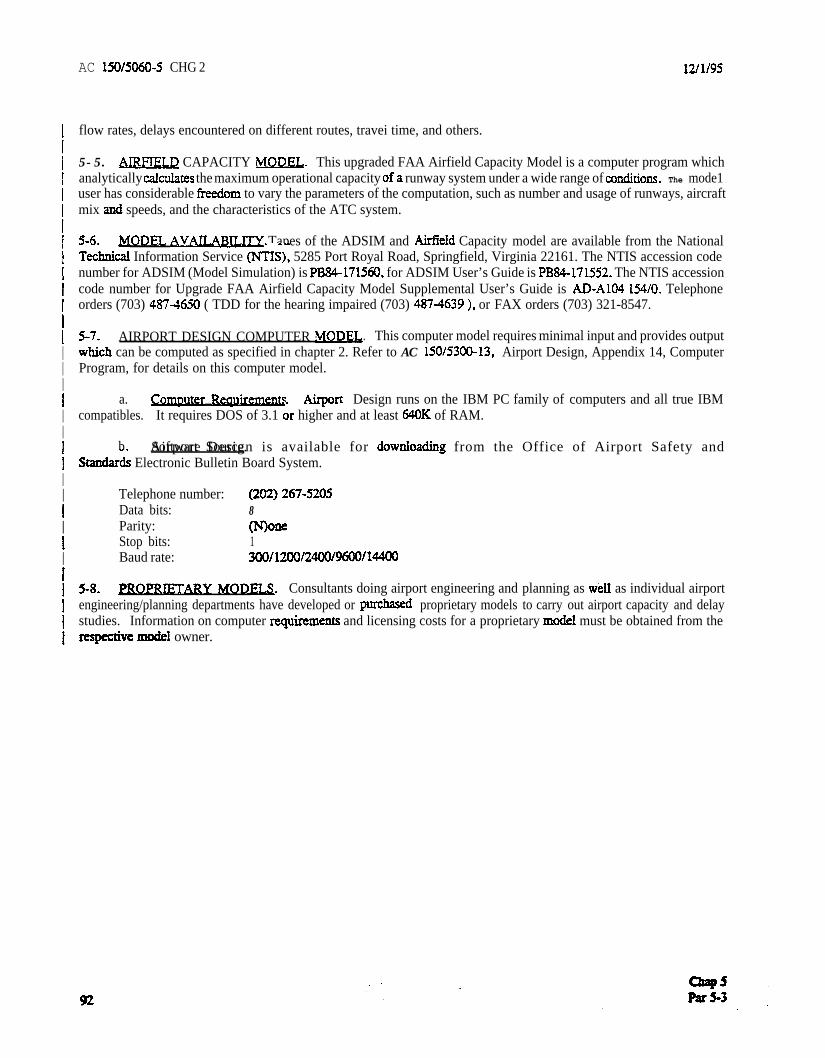
5-6 MODEL AVWTY Tapes of the ADSIM and Airfieid Capacity model are available from the NationalTe&ical Information Service (NY&), 5285 Port Royal Road, Springfield, Virginia 22161. The NTIS accession codenumber for ADSIM (Model Simulation) is PB84-171560, for ADSIM User’s Guide is PB84-171552. The NTIS accessioncode number for Upgrade FAA Airfield Capacity Model Supplemental User’s Guide is AD-Al04 154/O. Telephoneorders (703) 487-4650 ( TDD for the hearing impaired (703) 4874639 ), or FAX orders (703) 321-8547.
5-7 AIRPORT DESIGN COMPUTER MOD&. This computer model requires minimal input and provides outputwGch can be computed as specified in chapter 2. Refer to AC 150/53OO-13, Airport Design, Appendix 14, ComputerProgram, for details on this computer model.
.a. Computer Reqyrements Airport Design runs on the IBM PC family of computers and all true IBMcompatibles. It requires DOS of 3.1 or higher and at least 64OK of RAM.
b Airport Design is available for downIoading from the Office of Airport Safety andSoftware Source.Standard Electronic Bulletin Board System.
Telephone number: (202)267-5205Data bits: 8Parity: (Wo=Stop bits: 1Baud rate: 300/1200/2400~9600/14400
S-8. PROPmT@kY MOD=. Consultants doing airport engineering and planning as welI as individual airportengineering/planning departments have developed or purchased proprietary models to carry out airport capacity and delaystudies. Information on computer reqyirements and licensing costs for a proprietary nwciel must be obtained from therespeaive Hm&l owner.

12f If95 AC 150/5060-5 CHG 2’ Appendix1
APPENDIX 1. ELXAMPLE A-PLYING CHAPTER 2 CALCULATIONS
1. YERQI The e,xampies in this appendix iksuate applications of chapter 2 capacity ad delay c&ddom witiportions of the appropriate tables and figures of chapter 2 reproduced in the examples. The work sheers provided inappendix 5 are used to record data.
2 .# DAPPLES. The following four esamples illustrate the progressive calculations of chapter 3,.
a. Exarr@eS.
(1)
(2)
(3)
I (4)
Calculate existing runway capacity (figure Al-l).
Identify airport improvemen& to accommodate demand (figure AM).
Determine annual delay (figure Al-3).
Calculate potential savings associ.ted with reduced delay (figure AM).
b . The following data is given for the four examples.Data.
(I) The airport has a single runway wirh a full length parallel taxiway and entrance-exit taxiways. Allrequired navigational and air traffic aids exists, or will exist, and there are no foreseeable airspace limitations.
(2) The airport has a forecast demand of 3XI,ooO annual operations by the year 2000. The demand consistsof 41 percent small aircraft (one half of these are single engine), 55 percent large aircraft, and 4 percent heavy aircraft.Air carrier operations predominate and touch-and-go operations are nominal.
AC 150/5060-5 CHG 2Appendix f
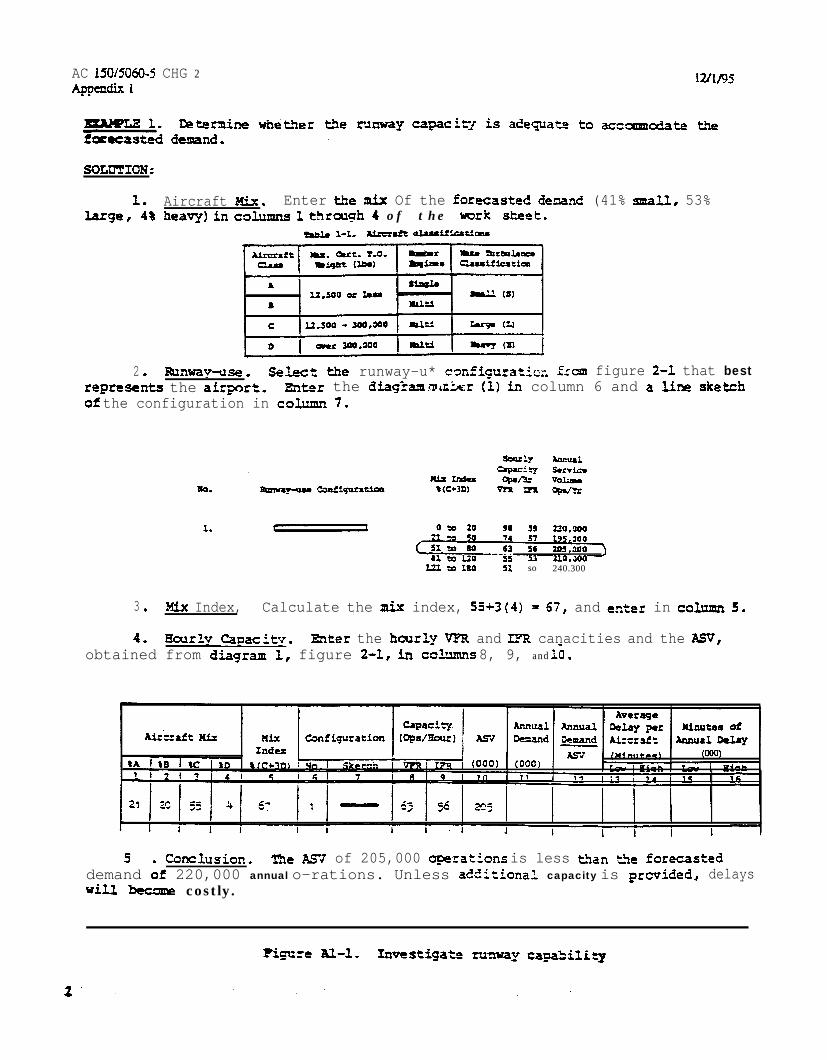
1large, i%
2 0
Aircraft Mix. Enter the mix Of the fotecasted deraand (41% mall, 53%heavy) in cam 1 tiwaxgh 4 of the work sheet.
Rmway-use. Sehct the runway-u* Ercm figure 2-l that bestrepmsents the air;?ort. Enter the diag’bm .mtixr (I) in column 6 and a lim sketchof the configuration in c~fvmn 7,
33 220,30051 so 240.300
3 0 Mix Index, Calculate the mix index, 55+3(4)- = 67, and entez in cok,zmxz 5,,
4. aa;lrly Cmacity. Enter the hazzly VFR and m canacities and the Asv,obtained from diagram 1, figure 201~ in cdxntnrunng 8, 9, and lo.
5 conclusfon. me AS? of 205,000 ~prations is less L%an tie forecasteddemand if 220,000 annual o-rations. Unless additionaL capacity is gmvided., delaysWiJJ Mane costly.

9/23/w AC 150/5060-S4PP-d~ 1
ExA#QLB 2. Ibrantple 1 cowluded that the Asv of 205,000 opmations is less than theforecasted 220,000 operational demand. Identify alternative. two-runway configura-tiorm that will accoaplnodate the demand,
1 Capacity of Alternatives. &peat each of the calculations of example 1for eaci; of the two-runway configurations.
- -a - - bm@rn '"z8 st. - .a m so m am,w l Y ab w 88 a3b.w
2 . Canclusion. The parallel runway-use configuration (a), which meets theseparation requiremnts for siPrUltaneaus instrument approaches, provides the bestVFR and IFR hourly capacities and ASK Any of the parallel runway-use configura-tions as -11 au the diverging runway-use configuration met the forecasted*demnd.SMB croming and conmrging runway-use configurations have less capacity than thefmecasted demand.
Figure JU-2. Identify two-runway configurations

AC 150/5060;5 g/23/83Appendi%l
mcABQLB 3. What annual delay is anticipated fa the existing and emb-of the alter-native runway-use con&urations?
SOLUTION% The follmving calculations axe for the eacistizg single rummy-use con-figuration are repeated for each of me alternative zwway-uae configurations.
1. AnnualDemand Enter 220,000 (uperatio@a in column 11.
2. &mand-ASV Ratios. Divide the annualcoll&unn 120
220/205 - 1.07
3. Average Aircraft Delay. Obtain thehigh and law average &lays pet aircraft fromfigure 2-2 and enter. in columns 13 and 14.
4 . Annual Delay. Cal&date annualdelay and entet results in columns 15. and 16.
3.5 x 220,000 - 770,000 minutes5.8 x 220,000 - 1,276,OOO minutes
by the ASVandentez in
5 0 collusions. Amrage &lay perr aircraft ad annualtilrrp with prtallhltunaray-use configuration8 are dgnificantly le88 tb8n with say of tba tit mummy-u= =mfigumtian8,

12/l/95 AC 150/5060-S CHG 2~Appendix 1
. 1I
EXAMPLE J- MU savings CXI be realized from the reduced delay axxicipami k e,mple 3 when going from runway-ecoxlfi~tion 1 to 3.
I1 SOLUTION:II1
1. Ailocxe &ace. Distribute aircrafi classes used for the capacity calculations (21% A, 20% 8, 55% C, a,&
I4,s D) among the airpon’s diiferent types of aircraft and users.
IIIIIIIIIIIIIIII1IIIIIIIIIIIIIII
For this exarqls the 21% A is distributed as follows:6 % smaI,I a i r c r a f t 'havizq 1-3 seats (GA),
12% small aircraft haviq 4+ seats (GA) I and3% smaII aircraft haviq 4+ seats (AT)
Comparable distributions are made for the other aircraft classifications.
2 Wculate Aversee Cost Per Minute. Using tie defay costs provided in figure u-12, cddae he avenge deievcost a&&ted to each type of aircraft.
.
NOTE: Other delay costs mav be used.the rationale for the costs u&d.
When other de!ay costs are used, identify the source of their delay costs or e,splain
Class A l-3 s e a t s 0.06 x 0.50 = 0.0364+ s e a t s (GA) 0.12 x 1.00 = 0.1204i seats. (AT) 0 . 0 3 x ID.80 = 0 . 0 5 4
NOTE: Similar calculations are made for the other aircraft classes and users.
. .3sthe potendal savings.
avi 0 . Subtract projected minures of future delay from current estimates of delay to establishUse both the low and high range from figure AL3.
Current Delay (000 Minutes) 770 LOW 1,276 EfighProjected Delay (000 Minutes) 209 ‘J 319 ”Potmtial Savings (000 Minutes) 561 ” 957 ”
4. In this e,xam$le, the projected benefit of reduced delay is calcuhted co range fkom a low of S7,610,000Sava.to a high of S12,982,000.
NOTE: Savingi in this e,sampIe do not include purchase or replacement costs of the airplane, airport fees, and otherincidental costs incurred by an airline or by an airplane owm. Nor does the example attempt to include the benefits topassengers of reductions in flight defavs..
Figure Al4 Savings associated with reduced delay
5

AC 150/5060-5 CHG 2Amendix 1
121 l/96
Aircraft Percent ofAircraft
DolfarsMinute
Averagecost
Class A12.5OOPounds or lessSingle Engine
1-3 Seats 6 0.60 0.036
4 + Seats (GA) 12 1.00 0.1201 I
1 4 + Seats (AT) I 3 I 1.80 1 0.054
CIass B12.5OOPounds or lessMulti Etigine
Piston Twin (GA)
Piston Twin (AT)
Turbine Twin (GA)
8 2.50 0.200
4 3.70 0.148
5.20
Turbine Twin (AT) 8 6.80 0.544
CIass C Piston Engine (GA) 2.80 -12SOOt0 3OO,OOOPounds .
Piston Engine (AT) 2 4.00 0.080
Piscon Engine (AC) 2.90~-Turbine Twin (GA) 2 5.60 0.112
Turbine Twin (A?? 5 7.30 0.365
Turbze Twin (AC) 6 6.60 0.396
Turbine Four (AC) 1s. 10
2 Engine Jet (AT)
I I ICIass DOver 3OO,OOOPounds
-4 2 Engine Jet (AC) 4 39.00 1.560
3 Engine Jet (AC) - 57.60
Helicopters
~ ~~ T
4 Engine Jet (AC) 79.30
Piston (GA) 1.40
Pismn (AT) 2.30
Turbine (GA)LTurbine (AT)
~~- 3.30
- 4.40 -
Totals I 100 I r 13.565
(GA) General Aviation (AT) Air Taxi (AC) Air Carrier
LOW High
Current Deiay (OOO Minutes) I 770 1 I ,276I ‘I
Projected Deiay (OOO Minutes) I x9 II
Potential Savings (OOO Minutes)
Average cost Per Mimm
I 361 957I II
I 13.565 1 13.563 11
Projected Benefit Per Year (OOO D&lars) I 7,610 1 12.982
Figure Al-4 Savings associated with reduced delay (cont.)6

g/23/83 AC 150/5069-5Appendix2
. APPENDIX 2. IMAMPW APPLYING cHAP!mR 3 CAL~TIONS
1 . GENERAL. The examples in this appendix illustrate applications of chapter 3capacity and delay calculations with portions of the approptiate tables and figuresof chapter 3 reproduced in the examples. The work sheets provided in appendix 5 areused to record data.
2 0 ElKAMP=. Ten examples, figures M-1 through A2-lOI illustrate the progressivecalculations of chapter 3.
a. mamples.
(1) Harrly capacity of the runway ca8ponent (figure M-1).
(2) Hourly capacity of the taxiway canponent (figure A2-2).
(3) Hourly capacity of gate group cmpments (figure u-3),
(4) Airport hourly capacity (figure A2-4).
(5) Annual service voluzae (figure A2-5),
(6) Hourly delay to aircraft on the runway component (figure A206).
(7) Daily de&y to aircraft an the runway component when the D/C ratio is1.0 or less fog each hour (figure A2-7),
(8) Daily delay to aircraft an the runway component when the D/C ratio isgreater than 1.0 for one or 1Iyllte hours (figure M-8).
(9) Annual delay to aircraft on the rummy canponent (figure A2-9),
(10) Hamly demand corresponding to a specified Level of average haarlydelay (figure A2-10).
b 0 Data.statenmnE7
bata mcessary to solve each example is prmided in the fntroductoryTb the extent practical, results fraa cme example axe used in subsequent
examples.
1
AC 150/5060-5 g/23/83Appendix2
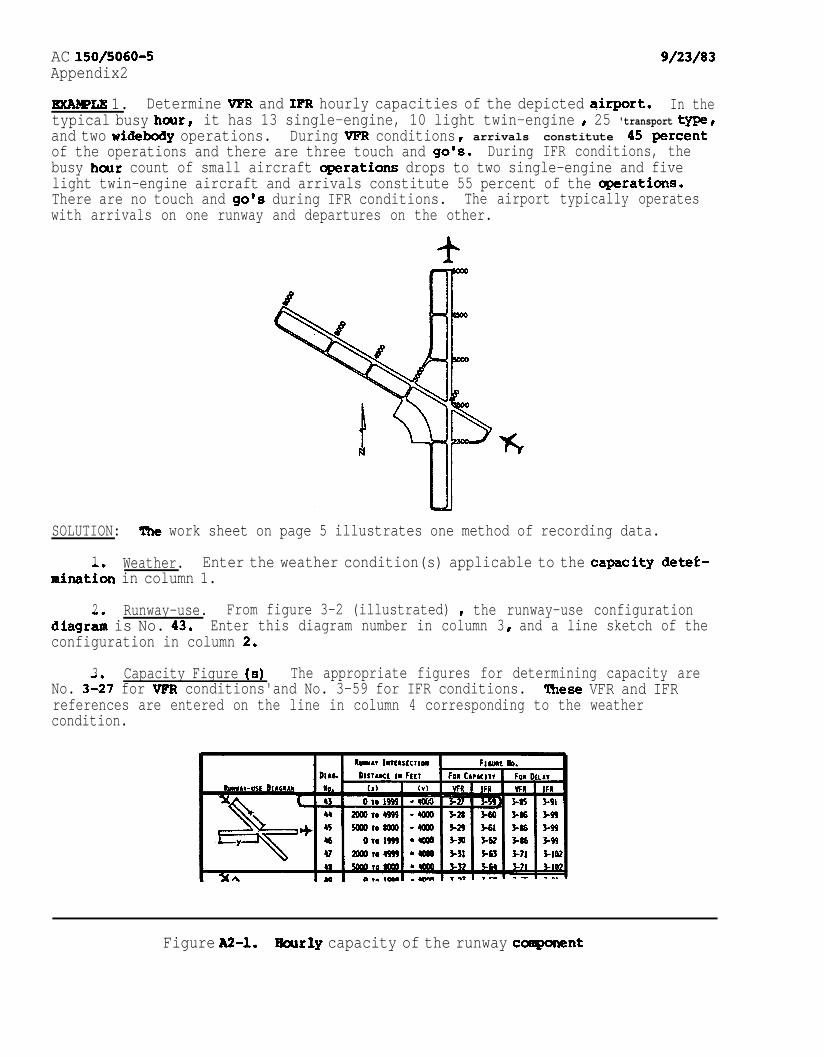
EICAIQLE 1. Determine VFR and IFR hourly capacities of the depicted a$rport. In thetypical busy hour8 it has 13 single-engine, 10 light twin-engine 8 25 'transport type8and two widebody operations. During VFR conditions 8 arrivals constitute 85 percentof the operations and there are three touch and go%. During IFR conditions, thebusy ham count of small aircraft -rations drops to two single-engine and fivelight twin-engine aircraft and arrivals constitute 55 percent of the ape-rations.There are no touch and go's during IFR conditions. The airport typically operateswith arrivals on one runway and departures on the other.
SOLUTION: The work sheet on page 5 illustrates one method of recording data.
1 Weather. Enter the weather condition(s) applicable to the capacity.detet-mination in column 1.
2 Runway-use.diagrai is No. 43,
From figure 3-2 (illustrated) 8 the runway-use configurationEnter this diagram number in column 3 I and a line sketch of the
configuration in column 2.
3 Capacity Figure (8) The appropriate figures for determining capacity areNo. 3-27 for VFR conditions'and No. 3-59 for IFR conditions. These VFR and IFRreferences are entered on the line in column 4 corresponding to the weather 'condition.
Figure A2-1. Hamly capacity of the runway caqpnent

g/23/83 AC 150/5060-SAppendix 2
4 Mix Index.state&t.
This input is calculated using data prmided in the exampleTable 1-1 (illustrated) is used to make the conversion.
Table l-l. Ahcraft clauiflcatioru
ham Cest. T.O.might (UN)
C 12,500 - 300,000 halti L=9@ (t)L
D wet 300,000 nati fliaqr (a)
The computation of aircraft mix is carried out by setting up a table in the follow-ing format. The percent of operations by each aircraft class is recorded in columns .5 through 8.
Aircraft1
VFRMiJc IFR MixL I
I I
Description Class No. ops. 8 ops. No. ops. Bops. '1. L, , I
Single-engined A 13 26 2 6 11Light-twins B 10 20 5 15
w, fTransport-type C 25 50 25 73
- 1Widebodied D 2 4 2 6
ITotals (No. Ops. bi % @so) 50 I 100 I 34 100 J
The mix indices are calculated and entered in column 9.
m - 50+3(4) - 62
IFR - 73+3(6) - 91
5 Percent Arrivals.and 55'for IFR conditions.
The percent arrivals is given as 45 for VFR conditionsEnter in column 10.
6 Hourly Capacity Base (C*).for IFR; and enter in column 14.
Obtain C* from figure 3-27 for VFR and 3-59
7 Touch and Go Factor (T).VFR and'none in IFR.
The statement specified 3 touch and gos duringSince a touch and go is a landing and a takeoff (2 operations),
the percent of touch and go operations in VFR conditions is 6/50 or 12 percent.Obtain the touch and go factor T from figure 3-27 for VFR and 3-59 for IFR and enterin column 150
Figure A2-1. Hourly capacity of the runway canponent (cont.)
3

AC 150/5060-SAppendix2
g/23/83
HO-URLY CAPACITY BASEC.
I EXIT FACTOR IE
HOURLY~CAPACITY BASE W I TOUCB t60 FACTOR t
f-l.00
8 mit Factor EL A landing aircraft might exit at the runway intersection(1600 beet) or at one of the three right-angled exits located 3000, 4500, and 6000feet frora the threshold. Fram figures 3-27 for VFR and 3-59 for IFR, determine theexit range and the exit factor E. In this example, only two exits are within therange between 3500 to 7000 feet. Enter the exit locations in columns 12 and thenumber of usable exits in column 13. The exit fact-8 E are entered in column 16.
Figure A2-1. Baarly capacity of the runway cvnt (cont.)

g/23/03 M 150/5060-Smppendiac 2
9 Calculate Capacity.Oampute the hourly capacity of the rutway-use configur-tion aid enter in column 17.
VFR Capacity - 89~1.06°0.94 * 88.68 01: 89 opatatians per: ham
IFR capacity - 53~1.00'0097 - 51.41 or 51 uperationrr per: hour
mzk &met fort mmuay hmrly capacity.
10 elusion. !Che calcuhted harrly cap&cities of t& zunway*sa configura-tion 0; 89 qeratiom per harr in VFR canditiam and 51 apsrations pet baar in IFRconditions exceeds the aemnautical demnd8 of 50 VFR opezatium and 34 IFR apera-tion8 specified in tb8 statemeMo
Figure A2-1. Emarcly capacity of &e runway campomnt (cont.)

AC 150/5060-5Appendix 2
9/23/83
EXAMPLE 2, Determine the VFR and I*R capacity of taxiway crossings (A and B) forthe airport of example 1 when uperated as shawn. Use the traffic data fram example1 NOTE: Runway usage is reversed from that used in example 1 to permit illusta-tion of the crossing effect on both arrivals and departures.
SOLUTION: The work sheet on page 7 illustrates one method of recording data.
1. Weather. Enter type of weather in column 1.
2. Crossinq Location. Identify and enter crossing locations in columns 2and 3. Taxiway crossing (A) is 2300 feet from the arrival threshold acd taxiwaycrossing (B) is 3000 feet fram the departure threshold.
3. Runway Operations Rate, Determine operations rate and enter in column 4.The airport has a VFR demand of 50 aperations per hour with 45 percent arrivals,
. Leer 23 arrivals and 27 departures. The touch-and-o adjustment reduces the depar-tqre demand to 24 operations, In IFR there are 19 arrivals and 15 departures.
4. Mix Index. Calculate the mix index and enter in column 5. 'VFR mix indexi$ 62 and IFR mix index is 91.
5. Taxiway Crossing Capacities, Obtain crossing capacities from figure 3-66A(illustrated) for the arrival crossing (A) and figure 3-67A (illustrated) for thedeparture crossing (B) and enter in columns 6 and 7.
Crossing A (arrivals) VETt capacity = 107, and IFR capacity = 92
Crossing B (departures) VFR *capacity = 125, and IFR capacity = 112
Figure A272, Haurly capacity of the taxiway component-6
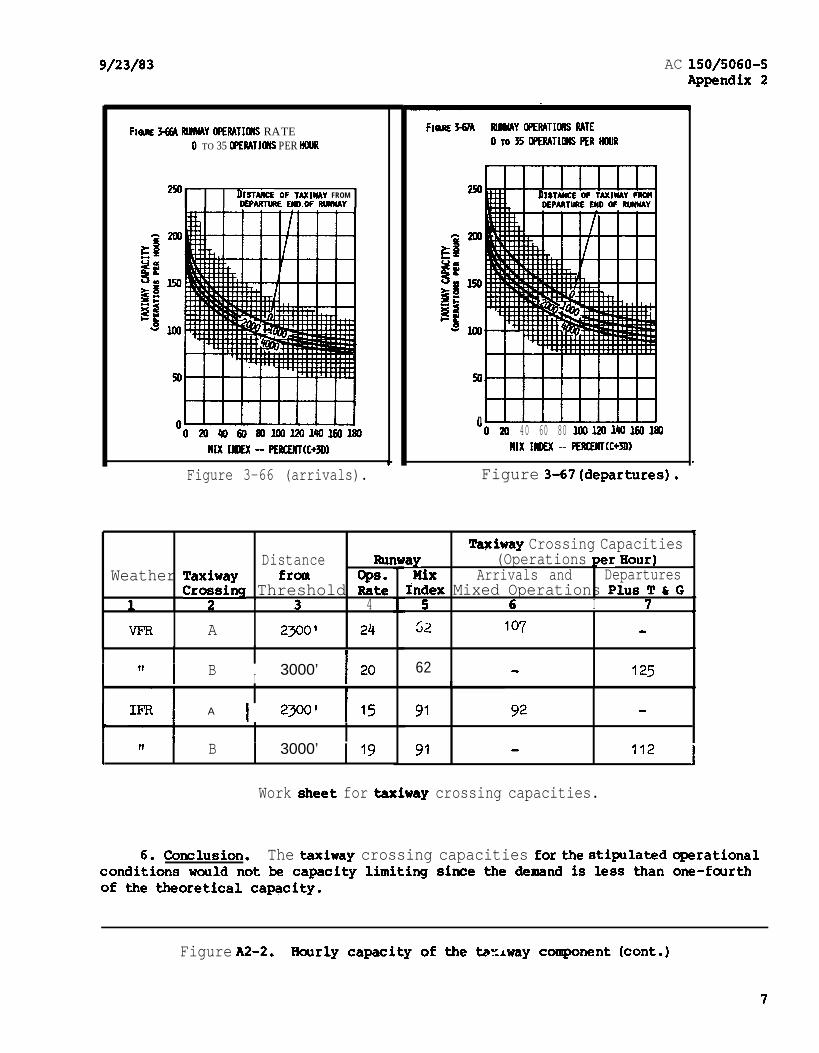
g/23/83
FImE 3-a luJwuAY ofERATIcH6 RATE FI~RE WA RWAY OPERATIOWS RATE
0 TO 35 OPERATIolys PER tWR 0 TO 35 OPERATIocls PER HOUR
DISTMCE oc: VAXIWAY FROM#
DEPARTWE EHD.OF RURUAY
-Figure 3-66 (arrivals).
AC 150/5060-5Appendix 2
n40 60 80 im 120 140 160 180
ClIX INDEX -- PERcEmc+3D)
Figure 3-67 (departures).
Distance RUIWeather Taxiway from ops
Cross% Threshold Rad1 4A 2300’ 24
Irt
IB I 3000’ 20
I
I A 1 2300’ 1 15
II B 3000’ 194
Taxiway Crossing Capacities.lay (Operations per Hour) 7Mix Arrivals and Departuresfndex Mixed Operations Plus T 6 C
5 6 I 7 1 152 107 -
Yl62 - 125
91 92 -/
91 - 112 1
Work sheet for taxiway crossing capacities.
6. Conclusion. The taxiway crossing capacities for the stipulated operationalconditions would not be capacity limiting since the demand is less than one-fcxrrthof the theoretical capacity.
Figure A2-2. Hourly capacity of the txxway component (cont.)
7

AC 150/5060-5Appendix 2
g/23/83
EXAMPLE 3. Determine the hourly capacity of the terminal gate camplex at the air-port of example 1. It has 10 gates allocated to three airlines X, Y, and 2. Only . .the end gates X-3 and Y-3 are capable of accomnodating widebodied aircraft. Duringan hours airline X schedules 13 non-widebodies with an average gate time of 45 minu-tes and two widebodies with an average gate time of 55 minutes. Airline Y scheduleseight non-widebodies with an average gate time of 40 minutes and airline 2 schedulesfour non-widebodies with an average gate time of 35 minutes.
*30m!r1cm: The work sheet on page 9 illustrates one method of recording data.
1 . Gates Groups. The gate groups (airlims identification) and type of gatesme entered in columns 1, 4, 5, and 13.
2 Gate Mix. Operational demands are entered in columns 2 and 3. The gatemix obiained by dividing the number of non-widebodied operations by the total numberof .operations is entered in column 6.
3 . Gate Percentage. Calculate the percentage ‘of widebodied gates in each gategroup and enter in column 7.
4 Gate Occupancy Time, Gate times are entered in columns 8 and 9. Sincegate &es vary by airline and location I it is presumed that the example,averagegate occupancy times mre obtained by on-site surveys.
5 Gate Occupancy Ratio. Gate occupancy ratio (R) 8 entered in column 10, isdeter&ed by dividing the average gate occupancy time of the widebodied aircraft bythat of the non-widebodied aircraft.
Airline X, R = 55/45 = 1.22
When no widebodied aircraft are accamodatedr R mals 1.00
Figure I&2-3* Eburly capacity of gate group canponent

g/23/83 AC 150/5060-5Appendix 2
6 Gate Capacity. Calculate the hourly capacity for each gate group from theequation G*S”N where N equals the number of gates in the group. Obtain values forG* and S from figure 3-68 (illustrated) and entered in columns 11 and 12. Do notinterpolate 8 use the chart with the lower R value. ,
PERCENT NOR-WIDEBODY
Rd.0 \40 45 50 55 60
tU#WIDEBODY AIRCM GATE OCCUf’~~
iiiaP 3.
YtnftN I nuAIRCI
ifs 1. I I I IR4.2J
tc/d 40 45 50 55 60.mIN-WIDEDODY AJRCW GATE OCCUPANCY.
(PERCUT MOM-WIDEBODY AIRCWT)
\ . .# G*x S x N = Hourly Capacitfl
Gate Avetage Gate Gate Eoutly Gate N o . HourlyDemand No. Gates GateMix Time (Min.)
Group ' '%zY -*=, size Gates capacity(W WI w WI 00 WI WI W) ( WTn) Ba8e
0) 1 w . (Tn) elld (R) (W) (N) (WeSeN)12 3,415,617 8 9 1 10 11 is)I 9 15 'IAI A4 Aa 4 A-
I 1 I 1 I I I I 1X 13 2 4 1 87 20 45 55 1.22 2.6 097 5 13 .LY 8 0 2 1 100 33 40 0 1.00 3.0 1.00 3 9
z 4 0 2 0 100 0 35 0 1 . 0 0 34 0 1 . 0 0 2 7
1Capacity of the Terminal
Work sheet for gate capacity.
7 Conclusion. The gate group capacity of airline X is two operations shortof its'demand, whereas the calculated gate group capacities of airlines Y and 2exceed their demand 5y one and three aperations respectively. The terminal capacityexceeds the combined airline demand by two operations per hour.
Figure A2-3. Hourly capacity of gate group components (cont.)