AbundanceofAntarcticbluewhalessouthof60°Sfromthree ... · PDF filethe topman platform. ......
10
INTRODUCTION Whaling reduced the once large numbers of blue whales (Balaenoptera musculus) to a small fraction of their original levels (e.g. Clapham et al., 1999). Of the three widely recognised subspecies, Antarctic blue whales (B.m. intermedia) greatly dominated pre-exploitation abundance and historical catches, while catches and pre-exploitation abundance of northern blue whales (B.m. musculus) and pygmy blue whales (B.m. brevicauda) were an order of magnitude lower (Branch et al., 2004; 2007a). Based on existing estimates of abundance, Antarctic blue whales originally numbered 239,000 (95% CI=202,000-311,000) but whaling from 1905-73 depleted them to a low of 360 (95% CI=150-840); despite statistically significant evidence for a subsequent increase, their numbers are still below 1% of their pre-exploitation level (Branch et al., 2004). This estimated current status of Antarctic blue whales is based largely on abundance estimates from the IWC’s International Decade for Cetacean Research (IDCR) and Southern Ocean Whale Ecosystem Research (SOWER) programmes. These ship-based surveys south of 60°S have been conducted annually since the 1978/79 austral summer season (i.e. December 1978 to February 1979). The surveys are conveniently grouped into three circumpolar sets of surveys (CPs), each of which completely encircled Antarctica – from 1978/79-1983/84 (CPI), 1985/86-1990/91 (CPII) and 1991/92-2003/04 (CPIII). The 1984/85 survey and those after 2003/04 were largely devoted to experiments and so are customarily excluded when obtaining abundance estimates (e.g. Branch, 2006a; 2007a; Branch and Butterworth, 2001a; 2001b). The most recent IDCR/SOWER estimates for CPI and CPII were 440 (CV=0.41) and 550 (CV=0.48) respectively (Branch and Butterworth, 2001a), but no estimates have been provided for the complete CPIII set. The CPIII estimate for the proportion of the area which had been covered up to 1997/98 (68%) was 1,100 (CV=0.45) (Branch and Butterworth, 2001a), and for that up to 2001/02 (91%) was 1,700 (CV=0.42) (Branch and Rademeyer, 2003). However, since these estimates were presented, CPIII has been completed, with the most important addition being the resurveying (2001/02-2003/04) of IWC Management Area V (130°E-170°W) from the pack ice northwards to 60°S. When Area V was previously surveyed earlier during the CPIII set in 1991/92, the survey did not include the northernmost area south of 60°S. For the analyses that follow, blue whale sightings south of 60°S are assumed to be Antarctic blue whales, although some may be pygmy blue whales. The proportion that are pygmy blue whales has previously been assumed to be no more than 7% (IWC, 2003); however, evidence from length frequencies and from ovarian corpora data suggests that for females (and therefore probably also for males) the upper limit is closer to 1% (Branch, 2006b; Branch et al., 2007b). This paper presents updated abundance estimates from the three completed circumpolar sets of surveys. Previous estimates were provided at the circumpolar level only, but here, estimates are also presented for individual surveys and for IWC Management Areas. METHODS The analysis methods are presented concisely below as they are only slightly modified from those in Branch and Butterworth (2001a). These minor modifications are listed in detail for humpback whales (Branch, 2007a) and so are only summarised here in Table 1. Data extraction and abundance estimation are mostly automated in the IWC’s Database Estimation System Software (DESS 3.42 April 2006; described in Strindberg and Burt (2004)), but substantial post-DESS manipulation is required to divide estimates among the IWC Management Areas (Figs 1 and 2) and to account for multiple surveys of areas during the same CP set. J. CETACEAN RES. MANAGE. 9(3):253–262, 2007 253 Abundance of Antarctic blue whales south of 60°S from three complete circumpolar sets of surveys T.A. BRANCH 20504 86 th Pl W, Edmonds, WA 98026, USA and Marine Research and Assessment Group, Department of Mathematics and Applied Mathematics, University of Cape Town, Rondebosch 7701, South Africa Contact e-mail: [email protected] ABSTRACT Sightings from the IDCR/SOWER austral summer surveys are analysed to provide abundance estimates for Antarctic (true) blue whales (Balaenoptera musculus intermedia) south of 60°S. The IDCR/SOWER ship-borne surveys have completely circled the Antarctic three times: 1978/79-1983/84 (CPI); 1985/86-1990/91 (CPII); and 1991/92-2003/04 (CPIII), covering strata totalling 64.3%, 79.5% and 99.7% of the ocean surface between the pack ice and 60°S. During the surveys, blue whale sightings were rare but were recorded in all regions. Raw sighting rates (schools per 1,000 n.mile of primary search effort) were 0.44 (CPI), 0.67 (CPII) and 1.48 (CPIII). Respective circumpolar abundance estimates were 453 (CV=0.40), 559 (CV=0.47) and 2,280 (CV=0.36), with corresponding mid-years of 1981, 1988 and 1998. The CPIII estimates are the most complete and recent for this subspecies. When adjusted for unsurveyed regions in a simple way, the estimated circumpolar rate of increase is 8.2% (95% CI=1.6–14.8%) per year; nevertheless, Antarctic blue whales still number far less than the estimated 202,000-311,000 that existed before exploitation. These abundance estimates are negatively biased because some Antarctic blue whales may have been north of 60°S or in the pack ice at the time of the surveys and because a small number of blue whales on the trackline were probably missed. Furthermore, a small proportion of pygmy blue whales, probably less than 1%, may have been included in the sightings. KEYWORDS: BLUE WHALE; SOWER; WHALING-HISTORICAL;ANTARCTIC; SOUTHERN HEMISPHERE; SURVEY-VESSEL; ABUNDANCE ESTIMATE
Transcript of AbundanceofAntarcticbluewhalessouthof60°Sfromthree ... · PDF filethe topman platform. ......

INTRODUCTIONWhaling reduced the once large numbers of blue whales(Balaenoptera musculus) to a small fraction of their originallevels (e.g. Clapham et al., 1999). Of the three widelyrecognised subspecies, Antarctic blue whales (B.m.intermedia) greatly dominated pre-exploitation abundanceand historical catches, while catches and pre-exploitationabundance of northern blue whales (B.m. musculus) andpygmy blue whales (B.m. brevicauda) were an order ofmagnitude lower (Branch et al., 2004; 2007a). Based onexisting estimates of abundance, Antarctic blue whalesoriginally numbered 239,000 (95% CI=202,000-311,000)but whaling from 1905-73 depleted them to a low of 360(95% CI=150-840); despite statistically significant evidencefor a subsequent increase, their numbers are still below 1%of their pre-exploitation level (Branch et al., 2004).
This estimated current status of Antarctic blue whales isbased largely on abundance estimates from the IWC’sInternational Decade for Cetacean Research (IDCR) andSouthern Ocean Whale Ecosystem Research (SOWER)programmes. These ship-based surveys south of 60°S havebeen conducted annually since the 1978/79 austral summerseason (i.e. December 1978 to February 1979). The surveysare conveniently grouped into three circumpolar sets ofsurveys (CPs), each of which completely encircledAntarctica – from 1978/79-1983/84 (CPI), 1985/86-1990/91(CPII) and 1991/92-2003/04 (CPIII). The 1984/85 surveyand those after 2003/04 were largely devoted to experimentsand so are customarily excluded when obtaining abundanceestimates (e.g. Branch, 2006a; 2007a; Branch andButterworth, 2001a; 2001b). The most recentIDCR/SOWER estimates for CPI and CPII were 440(CV=0.41) and 550 (CV=0.48) respectively (Branch andButterworth, 2001a), but no estimates have been providedfor the complete CPIII set. The CPIII estimate for theproportion of the area which had been covered up to1997/98 (68%) was 1,100 (CV=0.45) (Branch and
Butterworth, 2001a), and for that up to 2001/02 (91%) was1,700 (CV=0.42) (Branch and Rademeyer, 2003). However,since these estimates were presented, CPIII has beencompleted, with the most important addition being theresurveying (2001/02-2003/04) of IWC Management AreaV (130°E-170°W) from the pack ice northwards to 60°S.When Area V was previously surveyed earlier during theCPIII set in 1991/92, the survey did not include thenorthernmost area south of 60°S.
For the analyses that follow, blue whale sightings south of60°S are assumed to be Antarctic blue whales, althoughsome may be pygmy blue whales. The proportion that arepygmy blue whales has previously been assumed to be nomore than 7% (IWC, 2003); however, evidence from lengthfrequencies and from ovarian corpora data suggests that forfemales (and therefore probably also for males) the upperlimit is closer to 1% (Branch, 2006b; Branch et al., 2007b).
This paper presents updated abundance estimates fromthe three completed circumpolar sets of surveys. Previousestimates were provided at the circumpolar level only, buthere, estimates are also presented for individual surveys andfor IWC Management Areas.
METHODSThe analysis methods are presented concisely below as theyare only slightly modified from those in Branch andButterworth (2001a). These minor modifications are listedin detail for humpback whales (Branch, 2007a) and so areonly summarised here in Table 1. Data extraction andabundance estimation are mostly automated in the IWC’sDatabase Estimation System Software (DESS 3.42 April2006; described in Strindberg and Burt (2004)), butsubstantial post-DESS manipulation is required to divideestimates among the IWC Management Areas (Figs 1 and 2)and to account for multiple surveys of areas during the sameCP set.
J. CETACEAN RES. MANAGE. 9(3):253–262, 2007 253
Abundance of Antarctic blue whales south of 60°S from threecomplete circumpolar sets of surveysT.A. BRANCH
20504 86th Pl W, Edmonds, WA 98026, USA and Marine Research and Assessment Group, Department of Mathematics andApplied Mathematics, University of Cape Town, Rondebosch 7701, South AfricaContact e-mail: [email protected]
ABSTRACT
Sightings from the IDCR/SOWER austral summer surveys are analysed to provide abundance estimates for Antarctic (true) blue whales(Balaenoptera musculus intermedia) south of 60°S. The IDCR/SOWER ship-borne surveys have completely circled the Antarctic threetimes: 1978/79-1983/84 (CPI); 1985/86-1990/91 (CPII); and 1991/92-2003/04 (CPIII), covering strata totalling 64.3%, 79.5% and 99.7%of the ocean surface between the pack ice and 60°S. During the surveys, blue whale sightings were rare but were recorded in all regions.Raw sighting rates (schools per 1,000 n.mile of primary search effort) were 0.44 (CPI), 0.67 (CPII) and 1.48 (CPIII). Respective circumpolarabundance estimates were 453 (CV=0.40), 559 (CV=0.47) and 2,280 (CV=0.36), with corresponding mid-years of 1981, 1988 and 1998.The CPIII estimates are the most complete and recent for this subspecies. When adjusted for unsurveyed regions in a simple way, theestimated circumpolar rate of increase is 8.2% (95% CI=1.6–14.8%) per year; nevertheless, Antarctic blue whales still number far less thanthe estimated 202,000-311,000 that existed before exploitation. These abundance estimates are negatively biased because some Antarcticblue whales may have been north of 60°S or in the pack ice at the time of the surveys and because a small number of blue whales on thetrackline were probably missed. Furthermore, a small proportion of pygmy blue whales, probably less than 1%, may have been included inthe sightings.
KEYWORDS: BLUE WHALE; SOWER; WHALING-HISTORICAL; ANTARCTIC; SOUTHERN HEMISPHERE; SURVEY-VESSEL;ABUNDANCE ESTIMATE
JNL 253-262 388:Layout 1 14/5/08 06:58 Page 253
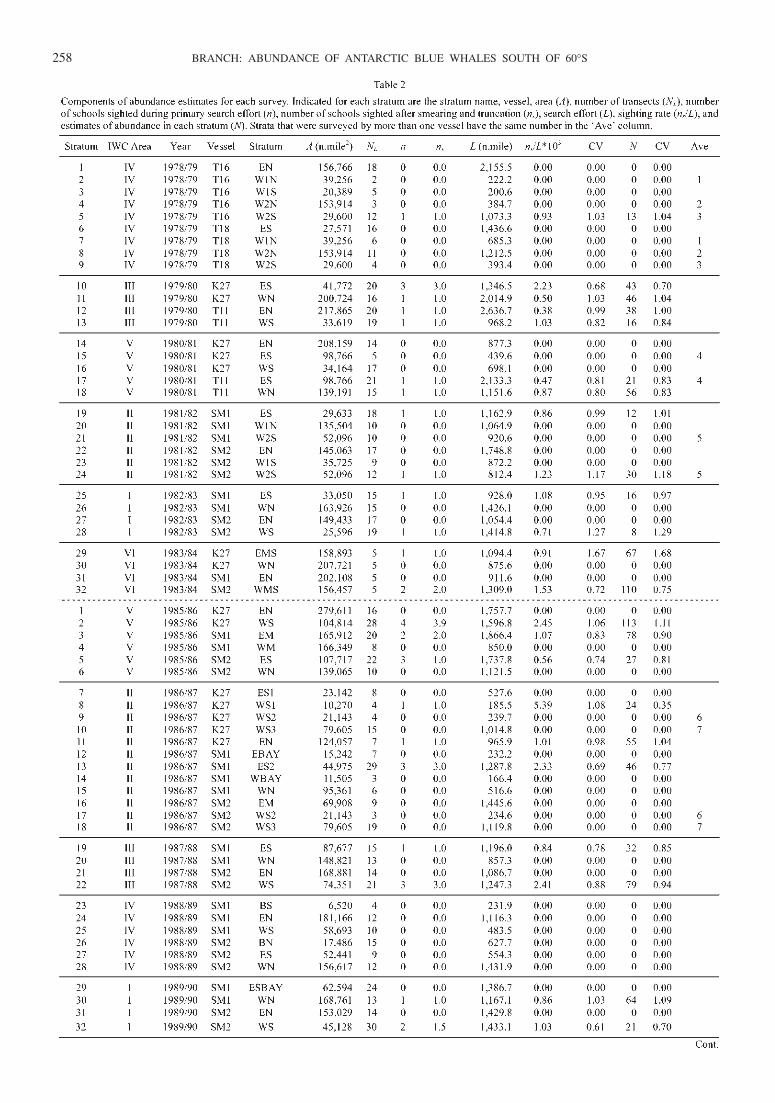
Survey designDetails of the surveys can be obtained from annual reports(e.g. Ensor et al., 2007), while most of the survey methodsare summarised in multi-year reviews (Branch andButterworth, 2001b; Joyce et al., 1988; Matsuoka et al.,2003). Survey design differed among the three CPs,complicating efforts to compare abundance estimatesbetween CPs (Figs 1-2). In CPI, one vessel generallyfollowed the pack ice while the other surveyed in arectangular pattern, leaving unsurveyed regions bothbetween the northern and southern strata, and between thenorthern survey boundary and 60°S. In CPII, the surveysgenerally followed a zig-zag design with no gap betweennorthern and southern strata, but left unsurveyed regionsbetween the northernmost boundary and 60°S. Finally, the
CPIII surveys completely surveyed the region south of 60°Sto the ice edge, but had to reduce annual longitudinalcoverage to achieve the additional latitudinal coverage, andhence needed 13 years to complete compared to the sixyears for each of CPI and CPII. Additionally, in CPIII butnot in CPI or CPII, some longitudinal regions were surveyedmore than once. Survey modes differed among the CPs; inCPI the surveys were conducted in closing mode only, whilein the other two CPs the surveys alternated between closingmode and independent observer (IO) mode. IO mode is aform of passing mode where the vessel did not leave thetrackline to confirm the species identity and school size ofthe sighting, and there was an observer in the independentobserver barrel on the mast in addition to the observers inthe topman platform.
Data selected for analysisClosing mode and IO mode data are combined for analysisin this paper, due to the low number of blue whale sightings.The raw sighting rates (per 1,000 n.mile) for CPII and CPIIIwere 0.93 for closing mode and 1.08 for IO mode, based ona small number (82) of sightings. Although the closing modesighting rate is somewhat smaller, the estimated search halfwidth is expected to be narrower in closing mode (becausethere is one fewer observer), which would offset thisdifference. Previous Antarctic analyses have also combinedthese data and sensitivities to this kind of pooling showedthat estimates for other species obtained separately for eachmode were similar (Branch and Butterworth, 2001a). Manydifferent effort codes have been recorded over the years aslisted in Branch and Butterworth (2001a; 2001b). Primaryeffort is when the vessels were searching for whales, andexcludes, for example, effort spent confirming speciesidentity or school size, refuelling, experiments and driftingduring bad weather. In this paper, all primary search effort isincluded, except for research effort specifically directedtowards areas of high expected blue whale density (BBactivity code). Sightings were included when calculating theestimates if recorded as code 01 (Antarctic blue whale),code 98 (blue whale, probably Antarctic), or code 99 (bluewhale, undetermined subspecies), but were excluded ifrecorded as code 56 (pygmy blue whale) or code 96 (bluewhale, probably pygmy). Where duplicate and triplicatesightings were recorded from multiple platforms during IOmode, those classified as ‘definite’ duplicates and triplicateswere assumed to refer to a single school, while ‘possible’and ‘remote’ duplicates and triplicates were assumed to besightings of multiple schools. Only 0.3% of sightings of all
254 BRANCH: ABUNDANCE OF ANTARCTIC BLUE WHALES SOUTH OF 60°S
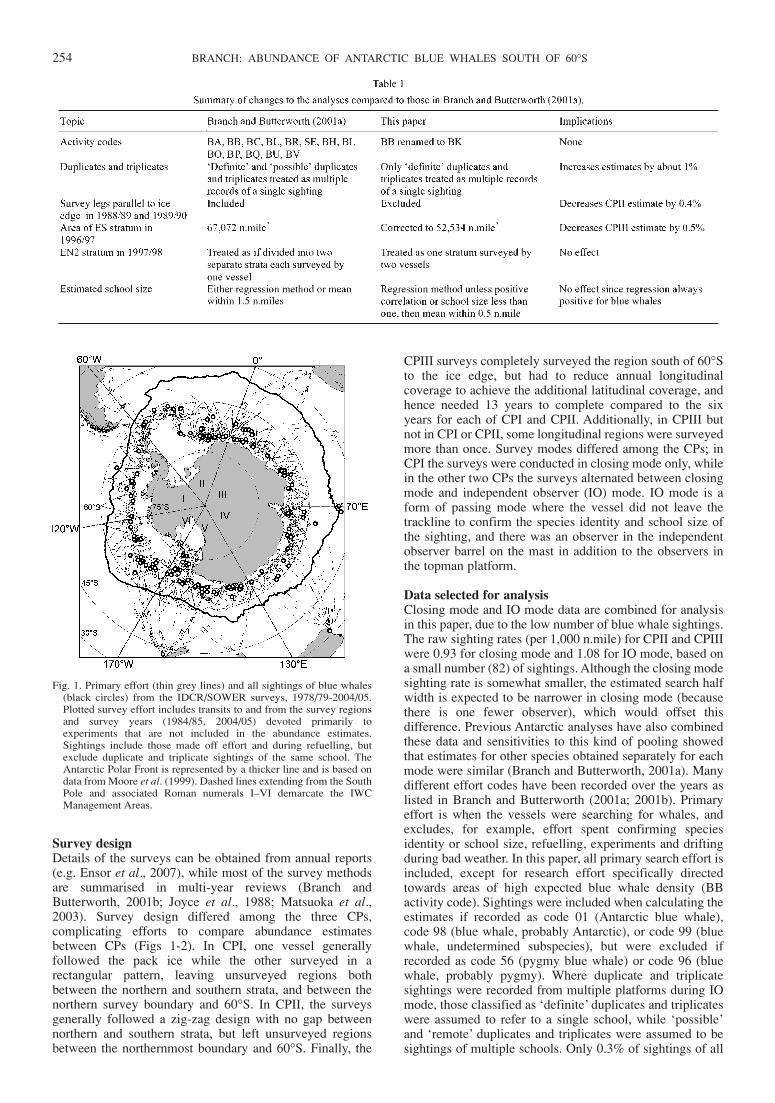
Fig. 1. Primary effort (thin grey lines) and all sightings of blue whales(black circles) from the IDCR/SOWER surveys, 1978/79-2004/05.Plotted survey effort includes transits to and from the survey regionsand survey years (1984/85, 2004/05) devoted primarily toexperiments that are not included in the abundance estimates.Sightings include those made off effort and during refuelling, butexclude duplicate and triplicate sightings of the same school. TheAntarctic Polar Front is represented by a thicker line and is based ondata from Moore et al. (1999). Dashed lines extending from the SouthPole and associated Roman numerals I–VI demarcate the IWCManagement Areas.
JNL 253-262 388:Layout 1 14/5/08 06:58 Page 254

species were recorded as ‘possible’ duplicates (Branch andButterworth, 2001a), thus this decision about duplicatesshould have negligible impact on the results.
Abundance estimationAbundance estimates were obtained using the standard linetransect formula:
(1)
where:
N = abundance estimate;A = area of stratum (n.mile2);E[s] = mean school size;n = number of schools sighted during primary search
effort;ws = effective search half-width for schools (n.mile);L = primary search effort (n.miles).
The CV for N was calculated from:
(2)
Sightings were smeared using Method II of Buckland andAnganuzzi (1988) and then grouped into 0.1 n.mile bins tothe truncation distance of 3.0 n.miles, as recommendedduring analyses by Branch and Butterworth (2001a). In
analyses for minke whales and humpback whales, smearingparameters were estimated from the data (Branch, 2006a;2007a). However, because of the paucity of data for bluewhales, smearing parameters could not be estimated reliablyfrom the data and were instead set to 4.0° (angle) and 0.3n.mile (distance), based on average values for other speciesand the recommended values used by Branch andButterworth (2001a). The hazard rate detection function wasfitted to the smeared perpendicular distances of the selectedsightings:
(3)
where g(y) is the probability that a school at a perpendiculardistance y from the trackline will be sighted, and a and b areestimated parameters subject to the constraints that a 40.0001 n.mile and b4 1. For the abundance estimates it wasassumed that g(0)=1, i.e. that all schools on the tracklinewere sighted, which seems a reasonable approximationgiven the highly visible cues produced by blue whales.
School size estimates were obtained from sightings withconfirmed school sizes in closing mode only. Large schoolsare visible at greater distances than small schools andtherefore estimates of school size were corrected for biasusing the regression method proposed by Buckland et al.(1993), which accounts for changes in the detectability of
J. CETACEAN RES. MANAGE. 9(3):253–262, 2007 255
Fig. 2. Primary search effort (solid lines) during each of the surveys included in the first, second and third circumpolar sets of surveys (CPI, CPII andCPIII), and associated sightings of blue whales (circles). Only the effort and sightings used in estimating circumpolar abundances are shown. Verticallines at the top of each panel indicate the six IWC Management Areas, while vertical lines at the bottom of each panel show the divisions betweenthe surveys.
JNL 253-262 388:Layout 1 14/5/08 06:58 Page 255

different school sizes with distance from the vessel. Samplesizes were small, requiring sightings to be pooled over allsurveys in a CP set to estimate search half-width and meanschool size.
Combining estimatesAbundance estimates were obtained for individual surveys,for each IWC Management Area, and for each CP set. ForCPI and CPII, the survey design rendered estimates easy toobtain for Management Areas and for circumpolar sets, butduring CPIII some surveys repeated longitudinal coverageand others were spread over two Management Areas.Therefore, CPIII Management Area and circumpolarestimates required the splitting of strata and the division ofsurvey effort and sightings between the new substrata asoutlined in detail in Branch (2005). Note that circumpolarestimates from CPIII exclude the 1991/92 survey in Area Vsince this region was more completely covered during2001/02-2003/04.
The differing nature of the three CPs poses several issueswhen comparing estimates, including: the different surveydesign and survey modes; the unsurveyed central regions inCPI; the lack of survey effort northwards to 60°S in most ofthe CPI and CPII surveys; and the unknown proportion ofblue whales north of 60°S during the survey period. Themost important of these issues is the unsurveyed northernareas in CPI and CPII, which are taken into account usingthe simple assumption employed by Branch andButterworth (2001a; 2001b) and Branch (2006a; 2007b) thatthe density in the unsurveyed northern areas is the same asin the adjacent northern strata. This assumption will tend toover-estimate the ‘comparable-areas’ estimates in CPI andCPII because the density in the unsurveyed northern areas islikely lower than in the corresponding northern strata, giventhat their density declines with increasing distance from thepack ice (Branch et al., 2007a; Kasamatsu et al., 2000).Following this reasoning, the best estimates for the wholearea south of 60°S based on CPI and CPII are likely betweenthe base survey estimates (which assume zero whales in theunsurveyed northern areas) and the ‘comparable-areas’estimates, which are 31% (CPI) and 23% (CPII) higher (seeResults).
Circumpolar sighting ratesFor comparison with other blue whale surveys in theSouthern Hemisphere and northern Indian Ocean listed inBranch et al. (2007a), the number of schools sighted per1,000 n.mile of primary effort was calculated for all stratasurveyed during 1978/79-1983/84 (CPI), 1985/86-1990/91(CPII) and 1992/93-2003/04 (CPIII). For these calculations,sighting numbers were neither smeared nor truncated at 3.0n.mile.
Annual rate of changeThe annual rate of increase for the circumpolar comparable-area abundance estimates was estimated by fitting anexponential growth model to the log of the estimates:
where
N0 is the abundance in the starting year (1981);N̂ t is the model-estimated abundance t years after the
starting year;r is the annual rate of increase.
For many reasons, the distribution of whales within and alsobetween Management Areas changes from year to year, andthis inter-Area variability would not be taken into account ifthe variance of an abundance estimate obtained by summingover Areas (i.e. the CP abundance estimates) accounted onlyfor the sampling variance estimate from each survey. Thismissing component of the overall variance is termed‘additional variance’. The variance (in the form of a CV2)for fitting a growth model to interannual estimates thereforecomprises both the variance for each survey, , and theadditional variance, , which is assumed to be the samefor all CP estimates. The resulting negative log likelihoodexpression for obtaining maximum likelihood estimates ofN0, r, and (ignoring constant terms) is:
The 95% confidence intervals for r were obtained bylikelihood profiling, i.e. by finding the two values of r forwhich the negative log likelihood is 1.92 units higher thanfor the maximum likelihood estimate (MLE) (e.g. Hilbornand Mangel, 1997).
RESULTSSurvey coverage and primary effort distributionSurvey coverage of the ice-free area south of 60°S was mostcomplete in CPIII, when 99.7% of the area was covered,compared to 64.3% (CPI) and 79.5% (CPII) in the earliersurveys (Fig. 2). Blue whales were sighted in all regions ofthe Antarctic, typically close to the pack ice, and were alsosighted occasionally north of the survey region duringtransits in the southern Indian Ocean and close to NewZealand (Fig. 1). Based on historical catch lengthfrequencies and their current distribution, the northerlysightings were most likely to have been pygmy blue whales(Branch et al., 2007a; 2007b).
Abundance estimatesStratum-specific components of the abundance estimates arepresented in Table 2. CP-specific estimates of search halfwidth and mean school size were highest in CPI, but werenot significantly different from the CPII and CPIII estimates(Table 3). The detection function fits to the sightingdistributions (Fig. 3) appear poor in CPI and CPII, but caremust be taken in interpreting the apparent systematicdeviations between ‘data’ and model estimates in theseplots, as the ‘data’ here are smeared, which in conjunctionwith the small associated sample sizes (Table 3) leads tosubstantial correlation across neighbouring perpendiculardistance bins in the histograms shown. The only ‘mis-fit’ ofpotential concern is the large peak for the first 0.1 n.mile binfor CPI, which probably reflects insufficient smearing toaccount for the relatively large number of angleobservations rounded to 0 in the CPI cruises. To test whetherthis lack of fit to the apparent peak introduced any bias, thedata were grouped into 0.5 n.mile bins (instead of 0.1 n.milebins) and the hazard rate model re-fitted. The estimate ofsearch half width changed from 1.97 to 1.99, indicating thatthis introduces little bias to the estimates.
Estimated circumpolar abundance increased by a smallamount from CPI to CPII but was markedly higher forCPIII, even when each is adjusted simply for unsurveyedareas (Table 4). Abundance estimates were 453 (CV=0.40)
256 BRANCH: ABUNDANCE OF ANTARCTIC BLUE WHALES SOUTH OF 60°S
JNL 253-262 388:Layout 1 14/5/08 06:58 Page 256

for CPI, 559 (CV=0.47) for CPII and 2,280 (CV=0.36) forCPIII. Note that the CPIII circumpolar estimate declinedwhen adjusted for comparable areas because some primarysurvey effort north of 60°S in Area II was excluded.
Abundance estimates were highest in CPIII for all IWCManagement Areas, but when the estimates were adjustedfor unsurveyed areas, this pattern did not hold in Areas I andIII (Table 5), although the CVs at this fine spatial scale aretoo large to allow detection of differences of any statisticalsignificance. Area V was consistently estimated to containthe most blue whales.
At least one blue whale was recorded during primarysearch effort in all surveys except 1988/89 and 1999/00, forwhich the abundance estimates were zero, while the highestestimated abundance for a single survey was 557 in 2003/04(Table 6).
Estimated rate of increaseThe estimated rate of increase based on ‘comparable-area’circumpolar abundance estimates was 8.2% per annum(95% CI=1.6-14.8%). Had additional variance been ignored,the 95% CI would have been underestimated as 3.8-12.5%.Overall sighting rates (number of schools per 1,000 n.mileof primary effort) increased over time from 0.44 (CPI) to0.67 (CPII) to 1.48 (CPIII).
DISCUSSIONThe IDCR/SOWER surveys provide the mostcomprehensive circumpolar abundance estimates to date forAntarctic blue whales. During CPIII, survey coverage was99.7% of the ice-free area south of 60°S during the australsummer when most Antarctic blue whales are found in the
survey region. Estimates are negatively biased to someextent because some Antarctic blue whales do not enter thesurvey region; 20.2% of the historical catches (some ofwhich were pygmy blue whales) were north of 60°S duringthe survey months (Horwood, 1986). Furthermore, someAntarctic blue whales do venture into the unsurveyedsouthern pack ice (Tomilin, 1967; Best, 2007; P. Ensor, pers.comm.), although acoustic evidence suggests they generallyavoid areas covered by sea ice (S̆irovíc et al., 2004).Negative bias to the estimates also occurs because it isassumed that all whales on the trackline were sighted, i.e.that g(0)=1. The bias resulting from this assumption isprobably small because of the great visibility of blue whalecues and their frequency of cue production: g(0) for thesurveys is probably between 0.9 and 1 (Best et al., 2003;Calambokidis and Barlow, 2004; Kasamatsu, 2000). Thereis great uncertainty about the magnitude of these factors, butif the estimates above are applicable, the CPIII abundanceestimates would be negatively biased by 20-30%.
It has previously been assumed that a small proportion ofthese estimates (no more than 7%) could be pygmy bluewhales (IWC, 2003). However, recent mixture models ofovarian corpora data (Branch, 2006b) and the lengthfrequencies of mature females (Branch et al., 2007b)demonstrate that this proportion is no more than 1% forfemales in the historical catches. There is no obvious reasonto suppose that these results might not apply to the present-day population of both sexes: there is no evidence in thecorpora data that the proportion of pygmy blue whales southof 60°S increased over time despite substantial depletion ofAntarctic blue whales (Branch, 2006b) and the sex ratio incatches was close to the birth sex ratio (Branch et al.,2007b).
Estimated sighting rates (schools per 1,000 n.mile ofprimary effort) increased from 0.44 (CPI) to 0.67 (CPII) to1.48 (CPIII). These sighting rates are in line with simpleestimates from other Antarctic studies listed in Branch et al.(2007a), 0.31 from the earlier Japanese Scouting Vessel(JSV) data (1965/66-1988/89) and 0.63 from JapaneseWhaling Research Program under Scientific Permit in theAntarctic (JARPA) surveys (1989/90-2004/05), but aresubstantially lower than sighting rates (3.7-97.0) recordedfor other populations of blue whales in the remainder of theIndian Ocean, around southern Australia and in Chileanwaters.
Circumpolar estimates for CPI and CPII differ little fromprevious estimates (Branch and Butterworth, 2001a; Branchand Rademeyer, 2003), but the CPIII estimate of 2,280(CV=0.36) is substantially larger than the 1,069 (CV=0.45)in Branch and Butterworth (2001a) and the 1,671(CV=0.42) in Branch and Rademeyer (2003). There are tworeasons for the increase: (1) the previous estimates were forareas that covered only 68% (Branch and Butterworth,2001a) and 91% (Branch and Rademeyer, 2003) of theregion south of 60°S; and (2) Area V was resurveyed in2001/02 to 2003/04 and the new estimate of 765 replacedthe previous estimate of 260 from 1991/92.
Antarctic blue whales were sighted throughout theAntarctic, so it is not surprising that the abundance estimatesare spread among all of the IWC Management Areas. Thehighest historical catches were taken from Areas I-III, whichhave lower current abundances of Antarctic blue whalesthan Areas IV-VI. This may suggest that the extent ofdepletion was greater in Areas I-III, but the evidence for thisis weak given the great uncertainty around the abundanceestimates. JARPA estimates for Areas IV and V are alsohighly uncertain (Matsuoka et al., 2006), (Fig. 4).
J. CETACEAN RES. MANAGE. 9(3):253–262, 2007 257
Fig. 3. Detection function fits to the smeared and truncated sightings forthe circumpolar abundance estimates based on data from CPI (toppanel), CPII (middle panel) and CPIII (bottom panel). Note that adifferent vertical scale is used for CPI.
JNL 253-262 388:Layout 1 14/5/08 06:58 Page 257
258 BRANCH: ABUNDANCE OF ANTARCTIC BLUE WHALES SOUTH OF 60°S
JNL 253-262 388:Layout 1 14/5/08 06:58 Page 258

J. CETACEAN RES. MANAGE. 9(3):253–262, 2007 259
JNL 253-262 388:Layout 1 14/5/08 06:58 Page 259

Comparable abundance estimates are difficult to obtainfrom the circumpolar sets of surveys, primarily because ofdifferences in percent coverage, but also because of changesin survey design (Branch and Butterworth, 2001b; Matsuokaet al., 2003). A simple method was used to account for theunsurveyed areas south of 60°S; it was assumed thatunsurveyed northern strata contained the same density ofblue whales as in the corresponding northern strata. Thismethod increases the CPI estimate by 31% and the CPIIestimate by 23% and has been used in previousIDCR/SOWER assessments for blue and minke whales(Branch and Butterworth, 2001a;2001b; Branch andRademeyer, 2003). More sophisticated methods ofcomparing the circumpolar estimates are beyond the scopeof this paper, but could include estimating abundance southof a northern boundary common to all CP sets, or fitting amodel to the downward trend in density with increasingdistance from the ice edge. It is expected that these moresophisticated methods would result in a higher ratio betweenCPIII abundance estimates and those from CPI or CPII.
The rate of increase from the comparable-areascircumpolar estimates is 8.2% per year, which issignificantly greater than zero (95% CI=1.6-14.8%). Thevalidity of this rate of increase is subject to thereasonableness of the comparable-area CP estimates.However, it should be noted that the IWC’s in-depthassessments of Antarctic minke whales have highlightedseveral reasons why the CPIII minke estimates are probablynegatively biased compared to the CPII estimates (Branch,
2007b); if they are also applicable to blue whales, theywould tend to increase the estimated rate of increase for bluewhales if taken into account (Branch et al., 2004). Theestimated rate of increase is nearly identical to the 8.2%(95% CI=1.9-14.8%) obtained from a Bayesian assessmentof Antarctic blue whales based on the IDCR/SOWER,JARPA and JSV data, when the rate of increase was weaklyconstrained by a Bayesian prior ~ U(-0.3, 0.3). Theestimated rate of increase from the JARPA surveys is alsosimilar: 7.4% per annum (CV=1.19) (Matsuoka et al.,2006). These rates of increase are close to the maximumbiologically possible (10.1-12.6%) for blue whales andhumpback whales (Branch et al., 2004; Brandao et al., 2000;Clapham et al., 2001; Clapham et al., 2006).
In summary, the updated circumpolar estimate ofabundance for Antarctic blue whales, following completionof CPIII, is 2,280 (95% CI=1,160-4,500). This estimate isnegatively biased (perhaps by 20-30%) because someAntarctic blue whales remain north of 60°S during thesurvey time period and because some whales on thetrackline are missed. The available evidence continues tosupport increases in this population, although the populationstill remains far below the pre-exploitation levels of202,000-311,000 estimated in Branch et al. (2004).
ACKNOWLEDGEMENTS
The author is grateful for funding for this project from theIWC and the South African National Antarctic Programmeand would like to thank A. Zerbini for providing Fig. 1. Thesurveys were funded largely by the government of Japan,and also by the government of the USSR and by the IWC,with additional contributions in some years from thegovernments of Australia, South Africa and the UnitedStates. This work would have been impossible without theyears of effort poured into the IDCR-SOWER sightingssurveys by researchers and crew on board the vessels, andthe meticulous work of researchers at the University of CapeTown, the IWC Secretariat and St. Andrews in validatingand entering the data and in maintaining and updatingDESS. The manuscript benefited from helpful commentsfrom D.S. Butterworth and an anonymous reviewer.
260 BRANCH: ABUNDANCE OF ANTARCTIC BLUE WHALES SOUTH OF 60°S
JNL 253-262 388:Layout 1 14/5/08 06:58 Page 260

J. CETACEAN RES. MANAGE. 9(3):253–262, 2007 261
Fig. 4. Comparison of comparable-areas abundance estimates for bluewhales from the IDCR/SOWER surveys and those from the JARPAsurveys forArea IV (top figure) andArea V (bottom figure). The 95%CIs are shown for both sets of estimates. JARPA estimates are takenfrom Matsuoka et al. (2006).
JNL 253-262 388:Layout 1 14/5/08 06:59 Page 261

REFERENCES
Best, P.B. 2007. Whales and Dolphins of the Southern AfricanSubregion. Cambridge University Press, Cape Town.
Best, P.B., Rademeyer, R.A., Burton, C., Ljungblad, D., Sekiguchi, K.,Shimada, H., Thiele, D., Reeb, D. and Butterworth, D.S. 2003. Theabundance of blue whales on the Madagascar Plateau, December1996. J. Cetacean Res. Manage. 5(3): 253-60.
Branch, T. 2005. Report of the Scientific Committee. Annex G. Reportof the Sub-Committee on the Comprehensive Assessment of WhaleStocks 2In-Depth Assessments. Appendix 4. Combining estimatesfrom the third circumpolar set of surveys. J. Cetacean Res. Manage.(Suppl.) 7: 231-33.
Branch, T.A. 2006a. Abundance estimates for Antarctic minke whalesfrom three completed sets of circumpolar surveys. Paper SC/58/IA18presented to the IWC Scientific Committee, May 2006, St. Kitts andNevis, West Indies (unpublished). 28pp. [Paper available from theOffice of this Journal].
Branch, T.A. 2006b. Separating pygmy and Antarctic blue whales usingovarian corpora. Paper SC/58/SH8 presented to the IWC ScientificCommittee, May 2006, St. Kitts and Nevis, West Indies(unpublished). 17pp. [Paper available at the Office of this Journal].
Branch, T.A. 2007a. Humpback abundance south of 60°S from threecompleted circumpolar sets of surveys. J. Cetacean Res. Manage.Submitted. Paper SC/A06/HW6 presented to the IWC Workshop onComprehensive Assessment of Southern Hemisphere HumpbackWhales, Hobart, Tasmania, 3-7 April 2006 (unpublished). 14pp.[Paper available from the Office of this Journal].
Branch, T.A. (compiler) 2007b. Possible reasons for the appreciabledecrease in abundance estimates for Antarctic minke whales from theIDCR/SOWER surveys between the second and third circumpolarsets of cruises. Paper SC/59/IA7 presented to the IWC ScientificCommittee, May 2007, Anchorage, USA (unpublished). 9pp. [Paperavailable from the Office of this Journal].
Branch, T.A., Stafford, K.M., Palacios, D.M., Allison, C., Bannister,J.L., Burton, C.L.K., Cabrera, E., Carlson, C.A., Galletti Vernazzani,B., Gill, P.C., Hucke-Gaete, R., Jenner, K.C.S., Jenner, M., Matsuoka,K., Mikhalev, Y., Miyashita, T., Morrice, M., Nishiwaki, S., Sturrock,V.J., Tormosov, D., Anderson, R.C., Baker, A.N., Best, P.B., Borsa, P.,Brownell, R.L., Childerhouse, S., Findlay, K., Gerrodette, T.,Ilangakoon, A.D., Joergensen, M., Kahn, D.K., Ljungblad, B.,Maughan, B., McCauley, R.D., McKay, S., Norris, T.F., Oman Whaleand Dolphin Research Group, Rankin, S., Samaran, F., Thiele, D.,Van Waerebeek, K. and Warneke, R.M. 2007a. Past and presentdistribution, densities and movements of blue whales in the SouthernHemisphere and northern Indian Ocean. Mammal Rev. 37(2): 116-75.
Branch, T.A., Abubaker, E.M.N., Mkango, S. and Butterworth, D.S.2007b. Separating southern blue whale subspecies based on lengthfrequencies of sexually mature females. Mar. Mammal Sci. 23(4):803-33.
Branch, T.A. and Butterworth, D.S. 2001a. Estimates of abundancesouth of 60°S for cetacean species sighted frequently on the 1978/79to 1997/98 IWC/IDCR-SOWER sighting surveys. J. Cetacean Res.Manage. 3(3): 251-70.
Branch, T.A. and Butterworth, D.S. 2001b. Southern Hemisphere minkewhales: standardised abundance estimates from the 1978/79 to1997/98 IDCR-SOWER surveys. J. Cetacean Res. Manage. 3(2):143-74.
Branch, T.A., Matsuoka, K. and Miyashita, T. 2004. Evidence forincreases inAntarctic blue whales based on Bayesian modelling. Mar.Mammal Sci. 20(4): 726-54.
Branch, T.A. and Rademeyer, R.A. 2003. Report of the ScientificCommittee. Annex G. Report of the Sub-Committee on thecomprehensive assessment of whale stocks 2in-depth assessments.Appendix 11. Blue whale estimates from the IDCR-SOWER surveys:Updated comparisons including results from the 1998/99 to 2000/01surveys. J. Cetacean Res. Manage. (Suppl.) 5: 291-92.
Brandao, A., Butterworth, D.S. and Brown, M.R. 2000. Report of theScientific Committee. Annex G. Report of the Sub-Committee on theComprehensive Assessment of Other Whale Stocks. Appendix 8.Maximum possible humpback whale increase rates as a function ofbiological parameter values. J. Cetacean Res. Manage. (Suppl.) 2:192-93.
Buckland, S.T. 1992. Report of the Scientific Committee, Annex H.Proposal for standard presentation of abundance estimates. Rep. int.Whal. Commn 42: 235.
Buckland, S.T., Anderson, D.R., Burnham, K.P. and Laake, J.L. 1993.Distance Sampling: Estimating Abundance of BiologicalPopulations. Chapman and Hall, New York and London. xii+446pp.
Buckland, S.T. and Anganuzzi, A.A. 1988. Comparison of smearingmethods in the analysis of minke sightings data from IWC/IDCRAntarctic cruises. Rep. int. Whal. Commn 38: 257-63.
Calambokidis, J. and Barlow, J. 2004. Abundance of blue andhumpback whales in the eastern North Pacific estimated by capture-recapture and line-transect methods. Mar. Mammal Sci. 20(1): 63-85.
Clapham, P., Robbins, J., Brown, M., Wade, P. and Findlay, K. 2001.Report of the Scientific Committee. Annex G. Report of the Sub-Committee on the Comprehensive Assessment of Whale Stocks 2In-depth Assessments. Appendix 5. A note on plausible rates ofpopulation growth in humpback whales. J. Cetacean Res. Manage.(Suppl.) 3: 196-97.
Clapham, P., Wade, P. and Zerbini, A. 2006. Plausible rates ofpopulation growth in humpback whales revisited. Paper SC/58/SH4presented to the IWC Scientific Committee, May 2006, St. Kitts andNevis, West Indies (unpublished). 12pp. [Paper available at the Officeof this Journal].
Clapham, P.J., Young, S.B. and Brownell, R.J., Jr. 1999. Baleen whales:conservation issues and the status of the most endangered species.Mammal Rev. 29(1): 35-60.
Ensor, P., Komiya, H., Beasley, I., Fukutome, K., Olson, P. and Tsuda,Y. 2007. 2006-2007 International Whaling Commission-SouthernOcean Whale and Ecosystem Research (IWC-SOWER) Cruise.Paper SC/59/IA1 presented to the IWC Scientific Committee, May2007, Anchorage, USA (unpublished). 63pp. [Paper available fromthe Office of this Journal].
Hilborn, R. and Mangel, M. 1997. The Ecological Detective:Confronting Models with Data. Princeton University Press,Princeton, New Jersey.
Horwood, J.W. 1986. The distribution of the southern blue whale inrelation to recent estimates of abundance. Sci. Rep. Whales Res. Inst.,Tokyo 37: 155-65.
International Whaling Commission. 2003. Report of the ScientificCommittee. Annex G. Report of the Sub-Committee on theComprehensive Assessment of Whale Stocks 2In-DepthAssessments. J. Cetacean Res. Manage. (Suppl.) 5:248-92.
Joyce, G.G., Kasamatsu, F., Rowlett, R. and Tsunoda, L. 1988. TheIWC/IDCR Southern Hemisphere minke whale assessment cruises:the first ten years. Paper SC/40/O16 presented to the IWC ScientificCommittee, May 1988 (unpublished). 98pp. [Paper available fromthe Office of this Journal].
Kasamatsu, F. 2000. Species diversity of the whale community in theAntarctic. Marine Ecology. Progress Series 200: 297-301.
Kasamatsu, F., Matsuoka, K. and Hakamada, T. 2000. Interspecificrelationships in density among the whale community in the Antarctic.Polar Biol. 23: 466-73.
Matsuoka, K., Ensor, P., Hakamada, T., Shimada, H., Nishiwaki, S.,Kasamatsu, F. and Kato, H. 2003. Overview of minke whale sightingssurveys conducted on IWC/IDCR and SOWER Antarctic cruisesfrom 1978/79 to 2000/01. J. Cetacean Res. Manage. 5(2): 173-201.
Matsuoka, K., Hakamada, T., Kiwada, H., Murase, H. and Nishiwaki, S.2006. Distribution and standardized abundance estimates ofhumpback, fin and blue whales in the Antarctic Areas IIIE, IV, V andVIW (35°E-145°W) south of 60°S. Paper SC/D06/J7 presented to theIntersessional Workshop to Review Data and Results from SpecialPermit Research on Minke Whales in the Antarctic, Tokyo, 4-8December 2006. 37pp. (unpublished). [Paper available from theOffice of this Journal].
Moore, J.K., Abbott, M.R. and Richman, J.G. 1999. Location anddynamics of the Antarctic Polar Front from satellite sea surfacetemperature data. J. Geophys. Res. 104: 3059-73.
S̆irovíc, A., Hildebrand, J.A., Wiggins, S.M., McDonald, M.A., Moore,S.E. and Thiele, D. 2004. Seasonality of blue and fin whale calls westof the Antarctic Peninsula. Deep Sea Research II (51/17): 2327-44.
Strindberg, S. and Burt, M.L. 2004. IWC Database-Estimation SystemSoftware (DESS) User Manual. Research Unit for WildlifePopulation Assessment, Mathematical Institute, University of StAndrews, St Andrews. 300pp. [Paper available from the Office of thisJournal].
Tomilin, A.G. 1967. Balaenoptera musculus L. Blue Whales. pp. 76-112. In: Mammals of the USSR and Adjacent Countries. Vol. 9.Cetacea. [Israel Program for Scientific Translations, Jerusalem].
262 BRANCH: ABUNDANCE OF ANTARCTIC BLUE WHALES SOUTH OF 60°S
JNL 253-262 388:Layout 1 14/5/08 06:59 Page 262