Dinoflagellate community structure from the stratified environment

ABUNDANCE OF A NOVEL DINOFLAGELLATE PHYLOTYPE IN THE ROSS SEA,ANTARCTICA1
Rebecca J. Gast2, Dawn M. Moran, David J. Beaudoin, Jonathan N. Blythe, Mark R. Dennett
Biology Department, Woods Hole Oceanographic Institution, Woods Hole, Massachusetts 02543, USA
and
David A. Caron
Department of Biological Sciences, University of Southern California, Los Angeles, California 90089-0371, USA
The biodiversity of protistan assemblages pre-sent in microhabitats of the Ross Sea, Antarctica,was examined using molecular biological methodsto obtain a greater understanding of the genetic di-versity present. Sequencing of 18S clone librariesindicated genetically diverse collections of organ-isms in the water column, ice, and meltwater layer(slush), but a single small subunit ribosomal DNA(srDNA) sequence type dominated clone libraries(430%) from seawater and slush samples takenwithin the ice pack of this ecosystem. The BLASTsearches indicated that this dominant clone was de-rived from a dinoflagellate, and that it shared se-quence similarity (97.6%–98.3%) with both Kareniaand Karlodinium species. Phylogenetic analysesbased on small subunit ribosomal gene sequencessupported its placement as a sister group to thesetaxa, and suggested that it represented a novel ge-nus. The dinoflagellate was successfully recoveredin culture, and morphological analyses have shownthat it contains chloroplasts, is gymnodinoid, ap-pears not to have thecal plates, and has an apicalgroove and sulcal structure that confirm its place-ment as a relative of the Karenia/Karlodinium group.The abundance of this phylotype in natural sampleswas confirmed by quantitative PCR analyses of wa-ter and slush communities, and suggests that thisdinoflagellate can be a major constituent of the pro-tistan assemblages of some Antarctic microhabitatsof the Ross Sea.
Key index words: Antarctica; molecular phylo-geny; novel dinoflagellate; quantitative PCR; ribo-somal DNA
Abbreviations: DCM, deep chl maximum; DGGE,denaturing gradient gel electrophoresis; EPCR,quantitative PCR; RDP, Ribosomal Database Project
Understanding the structure and diversity of mi-crobial communities in cold environments, and the ad-
aptations that allow these assemblages to flourish nearthe lower limit of temperature tolerance for biologicalsystems, is of fundamental importance to biologicaloceanography and to understanding the adaptation oflife on our planet to extremely low temperature. Per-ennially cold ecosystems such as the Arctic, Antarcticand the deep-sea are often envisioned as harsh envi-ronments inhabited by relatively few species, occurringat very low abundances. This perception is not correctfor marine microbial communities of coastal Antarctica(Garrison et al. 1986). Diverse and abundant assem-blages of protists in the water surrounding the Antarc-tic continent have been described for more than twodecades based on traditional microbiological ap-proaches and microscopical analyses (Stoecker et al.1992, 1993, 1995, Garrison and Gowing 1993, Palmi-sano and Garrison 1993, Dennett et al. 2001, Kanget al. 2001). Microalgae (phototrophic protists) are vir-tually the only primary producers in pelagic ecosys-tems of extremely cold environments including sea-icecommunities (chroococcoid cyanobacteria are veryrare; Garrison et al. 1986), and these assemblages of-ten reach exceptionally high abundances during aus-tral summer (Smith and Gordon 1997, Dieckmannet al. 1998). Protozoa (heterotrophic protists) are alsoplentiful in cold-water environments and appear to beactive consumers of bacteria, eukaryotic algae andsmall protozoa (Garrison and Gowing 1993, Caron1994, Sherr and Sherr 1994), as they are at lower lat-itudes. It has been documented that 33% to 480% ofthe biomass of protozooplankton during austral sum-mer in the Weddell and Scotia Seas consisted of het-erotrophic flagellates, and most of this biomass washeterotrophic dinoflagellates (Garrison and Gowing1993).
Traditional microscopical approaches for docu-menting the diversity and abundances of protistan as-semblages in the coastal regions around Antarcticahave contributed greatly to our current understand-ing of Antarctic microbial food web structure and bio-geochemical processes (El-Sayed and Fryxell 1993,Garrison and Gowing 1993). This work has beenmost informative for species possessing unambiguousmorphological features, such as frustules or skeletons
1Received 28 July 2005. Accepted 31 October 2005.2Author for correspondence: e-mail [email protected].
233
J. Phycol. 42, 233–242 (2006)r 2006 Phycological Society of AmericaDOI: 10.1111/j.1529-8817.2006.00183.x

(e.g. diatoms, radiolaria, choanoflagellates). Yet, theseapproaches have not succeeded in fully characterizingthe diversity or abundance of species that are present,or in identifying morphologically nondescript organ-isms. These shortcomings are due to the tremendoussize range and morphological diversity among protiststhat necessitates the use of a variety of disparate ap-proaches to identify them in natural communities (Gif-ford and Caron 1999). As a consequence, genetic andimmunological approaches for the identification andquantification of protists have become common in re-cent years (Caron et al. 1999, 2004). Several recentmanuscripts have described the diversity of small ma-rine eukaryotes through srDNA cloning and se-quencing (Diez et al. 2001, Lopez-Garcia et al. 2001,Moon-Van der Staay et al. 2001). These studies haverevealed a large diversity of ribosomal types, have iden-tified novel ribosomal lineages within the microbialeukaryotes, and indicate that important componentsof the microbial diversity in environmental sampleshave remained undetected using traditional methods.
Most of these molecular studies have not yet linkedDNA sequence information with the correspondingmorphological descriptions of phylotypes, and thus thefunction of many of these entities remains unknown.We approached the characterization of Antarctic ma-rine microbial eukaryotic communities with this inmind, applying molecular techniques to differentiatetaxa based upon their small subunit ribosomal genesequences, along with traditional enrichment culturetechniques to link morphologic and physiologic fea-tures with genetic identification.
Our study focused on examining the genetic diver-sity (i.e. sequencing of small subunit ribosomal RNAgenes; 18S) of microbial eukaryotes less than 200mm insize in Antarctic seawater, slush (snow melt and sea-water that percolates up through fissures in the sea-iceand pools at the interface of ice and snow), and icecores. In addition to a range of diverse phylotypes, wefound that one sequence type in particular occurred inhigh numbers in the slush and water clone libraries,but not in the ice libraries. This observation suggestedthat the organism might be abundant in the formerenvironments, and we subsequently developed andapplied a quantitative PCR (qPCR) method to substan-tiate our results obtained from clone libraries. We werealso successful in establishing several cultures that hadthe same ribosomal sequence type, permitting a pre-liminary morphological identification of the dinoflag-ellate. Despite the apparent prevalence and relativelywide spatial and temporal distribution of this organ-ism, it has not been formally described in the literature.It is likely represented by the prevalent ‘gymnodinoiddinoflagellate’ that has been noted by other research-ers (Kang et al. 2001; P. Assmy and J. Henjes, AWIBremerhaven, personal communication). Our ribo-somal sequence information and preliminary mor-phological analysis indicate that this dinoflagellaterepresents a new genus and is a close relative of thetoxic genera, Karenia and Karlodinium.
MATERIALS AND METHODS
Sample collection. Seawater, sea-ice, and slush samples werecollected in the Ross Sea, Antarctica, during the austral sum-mer of 1999 (1 January–2 February 1999) onboard the RVIBNathaniel B. Palmer (cruise NBP 99-01). Samples analyzed inthis study were collected at eight stations within the pack-icealong a north-south transect at 1501 W between 731 and 651 S,and also at one station near the Antarctic continent (Fig. 1), forboth molecular analyses and establishment of enrichment cul-tures. Sampling stations within the pack-ice were separated byapproximately 11 latitude (60 nautical miles). Water samples ateach location were collected in Niskin bottles from severaldepths between the surface and the deep chl maximum (DCM;usually between 30 and 60 m) and combined for analysis. Slushwas collected from areas discolored by microbial biomass (red/brown or green) by scooping the material with sterile contain-ers. Ice cores were collected using motorized Sipre corers, andsections showing color were recovered for analysis. Slush andice samples were brought back to the ship and allowed to meltslowly at approximately 41 C. All samples were then prefilteredthrough 200mm mesh Nitexs (Wildlife Supply Company, Buf-falo, NY, USA) to remove most metazoan plankton. Protists werecollected by filtration onto 0.8mm polycarbonate filters. Typically,12 L of seawater, 200–500 mL of slush or melted ice (dependingupon the sample volume and the biomass), or 10 mL of cell culturewere collected for nucleic acid extraction. All filtration was carriedout at 21 C in a walk-in cold room. The DNA was extracted fromcells immediately after filtration.
Enrichment culture. Enrichment cultures were establishedby inoculating f/2þ silica (Guillard 1975) for phytoplanktonor 0.01% yeast extract (in sterile seawater) for phagotrophicprotists with 1 mL of Antarctic water, slush or ice sample, andincubating at 0–11 C in lighted incubators (12:12 L:D). Sam-ples were collected and enriched from two separate cruises,one in 1997 and the other in 1999. The cultures subsequentlyidentified as the dinoflagellate observed as the dominantphylotype in clone libraries (see Results) are currently grow-ing as mixed enrichment cultures in lighted incubators(12:12 L:D) kept at 0–11 C. The mixed enrichments aremaintained in inorganic medium (f/2þ silica; Guillard1975) at salinities ranging from 30 to 36 psu. Micropipettingindividual cells into fresh media generated clonal cell cul-tures for DNA analysis.
DNA extraction. Nucleic acids were extracted by a modi-fied combination of hot detergent lysis and mechanical dis-ruption (Kuske et al. 1998, Gast et al. 2004). The 2� lysisbuffer (100 mM Tris pH 8.0, 40 mM ethylenediaminetetra-acetic acid, 100 mM NaCl, 1% sodium dodecyl sulfate) waspreheated to 701 C and 200 mL was added to the filter in a5 mL Nunct tube. Approximately 200 mL of zircon beads(0.55 mm; BioSpec Products Inc, Bartlesville, OK, USA) wereadded, and the tube was vortexed for 1 min. The sample wasincubated at 701 C for 5 min, then vortexed for 1 min. Theincubation/vortexing was repeated twice. Sodium chloridewas added to bring the solution to 0.7 M, and 10% hexa-decyltrimethyammonium bromide (CTAB; Sigma, St. Louis,MO, USA) was added to a final concentration of 1%. The so-lution was then incubated at 701 C for 15 min. An equal vol-ume of chloroform was added, the sample was vortexed andcentrifuged, and the aqueous layer removed to a sterile1.5 mL microcentrifuge tube. Nucleic acids were precipitat-ed by the addition of 0.6 volumes of isopropanol and recov-ered by centrifugation. The nucleic acid pellets were allowedto air dry briefly and then resuspended in 50–100 mL of ster-ile Milli-Q water.
PCR amplification. One microliter of nucleic acid extract(25–400 ng) was used as the template in PCR amplification ofthe small subunit ribosomal gene (Saiki et al. 1988). Standard
REBECCA J. GAST ET AL.234

50 mL reactions were assembled using eukaryotic-specificsrDNA primers A and B (Medlin et al. 1988) and amplifiedwith 30–35 cycles of 45 s at 951 C, 45 s at 421 C, and 3 min at721 C, followed by a final extension at 721 C for 7 min. Prod-ucts were visualized on 1% agarose gels stained with ethidiumbromide.
Clone library generation. The PCR-amplified srRNA genes(�1.8 to �2.0 kb) were excised from crystal violet-stainedagarose gels following the manufacturers instructions in theTOPOs XL PCR Cloning Kit (Invitrogen, Carlsbad, CA,USA). Purified amplification products were ligated into thelinearized plasmid vector pCRs-XL-TOPOs (Invitrogen)and used to transform competent One Shots TOP10 Es-cherichia coli cells (Invitrogen). Transformants were grownovernight at 371 C, and positive transformants were selectedand grown as miniprep cultures in 96-well blocks. Librariesof approximately 96 clones each were picked for each water,slush, and ice sample (except SL165) collected from the in-dicated sites (Fig. 1). Plasmid DNA was recovered from bac-terial cells using the R.E.A.L.t Prep 96 Kit (Qiagen, Valencia,CA, USA) and a QIAGEN BioRobott 9600. Ribosomal geneclones for dinoflagellate cultures were generated followingthe same amplification protocol, but purified products wereligated into pGEMs-T Easy Vector System (Promega, Mad-ison, WI, USA) following instructions and colonies werepicked for miniprep screening (Wizards MiniPrep Kit,Promega).
Sequence Analysis. Clones from seawater (six libraries, 482clones total), slush (five libraries, 430 clones total) and sea-ice(five libraries, 466 clones total) libraries were screened ini-
tially by sequencing near the 5 0 end of each clone using theeukaryote rRNA-specific primer 373 (Weekers et al. 1994). Se-quencing reactions were run in a total volume of 10mL con-sisting of 1–2mL of plasmid, 2mL ABI Prisms BigDyetTerminator Cycle Sequencing Ready Reaction Kit (AppliedBiosystems, Foster City, CA, USA), 1mL primer (100 ng/mL)and dH2O. Cycle sequencing parameters were 5 min at 951 C,followed by 25 cycles of 961 C for 30 s, 501 C for 15 s, and 601 Cfor 4 min. Completed reactions were run on an ABI 377 au-tomated sequencer (Applied Biosystems) resulting in readlengths of �500 basepairs (bp). All sequences were assembledand edited using the Sequenchert 4.1 editing program (GeneCodes Corporation, Ann Arbor, MI, USA). The BLAST anal-ysis (Altschul et al. 1997) indicated the prevalence of a narrowrange of phylotypes among the water and slush clone librariesthat grouped within the dinoflagellates, prompting us to obtainmore information on this phylotype. Full-length sequences ofthe novel dinoflagellate ribosomal gene were obtained for 20selected clones, 10 each from the water and slush libraries atstation 18, using internal eukaryote-specific primers (Gastet al. 1996). Additional full-length sequences were obtainedfrom two clonal dinoflagellate cultures from our Antarctic pro-tistan culture collection (http://www.whoi.edu/science/B/pro-tists). The BLAST (Altschul et al. 1997) searches wereconducted on full-length sequences to refine potential taxo-nomic relationships, and Chimera Check (Ribosomal DatabaseProject (RDP) II; http://rdp.cme.msu.edu) was used to checkfor possible chimeric sequences.
Phylogenetic analysis. Full-length sequences were alignedwith other dinoflagellate ribosomal genes from GenBank
160°
170°
180°–170° –160°
–150°
–140°
–130°
–80° –80°
–75° –75°
–70° –70°
–65° –65°
–60° –60°
McMurdo Station
STA12
STA14
STA16
STA18
STA19
STA20
STA22
Approximate pack ice edge – north
Approximate pack ice edge – south
W176, SL180, I181
W168, SL172, I173
SL165
W159, SL163, I163
W150, SL154, I155
W145, SL148, I146
W126
FIG. 1. Cruise track from a portion of NBP 99-01 ice cruise, January–February 1999. Triangles indicate the stations where samplesdiscussed in this manuscript were collected. Letters indicate the type of sample (W, water; I, ice; SL, slush); numbers are individualsample indicators. The map was generated by Antarctic Support Associates as part of cruise data.
NOVEL ANTARCTIC DINOFLAGELLATE 235
(Bilofsky and Burks 1988) using the GCG Wisconsin Pack-aget SeqLabs v.10 (Genetics Computer Group). The refer-ence sequences used in the analysis were Pentapharsodiniumtyrrhenicum (AF022201), Pentapharsodinium sp. (AF274270),Gyrodinium galatheanum (AF274262), Karlodinium galatheanumGE-2 (AF272050), K. galatheanum GE (AF272046), K.galatheanum (AF272049), K. galatheanum (AF272045), Gym-nodinium mikimotoi (AF022195), G. fuscum (AF022194), Gym-nodinium sp. (AF022196), Heterocapsa triquetra (AF022198),Heterocapsa niei (AF274265), Heterocapsa pygmaea (AF274266),Heterocapsa rotunda (AF274267), Karenia brevis (AF274259),and Gymnodinium breve (AF172714). Note that the sequencesfor K. brevis and G. breve were obtained from different clonesof the same species (Tengs et al. 2000, Saldarriaga et al.2001). The data set for 33 taxa contained a total of 1650characters, of which 1454 were constant, 114 were variable,but parsimony uninformative, and 82 were parsimony in-formative. Modeltest 3.6 (Posada and Crandall 1998) wasused to determine that the optimal parameters for maximumlikelihood analysis were TrNþ IþG (Tamura Nei model ofevolution with a proportion of invariant sites and g distribu-tion). Aligned sequences were analyzed using PAUP* 4.0b10(Swofford 1999) with the parameters Nst 5 6, R(AC) 5 1,R(AG) 5 2.7323, R(AT) 5 1, R(CG) 5 1, R(CT) 5 5.1207,R(GT) 5 1, base frequency A 5 0.2611, C 5 0.2053,G 5 0.2584, g5 0.7207, and pinvar 5 0.3902. One thousandbootstrap replicates were run using the heuristic search inparsimony, where gaps were treated as missing data, thestarting trees were obtained with simple stepwise addition,and tree-bisection-reconnection was used in branch swap-ping. All resulting trees were unrooted, but were drawn withrespect to Gymnodinium fuscum as the outgroup.
qPCR. A primer specific for the srDNA of the novel dino-flagellate (RSdino1B; 50 CTCCCGGGCAAGGTCGTA) was de-signed based upon 17 full-length sequences that were less than1% different from each other in base composition. The Gen-Bank and RDP comparisons of this sequence show no fully ho-mologous matches in the database (closest match was 15 out of18 bases). The specific primer RSdino1B was utilized for qPCRamplification in conjunction with the eukaryotic ribosomal geneprimer 1055F (50 GGTGGTGCATGGCCG). The size of theamplified fragment was 227 bp and the optimal annealing tem-perature for this primer pair was determined to be 601 C usingthe gradient function on an Eppendorfs Mastercyclers PCRmachine (Brinkmann Instruments, Eppendorf, Westbury, NY,USA). Samples for standard curves of cell number equivalentswere generated using 10-fold serial dilutions of DNA extractedfrom a known number of cells collected from novel dinoflagellatecultures. We made serial dilutions of DNA after a single extrac-tion rather than of diluted cells to generate a consistent standardof cell number. Amplification products were quantified using theIQt SYBR Green Supermix system (BioRad Laboratories Inc,Hercules, CA, USA). The PCR amplification reactions were runin triplicate on an iCycler Thermal Cycler with the Optical Systemfor real-time PCR (Bio-Rad Laboratories Inc.) detection and wereaccomplished using 50 cycles of 951 C for 30 s, 601 C for 30 s, and721 C for 1 min, followed by melt curve analysis and then a holdat 41 C. Cell numbers per liter were calculated by determiningthe number of cells per reaction (1mL of template DNA), mul-tiplying that by the total extraction volume and dilution factors todetermine the number of cells in the whole extraction, then di-viding by the original volume of sample extracted. Some of theoriginal samples used for library construction were not availablefor the qPCR as they had been used up in previous analyses (de-naturing gradient gel electrophoresis (DGGE), cloning), and welimited our study to analysis of the subset that was available.Triplicate reactions were set up using DNA from the same ex-tracts, which should allow assessment of the error associated withthe PCR setup and amplification process. Samples were not avail-
able to test the variability associated with different extractions ofthe same sample.
RESULTS AND DISCUSSION
Clone library analysis. We analyzed clone librariesgenerated for water, slush, and ice along the transect
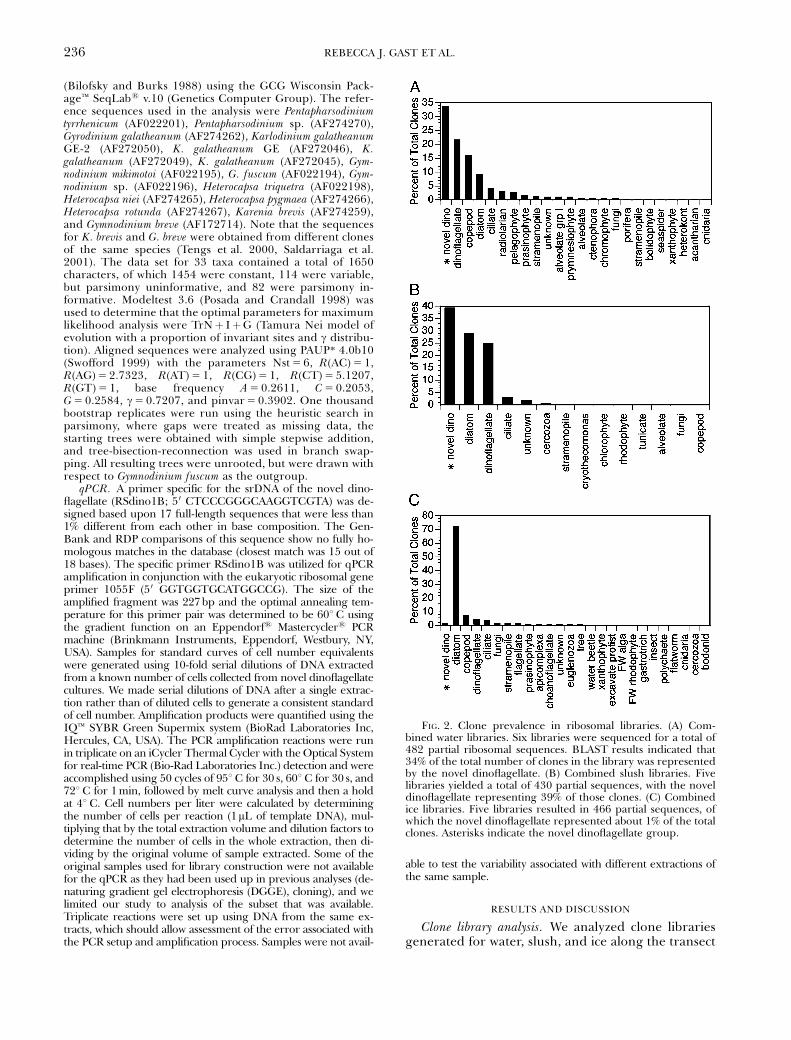
FIG. 2. Clone prevalence in ribosomal libraries. (A) Com-bined water libraries. Six libraries were sequenced for a total of482 partial ribosomal sequences. BLAST results indicated that34% of the total number of clones in the library was representedby the novel dinoflagellate. (B) Combined slush libraries. Fivelibraries yielded a total of 430 partial sequences, with the noveldinoflagellate representing 39% of those clones. (C) Combinedice libraries. Five libraries resulted in 466 partial sequences, ofwhich the novel dinoflagellate represented about 1% of the totalclones. Asterisks indicate the novel dinoflagellate group.
REBECCA J. GAST ET AL.236

shown in Figure 1 by 5 0 end sequence analysis. Great-er than 34% of the total clones from the water clonelibraries were represented by a single phylotype thathad greater than 99% sequence similarity, while 39%of total slush clones were also represented by thisphylotype (Fig. 2). This sequence type occurred veryrarely in the ice libraries. The lack of this sequencetype in the ice libraries could be due to the meltingstrategy used. The cells could have suffered lysis be-cause of osmotic shock by not having a large volume(1 L) of sterile seawater added to the melting core
sections. In previous work, we did not see a signifi-cant difference in DGGE patterns from ice coresmelted in both ways (Gast et al. 2004), so it seemsreasonable to conclude that the novel dinoflagellate isprobably not a large component of the ice commu-nity. Although this novel phylotype was abundant incombined analyses, it actually had a gradient of dis-tribution in the individual libraries. The BLAST (Al-tschul et al. 1997) searches with consensus sequencesderived from these alignments identified the se-quence as being from a dinoflagellate.
TABLE 2. Quantitative PCR results for the novel dinoflagellate abundance in Ross Sea environmental samples.
SampleOriginal sample
volume (L)Resuspensionvolume (mL)a
Amplificationdilutionb
qPCR cellnumberc (cells �L�1)
% total clones inindividual library that
are novel dinoflagellate
W145 (Sta 14) 9 L 100 1:1 90 ( � 25) 28W150 (Sta 16) 12 L 100 1:100 29,000 ( � 1900) 60W168 (Sta 20) 6 L 50 1:1 240 ( � 11) 36W176 (Sta 22) 4.5 L 50 1:1 1 ( � 0.3) 6.4SL148 (Sta 14) 1.5 mL 100 1:1 890,000 ( � 100,000) 22SL154 (Sta 16) 60 mL 50 1:100 390,000 ( � 220,000) 26SL165 (Sta 19) 250 mL 50 1:1 7500 ( � 420) 60SL172 (Sta 20) 400 mL 50 1:1 2100 ( � 550) 15SL180 (Sta 22) 250 mL 50 1:1 10,000 ( � 660) 25
aThe resuspension volume for extracted DNA was based upon the general size of the nucleic acid pellet, to provide a concentrationgenerally favorable for amplification.
bSome environmental nucleic acid extracts were diluted to bring their values within the range of other samples in the same qPCRexperiment.
cThe cell number value is the arithmetic mean from triplicate reactions. The cell number per reaction was multiplied by theextraction volume and by the dilution factor (if used) to determine cell number per extraction. This number was then divided by theoriginal sample volume to determine cell number per liter. Numbers in parentheses represent the standard deviation for thetriplicate reactions.
qPCR, quantitative PCR.
TABLE 1. Calculated percent differences between small subunit ribosomal gene sequences from novel dinoflagellate clonesand dinoflagellates from the database.
Organism 1 2 3 4 5 6 7 8 9 10 11 12 13 14 15 16 17 18 19 20 21
1 Gymnodiniummikimotoi
0.00
2 Pentapharsodiniumtyhrrenicum
1.51 0.00
3 Karenia brevis 0.24 1.63 0.004 Gyrodinium galatheanum
(Karlodinium micrum)1.99 2.05 1.99 0.00
5 W159A10 2.17 1.69 2.11 2.41 0.006 W159B4 2.13 1.69 2.17 2.35 0.97 0.007 W159C1 2.11 1.63 2.11 2.35 0.90 0.90 0.008 W159C7 2.13 1.69 2.13 2.35 0.97 0.97 0.90 0.009 W159D10 2.11 1.63 2.11 2.35 0.90 0.90 0.84 0.90 0.0010 W159E2 1.93 1.33 1.93 2.05 0.84 0.84 0.78 0.84 0.78 0.0011 W159F8 1.75 1.27 1.75 1.99 0.54 0.54 0.48 0.54 0.48 0.42 0.0012 W159G6 1.75 1.27 1.75 1.99 0.54 0.54 0.48 0.54 0.48 0.42 0.12 0.0013 W159H8 1.93 1.45 1.93 2.17 0.72 0.72 0.66 0.72 0.66 0.60 0.30 0.30 0.0014 SL163A10 1.99 1.39 1.99 2.11 0.78 0.78 0.72 0.78 0.72 0.54 0.36 0.36 0.54 0.0015 SL163B6 1.99 1.39 1.99 2.11 0.78 0.78 0.72 0.78 0.72 0.54 0.36 0.36 0.54 0.48 0.0016 SL163B11 1.99 1.39 1.99 2.11 0.78 0.78 0.72 0.78 0.72 0.54 0.36 0.36 0.54 0.48 0.48 0.0017 SL163C8 2.11 1.63 2.11 2.35 0.91 0.91 0.84 0.91 0.84 0.78 0.48 0.48 0.66 0.72 0.72 0.72 0.0018 SL163E4 1.99 1.39 1.99 2.11 0.78 0.78 0.72 0.78 0.72 0.54 0.36 0.36 0.54 0.48 0.48 0.36 0.72 0.0019 SL163H12 1.87 1.39 1.87 1.99 0.78 0.78 0.72 0.78 0.72 0.54 0.36 0.36 0.54 0.48 0.48 0.48 0.72 0.48 0.0020 RS-24 culture 1.76 1.15 1.76 1.88 0.55 0.55 0.48 0.55 0.48 0.30 0.12 0.12 0.30 0.24 0.18 0.24 0.55 0.24 0.24 0.0021 W5-1 culture 1.82 1.21 1.82 1.94 0.61 0/61 0.54 0.61 0.54 0.30 0.18 0.18 0.36 0.30 0.30 0.30 0.55 0.30 0.30 0.06 0.00
The number of base differences between two sequences were divided by the length of the shorter one, without gaps.
NOVEL ANTARCTIC DINOFLAGELLATE 237

We also extracted DNA from clonal dinoflagellatecultures established from water and slush samples, andthe small subunit ribosomal gene were amplified,cloned, and sequenced. Three of these cultures yield-ed sequences with greater than 99% similarity to thenovel dinoflagellate clones from the libraries, indicat-ing that we had successfully established this organismin culture. The small subunit ribosomal genes fromtwo of these cultures were completely sequenced (RS-24 and W5-1) and found to be identical. The identicalnature of the ribosomal sequences from the two clonalcultures is noteworthy because one was recoveredfrom enrichment cultures collected in the Ross Sea aspart of a 1997 Joint Global Ocean Flux Study program,and the other from water collected in association withthe 1999 cruise described in this study. We also foundthat one of the partial sequences recovered by Lopez-Garcia et al. (2001;DH148-5-EKD46/AF290062.1)from the Antarctic Polar Front (591 190 4800 S, 551 450
1100W) was very similar (96.7%) to our dinoflagellatesequence, but we did not use it further in our analysisbecause it was not complete.
Full-length srDNA sequences were obtained for 20of the novel phylotype clones (10 each from the station18 water and slush libraries) to examine the extent ofvariation within this dinoflagellate clone group. Fourclones from the slush library and one from the waterlibrary were determined to be potentially chimeric byanalyzing the sequences with Chimera Check at theRDP II (http://rdp.cme.msu.edu). The occurrence ofchimeric sequences in clone libraries generated fromPCR-amplified fragments has been documented pre-viously (Wang and Wang 1997, Judo et al. 1998). Fac-tors implicated in chimera formation during PCRamplification include short elongation time, slow an-nealing time, and too many cycles. Our amplificationprotocol had a long elongation time and a short an-nealing step, but used 30–35 cycles, which is within therange where increased likelihood of chimera forma-tion has been noted. Therefore, the identification ofseveral potentially chimeric clones was not unexpect-ed. These clones were eliminated from further analy-ses and have not been submitted to GenBank. Thenon-chimeric nature of our other clones was estab-lished by Chimera Check and by comparison with afull-length sequence from the cultured dinoflagellate.A total of 17 full-length sequences belonging to thenovel dinoflagellate clone group (15 sequences fromour clone libraries and two sequences obtained fromcultures) have been deposited in GenBank (Bilofskyand Burks 1988) under the accession numbersAY429057–AY429071, AY434686 and AY434687.
The percent differences between aligned clone se-quences of the novel dinoflagellate are listed in Table 1,along with a comparison to their ‘‘closest’’ relatives,P. tyrrhenicum (AF022201), Karenia brevis (AF274259),Gymnodinium breve (AF172714), G. mikimotoi (AF022195),and Gyrodinium galatheanum (AF274262). The full-length sequences from the novel dinoflagellate clones(�1800 bp) were generally greater than 99.5% similar
to each other, although there were instances where thesimilarities between two sequences were as low as ap-proximately 99%. Overall, the clones were more sim-ilar to each other than they were to any of the otherdinoflagellate sequences. Differences between noveldinoflagellate clone sequences ranged from 0 to 5 bas-es between compared pairs of sequences, which iswithin the number likely to occur between strains ofthe same species (Haywood et al. 2004). Because weare examining environmental sequences in these li-braries, it is also possible that some of the minor se-quence variation arose from multiple copies of theribosomal gene within a single cell. Although the noveldinoflagellate clone sequences appeared to have great-er similarity to Pentapharsodium (98.3%–98.7%) than toKarenia or Karlodinium (97.6%–98.3%), the nucleotidedifferences with Pentapharsodium occurred in phyloge-netically significant positions resulting in the place-ment of the novel dinoflagellate phylotype as a sistertaxon to Karenia and Karlodinium rather than toPentapharsodinium.
Phylogenetic reconstructions. The taxonomic affini-ties of the novel dinoflagellate were further exam-ined using complete srDNA sequences to performphylogenetic reconstructions. Initially, reconstruc-tions were accomplished using most of the dinoflag-ellate sequences available in the GenBank database(Bilofsky and Burks 1988), but resolution of thebranch order within the region of the tree wherethe novel dinoflagellate occurred was difficult to de-termine with confidence. This is a region of the treethat has previously been shown to be difficult toresolve in dinoflagellate srDNA phylogenies (Sal-darriaga et al. 2001).
Subsequent reconstructions were then limited torepresentatives of the closest relatives to the noveldinoflagellate and the novel dinoflagellate clones inan attempt to more robustly determine the placementof these sequences (Fig. 3). Maximum likelihood re-constructions indicate that the novel dinoflagellateclones form a separate lineage from any previously se-quenced dinoflagellates, and that the group clustersmost closely with the Karenia/Karlodinium genera.
General morphology of the novel dinoflagellate. Thenovel dinoflagellate contains chloroplasts and color-ation typical of phototrophic dinoflagellates, al-though we have information that indicates this isactually the result of kleptoplasty (unpublisheddata). The organism exhibits a solitary motile vege-tative stage (Fig. 4A), a temporary cyst (Fig. 4B), aresting stage (Fig. 4C), and a dormant cyst stage (Fig.4D). All non-motile cell stages can be covered by aheavy mucilaginous layer, which can be seen in Fig.4B, C. Vegetative cell size ranges from 8 to 20 mmwidth and from 14 to 28 mm length in both mixedenrichment and clonal cultures. The dinokont cellhas a conical epicone, a hemispherical hypocone, andappears to be unarmored. Cells have a displacedcingulum that is about two times its width, a sulcalextension that appears to invade the epitheca, and an
REBECCA J. GAST ET AL.238

apical groove that is present at the front and back ofthe cell (SEM; Fig. 4E, F). We have not observed anapical pore. The temporary cysts were found to con-tain from 1 to 19 cells that range from 18 to 22 mmwidth and from 20 to 37 mm length (Fig. 4B). Theseclusters appear to be a normal condition of the or-ganism and have been observed in natural watersamples from the Antarctic with similar numbers ofcells per colony (Rebecca J. Gast Dawn M. Moran,David J. Beaudoin, Jonathan N. Blythe, Mark R.Dennett, and David A. Caron personal observations;P. Assmy and J. Henjes, AWI Bremerhaven, personalcommunication). Despite this conspicuous clusteredlife stage, the organism is generally difficult to iden-tify in natural samples because of its unremarkablegymnodinoid shape, and in prior morphologicalstudies it has likely been grouped with other photo-trophic gymnodinoid dinoflagellates with unresolvedmorphologies.
Distribution and prevalence of the novel dinoflagellatesequence type. The combined results from the analysisof the libraries along the entire cruise transect illus-trated both the conspicuous contribution of dinoflag-ellates to the clone libraries throughout the study
area, as well as the highly variable contribution of thenovel dinoflagellate to the total number of clones ob-tained in the study (Fig. 2, Table 2). The novel dino-flagellate sequence was present in all the clonelibraries generated from both water and slush, butit constituted a highly variable percentage (o10% to470%) of the clones obtained among the differentstations. The novel dinoflagellate phylotype cloneswere often more abundant from samples toward themiddle of the transect, whereas the contribution ofthis phylotype was reduced in the open water areas ofthe transect (Fig. 1, Table 2). The diminished contri-bution of the dinoflagellate was most evident in thesamples collected near the Antarctic continent or thenorthern edge of the pack-ice, in which the noveldinoflagellate constituted less than 10% of the totalclones. Libraries constructed from samples collectedfurther into the pack-ice had higher numbers of nov-el dinoflagellate phylotypes, comprising more thanhalf of the total clones analyzed, and sometimesalmost all of the dinoflagellate clones.
We desired to determine whether the overwhelm-ing abundance of novel dinoflagellate clones in ourseawater and slush libraries reflected relative abun-dances of the organism in those environments. Clonelibraries are subject to biases introduced through nu-cleic acid isolation, PCR amplification, and cloning,that could result in the prevalence of a particular se-quence type that is not indicative of its abundance inthe original sample. Dinoflagellates have very largegenomes, and potentially many more copies of theirribosomal genes than other microbial eukaryotes (Cav-alier-Smith 1985), which could also skew clone libraryresults toward predominance of dinoflagellate phylo-types. The qPCR analyses of cellular abundance usingSYBR green incorporation were carried out usingstandards generated from a known number of cul-tured novel dinoflagellates. Thus, our qPCR resultswere correlated with the cell number of the organismrather than the copy number of the ribosomal repeats.
The error reported in parentheses below the cellnumber in Table 2 was associated with the qPCR reac-tion itself and not with extraction variation within asample. The standard deviation was determined foreach set of triplicate reactions set up from the sameDNA extract. In most cases the variability between thetriplicates was fairly low and less than or equal to 11%of the estimated cell number, but a few samples showedmuch higher deviation (SL154 at 54%; W176 at 30%;SL172 at 26%; W145 at 27%). This suggests that theremight have been problems in setting up the individualreactions, or that there were factors associated withthose samples that might cause the PCR to be variablyefficient. In the case of the two water samples, overallthere appear to be very low numbers of the dinoflag-ellate, which might result in greater inconsistency inaliquoted reactions. For the slush samples, SL154 wasfrom a dense community while SL172 was not, butboth had reasonably significant numbers of the dino-flagellate present. The variation in these reactions
Gymnodinium fuscumGymnodinium sp.
Pentapharsodinium sp.Pentapharsodinium tyrrhenicum
Gymnodinium breveKarenia brevisGymnodinium mikimotoi
Gyrodinium galatheanumKarlodinium galatheanum GE-2Karlodinium galatheanum GE
Karlodinium galatheanum CCMP 416Karlodinium galatheanum CCMP 415
W159A10W159B4
W159C1W159C7
W159D10W159F8W159G6
W159H8SL163C8
W159E2RS-24 (novel dinoflagellate culture)W5-1 (novel dinoflagellate culture)
SL163A10SL163B11SL163E4SL163B6
SL163H12Heterocapsa triquetraHeterocapsa nieiHeterocapsa pygmaea
Heterocapsa rotundata5 changes
100
84
96
10087
88
9876
63
100
62
63
95
63
FIG. 3. Maximum likelihood phylogenetic reconstruction ofnovel dinoflagellate sequence taxonomic affiliations. Numbersare percentages that represent the support of each node basedupon 1000 maximum parsimony bootstrap replicates. The tree isunrooted, but was drawn with respect to the outgroup contain-ing Gymnodinium fuscum and Gymnodinium sp.
NOVEL ANTARCTIC DINOFLAGELLATE 239

could result from inhibitory substances that were pre-sent or even from a very high amount of backgroundDNA (in the case of SL154). Overall, we would like toemphasize that these qPCR values represent the gen-eral abundance of the novel dinoflagellate, not abso-lute numbers.
Our analyses indicated that the novel dinoflagellatewas present in some water and slush samples at veryhigh levels (Table 2). In the water samples tested, weobtained cell abundances ranging from 1 to 29,000cells �L-1. These abundances correlate fairly well withthe abundances of unidentified gymnodiniod dinoflag-ellates in the Bransfield Straight (Kang et al. 2001). In1995, ‘‘gymnodinoid dinoflagellates’’ less than 20mmin size comprised 30% of the autotrophic flagellatebiomass, at numbers ranging from 5000 to200,000 cells �L� 1.
Numbers exceeding 300,000 cells �L� 1 within themeltwater communities of the pack-ice (samples SL148and SL154; Table 2) indicate the major contributionthat the novel dinoflagellate made to this microhabitatof the pack-ice ecosystem of the Antarctic. Slush, ormeltwater, is a very active environment, often contain-ing very high numbers of total microbial cells and oftenshowing dominance by a single taxon of protist. Thenovel dinoflagellate was found to occur at levels of2100–890,000 cells � L� 1 in these samples. This latervalue is comparable to exceptional bloom conditionsfor natural abundances of dinoflagellates.
A comparison of the prevalence of the novel dino-flagellate phylotype in clone libraries with abundancesobtained using the qPCR method indicated a poorcorrelation between these measurements. For exam-ple, the percent of novel dinoflagellate clones in the
FIG. 4. Light (A–D) and SEM (E and F) images of novel dinoflagellate culture. (A) Motile, vegetative cells of the novel dinoflagellate.Small and large cells are present in the sample. Scale bar, 20mm. (B) Temporary cyst. Scale bar, 25mm. (C) Resting state with extensivemucilage that forms around the cells. Scale bar, 30mm. (D) Cyst. Scale bar, 25mm. (E) SEM image of the front of a vegetative cell. Scalebar, 1mm. (F) SEM image of the back of a vegetative cell. Scale bar, 2mm.
REBECCA J. GAST ET AL.240

library obtained from SL148 was only 22%, yet thenumber of cells per liter determined by qPCR was ex-tremely high (890,000). The qPCR analysis, whenstandardized against cell number, provides an estimateof absolute abundance of the phylotype, irrespective ofthe abundance of other eukaryotes. In contrast, phylo-type prevalence in our clone libraries is a measure ofthe abundance of the phylotype relative to other recov-ered eukaryote phylotypes. The discrepancy observedfor sample SL148 may indicate that the novel dino-flagellate phylotype was present at high absolute abun-dance, yet constituted a minor fraction of the totalnumber of other phylotypes in the sample. The SL148sample was ‘‘dense’’ with cells, as evidenced by the1.5 mL volume used for extraction. The opposite situ-ation may explain sample SL165, where the noveldinoflagellate phylotype was abundant relative to thetotal number of other phylotypes in the sample (60%),yet present at low abundance (7500 cells �L� 1). Basedon the information contained in Table 2, both scenar-ios occurred in our slush samples.
The qPCR analysis confirmed the general abun-dance of the novel dinoflagellate phylotype predictedby the number of clones in the libraries. There is al-ways potential bias when amplifying and cloning, and ithas been suggested that prevalence of a sequence typeis not necessarily indicative of the natural abundance ofthe organism. Our results indicate that while clone li-braries are not quantitative, they can provide a crudeapproximation of the potential prevalence of a phylo-type in a natural sample. Most significantly, both theqPCR and clone libraries were useful in indicating thatthis dinoflagellate was common and widespread in theAntarctic marine environment.
CONCLUSIONS
We have recovered the sequence of a novel dino-flagellate phylotype in an analysis of full-length ribo-somal gene clone libraries from microhabitats of theRoss Sea, Antarctica. We have been successful in dem-onstrating the predominance of this sequence type inclone libraries from a variety of stations and sampletypes in the pack-ice and polynya. Further, we havesuccessfully linked this genotype to a cultured organ-ism, a fundamental aspect that has been lacking inmany studies of ribosomal gene diversity.
Based on our observations, we hypothesize that thisdinoflagellate can be an ecologically significant organ-ism in some Antarctic marine ecosystems. The organ-ism occurred at very high densities, and was presentduring late austral summer in Antarctic seawater andin the meltwater habitats (slush) at the snow/ice inter-face. A further interesting aspect of the novel dinoflag-ellate is that its closest taxonomic relatives are harmfulmarine dinoflagellates. Species of both Karenia andKarlodinium have been implicated in marine fish or in-vertebrate mortalities. No such impacts have been re-ported in the Ross Sea, but the abundance andwidespread distribution of the organism in the water
and slush warrant further investigation. We are cur-rently pursuing further morphological analyses inorder to produce a formal description of this dinoflag-ellate, including studies of its pigment composition andpotential for toxin production.
We are grateful for the support of this work by the NationalScience Foundation through grants OPP-9714299 and OPP-0125437, and by the NASA Astrobiology program throughgrant NCC2-1054. We are extremely grateful to Dr. MarinaMontressor and Dr. Karen Steidinger for their expertise andadvice in our morphological investigation of this dinoflagel-late, and Dr. Philipp Assmy and Dr. Joachim Henjes for shar-ing unpublished observations on the natural occurrence of theorganism in Antarctic water. We would also like to thank eve-ryone involved in the RVIB Nathaniel B. Palmer eventNBP99-01, especially the captain and crew of the RVIBNathaniel B. Palmer, Antarctic Support Associates, and thechief scientist Dr. Martin Jefferies for a productive and re-warding cruise experience. WHOI contribution # 11289.
Altschul, S. F., Madden, T. L., Schaffer, A. A., Zhang, J., Zhang, Z.,Miller, W. & Lipman, D. J. 1997. Gapped BLAST and PSI-BLAST: a new generation of protein database search pro-grams. Nucleic Acids Res. 25:3389–402.
Bilofsky, H. S. & Burks, C. 1988. The GenBank genetic sequencedata bank. Nucleic Acids Res. 16:1861–4.
Caron, D. A. 1994. Protozoan links in food webs. In Hausmann, K.& Hulsmann, N. [Eds.] Progress in Protozoology, Proceedings of theIX International Congress of Protozoology, Berlin 1993. GustavFischer Verlag, Stuttgart, pp. 125–30.
Caron, D. A., Countway, P. D. & Brown, M. V. 2004. The growingcontributions of molecular biology and immunology to pro-tistan ecology: molecular signatures as ecological tools. J.Eukaryot. Microbiol. 51:38–48.
Caron, D. A., Gast, R. J., Lim, E. L. & Dennett, M. R. 1999. Pro-tistan community structure: molecular approaches for answer-ing ecological questions. Hydrobiologia 401:215–27.
Cavalier-Smith, T. 1985. Eukaryote gene numbers, non-coding DNAand genome size. In Cavalier-Smith, T. [Ed.] The Evolution ofGenome Size. Wiley, Chichester, Chichester, UK, pp. 69–103.
Dennett, M. R., Mahot, S., Caron, D. A., Smith, W. O. J. & Lons-dale, D. J. 2001. Abundance and distribution of phototrophicand heterotrophic nano- and microplankton in southern RossSea. Deep-Sea Res. 48:4019–37.
Dieckmann, G. S., Eicken, H., Haas, C. N., Garrison, D. L., Gleitz,M., Lange, M., Nothig, E.-M., Spindler, M., Sullivan, C. W.,Thomas, D. N. & Weissenberger, J. 1998. A compilation ofdata on sea ice algal standing crop from the BellingshausenSea, Amundsen, and Weddell Seas from 1983 to 1994. In Liz-otte, M. P. & Arrigo, K. R. [Eds.] Antarctic Sea Ice: BiologicalProcesses, Interactions and Variability. American GeophysicalUnion, Washington, DC, pp. 85–92.
Diez, B., Pedros-Alio, C. & Massana, R. 2001. Study of genetic di-versity of eukaryotic picoplankton in different oceanic regionsby small-subunit rRNA gene cloning and sequencing. Appl.Environ. Microbiol. 67:2932–41.
El-Sayed, S. Z. & Fryxell, G. A. 1993. Phytoplankton. In Fried-mann, E. I. [Ed.] Antarctic Microbiology. Wiley-Liss Inc, NewYork, pp. 65–1.
Garrison, D. L. & Gowing, M. M. 1993. Protozooplankton. InFriedmann, E. I. [Ed.] Antarctic Microbiology. Wiley-Liss Inc,New York, pp. 123–65.
Garrison, D. L., Sullivan, C. W. & Ackley, S. F. 1986. Seaice microbial communities in Antarctica. BioScience 36:243–50.
Gast, R. J., Dennett, M. R. & Caron, D. A. 2004. Characterization ofprotistan assemblages in the Ross Sea, Antarctica by denaturinggradient gel electrophoresis. Appl. Environ. Microbiol. 70:2028–37.
NOVEL ANTARCTIC DINOFLAGELLATE 241
Gast, R. J., Ledee, D. R., Fuerst, P. A. & Byers, T. J. 1996. Subgenussystematics of Acanthamoeba: four nuclear 18S rDNA sequencetypes. J. Eukaryot. Microbiol. 43:498–504.
Gifford, D. J. & Caron, D. A. 1999. Sampling, Preservation, Enumer-ation and Biomass of Marine Protozooplankton. ICES ZooplanktonMethodology Manual. Academic Press, London, pp. 193–221.
Guillard, R. R. L. 1975. Culture of phytoplankton for feeding ma-rine invertebrates. In Smith, W. L. & Chanley, M. H. [Eds.]Culture of Marine Invertebrate Animals. Plenum Publishing, NewYork, pp. 29–60.
Haywood, A. J., Steidinger, K. A., Truby, E. W., Bergquist, P. R.,Adamson, J. & MacKenzie, L. 2004. Comparative morphologyand molecular phylogenetic analysis of three new species ofthe genus Karenia (Dinophyceae) from New Zealand. J. Phycol.40:165–79.
Judo, M. S. B., Wedel, A. B. & Wilson, C. 1998. Stimulation andsuppression of PCR-mediated recombination. Nucleic AcidsRes. 26:1819–25.
Kang, S.-H., Kang, J.-S., Lee, S.-R., Chung, K. H., Kim, D. & Park,M. G. 2001. Antarctic phytoplankton assemblages in the mar-ginal ice zone of the northwestern Weddell Sea. J. Plankton Res.23:333–52.
Kuske, C. R., Banton, K. L., Adorada, D. L., Stark, P. C., Hill, K. K.& Jackson, P. J. 1998. Small-scale DNA sample preparationmethod for field PCR detection of microbial cells and spores insoil. Appl. Environ. Microbiol. 64:2463–72.
Lopez-Garcia, P., Rodriguez-Valera, F., Pedros-Alio, C. & Moreira,D. 2001. Unexpected diversity of small eukaryotes in deep-seaplankton. Nature 409:603–6.
Medlin, L., Elwood, H. J., Stickel, S. & Sogin, M. L. 1988. Thecharacterization of enzymatically amplified eukaryotic 16S-likerRNA-coding regions. Gene 71:491–9.
Moon-Van der Staay, S. Y., De Wachter, R. & Vaulot, D. 2001. Oce-anic 18S rDNA sequences from picoplankton reveal unsus-pected eukaryotic diversity. Nature 409:607–10.
Palmisano, A. C. & Garrison, D. L. 1993. Microorganisms in Ant-arctic Sea Ice. In Friedmann, E. I. [Ed.] Antarctic Microbiology.Wiley-Liss, Inc, New York, pp. 167–218.
Posada, D. & Crandall, K. A. 1998. Modeltest: testing the model ofDNA substitution. Bioinformatics 14:817–8.
Saiki, R., Walsh, P. S., Levenson, C. & Erlich, H. 1988. Primer-di-rected enzymatic amplification of DNA with a thermostableDNA polymerase. Science 239:487–94.
Saldarriaga, J. F., Taylor, F., Keeling, P. J. & Cavalier Smith, T. 2001.Dinoflagellate nuclear SSU rRNA phylogeny suggestsmultiple plastid losses and replacements. J. Mol. Evol. 53:204–13.
Sherr, E. B. & Sherr, B. F. 1994. Bacterivory and herbivory: keyroles of phagotrophic protists in pelagic food webs. Microb.Ecol. 28:223–35.
Smith, W. O. J. & Gordon, L. I. 1997. Hyperproductivity of theRoss Sea (Antarctica) polynya during austral spring. Geophys.Res. Lett. 24:233–6.
Stoecker, D. K., Buck, K. R. & Putt, M. 1992. Changes in the sea-icebrine community during the spring-summer transition,McMurdo Sound, Antarctica 1. Photosynthetic protists.Marine Ecol. Progr. Ser. 84:265–78.
Stoecker, D. K., Buck, K. R. & Putt, M. 1993. Changes in the sea-icebrine community during the spring-summer transition,McMurdo Sound, Antarctica .2. Phagotrophic protists. MarineEcol. Progr. Ser. 95:103–13.
Stoecker, D. K., Putt, M. & Moisan, T. 1995. Nano- and microp-lankton dynamics during the spring Phaeocystis sp. bloom inMcMurdo Sound, Antarctica. J. Marine Biol. Assoc. UK 75:815–32.
Swofford, D. 1999. PAUP*. Phylogenetic Analysis Using Parsimony(*and Other Methods). Sinauer Assoc, Sunderland, MA.
Tengs, T., Dahlberg, O. J., Shalchian-Tabrizi, K., Klaveness, D.,Rudi, K., Delwiche, C. F. & Jakobsen, K. S. 2000. Phylogeneticanalyses indicate that the 190hexanoyloxy-fucoxanthin-con-taining dinoflagellates have tertiary plastids of haptophyteorigin. Mol. Biol. Evol. 17:718–29.
Wang, G. C.-Y. & Wang, Y. 1997. Frequency of formation of chi-meric molecules as a consequence of PCR coamplification of16S rRNA genes from mixed bacterial genomes. Appl. Environ.Microbiol. 63:4645–50.
Weekers, P. H. H., Gast, R. J., Fuerst, P. A. & Byers, T. J. 1994.Sequence variations in small-subunit ribosomal RNAs of Hart-mannella vermiformis and their phylogenetic implications. Mol.Biol. Evol. 11:684–90.
REBECCA J. GAST ET AL.242