Abstract - Worcester Polytechnic Institute (WPI) Web viewAfter researching basic knowledge of stock...
146
Project Number: DZT 1507 An Interactive Qualifying Project Report: submitted to the Faculty of WORCESTER POLYTECHNIC INSTITUTE in partial fulfillment of the requirements for the Degree of Bachelor of Science By Teng Wang _____________________________ Submitted: July 20, 2015 1
Transcript of Abstract - Worcester Polytechnic Institute (WPI) Web viewAfter researching basic knowledge of stock...

Project Number: DZT 1507
An Interactive Qualifying Project Report: submitted to the Faculty of
WORCESTER POLYTECHNIC INSTITUTE
in partial fulfillment of the requirements for the
Degree of Bachelor of Science
By
Teng Wang _____________________________
Submitted:
July 20, 2015
Approved by Professor Dalin Tang, Project Advisor
___________________________________________
1

AbstractAfter researching basic knowledge of stock market and stock trading methods, the two-
member group conducted two five-week stock trading simulations individually via Investopedia
Stock Simulator with two different trading strategies, which were Day trading Strategy and
Position Trading Strategy. The stock trading results were compared to determine the most
profitable trading skills. The trading experiences learned from this Interactive Qualifying Project
(IQP) will benefit team members for successful stock investment in the future.
2

AcknowledgementsWe would like to thank Professor Dalin Tang for teaching and advising for the project,
and Investopedia for its stock simulator tool. The simulation with day trading method was done
by Jinqiang Ning. The simulation with position trading method was done by Teng Wang.
Table of ContentsAbstract.........................................................................................................................................2
3

Acknowledgements.......................................................................................................................3
Table of Figures.............................................................................................................................6
Table of Tables..............................................................................................................................8
1. Introduction............................................................................................................................10
1.1 Goals...............................................................................................................................10
1.2 History of the Stock Market............................................................................................11
1.3 Stocks Types...................................................................................................................11
1.4 Benefits of Stock Trading...............................................................................................12
1.5 Key term Definitions.......................................................................................................13
2. Methodologies........................................................................................................................17
2.1 Overview of Common Trading Methods........................................................................17
2.1.1 Day Trading Strategy.............................................................................................17
2.1.2 Position Trading Strategy.......................................................................................17
2.1.3 Swing Trading Strategy..........................................................................................18
2.1.4 Scalping Trading Strategy......................................................................................18
2.2 Day Trading (Buy-and-Sell) Strategy.............................................................................19
2.3 Position Trading (Buy-and-Hold) Strategy.....................................................................21
3. Selection of Stocks.................................................................................................................25
3.1 Apple Inc.........................................................................................................................25
3.2 Microsoft Corp................................................................................................................26
3.3 Amazon.com, Inc............................................................................................................28
3.4 EBay Inc..........................................................................................................................29
3.5 Google Inc.......................................................................................................................30
3.6 Yahoo Inc........................................................................................................................32
3.7 McDonald’s Corp............................................................................................................33
3.8 Starbucks Corp................................................................................................................34
3.9 American Airline Group Inc...........................................................................................35
3.10Texas Instrument Inc.......................................................................................................36
4. Day Trading (Buy-and-Sell) Simulations...............................................................................38
4.1 Week One Simulation Results........................................................................................38
4.2 Week Two Simulation Results........................................................................................44
4.3 Week Three Simulation Results......................................................................................52
4

4.4 Week Four Simulation Results.......................................................................................57
4.5 Week Five Simulation Results........................................................................................62
5. Position Trading (Buy-and-Hold) Simulations......................................................................68
5.1 Week One Simulation Results........................................................................................68
5.2 Week Two Simulation Results........................................................................................75
5.3 Week Three Simulation Results......................................................................................82
5.4 Week Four Simulation Results.......................................................................................87
5.5 Week Five Simulation Results........................................................................................94
6. Comparison..........................................................................................................................100
6.1 Final Stock Value Analysis...........................................................................................100
7. Conclusion............................................................................................................................104
Reference...................................................................................................................................105
Appendix...................................................................................................................................107
Table of FiguresFigure 2.2.1. Intraday Candle Stick Charter..................................................................................20
5

Figure 2.3.1. Channeling Trading Strategy...................................................................................23Figure 3.1.1. AAPL Stock Price Trend over Last Three Month....................................................26Figure 3.2.1. MSFT Stock Price Trend over Last Three Month....................................................27Figure 3.3.1. AMZN Stock Price Trend over the Last Three Month............................................29Figure 3.4.1. EBAY Stock Price Trend over Last Three Month...................................................30Figure 3.5.1. GOOG Stock Price Trend over the Last Three Month.............................................31Figure 3.6.1. YHOO Stock Price Trend over the Last Three Month.............................................32Figure 3.7.1. MCD Stock Price Trend over the Last Three Month...............................................34Figure 3.8.1. SBUX Stock Price Trend over the Last Three Month............................................35Figure 3.9.1. AAL Stock Price Trend over the Last Three Month................................................36Figure 3.10.1. TXN Stock Price Trend over the Last Three Month..............................................37Figure 4.1.1. Week One Total Cash Change.................................................................................39Figure 4.1.2. GOOG Stock Price Trend in Week One..................................................................41Figure 4.1.3. AMZN Stock Price Trend in Week One..................................................................42Figure 4.1.4. AAPL Stock Price Trend in Week One...................................................................43Figure 4.1.5. MCD Stock Price Trend in Week One.....................................................................44Figure 4.2.1. Week Two Total Cash Change.................................................................................45Figure 4.2.2. AAPL Stock Price Trend in Week Two...................................................................48Figure 4.2.3. MSFT Stock Price Trend in Week Two...................................................................49Figure 4.2.4. MCD Stock Price Trend in Week Two....................................................................50Figure 4.2.5. AAL Stock Price Trend in Week Two.....................................................................51Figure 4.3.1. Week Three Total Cash Change...............................................................................53Figure 4.3.2. MSFT Stock Price Trend in Week Three.................................................................56Figure 4.3.3. EBAY Stock Price Trend in Week Three................................................................57Figure 4.4.1. Week Four Total Cash Change................................................................................58Figure 4.4.2. GOOG Stock Price Trend in Week Four.................................................................61Figure 4.4.3. AMZN Stock Price Trend in Week Four.................................................................62Figure 4.5.1. Week Five Total Cash Change.................................................................................63Figure 4.5.2. GOOG Stock Price Trend in Week Five..................................................................66Figure 4.5.3. AMZN Stock Price Trend in Week Five..................................................................67Figure 5.1.1.MCD Stock Price Trend Line....................................................................................71Figure 5.1.2.AMZN Week One Share Price Trend Line...............................................................72Figure 5.1.3.EBAY Week One Share Price Trend Line................................................................73Figure 5.1.4.SBUX Week One Share Price Trend Line................................................................74Figure 5.2.1.MCD Week Two Share Price Trend Line.................................................................80Figure 5.3.1.MCD Week Three Share Price Trend Line...............................................................87Figure 5.4.1.MCD Week Four Share Price Trend Line.................................................................93Figure 5.4.2.GOOG Share Price Trend Line in The Last Month..................................................94Figure 5.5.1.AMZN Price Trend Line in Week Five....................................................................99Figure 5.5.2.AMZN Price Trend Line in June...............................................................................99Figure 6.1.1 Overall Day Trading Stock Simulation Total Asset Value Change.......................100Figure 6.1.2. Overall Day Trading Stock Simulation Profit Results...........................................101Figure 6.1.3. Overall Position Trading Stock Simulation Total Asset Value Change................102
6

Figure 6.1.4. “U” and “N” Shape Price Trend.............................................................................102Figure 6.1.5. Increasing Price Trend...........................................................................................103Figure 6.1.6. Decreasing Price Trend..........................................................................................103
Table of TablesTable 4.1.1. Week One Day Trading Simulation Results Summary.............................................38Table 4.1.2. Week Two Day One Day Trading Simulation Results..............................................39
7
Table 4.1.3. Week One Day Two Day Trading Simulation Results..............................................40Table 4.1.4. Week One Day Three Day Trading Simulation Results............................................40Table 4.1.5. Week One Day Four Day Trading Simulation Results.............................................41Table 4.2.1. Week Two Day Trading Simulation Results Summary............................................45Table 4.2.2. Week Two Day One Day Trading Simulation Results..............................................46Table 4.2.3. Week Two Day Two Day Trading Simulation Results.............................................46Table 4.2.4. Week Two Day Three Day Trading Simulation Results...........................................46Table 4.2.5. Week Two Day Four Day Trading Simulation Results.............................................47Table 4.2.6. Week Two Day Five Day Trading Simulation Results.............................................47Table 4.3.1. Week Three Day Trading Simulation Results Summary..........................................52Table 4.3.2. Week Three Day One Day Trading Simulation Results............................................53Table 4.3.3. Week Three Day Two Day Trading Simulation Results...........................................54Table 4.3.4. Week Three Day Three Day Trading Simulation Results.........................................54Table 4.3.5. Week Three Day Four Day Trading Simulation Results...........................................55Table 4.3.6. Week Three Day Five Day Trading Simulation Results...........................................55Table 4.4.1. Week Four Day Trading Simulation Results Summary............................................58Table 4.4.2. Week Four Day One Day Trading Simulation Results.............................................59Table 4.4.3. Week Four Day Two Day Trading Simulation Results.............................................59Table 4.4.4. Week Four Day Three Day Trading Simulation Results...........................................60Table 4.4.5. Week Four Day Four Day Trading Simulation Results............................................60Table 4.4.6. Week Four Day Five Day Trading Simulation Results.............................................61Table 4.5.1. Week Five Day Trading Simulation Results Summary.............................................63Table 4.5.2. Week Five Day One Day Trading Simulation Results..............................................64Table 4.5.3. Week Five Day Two Day Trading Simulation Results.............................................64Table 4.5.4. Week Five Day Three Day Trading Simulation Results...........................................65Table 4.5.5. Week Five Day Four Day Trading Simulation Results.............................................65Table 4.5.6. Week Five Day Five Day Trading Simulation Results.............................................65Table 5.1.1.Positioning Trading Week One Simulation Results...................................................68Table 5.1.2.Positioning Trading Week One Day One Simulation Results....................................69Table 5.1.3.Positioning Trading Week One Day Two Simulation Results...................................69Table 5.1.4.Posotioning Trading Week One Day Three Simulation Results................................70Table 5.1.5.Positioning Trading Week One Day Four Simulation Results...................................70Table 5.2.1.Positioning Trading Week Two Simulation Results..................................................75Table 5.2.2.Positioning Trading Week Two Day One Share Price Changes................................76Table 5.2.3.Positioning Trading Week Two Day Two Share Price Changes................................76Table 5.2.4.Positioning Trading Week Two Day Three Share Price Changes..............................77Table 5.2.5.Positioning Trading Week Two Day Four Share Price Changes...............................78Table 5.2.6.Positioning Trading Week Two Day Four Simulation Results..................................78Table 5.2.7.Positioning Trading Week Two Day Five Share Price Changes................................79Table 5.2.8.Positioning Trading Week Two Day Five Simulation Results...................................79Table 5.2.9.EBAY Week Two Share Price Changes.....................................................................81Table 5.2.10.AAPL Week Two Share Price Changes...................................................................81Table 5.3.1.PositioningTrading Week Three Simulation Results.................................................82
8

Table 5.3.2.Positioning Trading Week Three Day One Share Price.............................................83Table 5.3.3.Positioning Trading Week Three Day One Simulation Results.................................83Table 5.3.4.Positioning Trading Week Three Day Two Share Price............................................84Table 5.3.5.Positioning Trading Week Three Day Three Share Price..........................................84Table 5.3.6.Positioning Trading Week Three Day Three Simulation Results..............................85Table 5.3.7.Positioning Trading Week Three Day Four Share Price............................................85Table 5.3.8.Positioning Trading Week Three Day Five Share Price.............................................86Table 5.4.1.Positioning Trading Week Four Simulation Results..................................................88Table 5.4.2.Positioning Trading Week Four Day One Share Prices.............................................88Table 5.4.3.Positioning Trading Week Four Day Two Share Prices.............................................89Table 5.4.4.Positioning Trading Week Four Day Three Share Prices...........................................90Table 5.4.5.Positioning Trading Week Four Day Three Simulation Results................................90Table 5.4.6.Positioning Trading Week Four Day Four Simulation Results..................................91Table 5.4.7.Positioning Trading Week Four Day Five Share Prices.............................................91Table 5.4.8.Positioning Trading Week One Day Five Simulation Results...................................92Table 5.5.1.Positioning Trading Week Five Simulation Results...................................................94Table 5.5.2.Positioning Trading Week Five Day One Share Prices..............................................95Table 5.5.3.Positioning Trading Week Five Day Two Share Prices.............................................96Table 5.5.4.Positioning Trading Week Five Day Two Simulation Results...................................96Table 5.5.5.Positioning Trading Week Five Day Three Share Prices...........................................96Table 5.5.6.Positioning Trading Week Five Day Four Share Prices.............................................97Table 5.5.7.Positioning Trading Week Five Day Four Simulation Results..................................97Table 5.5.8.Positioning Trading Week Five Day Five Share Prices.............................................98Table 5.5.9.Positioning Trading Week Five Day Five Simulation Results...................................98
1. Introduction Despite its popularity and presence in the news, the stock market is just one of many
potential places to invest your money. Investing stock is often risky, which draws attention to the
9

huge gains and losses of some investors. If you manage the risks, you can take advantage of the
stock market to secure your finial position and earn money [1]. There are many advantages of
investing in the stock market. By investing in stock market, investors can get investment gains,
dividend income, and also diversify their wealth and obtain ownership.
1.1 Goals
At the beginning, group members will learn the basic knowledge about stock market and
trading methods from their preferred sources such as related websites, newspapers and books.
Then, based on online stock simulator, five-week stock market simulation will be conducted
individually. In simulation procedure, the basic knowledge of stock market and trading methods
will be applied and practiced. Meanwhile, group members will compare invested stocks’ values
weekly and discuss their trading skills, to determine further operations. Finally, the total benefits
of trading stocks will be compared, and the trading methods will be analyzed to help group
members understand how the stock market works, and how investors maximize benefits and
minimize risks. The experience obtained from this Interactive Qualifying Project (IQP) will help
each group member to become a competent investor in the future.
1.2 History of the Stock Market
The market in which shares of publicly held companies are issued and traded either
through exchanges or over-the-counter markets. Also known as the equity market, the stock
market is one of the most vital components of a free-market economy, as it provides companies
with access to capital in exchange for giving investors a slice of ownership in the company. The
10
stock market makes it possible to grow small initial sums of money into large ones, and to
become wealthy without taking the risk of starting a business or making the sacrifices that often
accompany a high-paying career [2].
Stock change has a long history. The first stock exchange in London was officially
formed in1773, which is 19 years before the New York Stock Exchange. Whereas the London
Stock Exchange (LSE) was handcuffed by the law restricting shares, the New York Stock
Exchange (NYSE) has dealt in the trading of stocks, for better or worse, since inception. The
NYSE wasn’t the first stock exchange in United States, however, that honor goes to the
Philadelphia Stock Exchange, but it quickly became the most powerful. Last for a few centuries,
today’s stock market plays an unreplaceable role in global trades and affects global economies
significantly. At the close of 2012, the size of the world stock market (total market
capitalization) was about US$55 trillion. By country, the largest market was the United States
(about 34%), followed by Japan (about 6%) and the United Kingdom (about 6%). This went up
more in 2013 [3].
1.3 Stocks Types
There are two types of stock, common stock and preferred stock.
Common stock means having common rights in the management and distribution of the
company’s operating and property. It is the basis of a company’s capital and a basic form of
stock. And at the same time, it is also the most important stock and has the largest circulation.
Preferred stock has a fixed dividend and the dividend does not fluctuate with the
company’s performance. Preferred shareholders usually do not participate in the company’s
11

management. It has smaller risk than common stock. Also there are several main differences
between them.
1) The shareholders of common stock have the right to participate in management of the
company, while preferred shareholders usually do not have the right to participate in the
company’s management.
2) The earning of common stock shareholders is dependent on the company’s profit
situation, while the earning of preferred stock shareholders is fixed.
3) Common stock cannot be withdrawn and can only be realized in the secondary market.
However, preference shares and preferred shareholders may redeem shares on the
attached terms require the company to redeem their shares.
4) Preferred stock is the most important kind of special shares, have priority in the
distribution of company profits and surplus property.
1.4 Benefits of Stock Trading
Stock Trading is one of the most effective ways of making money and building wealth. It
brings huge wealth to investors even high risks exist especially for the investors who are lack of
knowledge and experience. There are many advantages of stock trading such as investment
gains, dividend income, diversification and ownership.
One of the primary benefits of trading stocks is the chance to earn money and build
wealth. Over last a few decades, the stock market tends to rise in value, though the prices of
individual stock rises and falls daily. Another benefit of trading stock is dividend income. Some
12

stocks provide income in the form of a dividend, which is similar to bank interest but paid by
stocks’ companies annually. Diversification is another benefit of trading stock. For investors who
put money into different types of investment products, a stock market investment has the benefit
of providing diversification. Stock market investments change value independently of other types
of investments, such as bonds and real estate. Holding stock can help you weather losses to other
investment products. Stock also adds risk to a portfolio, as well as the potential for large, rapid
gains, helping investors avoid risk-averse or overly conservative investment strategies [1] In
addition, investors can obtain ownership by buying shares of stock, which means that taking on
an ownership stake in the company you purchase stock in. Shareholders have rights to vote
depends on the percentage of their holding stocks to make certain business decision for the
company. By allowing works to hold the company stocks where they are working for, the works
will express loyalty and incentives to contribute more.
1.5 Key term Definitions
In order to be a technical investor in stock market, we search some technical stock trading
skills and key term definitions, which will be practiced in selection of stocks and trading
procedures.
After-hours Deal: The stock market usually closes at 4:00pm. After this scheduled time, deals
can also be made but the transaction is dated the next day, known as an after-hours deal.
Balance Sheet: The financial statement which shows the liabilities and assets of a company.
Bargain: Regarding sale or purchase in the stock market, bargain is a common word.
Bearer Stocks: This is the stock that is unregistered with the owner’s name.
13

Bed and Breakfast Deal: This refers to the sale of share and repurchase on another day. It’s done
to set up profit or loss for the purpose of tax.
Bid Price: This term indicates the sale price of stocks or shares.
Blue Button: Refers to the stockbroker’s clerk. Only a blue button is allowed on the trading
floor.
Blue Chip: These are shares of big and reputed companies.
Book Value: The net worth of the company as listed on the balance sheet.
Bull: A person who considers the share price of the stock exchange to be on the rise.
Call: An extra installment due on shares.
Capital: The amount of money used for setting up a new business.
Cash Settlement: In the stock exchange, there are certain deals like Gilts which are rendered for
cash and not for account settlement. They are settled the next day of the deal.
Contract Note: This is a printed confirmation letter from any broker indicating a bargain which is
carried out.
Coupon: Refers to interest amount payable only for fixed interest stock.
Cum Dividend: These are shares that are sold, allowing the buyer to receive the
following dividend.
Dawn Raid: Refers to the buying of a huge amount of shares in the morning at the opening of
stock market.
Dealing: This means the purchase and sale of shares.
14

Debenture: The stock that a company issues which are backed by assets.
Depreciation: The amount of money set aside for replacement of the assets.
Dividend: The part of the company’s profits which is usually distributed to company’s
shareholders, normally on regular basis.
Equities: These are the ordinary shares. They are different from debenture and also from loan
stock.
Ex-dividend: The share which is bought without any right for receiving the next dividend. This is
usually retained by sellers.
Final Dividend: This is the dividend which is declared according to the company’s annual
results.
Futures: Contracts that allow any holder the legal right to buy or sell Indexes and Commodities
in the future at a price set today.
Gross: The interest paid without deducting of tax.
Hedge: This means to insure the risk.
Initial Public Offering: The issue of new shares by a previously private company as it becomes a
public company.
Limit Order: This is an order to any stockbroker specifying any fixed price limit.
Liquidation: Converting the prevailing assets to cash.
Loan Stock: The stock that bears a fixed interest rate. It’s different from debenture stock because
it’s not required to be secured by any asset.
15

Nominee: The term refers to a person acting on the behalf of another in the stock market in
documentary as well as financial affairs.
Offer Price: Refers to the specific price at which one can buy stocks and shares.
Options: The term means the right to purchase (call option) and sell (put option) a particular
share at a particular price within a particular period.
Ordinary Share: This is a share where the dividends usually vary in the amount.
Over the Counter Market (OTC): Refers to a marketplace outside the main stock market.
PLC: This means Public Limited Company (formerly Ltd). In the stock market, some public
limited companies are not always quoted.
Portfolio: A selection of shares usually held by a person or fund.
Proxy: Anybody who votes on another person’s behalf if the person is unable to attend a
shareholders’ meeting.
Stock: Also referred to share or equity, stock is the basic ownership unit of a company.
Stock Warrants: An instrument that conveys the right to buy additional stock within a fixed time
period at a set price. Warrants differ from stock options in the way they are exercised.
Yearlings: Bonds issued for twelve-month term, mainly by local authorities.
Yield: The gross dividend presented as the percentage of the share price [4].
16

2. Methodologies
2.1 Overview of Common Trading Methods
In stock market, there are four common trading methods such as Day Trading Strategy,
Position Trading Strategy, Swing Trading Strategy and Scalping Trading Strategy.
2.1.1 Day Trading Strategy
Day Trading is the most well-known active trading strategy. Day
trading is speculation in securities, specifically buying and selling financial instruments within
the same trading day. Strictly, day trading is trading only within a day, such that all positions are
closed before the market close for the trading day. Many traders may not be so strict or may have
day trading as one component of an overall strategy. Traders who participate in day trading are
called day traders. Traders who trade in this capacity with the motive of profit are
therefore speculators [5]. Traditionally, day trading is done by professional traders, such as
specialists or market makers. However, electronic trading has opened up this practice to novice
traders. There are some common day-traded financial instruments, which are stocks, options,
currencies, and a host of futures contracts such as equity index future, interest rate futures, and
commodity futures.
2.1.2 Position Trading Strategy
Position Trading is not active trading strategy. It is also called buy-and-hold strategy.
Position trading uses longer term charts, from daily to monthly, in combination with other
methods to determine the trend of the current market direction. This type of trade may last for
17

several days to several weeks and sometimes longer, depending on the trend. Trend traders look
for successive higher highs or lower highs to determine the trend of a security [6].
2.1.3 Swing Trading Strategy
When a trend breaks, swing traders typically get in the game. At the end of a trend, there
is usually some price volatility as the new trend tries to establish itself. Swing traders buy or sell
as that price volatility sets in. Swing trades are usually held for more than a day but for a shorter
time than trend trades. Swing traders often create a set of trading rules based on technical or
fundamental analysis; these trading rules or algorithms are designed to identify when to buy and
sell a security [6]. Swing traders hold a particular stock for a period of time, generally a few days
or two or three weeks, which is between those extremes, and they will trade the stock on the
basis of its intra-week or intra-month oscillations between optimism and pessimism.
2.1.4 Scalping Trading Strategy
Scalping is one of the quickest strategies employed by active traders. It includes
exploiting various price gaps caused by bid/ask spreads and order flows. The strategy generally
works by making the spread or buying at the bid price and selling at the ask price to receive the
difference between the two price points. Scalpers attempt to hold their positions for a short
period, thus decreasing the risk associated with the strategy. Additionally, a scalper does not try
to exploit large moves or move high volumes; rather, they try to take advantage of small moves
that occur frequently and move smaller volumes more often. Since the level of profits per trade is
small, scalpers look for more liquid markets to increase the frequency of their trades. And unlike
18

swing traders, scalpers like quiet markets that aren't prone to sudden price movements so they
can potentially make the spread repeatedly on the same bid/ask prices.
2.2 Day Trading (Buy-and-Sell) Strategy
Day Trading Strategy is one of the primary trading methods. It means that investors will
buy and sell financial instruments within the same trading day. However, for our IQP program,
we are not very strict with the same day rule and may hold the stock overnight under special
conditions.
To maximize profit and minimize risk, there are two things are important for day traders,
which are liquidity and volatility in stocks. Market liquidity is a market's ability to facilitate the
purchase or sale of an asset without causing drastic change in the asset's price. Equivalently, an
asset's market liquidity (or simply "an asset's liquidity") is the asset's ability to sell quickly
without having to reduce its price very much. Liquidity is about how big the trade-off is between
the speed of the sale and the price it can be sold for. In a liquid market, the trade-off is mild:
selling quickly will not reduce the price much. In a relatively illiquid market, selling it quickly
will require cutting its price by some amount [7]. Volatility is a measure for variation of price of
a financial instrument over time. Historic volatility is derived from time series of past market
prices. An implied volatility is derived from the market price of a market traded derivative (in
particular an option). The symbol σ is used for volatility, and corresponds to standard deviation,
which should not be confused with the similarly named variance, which is instead the square, σ2
[8].
19
In order to decide the entry points, we need to use some tools to get information to guide
the buy and sell of stocks. There are three kinds of tools, which are Intraday Candle Stick Charts,
Level II Quotes/ECN, and Real-Time News Service.
A candle stick chart that displays the high, low, opening and closing prices for a security
for a single day (see Fig.2.2.1). The wide part of the candlestick is called the "real body" and
tells investors whether the closing price was higher or lower than the opening price (black/red if
the stock closed lower, white/green if the stock closed higher). The candlestick's shadows show
the day's high and lows and how they compare to the open and close. A candlestick's shape
varies based on the relationship between the day's high, low, opening and closing prices [9].
Figure 2.2.1. Intraday Candle Stick Charter
Level II is a trading service consisting of real-time access to the quotations of individual
market makers registered in every Nasdaq listed security, as well as market makers' quotes in
OTC Bulletin Board securities. Electronic Communication Network (ECN) is an automated
system that matches buy and sell orders for securities. An ECN connects major brokerages and
individual traders so that they can trade directly between themselves without going through a
middleman. The ECN makes money by charging a fee for each transaction. ECNs make it
possible for investors in different geographic locations to quickly and easily trade with each
20

other. The Securities and Exchange Commission requires ECNs to register as broker-dealers
[10].
Real-time news service is another important tool for stock investors. News moves stocks.
Stock is one of the hottest topic for newspapers. There are thousands newspapers report stocks
market over the world and some well-known newspapers such as Dow Jones, Wall Street Journal
and New York Time have significant influences on world stock market. From 1797 to 1811 in
the United States, the New York Price Current was first published. It was apparently the first
newspaper to publish stock prices, and also showed prices of various commodities. In 1884
the Dow Jones company published the first stock market averages, and in 1889 the first issue of
the Wall Street Journal appeared. As time passed, other newspapers added market pages.
The New York Times was first published in 1851, and added stock market tables at a later date
[11].
2.3 Position Trading (Buy-and-Hold) Strategy
Positioning trading method is one of the most popular trading method on the market.
With positioning trading method, we but the stock and hold to see the how the price goes to
decide either sell some shares of this stock or buy more shares. Also, there are several types of
positioning trading:
Long position
When a trader buys an option contract that he/she is not short, he/she is said to be
opening a long position.
21

When a trader sells an option contract that he/she is already long, he/she is said to be
closing a long position.
When a trader is 'long', he/she wins when the price increases, and loses when the price
decreases.
Short position
When a trader sells an option contract that he/she is not long, he/she is said to be opening
a short position.
When a trader buys an option contract that he/she is already short, he/she is said to be
closing a short position.
When a trader is 'short', he/she wins when the price decreases, and loses when the price
increases.
Net position
Net position is the difference between total open long (receivable) and open short
(payable) positions in a given asset (security, foreign exchange currency, commodity,
etc.) held by an individual. This also refers to the amount of assets held by a person, firm,
or financial institution, as well as the ownership status of a person's or institution's
investments [12].
For this project, we also chose to use short positioning trading, usually, we trading every
one or two days depends on how the market performs.
Many position traders will take a look at weekly or monthly charts to get a sense of
where the asset is in a given trend. Position trading is the polar opposite of day trading because
22

the goal is to profit from the move in the primary trend rather than the short-term fluctuations
that occur day to day. And there are four steps in positioning trading:
The first step is to use low leverage and using 10:1 or less leverage will allow a trader to
stay in the position longer and withstand the day to day fluctuations.
The second step is to go hand in hand with step one and that is to use small position size.
Risking 1% of your trading account on any one position trade. Using 250 to 400 pip stops with
low leverage and low smaller position size opens the door for 1:10 and 1:20 risk to reward
trades.
The third step is to use long time frames like weekly and monthly. By using these time
frames, a trader gets the wider perspective and a more complete picture of where price was and
where it could potentially go.
The fourth step is to be patient and let the market unfold for your trade setup [13].
And there is another method to help us doing positioning trading: channeling (see
Fig.2.3.1). By looking at the channel, we can easily see the trend of a stock and help us to decide
whether or not we should sell the stock.
Figure 2.3.2. Channeling Trading Strategy
23

For example, as we can see in the channeling graph above, the green line show that
during the past period of time, the price of this share of stock kept going up and as a positioning
trader, buying more of this stock will be a good choice.
24

3. Selection of Stocks The selected stocks are mainly chosen from famous companies in electronic and
technology fields. By observing the stock price trend in last year, our group choose ten same
stocks for each individuals to start the stock simulation. The chosen stock are Apple Inc.,
Microsoft Corp., Amazon.com Inc., EBay Inc., Google Inc. C Class, Yahoo! Inc., McDonald’s
Corp., Starbucks Corp., American Airlines Group Inc., and Texas Instruments Inc.. The reasons
to choose stocks from foods, beverages and airline companies is to reduce investment risks.
Based on the researches for stock market, in electronic and technology fields, the market is more
active and profitable but also more risky.
3.1 Apple Inc.
Apple Inc. is an American multinational technology company in California. It designs,
develop and sell electronic products such as Mac line of computers, iPod media player, and
iPhone smart phone and iPad tablets. Also, Apple has online storage service such as iCloud, and
online stores such as iTunes store and App store where customers can music, video and
applications to their Apple electronic devices. Apple was founded and led by previous CEO
Steve Jobs and then became the first U.S. company and World’s second largest information
technology company, and Apple was valued at over $700 billion in the end of 2014. Apple Inc.
has 453 retail store in 16 countries. The stock symbol for Apple Inc. is AAPL. To better
understand its stock price change and make proper investment, we need to review its stock price
trend chart (see Fig.3.1.1).
25

Figure 3.1.3. AAPL Stock Price Trend over Last Three Month
3.2 Microsoft Corp.
Microsoft Corp. is an American multinational technology company in Washington. It
develops, manufactures, licenses and sell software and electronic hardware. Microsoft has
Windows line of operating systems, which has largest amount of users around the world, and
Microsoft Office suites includes Word, Excel, PowerPoint, and Outlook etc., and Internet
Explorer Web browser. In hardware area, Microsoft has its flagship hardware products – Xbox
game consoles, and Microsoft Surface series Tablets. It is the largest software maker measured
by revenue around the world. Meanwhile, it is also one of the most valuable companies in the
26

world. The stock symbol for Microsoft Corp. is MSFT. To better understand its stock price
change and make proper investment, we need to review its stock price trend chart (see Fig.3.2.1).
The reason of choosing Microsoft Stock (MSFT) for investment is that Microsoft has
announced some of new products such as Surface Pro 3 and Surface 3 that obtained huge
commercial successes. In addition, Windows 10 system will come out later in this year. We
believe that, as more new products coming to the market, more investors will buy MSFT stock
and rise the stock price in the future.
Figure 3.2.4. MSFT Stock Price Trend over Last Three Month
27

3.3 Amazon.com, Inc.
Amazon.com Inc. is an American multinational electronic commerce company in Seattle,
Washington. It is the largest online retailer in the United States. Meanwhile, Amazon has
separate retail websites for United Kingdom & Ireland, France, Canada, Germany, The
Netherlands, Italy, Spain, Australia, Brazil, Japan, China, India and Mexico. It also has
international shipping service for certain other countries. Amazon sells almost any products for
people’s daily life such as DVDs, Blurays, CDs, vide downloads/streaming, MP3
downloads/streaming, software, video games, electronics, apparel, furniture, food, toys, and
jewelry. In addition, Amazon.com produces its own electronics such as Amazon Kindle e-book,
Fire tablets, Fire TV and Fire Phone. More important, Amazon’s revenue has reaches US$
88.988 billion in 2014, and its stock symbol is AMZN. To better understand its stock price
change and make proper investment, we need to review its stock price trend chart (see Fig.3.3.1).
The reason we chose trade stocks with Amazon is that Amazon is the largest online
retailer in the United States and has continuously increase profit due to increasing number of
online customers.
28

Figure 3.3.5. AMZN Stock Price Trend over the Last Three Month
3.4 EBay Inc.
EBay Inc. is American multinational corporation and e-commerce company in California,
providing consumer to consumer &business to consumer sales services via Internet. EBay has
the second largest online retailer in the United States – EBay.com. Unlike Amazon selling
products to customer by themselves, EBay provides a platform for sellers and customers. In
2014, EBay obtained US$ 17.90 billion in revenue. The stock symbol of EBay is EBAY. To
better understand its stock price change and make proper investment, we need to review its stock
price trend chart (see Fig.3.4.1).
29

The stock price of EBAY in the last three month are relatively stable and now its price is
in the middle range, which is $58.72 per share. The reason of choosing EBAY is that we want to
EBAY Stock to reduce investment risks.
Figure 3.4.6. EBAY Stock Price Trend over Last Three Month
3.5 Google Inc.
Google Inc. is an American multinational technology company that mainly focus on
Internet-related service and products. These products include online advertising technologies,
search, cloud computing, and software. Its most famous product is Google search engine that has
largest amount users all around the world. Google Chrome web browser and Google Gmail are
30

also widely used in personal computers. In 2014, Google has obtained US$ 66.001 billion in
revenue.
Google announced a 2-for-1 stock split back in January 2014. As a result, Google Stock
was spitted into two parts, which were GOOG stock and GOOGL stock. GOOG Stock represents
Class C shares, while GOOGL Stock represents Class A shares. The difference between Class C
shares and Class A shares is that Class A shares have voting right based on one vote each share
rule. The stock we choose to trade with is Google Class C shares, and its stock symbol is GOOG.
To better understand its stock price change and make proper investment, we need to review its
stock price trend chart (see Fig.3.5.1).
Figure 3.5.7. GOOG Stock Price Trend over the Last Three Month
31

3.6 Yahoo Inc.
Yahoo Inc. (Stock Symbol: YHOO) is a famous American Internet portal and is one of
the most important Internet company in the late 20 th century. It services include search engines,
e-mail service, news, etc. Its services cover 24 countries and regions all over the world. This
company also provide a wide range of network services worldwide over 500 million individual
users. It is also a global Internet communications, commerce and media company.
Yahoo stock price is at the lower level according to its stock price trend over the last
three month (see Fig.3.6.1). We believe that, by choosing Yahoo’s stock at lower price level,
investors will obtain high profit in the future because Yahoo Inc. has huge business in many
different areas not just a website searching company.
Figure 3.6.8. YHOO Stock Price Trend over the Last Three Month
32

3.7 McDonald’s Corp.
The McDonald's Corporation (Stock symbol: MCD) is the world's largest multinational
chain of restaurants, founded in 1940 in the United States. This company has about 30,000
branches. The main selling hamburgers and French fries fried chicken, soft drinks, ice cream,
salad, fruit and other snack foods. McDonald's around the world in 119 countries on six
continents, with approximately 32,000 branches in many countries represents a kind of American
way of life. Because is the first and largest multinational fast-food chain, McDonald's has been a
public debate about food can lead to obesity, corporate ethics and consumer responsibility focus
represents fast food culture.
Being one of the biggest fast food company in the world, McDonald’s Corporation has a
great popularity. As our consideration, this stock will be in rising trend during the next few years
because people always need cheap and fast food and there are few rival firms on the market. To
better understand its stock price change and make proper investment, we need to review its stock
price trend chart (see Fig.3.7.1).
33

Figure 3.7.9. MCD Stock Price Trend over the Last Three Month
3.8 Starbucks Corp.
Starbucks Corporation, (Stock symbol SBUX) is an American chain of coffee company
name, established in 1971, is the world's largest coffee chain. Its headquarters is located in
Seattle, Washington, USA. Starbucks's retail products include 30 kinds of coffee beans,
handmade espresso and a variety of hot and cold coffee drinks, fresh pastries tasty food and a
variety of coffee machines, coffee mugs and other merchandise. Starbucks has nearly 21,300
stores throughout North America, South America, Europe, the Middle East and the Pacific on a
global scale.
34

As we can see from the recent stock trend line below (see Fig. 3.8.1), Starbucks kept
rising during the last few months. And in our everyday life, a lot of us are used to have a cup of
coffee before go to class or work. So from this, we consider coffee has great demand over the
market. Then we chose Starbucks, one of the most famous coffee seller in the world.
Figure 3.8.10. SBUX Stock Price Trend over the Last Three Month
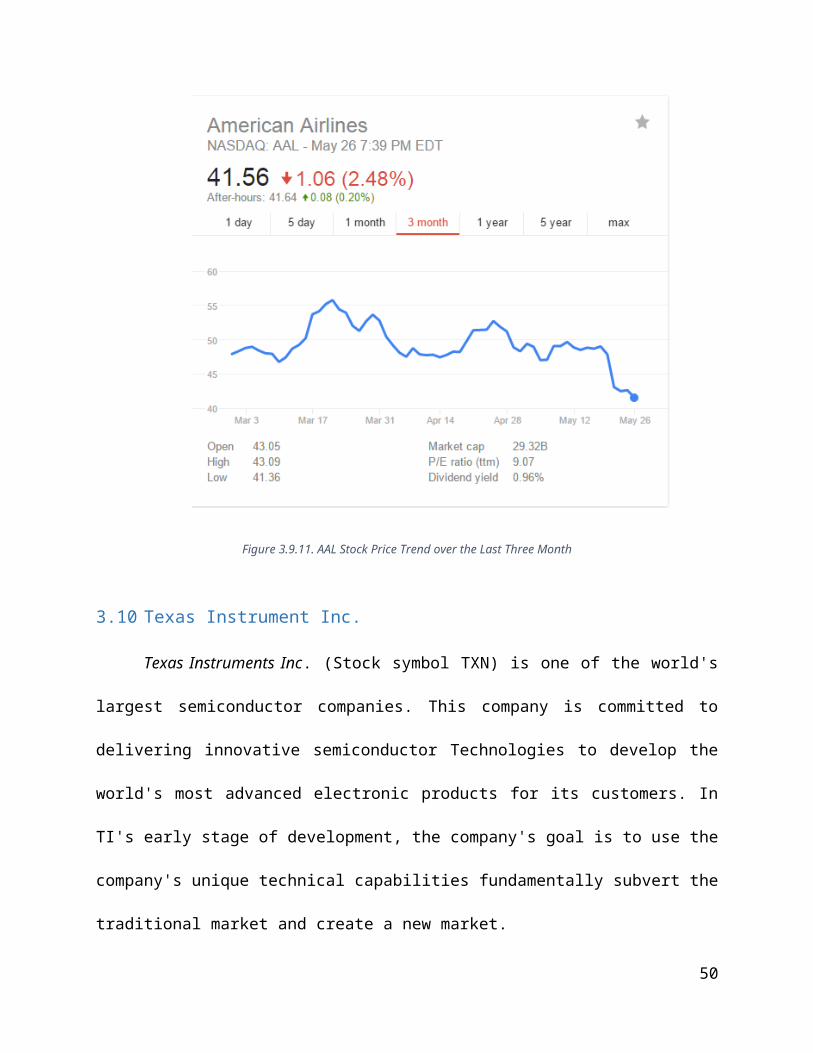
3.9 American Airline Group Inc.
American Airlines, Inc. (Stock symbol AAL) is one of the major airlines in the United
State. American Airlines’ history can be traced back to April 15, 1926 Robertson airlines to open
e-mail from Chicago to St. Louis transport flights. The company is the second company in the
US to contract airmail service. And it later developed into both air freight and air transport.
35

American Airlines is originally a combination of about 82 small airlines and gradually developed
into today’s size.
Although the trend line below (see Fig.3.9.1) shows that the American Airline stock kept
dropping during the last 3 months, we still consider this stock as a choice. The reason why this
stock was not good before is the time. Summer will be a busy season because students are having
summer vocation and the stock price will rise during the busy season.
Figure 3.9.11. AAL Stock Price Trend over the Last Three Month
3.10 Texas Instrument Inc.
Texas Instruments Inc. (Stock symbol TXN) is one of the world's largest semiconductor
companies. This company is committed to delivering innovative semiconductor Technologies to
36

develop the world's most advanced electronic products for its customers. In TI's early stage of
development, the company's goal is to use the company's unique technical capabilities
fundamentally subvert the traditional market and create a new market.
The reason we chose this company is that almost every student use this company’s
calculator. We do not know this company very well and the trend line (see Fig.3.10.1) show that
this company was not in good condition over the last 3 months. But we still want to see how this
stock will go during the summer.
Figure 3.10.12. TXN Stock Price Trend over the Last Three Month
37

4. Day Trading (Buy-and-Sell) Simulations
4.1 Week One Simulation Results
In week one, as Monday is the Memorial Day, we conducted four days stock trade
simulation with selected ten companies by applying day trading strategy, in which we will buy
and sell stocks within same day. Here are some explanations for the key terms such as Net Cost,
Sell Earning, Profit and Cash. Net Cost is calculated as buy price x shares + commission. Sell
Earning is calculated as sell price x shares – commission. In our simulation, we use Investopedia
Simulator which use the default commission as $19.99 per transaction. The start account has
cash value $100,000. Profit is calculated as Sell Earning – Net Cost. Cash means total amount of
cash available for trading stocks with. We record our data as two parts, weekly simulation results
summary in one table and daily trading details in separate tables according to each single day.
The weekly stocks simulation results shows in the following Tables (see Table 4.1.1).
Date Profit Cash26-May -81.9 99918.127-May 80.48 99998.5828-May 222.56 100221.129-May 61.76 100282.9
Table 4.1.1. Week One Day Trading Simulation Results Summary
In order to understand total cash change weekly and guide our investment, we made the
figure of total cash change weekly (see Fig.4.1.1).
38

26 27 28 2999700
99800
99900
100000
100100
100200
100300
100400
99918.1
99998.58
100221.14100282.9
Week One Total Cash Change
Date
Cash
(USD
)
Figure 4.1.13. Week One Total Cash Change
Week One Day one Tuesday, May 26 2015
On day one, we trade with five stocks, which are AAPL, MSFT, GOOG, AMAZON and
MCD. The detailed trading results are shown in below (see Table 4.1.2). Since day trading
investors buy and sell all stock shares within same day, stock shares are only recorded once in
detailed trading results table.
DateSymbo
l Shares Buy Price Net Cost Sell Price Sell Earning ProfitCash
26-May AAPL 100 132.6 13279.99 132.9 13270.01 -9.9826-May MSFT 150 46.83 7044.49 46.79 6998.51 -45.9826-May GOOG 50 538.12 26925.99 538.79 26919.51 -6.4826-May AMZN 50 426.2 21329.99 426.89 21324.51 -5.4826-May MCD 100 98.85 9904.99 99.11 9891.01 -13.98
Total 78485.45 78403.55 -81.9 99918.1
Table 4.1.2. Week Two Day One Day Trading Simulation Results
39

We do not record cash after sell/buy for each stock because these trades are happening
within the same day, and we are able to purchase as long as total cost is smaller than total cash
from previous day.
Week One Day two Wednesday, May 27 2015
On week one day two, we invested less to avoid potential loss which happened in day
one. The detailed trading results are shown in below (see Table. 4.1.3).
Date Symbol Share Buy Price Net Cost Sell Price Sell Earning Profit Cash27-
May AAPL 100 130.1613035.9
9 131.85 13165.01 129.0227-
May MSFT 100 46.82 4701.99 47.59 4739.01 37.0227-
May MCD 150 98.9714865.4
9 98.56 14764.01 -101.4827-
May SBUX 130 51.14 6668.19 51.57 6684.11 15.92
Total39271.6
6 39352.14 80.4899998.58
Table 4.1.3. Week One Day Two Day Trading Simulation Results
Week One Day three Thursday, May 28 2015
On day three, we invested only three stocks after comparing with other stocks. The
detailed trading results are shown in below (see Table. 4.1.4).
Date SymbolShare
s Buy Price Net CostSell
Price Sell Earning ProfitCash
28-May AAPL 150 131.86 19798.99 131.85 19757.51 -41.4828-
May EBAY 200 62.49 12517.99 63.21 12622.01 104.0228-
May GOOG 100 538.11 53830.99 540.11 53991.01 160.02Total 86147.97 86370.53 222.56 100221.1
40
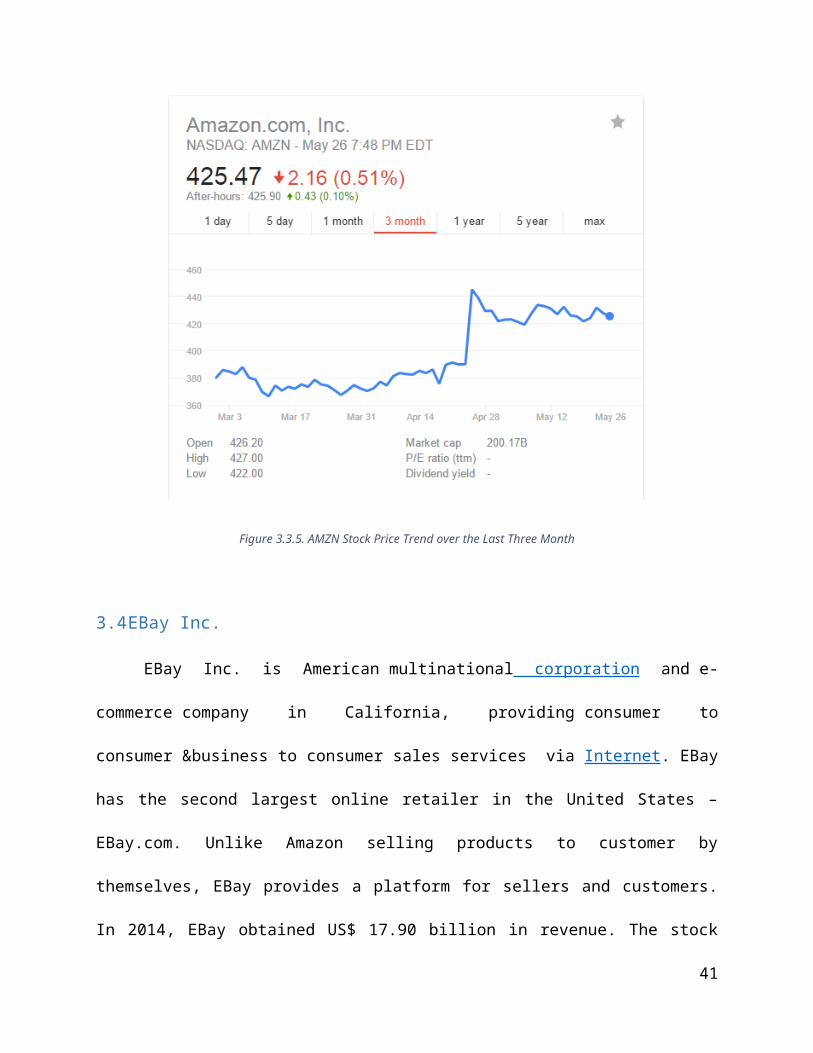
Table 4.1.4. Week One Day Three Day Trading Simulation Results
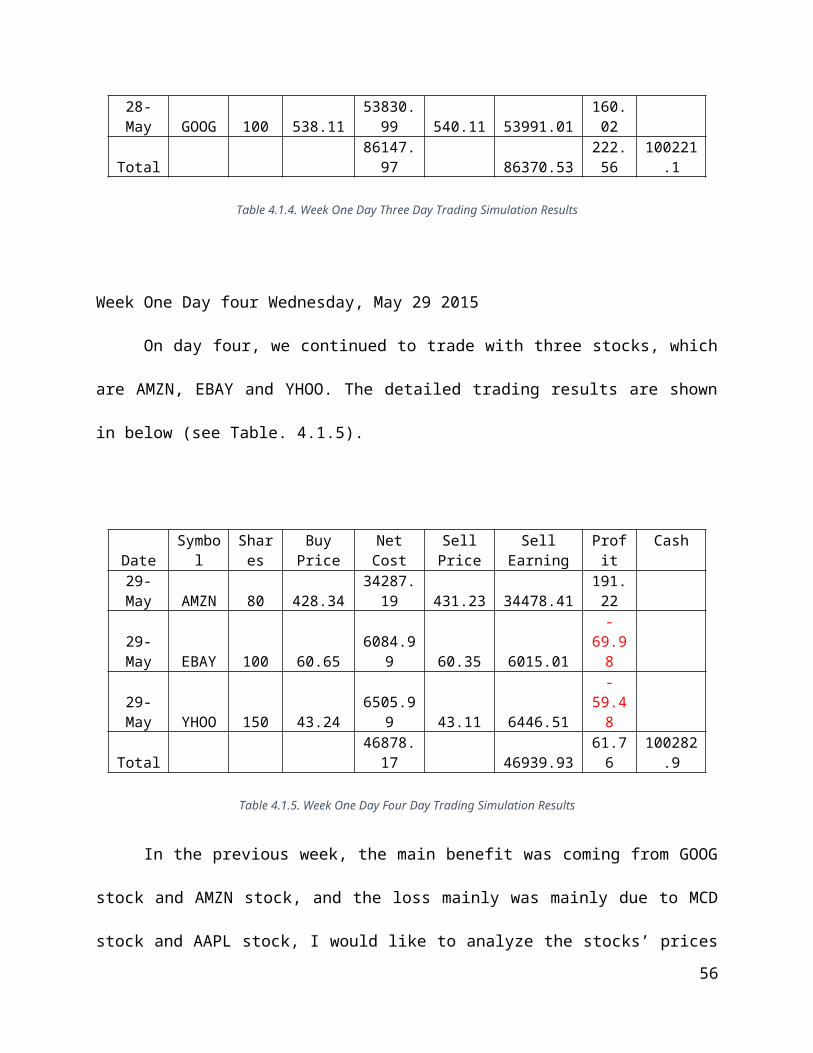
Week One Day four Wednesday, May 29 2015
On day four, we continued to trade with three stocks, which are AMZN, EBAY and
YHOO. The detailed trading results are shown in below (see Table. 4.1.5).
Date SymbolShare
s Buy Price Net CostSell
Price Sell Earning ProfitCash
29-May AMZN 80 428.34 34287.19 431.23 34478.41 191.2229-
May EBAY 100 60.65 6084.99 60.35 6015.01 -69.9829-
May YHOO 150 43.24 6505.99 43.11 6446.51 -59.48Total 46878.17 46939.93 61.76 100282.9
Table 4.1.5. Week One Day Four Day Trading Simulation Results
In the previous week, the main benefit was coming from GOOG stock and AMZN stock,
and the loss mainly was mainly due to MCD stock and AAPL stock, I would like to analyze the
stocks’ prices trend in last week for these four stocks (see Fig. 4.1.2, 4.1.3, 4.1.4, 4.1.5).
41

Figure 4.1.14. GOOG Stock Price Trend in Week One
As shown in Figure 4.2.2, there are two big fluctuations happened in last week. To get
more profit, we should buy GOOG stock between May 26 and May 28, and then sell them before
May 29. In addition, we should buy more GOOG stock in next week because its price is at
almost lowest level.
42

Figure 4.1.15. AMZN Stock Price Trend in Week One
From the Figure 4.1.3, we can see that the AMZN stock price trend is very similar to
GOOG stock price trend, in which, there are three big fluctuations happened in last week.
Therefore, the fluctuation is preferred for more profit but more risky. We need to buy and sell at
proper times to make the difference as gains instead of losses.
43

Figure 4.1.16. AAPL Stock Price Trend in Week One
From the Figure 4.1.4, we can see that there is big price drop happened on May 27. The
stock price in the beginning of the week is little bit lower that the stock price at the beginning.
Overall, one of the big loss from last week is from the price drop on May 27. In addition, the
price drop have a sharp end and rose aback very quickly, which is not preferred by novice stock
investors.
44

Figure 4.1.17. MCD Stock Price Trend in Week One
From the Fig. 4.1.5, we can see that the main price trend for MCD stocks is decreasing,
which causes the loss of the investment. Also, we need to analyze the price trend to sell stocks
that have continuously decreasing price trend.
4.2 Week Two Simulation Results
In week two, we conducted five days trading simulation and the results are shown in the
following table (see Table 4.2.1). Similarly, we record our data as two parts, weekly simulation
results summary and daily trading details. From the weekly simulation results table, we can
easily see the profit for each single trading day and the amount change of cash in account. From
45

daily detailed trading results, we can see the trading details such as buy/sell price, shares and
profit for each stocks daily trading profit.
Date Profit Cash1-Jun 28.58 100311.482-Jun 264.58 100576.063-Jun -13.92 100562.144-Jun -97.32 100464.825-Jun -31.94 100279.54
Table 4.2.6. Week Two Day Trading Simulation Results Summary
In order to understand total cash change weekly and guide our investment, a figure of
week two daily cash change is made (see Fig.4.2.1).
1 2 3 4 5100100100150100200100250100300100350100400100450100500100550100600
100311.48
100576.06 100562.14
100464.82
100279.54
Week Two Total Cash Change
Date
Cash
(USD
)
Figure 4.2.18. Week Two Total Cash Change
Week Two Day one Monday, June 1 2015
On day one, we chose four stocks to trade with, which EBAY, TXN, AAL are and
YHOO. The detailed trading results are shown in below (see Table. 4.2.2)
46

Date Symbol Shares Buy Price Net CostSell Price Sell Earning Profit
Cash
1-Jun EBAY 150 61.55 9252.49 62.43 9344.51 92.021-
Jun TXN 100 56.13 5632.99 55.71 5551.01 -81.981-
Jun AAL 100 43.35 4354.99 44.23 4403.01 48.021-
Jun YHOO 150 43.05 6477.49 43.12 6448.01 -29.48Total 25717.96 25746.54 28.58 100311.48
Table 4.2.7. Week Two Day One Day Trading Simulation Results
Week Two Day two Tuesday, June 2 2015
On day two, we continue to trade with four stocks includes AMZN, AAL, EBAY and
GOOG. The detailed trading results are shown in below (see Table 4.2.3).
DateSymbo
l SharesBuy Price Net Cost Sell Price
Sell Earning Profit
Cash
2-Jun AMZN 50 430.71 21555.49 432.21 21590.51 35.022-Jun AAL 100 43.55 4374.99 43.72 4352.01 -22.982-Jun EBAY 150 62.1 9334.99 62 9280.01 -54.982-Jun GOOG 50 532.23 26631.49 539.18 26939.01 307.52Total 61896.96 62161.54 264.58 100576.06
Table 4.2.8. Week Two Day Two Day Trading Simulation Results
Week Two Day three Wednesday, June 3 2015
On day three, we traded with AMZN and GOOG that earned benefits from previous day,
and two other stocks, which are MSFT and YHOO. The detailed trading results are shown in
below (see Table 4.2.4).
Date Symbol Shares Buy Price Net CostSell Price Sell Earning Profit
Cash
3-Jun AMZN 100 435.26 43545.99 436.59 43639.01 93.023- GOOG 50 539.91 27015.49 541.39 27049.51 34.02
47

Jun3-
Jun MSFT 100 47.37 4756.99 46.85 4665.01 -91.983-
Jun YHOO 100 43.3 4349.99 43.21 4301.01 -48.98Total 79668.46 79654.54 -13.92 100562.14
Table 4.2.9. Week Two Day Three Day Trading Simulation Results
Week Two Day four Thursday, June 4 2015
On day four, we chose stocks that have lower price per share to reduce the investment
risk. The detailed trading results are shown in below (see Table 4.2.5).
DateSymbo
l Shares Buy Price Net CostSell
Price Sell Earning ProfitCash
4-Jun AAPL 100 129.12 12931.99 129.36 12916.01 -15.984-Jun AAL 100 42.99 4318.99 42.17 4197.01 -121.984-Jun AMZN 80 434.4 34771.99 436.17 34873.61 101.624-Jun YHOO 100 43.09 4328.99 42.88 4268.01 -60.98Total 56351.96 56254.64 -97.32 100464.82
Table 4.2.10. Week Two Day Four Day Trading Simulation Results
Week Two Day five Friday, June 5 2015
On day five, we chose three stocks to trade with because, from last week experience, it is
more possible to loss on last day of the week. The detailed trading results are show in below (see
Table 4.2.6).
Date Symbol Shares Buy Price Net CostSell Price Sell Earning Profit
Cash
5-Jun MCD 100 95.93 9612.99 95.62 9542.01 -70.985-
Jun SBUX 150 51.57 7755.49 52.19 7808.51 53.025-
Jun MSFT 100 46.31 4650.99 46.57 4637.01 -13.98
48

Total 22019.47 21987.53 -31.94 100279.54
Table 4.2.11. Week Two Day Five Day Trading Simulation Results
In the precious week, the main losses were from AAPL, MSFT, MCD and AAL stocks.
Therefore, it is necessary to analyze the price trend for these stocks in week two to find the
reasons (see Fig. 4.2.2, 4.2.3, 4.2.4, 4.2.5).
Figure 4.2.19. AAPL Stock Price Trend in Week Two
As shown in Figure 4.2.2, the price trend of AAPL stock was continuously drop over
week two. We should avoid to invest on stocks that have this type price trend. Since Apple has
announced any new products recently, there is no incentive to more investors to buy its stock. In
addition, the price of AAPL Stock has reached a highest point at the end of week one. Therefore,
49
to avoid stock that has continuously decreasing price trend, we should avoid to buy stocks which
prices are at high level.
Figure 4.2.20. MSFT Stock Price Trend in Week Two
From the Figure 4.2.3, we can see that the price trend of MSFT stock is matched with the
account value change. There is “U” shape between June 2 and June 3, and it is the only proper
time in week two to make investment. After June 3, the stock price is continuously dropping,
which is the reason for the total losses in week two.
50

Figure 4.2.21. MCD Stock Price Trend in Week Two
From the Figure 4.2.4, we can see many fluctuations in price trend of MCD stock in week
two. There is a sharp rise at the beginning of week two and gradual dropping in the end of week
two. It is not preferred to invest stocks that has this type of price trend. However, the entire trend
of MCD stock in this week is “N” shape and stock price is at lowest level, therefore, we are
supposed to predict that another “U” shape will happen in next week. So, it is worth to buy more
shares of MCD stock to earn benefits in week three.
51

Figure 4.2.22. AAL Stock Price Trend in Week Two
From the Figure 4.2., we can see that the price trend of AAL stock is also matched with
the account value change figure. There is increasing price trend at the first half of week two and
decreasing price trend at the second half of week two.
Overall, in week two, the price trends of trading stocks are “U” shape, which means that
investors should invest more at beginning of the week to earn more profit and invest less at the
second half of the week to avoid potential losses. In addition, from the experience of two weeks
trading simulation, the amount change of daily stock trading should be increased rather than
small adjustments.
52

4.3 Week Three Simulation Results
In week three, we conducted five days simulation with day trading method. The
simulation results were record in below table (see Table 4.3.1). In order to maximize our trading
profit, we decided to hold stocks for more profit instead of selling all stocks at the end of each
day.
From the simulation results, we can see that it is easier to obtain profit because we
monitor price change all the time and seek for the price difference to buy/sell. We usually sell
out our stock even with a small amount of loss to keep our profit as we are not sure about the
next day’s price trend.
Date Profit Cash8-Jun 204.56 100637.449-Jun 128.06 100765.510-Jun -21.92 100743.5811-Jun 173.06 100916.6412-Jun 54.02 100970.66
Table 4.3.12. Week Three Day Trading Simulation Results Summary
In order to understand total cash change weekly and guide our investment, we made the
figure of total cash change weekly (see Fig.4.3.1).
53

8 9 10 11 12100400
100500
100600
100700
100800
100900
101000
100637.44
100765.5 100743.58
100916.64100970.66
Week Three Total Cash Change
Date
Cash
(USD
)
Figure 4.3.23. Week Three Total Cash Change
Week Three Day one Monday, June 8 2015
On day one, we traded with three stocks including AMZN, AAPL, and YHOO. The
detailed trading results are show in below (see Table 4.3.2). We record buy/sell price, shares,
total cost and earning, total profit and cash. The reason we only record total cash is that we are
able to purchase stocks as long as the net cost is smaller than the cash form last week.
DateSymbo
l Shares Buy Price Net CostSell
PriceSell
Earning Profit Cash8-Jun AMZN 100 422.42 42261.99 423.71 42351.01 89.028-Jun AAPL 150 127.35 19122.49 128.24 19216.01 93.528-Jun YHOO 200 42.04 8427.99 42.35 8450.01 22.02Total 69812.47 70017.03 204.56 100637.44
Table 4.3.13. Week Three Day One Day Trading Simulation Results
Week Three Day two Tuesday, June 9 2015
54

On day two, we were continuing to trade with three stocks, AAPL, MSFT and AMZN.
The detailed trading results are show in below (see Table 4.3.3).
Date SymbolShare
s Buy Price Net Cost Sell Price Sell Earning Profit Cash9-
Jun AAPL 100 126.34 12653.99 126.83 12663.01 9.029-
Jun MSFT 150 45.94 6910.99 45.76 6844.01 -66.989-
Jun AMZN 100 422.96 42315.99 425.22 42502.01186.0
2
Total 61880.97128.0
6 100765.5
Table 4.3.14. Week Three Day Two Day Trading Simulation Results
Week Three Day three Tuesday, June 10 2015
On day three, we decide to trade with more stocks with lower total cost to reduce
investment risk. The detailed trading results are show in below (see Table 4.3.4).
Date Symbol SharesBuy Price Net Cost
Sell Price Sell Earning Profit Cash
10-Jun EBAY 100 60.94 6113.99 60.47 6027.01 -86.9810-Jun MCD 100 95.01 9520.99 95.3 9510.01 -10.9810-Jun SBUX 100 51.66 5185.99 52.69 5249.01 63.0210-Jun GOOG 50 536.35 26837.49 537.41 26850.51 13.02
Total 47658.46 47636.54 -21.92 100743.58
Table 4.3.15. Week Three Day Three Day Trading Simulation Results
Week Three Day four Tuesday, June 11 2015
55
On day four, we trade with less stocks and less shares since the previous experience
telling us that it is easier to loss in the second half of each week. The detailed trading results are
show in below (see Table 4.3.5).
DateSymbo
l Shares Buy Price Net Cost Sell PriceSell
Earning Profit Cash11-Jun AAL 100 40.12 4031.99 41.05 4085.01 53.0211-Jun AMZN 50 432.39 21639.49 436.21 21790.51 151.0211-Jun MCD 100 95.5 9569.99 95.59 9539.01 -30.98Total 35241.47 35414.53 173.06 100916.64
Table 4.3.16. Week Three Day Four Day Trading Simulation Results
Week Three Day five Tuesday, June 12 2015
On day five, we were expecting that the stock market main trend was loss. Therefore, we
only invest one stock with more shares so that we can pay more attention about the price change
to earn profit. The detailed trading results are show in below (see Table 4.3.6).
Date Symbol SharesBuy Price Net Cost
Sell Price Sell Earning
Profit Cash
12-Jun SBUX 200 52.16 10451.99 52.63 10506.01 54.02
Total 10451.99 10506.01 54.02 100970.66
Table 4.3.17. Week Three Day Five Day Trading Simulation Results
We were experiencing a minor loss mainly from the investment of stocks MSFT and
EBAY. Therefore, we would like to analyze the price trend of these three stocks in last week (see
Fig. 4.3.2, 4.3.3).
56

Figure 4.3.24. MSFT Stock Price Trend in Week Three
From the Figure 4.3.2, we can see the price change of MSFT stock has a big rise on June
10. However, the loss happened for our stock was on June 9 since there were relatively small
price drop at the end of June 9, compared with price rise on June 10. Therefore, in the future, we
should hold some stocks shortly to earn profits. In addition, small fluctuation can also cause a
noticeable loss with trading lots of shares.
57

Figure 4.3.25. EBAY Stock Price Trend in Week Three
In Figure 4.3.3, we can see that the main price trend was dropping after first day of the
week. For the stock with this type of price trend, it is harder to get profits as there are no big
price rising curve. Usually, after price dropping, there should be a price rising period right after
but this one is different from the usual case.
4.4 Week Four Simulation Results
In week four, we conducted a five-day day trading simulation via Investopedia simulator.
Form the precious trading experience, we believed that the main price trend would rise on first
half of the week and then drop on the second half. Therefore, we chose to trade more on first half
of the week and then trade less. The week four simulation results are shown in below table (see
58

Table 4.4.1). In the future, we decide to buy less stocks with more shares for each stock because
commission fee ($19.99) will take high percentage if we buy more stocks with less shares per
stock.
Date Profit Cash15-Jun 69.08 101039.7416-Jun 174.58 101214.3217-Jun 97.56 101311.8818-Jun 1131.06 102442.9419-Jun -306.46 102136.48
Table 4.4.18. Week Four Day Trading Simulation Results Summary
In order to understand total cash change weekly and guide our investment, we made the
figure of total cash change weekly (see Fig.4.4.1).
15 16 17 18 19100000
100500
101000
101500
102000
102500
103000
101039.74 101214.32 101311.88
102442.94102136.48
Week Four Total Cash Change
Date
Cash
(USD
)
Figure 4.4.26. Week Four Total Cash Change
Week Four Day one Monday, June 15 2015
On day one, we started to trade with four stocks, which were AAPL, AMZN, GOOG and
YHOO stocks. The detailed trading results are shown in below table (see Table 4.4.2).
59

Date Symbol SharesBuy Price Net Cost
Sell Price Sell Earning Profit Cash
15-Jun AAPL 100 126.12 12631.99 127.01 12681.01 49.0215-Jun AMZN 50 425.65 21302.49 427.12 21336.01 33.5215-Jun GOOG 50 528 26419.99 528.22 26391.01 -28.9815-Jun YHOO 150 94.55 14202.49 94.92 14218.01 15.52
Total 74556.96 74626.04 69.08 101039.74
Table 4.4.19. Week Four Day One Day Trading Simulation Results
Week Four Day two Tuesday, June 16 2015
On day two, we continued to trade with four stocks, which were MSFT, YHOO, EBAY
and SBUX stocks. The detailed trading results are shown in below table (see Table 4.4.3).
DateSymbo
l Shares Buy Price Net Cost Sell PriceSell
Earning Profit Cash16-Jun MSFT 150 45.38 6826.99 45.52 6808.01 -18.9816-Jun YHOO 200 40.35 8089.99 41.22 8224.01 134.0216-Jun EBAY 100 60.01 6020.99 60.55 6035.01 14.0216-Jun SBUX 150 52.55 7902.49 53.12 7948.01 45.52Total 28840.46 29015.04 174.58 101214.32
Table 4.4.20. Week Four Day Two Day Trading Simulation Results
Week Four Day three Wednesday, June 17 2015
On day three, we traded with three stocks to reduce potential risks based on our previous
trading experience. We were continuous earning profits from our investment. However, there is
no high profit (over hundred dollars for each single stock trade) because we buy/sell over a short
period, in which, it is less possible to see high price change. The detailed trading results are
shown in below (see Table 4.4.4).
60

Date Symbol SharesBuy Price Net Cost
Sell Price Sell Earning Profit Cash
17-Jun EBAY 200 60.55 12129.99 60.92 12164.01 34.0217-Jun MCD 200 94.6 18939.99 95.22 19024.01 84.0217-Jun TXN 150 53.31 8016.49 53.44 7996.01 -20.48
Total 39086.47 39184.03 97.56 101311.88
Table 4.4.21. Week Four Day Three Day Trading Simulation Results
Week Four Day four Thursday, June 18 2015
On day four, we were continuing to choose three stocks to trade, which were MSFT,
GOOG and AMZN stocks. The trade with GOOG and AMZN stocks brought us profits of
$418.42 and $677.62 respectively. The detailed trading results are shown in below (see Table
4.4.5).
DateSymbo
l SharesBuy Price Net Cost Sell Price
Sell Earning Profit Cash
18-Jun MSFT 150 46.22 6952.99 46.72 6988.01 35.0218-Jun GOOG 80 531 42499.99 536.73 42918.41 418.4218-Jun AMZN 80 430.42 34453.59 439.39 35131.21 677.62Total 83906.57 85037.63 1131.06 102442.94
Table 4.4.22. Week Four Day Four Day Trading Simulation Results
Week Four Day five Friday, June 19 2015
On day five, we decided to trade less to avoid loss because it has a high possibility to loss
on Friday from previous trading experience. However, we still lost $306.46 on Friday. The
reason that we sell stocks with losses is to avoid potential big losses. The detailed trading results
are shown in below (see Table 4.4.6).
61

Date Symbol SharesBuy Price Net Cost Sell Price Sell Earning Profit Cash
19-Jun MCD 200 54.08 10835.99 53.93 10766.01 -69.9819-Jun AMZN 50 440.26 22032.99 436.33 21796.51
-236.48
Total 32868.98 32562.52-
306.46 102136.48
Table 4.4.23. Week Four Day Five Day Trading Simulation Results
Since the most of profits we earned in this week were from trading with GOOG and AMZN
stocks on day four. It is necessary to analyze the price trends for these two stocks in last week
(see Fig.4.3.2 and Fig.4.3.3).
Figure 4.4.27. GOOG Stock Price Trend in Week Four
62

As shown in Figure 4.4.2, for GOOG stock in week four, there was a big price rising
happened on June 18. In addition, the main price trend for GOOG stock in week four are rising.
This type of price trend is preferred because we usually trade more in earlier time of each week
and trade less in later of each week. On June 18, GOOG stock price rose from $530.79 to
$538.15.
Figure 4.4.28. AMZN Stock Price Trend in Week Four
From the Figure 4.4.3, we can see that the price trend of AMZN stock in week four is
very similar to GOOG stock price trend. The both main trends were rising and high price rising
happened on June 18. For AMZN stock, its price on June 18 has lowest price $429.40 and
highest price $439.73.
63

4.5 Week Five Simulation Results
In week five, we conducted a five-day stock trading simulation with Investopedia
simulator. In this week, we decide to trade less stocks with more shares per stock. Therefore, we
are able to pay more attention to the stock price change. Also, the commission fee will take less
weight in total profit. From the previous trading experience, we realized that day trading method
(trading very frequently) is relatively easier to earn profit but more time consuming because we
need to monitor stocks price change all the time and trade much more frequently. The detailed
week five trading summary is shown in below table (see Table 4.5.1).
Date Profit Cash22-Jun 286.46 102422.9423-Jun 737.86 103160.824-Jun 115.04 103275.8425-Jun 94.04 103369.8826-Jun -28.96 103340.92
Table 4.5.24. Week Five Day Trading Simulation Results Summary
In order to understand the trend of total cash change in week five, we made the figure of
total cash change weekly (see Fig.4.5.1).
22 23 24 25 26101800
102000
102200
102400
102600
102800
103000
103200
103400
103600
102422.94
103160.8103275.84
103369.88 103340.92
Week Five Total Cash Change
Date
Cash
(USD
)
64

Figure 4.5.29. Week Five Total Cash Change
Week Five Day one Monday, June 22 2015
On day one, we chose three stock to trade with, which were MCD, AMZN and GOOG.
This time, we traded more shares per stock. We earned $236.02 from GOOG stock, and the
buy/sell price difference was $2.95.The detailed trading results are shown in below (see
Table.4.5.2).
DateSymbo
l Shares Buy Price Net Cost Sell PriceSell
Earning Profit Cash22-Jun MCD 100 96.31 9650.99 96.87 9667.01 16.0222-Jun AMZN 80 436.32 34925.59 437.25 34960.01 34.4222-Jun GOOG 80 538.65 43111.99 542.1 43348.01 236.02Total 87688.57 87975.03 286.46 102422.94
Table 4.5.25. Week Five Day One Day Trading Simulation Results
Week Five Day two Tuesday, June 23 2015
On day two, we continued to trade with three stocks, which were YHOO, AMZN and
TXN stocks. We earned $736.82 from AMZN stock, and the buy/sell price difference was
$9.21. The detailed trading results are shown in below (see Table. 4.5.3)
Date SymbolShare
s Buy Price Net CostSell Price Sell Earning Profit Cash
23-Jun YHOO 150 40.62 6112.99 40.75 6092.51 -20.4823-Jun AMZN 80 436.11 34908.79 445.82 35645.61 736.8223-Jun TXN 150 54.82 8242.99 55.23 8264.51 21.52Total 49264.77 50002.63 737.86 103160.8
Table 4.5.26. Week Five Day Two Day Trading Simulation Results
65

Week Five Day three Wednesday, June 24 2015
On day three, we chose only two stocks to trade with, which were AAPL and EBAY.
Form the detailed trading results on day three and day four (see Table. 4.5.4 and Table 4.5.5), we
can see that the lower price stock has less possibility to have a big buy/sell prices difference.
Therefore, we need to buy more shares for the low price stock to earn more profits. Meantime,
Trading with high price stocks is more risky due to the big buy/sell price difference.
DateSymbo
l Shares Buy Price Net Cost Sell PriceSell
Earning Profit Cash24-Jun AAPL 150 127.91 19206.49 128.85 19307.51 101.0224-Jun EBAY 200 62.02 12423.99 62.29 12438.01 14.02Total 31630.48 31745.52 115.04 103275.84
Table 4.5.27. Week Five Day Three Day Trading Simulation Results
Week Five Day four Thursday, June 25 2015
Date Symbol SharesBuy Price Net Cost
Sell Price Sell Earning
Profit Cash
25-Jun SBUX 200 54.09 10837.99 54.4 10860.01 22.0225-Jun TXN 200 53.83 10785.99 54.39 10858.01 72.02
Total 21623.98 21718.02 94.04 103369.88
Table 4.5.28. Week Five Day Four Day Trading Simulation Results
Week Five Day five Friday, June 26 2015
On day five, we traded with two stocks, which were MCD and GOOG. We lost about a
hundred dollars from the trading with GOOG stock. The detailed trading results are show in
below (seeTable.4.5.6).
66
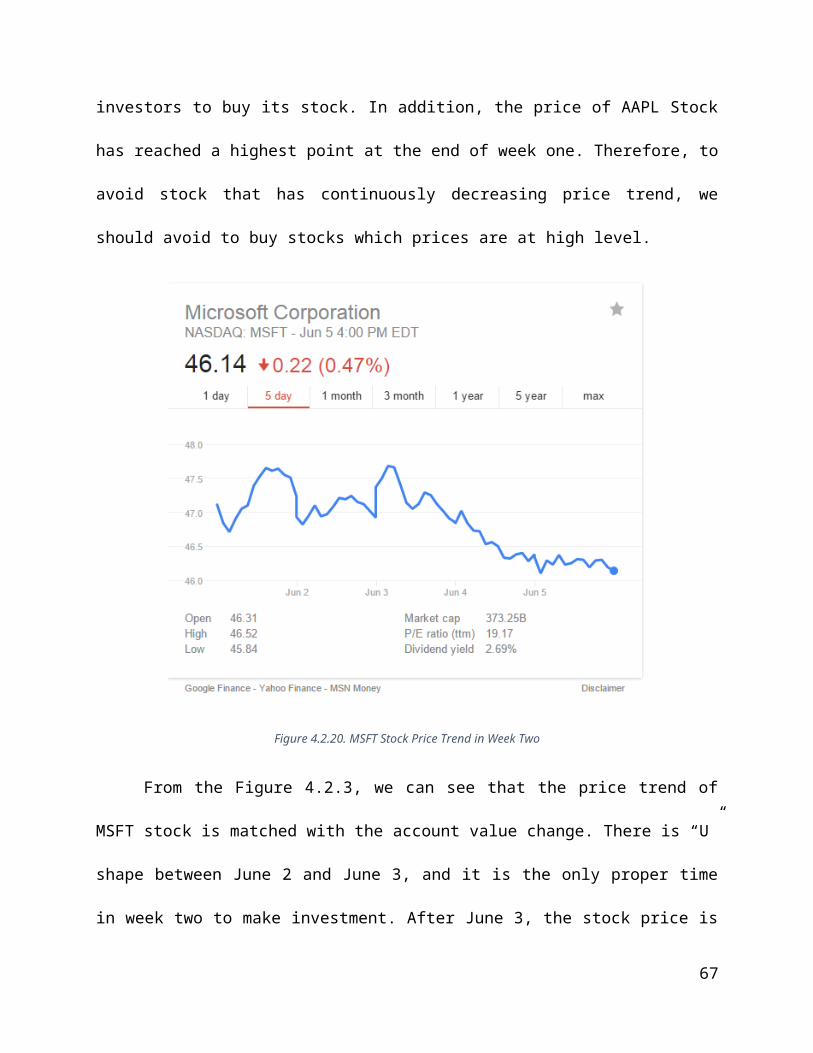
Date Symbol SharesBuy Price Net Cost
Sell Price Sell Earning Profit Cash
26-Jun MCD 100 96.13 9632.99 97.22 9702.01 69.0226-Jun GOOG 100 535.44 53563.99 534.86 53466.01 -97.98
Total 63196.98 63168.02 -28.96 103340.92
Table 4.5.29. Week Five Day Five Day Trading Simulation Results
In week five, the main trading profits were coming from GOOG stock trading on day
one, and AMZN stock trading on day two. The main loss was caused due to GOOG stock trading
on day five. Therefore, it is necessary to analyze the price trend of GOOG stock (see Fig. 4.5.2)
and AMZN stock (see Fig.4.5.3) in week five.
Figure 4.5.30. GOOG Stock Price Trend in Week Five
67

From the Figure 4.5.2, we can see that on June 22, the difference of high and low price is
about three dollars. Since we bought 80 shares of GOOG stock in the day one morning and sold
all in the noon, we earned $236.02 from the trading. Start from June 25, the main price trend of
GOOG was dropping, which caused the loss.
Figure 4.5.31. AMZN Stock Price Trend in Week Five
In above Figure 4.5.3, we can see that on June 23, the AMZN stock price difference at
highest and lowest was more than $10. We traded 80 shares on day two and earned $736.82. This
is the most profitable over the last five weeks simulation. The main price trend of AMZN stock in week
five was “n” shape, which is preferred in stock investment.
68
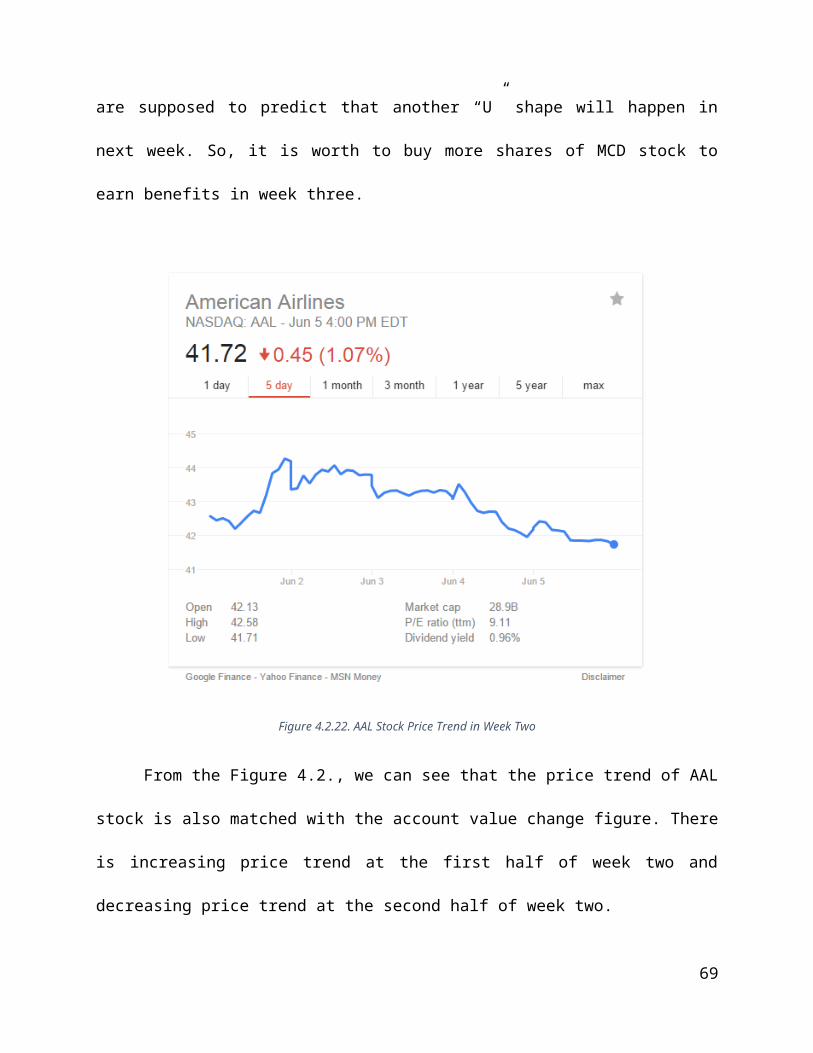
5. Position Trading (Buy-and-Hold) Simulations
5.1 Week One Simulation Results
In the last week, we only simulated for 4 days because Monday was the Memorial Day.
Since it was the first week of the simulation, the total earned was about 400 dollars, which was
not so much. But this week’s experience of trading helped me to learn the trading system better
and I think the profit will keep going up in the next few weeks. When I decide to buy a stock, the
market will not respond immediately and only shows ‘buy market’. So it is also important to
predict how the stock trend line goes.
Also from this week’s simulation, I found that the stock price was not steady at all. If one
stock’s price increased 2 percent on the first day, the price could drop by 3 percent or more the
very next day. And as a stock trader, what we want is definitely earn more money. So a good
choice to decide whether we should buy or sell a share of stock is to look into the stock price
trend line over the past several weeks or even months, so that we can predict the future price
more precisely. And the stock simulating results are shown in the following table: (See Table
5.1.1)
Date Profit ($) Cash ($)5/26/2015 0 6084.15/27/2015 -11.89 7728.625/28/2015 -16.28 6018.615/29/2015 -4.77 1660.83
Table 5.1.30.Positioning Trading Week One Simulation Results
Week One Day one Tuesday, May 26 2015
69

This was the first day of the simulation. I bought stock from 10 companies: APPLE INC;
MICROSOFT CORP; AMAZON.COM INC; EBAY INC; GOOGLE INC; YAHOO INC;
MCDONALD'S CORP; STARBUCKS CORP; AMERICAN AIRLINES GROUP INC and
TEXAS INSTRUMENTS INC. Since my trading method was positioning trading and it was the
first day of the whole simulation, I did not make any changes of the stock. And the result of the
first day is shown in below table (see Table 5.1.2).
Week One
Date Symbol Buy Price
Shares Net Cost cashday1 May-26 AAPL 130.59 50 6549.49
May-26 MSFT 46.43 100 4662.99May-26 GOOG 530.97 50 26568.4
9May-26 AMZN 425.44 50 21291.99May-26 MCD 98.25 100 9844.99
May-26 EBAY 59.05 100 5924.99May-26 YHOO 42.86 100 4305.99May-26 SBUX 50.99 100 5118.99May-26 AAL 41.69 100 4188.99May-26 TXN 54.39 100 5458.99
sum 93915.9 6084.1
Table 5.1.31.Positioning Trading Week One Day One Simulation Results
The Week One Day two Wednesday, May 27 2015
On the second day, all of the stock prices increased, which indicated that the choice of the
company was successful. Most of the stock prices increase by about 1%, but the American
Airline increase over 2% and McDonald’s Corp almost remained the same. And I think
American Airline will perform well in the next few days. So I decided to buy 30 shares of
American Airline and sell 30 shares of McDonald’s Corp. (See Table 5.1.3)
DateSymbo
l Buy/sell Price Shares Net Cost Sell Earning Profit Total Profit cash
70

May-27 AAL 42.37 30 1291.09May-27 MCD 98.52 30 2935.61 -11.89 -11.89 7728.62
Table 5.1.32.Positioning Trading Week One Day Two Simulation Results
Week One Day three Thursday, May 28 2015
The third day of the simulation was definitely a bad day. All the stock prices except
EBAY and STARBUCKS decreased. The stock price of McDonald’s Corp decreased about 2%
and this showed that the selling action on the first day was correct. Although most of the stock
prices dropped, only MCD’s total gain is negative. And for this day, I decided to sell 40 shares of
YAHOO INC. (See Table 5.1.4)
DateSymbo
l Sell Price Shares Sell Earning profitTotal Profit cash
May-28 YHOO 43.25 40 1710.01 -4.39 -16.28 6018.61
Table 5.1.33.Posotioning Trading Week One Day Three Simulation Results
Week One Day four Friday, May 29 2015
On the fourth day of the simulation, MCD still goes down as it did in the last 2 days.
During this day, four companies’ stock price went up and six went down. And after four days of
simulation, the total account value was $100,379.35. The original value was $100,000. So for the
first week, the total gain was 0.379%, which was acceptable. At the same time, the total profit
was $55.2. And I decided to buy 15 shares of AMZN and sell 50 shares of AAL. (See Table
5.1.5)
DateSymbo
l Buy/sell Price Shares Net Cost Sell Earning Profit Total Profit cashMay-29 AMZN 428.92 15 6453.79
71

May-29 AAL 42.32 50 2096.01 11.51 -4.77 1660.83
Table 5.1.34.Positioning Trading Week One Day Four Simulation Results
In the previous week of simulation, the MCD kept dropping for 3days and the gain is
mostly from Starbucks, eBay and Amazon. I will analysis the stock price trend line and historical
prices of those stocks and find out whether I should but more shares or sell some shares.
McDonald’s Corp.
Figure 5.1.32.MCD Stock Price Trend Line
As we can see from the trend line (See Figure 5.1.1), the price of this stock increased a
little bit on May 27 but kept deceasing during the next three days. It decreased about $2.5 per
share in just 3 days and caused the profit loss in simulation. When we look into the historical
72

price of this stock, we also found that the stock price did not fluctuate much during a day, which
means this decreasing trend could continue in the next week. At the same time, the highest price
throughout the four days was 99.20, which was just $0.35 higher than the purchase price.
Amazon.com INC.
Figure 5.1.33.AMZN Week One Share Price Trend Line
For Amazon.com, I choose to analysis 1 month of the trend line (See Figure 5.1.2). The
stock price of Amazon fluctuates quite a lot these days, but from the 1-month trend line, we can
see that the stock shows an increase trend. And this trend is more obvious when it comes to 5
year. As online shopping becoming more and more popular, people are more likely to choose
shopping on website because of the convenience it brings. Also from the historical price chart,
we can see that both the highest price and the lowest price of the day kept increasing during the
73
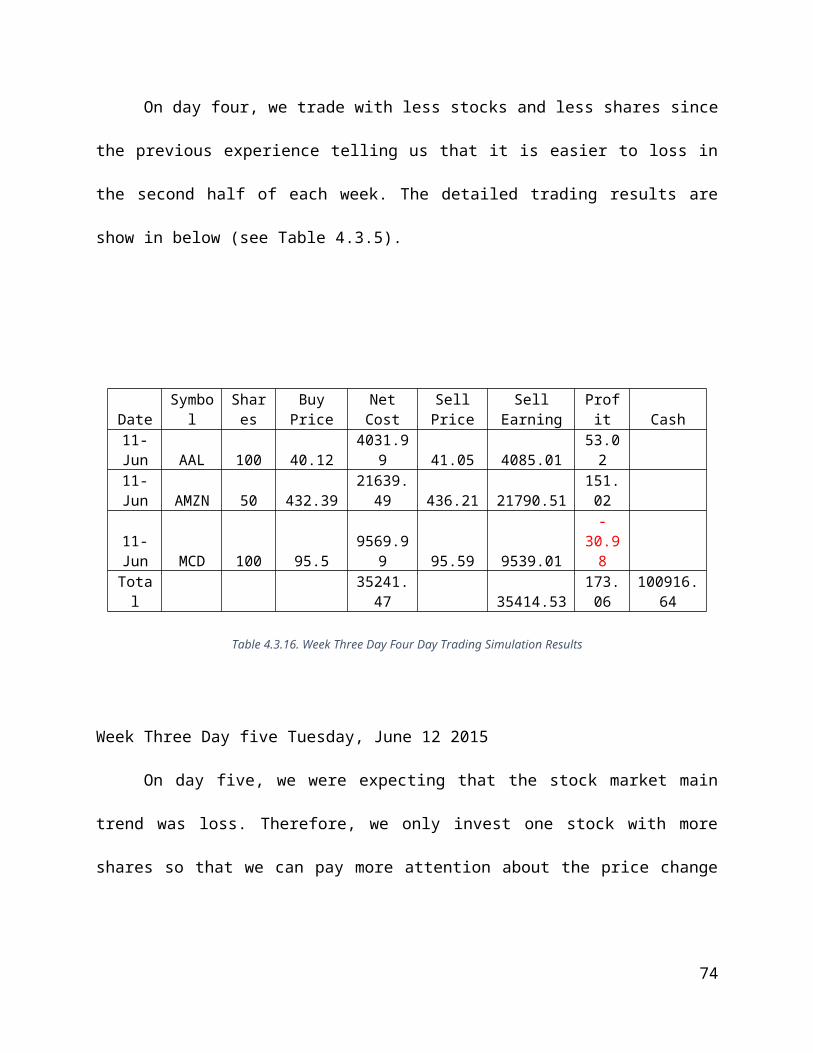
four days and this gives me a good expectation of this stock. But since this stock’s price
fluctuates quite a lot, I chose to wait and see it performance in the next week to decide whether
to buy or sell.
EBAY INC.
Figure 5.1.34.EBAY Week One Share Price Trend Line
It is pretty obvious from the 5-day trend line (See Figure 5.1.3) that EBAY’s stock price
has an increasing trend, especially in the last three days. The trend line shows almost a linear
shape, which indicates that this stock increased in every single day in the last week. And as an
online shopping website, this company also has a bright future. Furthermore, as we can see in the
historical price chart, the close price of this stock kept increasing during the last week. And it’s
74

the same with the lowest price of day. So I will buy some shares if this company still performs
well in the next week.
STARBUCKS CORP.
Figure 5.1.35.SBUX Week One Share Price Trend Line
From the 1-month trend line above (See Figure 5.1.4), we can easily see that the stock
price increased about 3 dollars in the last 20 days. But the price trend line became smoother these
days, so we do not know if this stock will decrease in the next week. A lot of people are used to
drink a cup of coffee before they go to work. So Starbucks has a large amount of demand over
the market. In the long term, the stock price will definitely goes up, but it is not for sure in the
75

short run. Also from the historical price chart, we can find that almost every single column
shows an increasing trend. Although this stock helped me to earn some profit, I will still sell
some shares if it perform bad in the next week.
5.2 Week Two Simulation Results
In week two, we simulated for 5 days. And after analyzing each of the stock we chose, I
made some significant decisions on some of them. Because of the bad performance of MCD, I
chose to sell half the stock I have and wait to see if the price will go up again. At the same time,
we also record the sell/ buy action we made as a reference. And the simulation results of the
second week are shown in the following table. (See Table 5.2.1)
Date Profit Cash2015/6/1 -4.77 1660.832015/6/2 -4.77 1660.832015/6/3 -4.77 1660.832015/6/4 -95.96 2366.652015/6/5 -134.15 1722.27
Table 5.2.35.Positioning Trading Week Two Simulation Results
Week Two Day one Monday, June 1 2015
Since this is a new week, I do not know what will happen on the stock market. So I
decided to make no change on the first day and to see if I need to sell or buy some of the stock.
From the last week’s observation, I found that MCD has a decreasing trend over the past a few
days. If this share of stock still keeps this trend, I think I need to sell. The price details are shown
in the following table. (See Table 5.2.2)
76

Name Open High Low Close VolumeAAPL 130.28 131.39 130.05 130.54 32,112,797MSFT 47.06 47.77 46.62 47.23 28,837,332GOOG 536.79 536.79 529.76 533.99 1,904,332YHOO 43.05 43.63 42.91 43.35 11,152,854AMZN 430.4 433.16 426.2 430.92 2,253,264EBAY 61.55 63.03 61.55 62.56 14,098,761AAL 42.61 44.38 42.09 44.18 21,917,072TXN 55.7 56.34 55.42 55.71 4,576,011MCD 95.84 96.91 95.84 96.22 4,919,173SBUX 51.96 52.46 51.67 52.22 7,075,082
Table 5.2.36.Positioning Trading Week Two Day One Share Price Changes
Week Two Day two Tuesday, June 2 2015
On the second day of this week, I found that only two companies’ overall stock price
dropped: Apple and McDonald’s Corp. The stock price of MCD was 2% lower than the original
price and the AAL was just about 0.5% lower. Since most of the stock prices rose, the total
account value has increased to $100896.15. And after comparing the price chart below (See
Table 5.2.3), I chose to take no action on the stock.
Name Open High Low Close VolumeAAPL 129.86 130.66 129.32 129.96 33,667,627MSFT 46.93 47.35 46.62 46.92 21,498,326GOOG 532.93 543 531.33 539.18 1,938,989YHOO 43.18 43.62 42.92 43.15 8,866,474AMZN 430.07 433.23 426.25 430.99 1,669,845EBAY 62.1 63.03 61.91 62 7,093,853AAL 43.3 44.1 43.04 43.78 14,832,921TXN 55.42 55.6 54.88 55.25 4,630,112
77
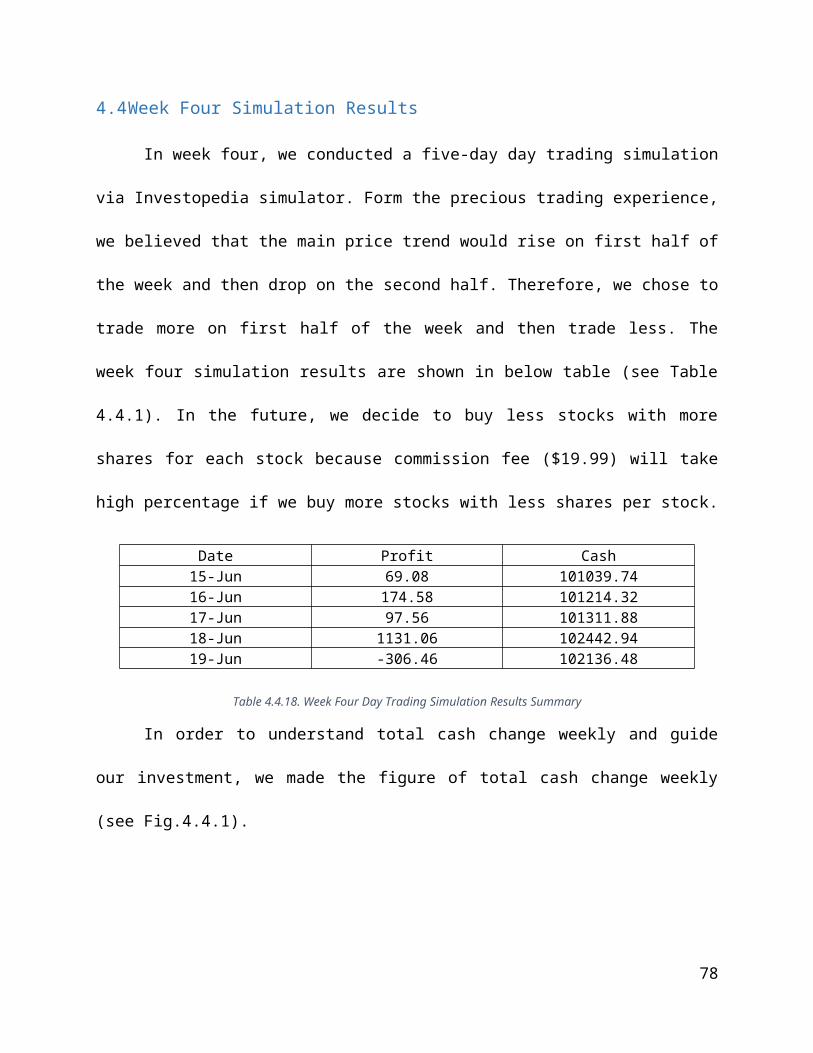
MCD 96.3 96.97 95.81 96.29 4,430,255SBUX 51.98 52.3 51.66 51.73 7,877,799
Table 5.2.37.Positioning Trading Week Two Day Two Share Price Changes
Week Two Day three Wednesday, June 3 2015
On the third day of this week, three of the stock I hold decreased. However, all of the
total changes of these three stocks are positive. Although MCD increased a little bit today, it still
caused the biggest loss over the 10 companies. I do not know if that would be the lowest point
MCD reached. So I still did not make any changes on this stock. After the third day, the total
account value increased to $101510.86. And the stock price changes are shown in the following
table. (See Table 5.2.4)
Name Open High Low Close VolumeAAPL 130.66 130.94 129.9 130.12 30,983,54
2MSFT 47.37 47.74 46.82 46.85 28,002,154GOOG 539.91 543.5 537.11 540.31 1,717,036
YHOO 43.3 43.78 42.98 43.21 11,893,374AMZN 434.4 438.39 432.75 436.59 2,727,914
EBAY 62.37 62.5 61.51 62.01 7,914,080AAL 43.35 43.91 43.01 43.13 13,272,58
4TXN 55.46 55.58 54.82 54.88 3,658,970MCD 96.38 97.07 95.97 96.52 4,165,709SBUX 52 52.27 51.67 52.12 5,522,702
Table 5.2.38.Positioning Trading Week Two Day Three Share Price Changes
Week Two Day four Thursday, June 4 2015
On the fourth day of the week, I made the biggest decision of the first two weeks: sell
half of the MCD I had to reduce more loss. From both the trend line on the internet and the
performance over the past 8 days, I found that MCD is in a decreasing trend these days and this
78

trend is supposed to keep going in the next a few days even weeks. On the other hand, EBAY
seemed not so good on Thursday. But this stock had a perfect performance in the past 8 days. So
I bought 50 shares of EBAY. And the total account value decreased to $100284.45 since most of
the stock price decreased on Thursday. Since I sold half of the MCD I had, the total profit
became negative. But this does not matter because EBAY has increased a lot and if I sell this
stock, I will earn a big amount of profit. (See Table 5.2.6) The following table shows the stock
price of Thursday and the trading results. (See Table 5.2.5)
Name Open High Low Close VolumeAAPL 129.58 130.58 128.91 129.36 38,450,118MSFT 46.79 47.16 46.2 46.36 27,745,512GOOG 537.76 540.59 534.32 536.7 1,348,337YHOO 43.09 43.44 42.76 42.88 10,033,370AMZN 434.4 436.76 429.26 430.78 2,510,761EBAY 61.77 62.55 61.73 62.49 7,723,297AAL 43.05 43.98 41.88 42.17 14,128,026TXN 54.66 54.88 53.83 53.98 6,640,652MCD 96.3 96.97 96.01 96.31 4,702,848SBUX 51.87 52.18 51.57 51.72 6,230,805
Table 5.2.39.Positioning Trading Week Two Day Four Share Price Changes
Date Symbol Buy/sell PriceShare
s Net Cost Sell Earning Profit Total Profit cash
Jun-4 EBAY 62.26 50 3132.99-
91.19 -95.96Jun-4 MCD 96.47 40 3838.81 2366.65
Table 5.2.40.Positioning Trading Week Two Day Four Simulation Results
Week Two Day five Friday, June 5 2015
On the last day of the week, the situation was still not so good. Only three of the stocks
increased. (See Table 5.2.7) It seemed that AAPL was not in god situation, so I sold 10 shares of
79

this stock. EBAY, as expected, still in increasing trend and I bought 30 shares of this stock. The
total account value was 100220.32, which was almost the same as the previous day. The
following tables show the stock prices and trading results of Friday. After analyzing the stock
price of AAPL, I found that this stock does not perform recently. To deduce the risk of losing
more money on this stock, I sold 10 shares of AAPL. And because of selling AAPL, the total
profit became -134.15. But at the same time, I bought 30 more shares of EBAY because I think
this stock will bring me more profit. (See Table 5.2.8)
Name Open High Low Close VolumeAAPL 129.5 129.69 128.36 128.65 35,626,800MSFT 46.31 46.52 45.84 46.14 25,438,086GOOG 536.35 537.2 532.52 533.33 1,388,220YHOO 42.83 43.26 42.7 42.81 9,831,129AMZN 429.66 430.8 426.5 426.95 1,907,855EBAY 62.49 63.3 62.16 63.23 10,098,378AAL 42.13 42.58 41.71 41.72 9,951,149TXN 53.98 54.26 53.58 53.78 3,650,414MCD 95.93 96.09 95.47 95.54 3,959,308SBUX 51.57 52.44 51.27 52.19 7,123,248
Table 5.2.41.Positioning Trading Week Two Day Five Share Price Changes
Date Symbol Buy/sell PriceShare
s Net Cost Sell Earning Profit Total Profit cashJun-5 EBAY 63.07 30 1912.09
Jun-5 AAPL 128.77 10 1267.71-
38.19 -134.15 1722.27
Table 5.2.42.Positioning Trading Week Two Day Five Simulation Results
In the second week, I did some big actions such as sold half of the MCD stock and
bought a lot of shares of EBAY. And I will analysis some of the stocks to show the precision of
my decision and what move I should take in the third week.
80

McDonald’s Corp
Figure 5.2.36.MCD Week Two Share Price Trend Line
As we can see in the trend line (See Figure 2.2.1), although MCD increased in the first 2
days of the week, it decreased even worse in the next three days. This showed that the decision
of selling half the MCD I had was definitely an excellent choice. Because in June 4 th and June 5th
this stock was in smash situation, but by that time, I have already sold the stock. However, this
trend will not last forever and it will reach the bottom someday. The only thing I should do with
81

this stick is just keep in track with the trend line and buy in when the stock price hit the lowest
point.
EBAY INC
Date Open High Low Close VolumeJun 5, 2015 62.49 63.30 62.16 63.23 10,098,378Jun 4, 2015 61.77 62.55 61.73 62.49 7,723,297Jun 3, 2015 62.37 62.50 61.51 62.01 7,914,080Jun 2, 2015 62.10 63.03 61.91 62.00 7,093,853Jun 1, 2015 61.55 63.03 61.55 62.56 14,098,761
Table 5.2.43.EBAY Week Two Share Price Changes
From the table above (See Table 5.2.9), we can see that during the past five days EBAY’s
stock price increased about $2. And this trend was relatively obvious in the last 3 days, which
increased from about $61.5 to 63.5. This trend line tells me that buying EBAY is a good choice.
And I bought this stock twice during the second week. Also from the 1 month trend line, the
increasing trend can still be seen. However, after analyzing the whole table, we can find that the
increasing speed was not as fast as last week. And at this point, I should be more careful because
this may be the peak point of the stock price. So the best choice I should take is to wait and see
the stock price next week instead of buying large amount EBAY without hesitating.
APPLE INC
Date Open High Low Close VolumeJun 5, 2015 129.50 129.69 128.36 128.65 35,626,800Jun 4, 2015 129.58 130.58 128.91 129.36 38,450,118Jun 3, 2015 130.66 130.94 129.90 130.12 30,983,542
82

Jun 2, 2015 129.86 130.66 129.32 129.96 33,667,627Jun 1, 2015 130.28 131.39 130.05 130.54 32,112,797
Table 5.2.44.AAPL Week Two Share Price Changes
As we can see in the table above (See Table 5.2.10), the stock price of AAPL kept
decreasing during last week, from $131 per share to about $129 per share. However, from the 1-
month trend line I found that this decreasing trend only appeared these 10 days and before this
period of time, AAPL’s stock price kept increasing. So I think it is still too early to sell more
AAPL because if this stock increases in the next week, I will lose money.
5.3 Week Three Simulation Results
We did five days of simulation this week. And during this week, we only traded stock on
Monday and Wednesday and the transactions made some profit. During the first 2 weeks, the
overall profit was $-134.15. But after I sold the stock on Wednesday, the profit became $386.29.
Although $386.29 is not big amount of money compared with the capital cost, this was still a
significant progress in the simulation. And we record the daily stock price of each stock for
further analysis. The overall result for the third week is shown in the following table. (See Table
5.3.1)
Date Profit ($) Cash ($)2015/6/8 157.47 10866.392015/6/9 157.47 10866.39
2015/6/10 386.29 18573.432015/6/11 386.29 18573.432015/6/12 386.29 18573.43
Table 5.3.45.PositioningTrading Week Three Simulation Results
83

Week Three day one Monday, June 8 2015
Name Open High Low Close VolumeAAPL 128.9 129.21 126.83 127.8 52,538,200MSFT 46.3 46.43 45.67 45.73 21,822,300GOOG 533.31 534.12 526.24 526.83 1,520,600YHOO 42.72 42.89 42 42.01 7,596,300AMZN 425.62 426.8 421.43 423.5 2,166,900EBAY 62.52 62.52 60.45 60.85 12,112,700AAL 41.07 41.24 39.27 39.86 25,726,200TXN 53.67 53.72 52.71 52.82 4,571,700MCD 96 96.04 95.25 95.32 4,539,400SBUX 52 52.23 51.49 51.53 6,297,600
Table 5.3.46.Positioning Trading Week Three Day One Share Price
Date Symbol Sell Price SharesSell
Earning Profit Total Profit cashJun-
8 MCD 95.77 30 2853.11 -94.39EBAY 63.11 100 6291.01 386.01 157.47 10866.39
Table 5.3.47.Positioning Trading Week Three Day One Simulation Results
Monday was definitely not a good opening for the week because every single stock
decreased during the day (See Table 5.3.2). Since EBAY has increased a lot in the past two
weeks, I decided to sell some of this stock because I do not know if this would be the peak point
of it. And EBAY decreased in Monday. So I do not want to take the risk and sell 100 shares of
EBAY to guarantee the profit. On the other hand, MCD kept its bad performance as usual. As a
84

result, I made up my mind to sell all MCD I had although this action would cause me losing
money because I cannot see any sign that MCD could increase these days. (See Table 5.3.3)
Week Three day two Tuesday, June 9 2015
Name Open High Low Close VolumeAAPL 126.7 128.08 125.62 127.42 55,771,500MSFT 45.76 45.94 45.46 45.65 24,124,700GOOG 527.56 529.2 523.01 526.69 1,441,600YHOO 41.92 41.95 41.02 41.63 11,943,500AMZN 422.96 427.49 419.14 425.48 2,274,600EBAY 60.73 60.84 59.74 60.41 9,463,900AAL 40.21 41.21 39.7 40.43 15,667,500TXN 53.14 54.39 52.92 54.19 6,563,000MCD 95.02 95.63 94.81 95.3 4,816,400SBUX 51.8 52.86 51.66 52.69 7,963,900
Table 5.3.48.Positioning Trading Week Three Day Two Share Price
As we can see from the table above, (See Table 5.3.4) almost stock’s price remained the
same after the market was closed. Only AMZN increased from $422.96 to $425.48. Although it
increased $3 per share, AMZN just increased very little in percentage. It was obvious that all the
ten stocks were in a decreasing trend. So the choice I should take was to wait and see the share
price tide to maximize the profit.
Week Three day three Wednesday, June 10 2015
85

Name Open High Low Close VolumeAAPL 127.92 129.34 127.85 128.88 38,915,900MSFT 45.79 46.83 45.69 46.61 27,952,300GOOG 529.36 538.36 529.35 536.69 1,811,400YHOO 41.7 42.31 41.69 42.06 7,930,000AMZN 426.46 432.2 425.66 430.77 2,166,500EBAY 60.56 60.94 60.21 60.47 8,852,500AAL 40.21 41.21 39.7 40.43 15,667,500TXN 53.14 54.39 52.92 54.19 6,563,000MCD 53.14 54.39 52.92 54.19 6,563,000SBUX 51.8 52.86 51.66 52.69 7,963,900
Table 5.3.49.Positioning Trading Week Three Day Three Share Price
Date SymbolBuy/sell
PriceShare
s Sell Earning Net Cost Profit Total Profit CashJun-10 SBUX 52.73 50 2616.51 67.01
Jun-10 AMZN 431.5 30 12925.01
161.81
Jun-10 EBAY 60.72 50 3055.99 224.48
Jun-10 MCD 95.17 50 4778.49 386.29 18573.4
Table 5.3.50.Positioning Trading Week Three Day Three Simulation Results
Since these 10 stocks kept decreasing during the past three days, (See Table 5.3.5) I
chose to sell some shares whose prices were higher than the purchase price. So I sold 50 shares
of SBUX and 30 shares of AMZN. After selling the stock, I found that my cash was $26407.91,
which was much higher than expected. (See Table 5.3.6) So I also bought some EBAY and
MCD. The reason I bought EBAY was the high expectation I gave to this stock. Although EBAY
did not perform well this week, I strongly assist that it will go back to its position finally.
However, buying MCD was a gamble. From the trend line, it is easy to see that MCD kept
decreasing during the past several weeks. But there must be some point that MCD will come
back. I suppose that was around the point because MCD has been decreasing for a long time.
86
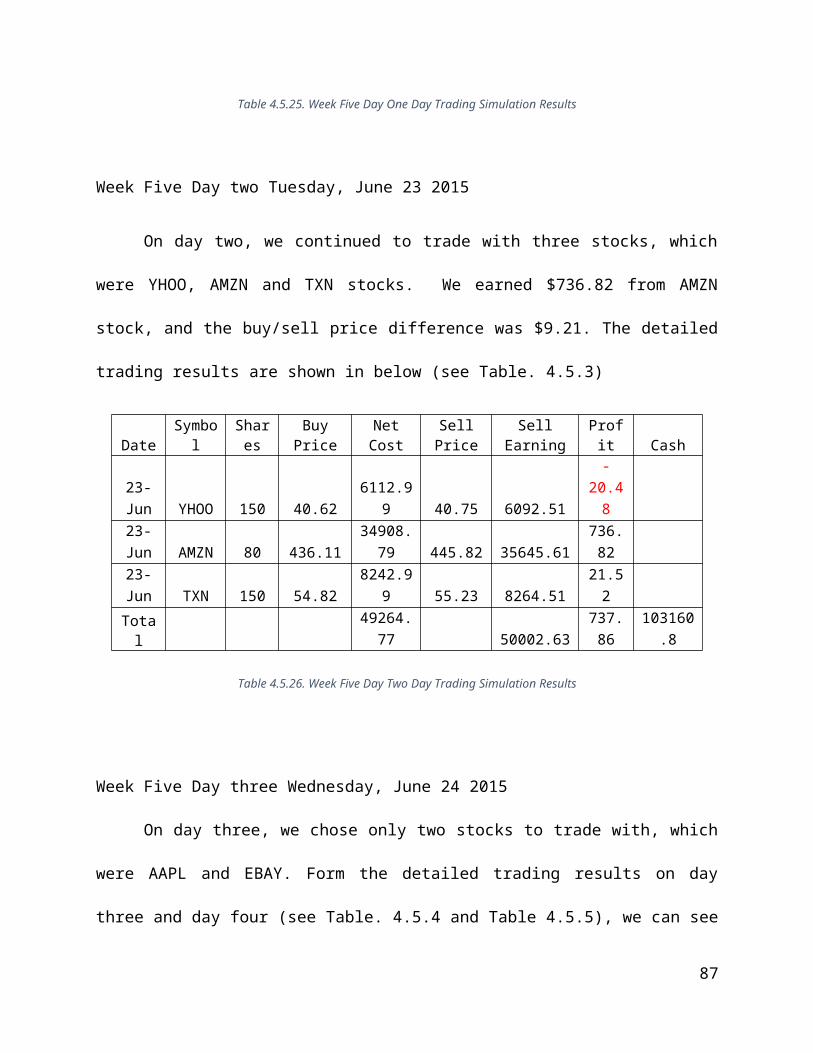
Week Three day four Thursday, June 11 2015
Name Open High Low Close VolumeAAPL 129.18 130.18 128.48 128.59 35,260,400MSFT 46.66 46.92 46.13 46.44 27,186,700GOOG 538.42 538.98 533.02 534.61 1,205,000YHOO 42.09 42.21 40.55 40.94 23,654,400AMZN 432.29 438.89 431.47 432.97 2,917,100EBAY 60.7 60.99 60.15 60.45 7,077,100AAL 40.79 41.26 39.94 40.02 10,105,200TXN 54.17 54.26 53.57 53.64 4,698,100MCD 95.5 96.33 95.5 95.59 3,691,000SBUX 52.81 53 52.44 52.49 6,002,200
Table 5.3.51.Positioning Trading Week Three Day Four Share Price
As we can see in the table above (See Table 5.3.7), every single stock decreased during
Thursday. It seems that the stock market is in bear market recently. And I think I should not buy
or sell any stock today because any action with carelessness may cause loss on the very next day.
Week Three day five Friday, June 12 2015
Name Open High Low Close VolumeAAPL 128.19 128.33 127.11 127.17 36,754,200MSFT 46.22 46.47 45.9 45.97 23,416,200GOOG 531.6 533.12 530.16 532.33 952,400YHOO 40.77 41.11 40.46 40.53 9,220,600AMZN 431.25 432.36 428.26 429.92 2,050,200EBAY 60.32 60.68 59.97 60.02 6,907,800AAL 39.84 41 39.76 40.71 10,311,500TXN 53.35 53.51 52.99 53.01 3,756,000MCD 95.42 95.55 95 95.06 3,610,700SBUX 52.41 52.74 52.16 52.63 5,224,200
Table 5.3.52.Positioning Trading Week Three Day Five Share Price
87

During the last day of this week’s simulation, the situation was a little better than the
previous day. Almost every single stock remained the same price except AMZN. AMZN
increased about $8 during the day. (See Table 5.3.8) But it is still too early to say AMZN was a
good choice to buy. I chose to take no action on Friday and see how the stocks will perform in
the next week.
During the third week, the stock prices do not fluctuated so much and decreased almost
every day. However, I still made some profit by selling EBAY, SBUX and AMZN. And I will
analysis MCD to give myself a hint on the decision to make in the next week.
McDonald’s Corp
Figure 5.3.37.MCD Week Three Share Price Trend Line
As we can see both from the trend line (See Figure 5.3.1), the share price of MCD has
been decreasing from May 19. However, this trend became smoother recently. There is no such
88

stock that will decrease forever and I think MCD has reached its bottom. Maybe the price will
fluctuate for some time, but it will increase very soon.
5.4 Week Four Simulation Results
During the fourth week, we simulated for five days and the overall results are shown in the
table below. (See Table 5.4.1) During this week’s simulation, I found that my cash was way too
much, which showed that I traded in a cautious way. Another reason that I had so much cash is
that I sold all the GOOG and this action earned me more than $300, which is almost the sum of
profit in the last three weeks.
At the same time, analyzing the trend line and historical price also helped me a lot. I can get
a comprehensive overview of a stock by looking into the 1-week trend line and determine
whether or not I should buy some shares of this stock.
Date Profit ($) Cash ($)2015/6/15 386.29 18573.42015/6/16 386.29 18573.42015/6/17 381.34 32899.922015/6/18 381.34 32899.922015/6/19 708.85 40614.96
Table 5.4.53.Positioning Trading Week Four Simulation Results
Week Four day one Monday, June 15 2015
During the first day of this week, almost all of the shares prices remained the same except
AMZN. (See Table 5.4.2) AMZN dropped about $4 in this day, but it still can be ignored
compared with its high single share price. Also, from the trend line of the AMZN, this stock had
89

a “W” shape of trend line, which means this stock fluctuated a lot during these days. So it was
still too early to sell.
Name Open High Low Close VolumeAAPL 126.1 127.24 125.71 126.92 39,842,600MSFT 45.45 45.65 45.02 45.48 30,080,100GOOG 528 528.3 524 527.2 1,630,700YHOO 40.24 40.67 40.21 40.47 10,869,500AMZN 427.66 428.05 422.64 423.67 2,041,900EBAY 59.63 60.19 59.25 60 8,093,500AAL 40.35 41 40.01 40.07 8,819,400TXN 52.45 53.11 52.32 53.05 4,836,400MCD 94.74 95 94.02 94.3 4,715,600SBUX 52.23 52.46 52.01 52.27 5,550,700
Table 5.4.54.Positioning Trading Week Four Day One Share Prices
Week Four day two Tuesday, June 16 2015
In the second day of this week, almost all stocks’ prices increased. (See Table 5.4.3)
Although the amount of growth was not much, it showed an increasing trend of the market. Most
of the growth was in $1, so if this trend still continues in the next day, I will think about buying
some shares of stock.
Name Open High Low Close VolumeAAPL 127.03 127.85 126.37 127.6 31,404,000MSFT 45.35 46.24 45.3 45.83 26,822,500GOOG 528.4 529.64 525.56 528.15 1,069,300YHOO 40.35 41.4 40.02 40.64 20,439,700AMZN 424.15 427.97 422.67 427.26 2,296,400EBAY 59.89 61.88 59.78 60.52 9,341,200AAL 40.13 40.32 39.32 39.48 9,193,400TXN 52.91 53.2 52.66 53.09 2,697,800MCD 94.25 94.67 94.1 94.63 3,082,500SBUX 52.27 53.14 52.2 52.97 6,099,200
Table 5.4.55.Positioning Trading Week Four Day Two Share Prices
90

Week Four day three Wednesday, June 17 2015
In the third day of this week, the increasing trend still continued. (See Table 5.4.4)
Although the amount of growth was not so much, I still decided to buy in some shares of stock
since the increasing trend would continue in the next few days. And I bought 50 shares of MCD
and 50 shares of MSFT. At the same time, I sold 35 shares of AMZN and 50 shares of AAPL.
(See Table 5.4.5) The reason I sold AAPL was that this stock kept decreasing for a long time and
I cannot see any sign that it will come back again. So I sold AAPL to prevent further money loss.
Name Open High Low Close VolumeAAPL 127.72 127.88 126.74 127.3 32,768,500MSFT 45.73 46.07 45.36 45.97 28,566,300GOOG 529.37 530.98 525.1 529.26 1,268,600YHOO 40.8 41.52 40.78 40.96 11,936,400AMZN 428.36 431.35 424.75 427.81 2,184,100EBAY 60.5 61.09 60.24 60.55 4,557,000AAL 39.27 40.09 38.91 39.88 9,565,600TXN 53.31 53.53 52.87 53.29 3,259,900MCD 94.54 95.52 94.54 95.22 3,938,300SBUX 53.09 53.47 52.72 53.24 6,723,300
Table 5.4.56.Positioning Trading Week Four Day Three Share Prices
Date Symbol Buy/sell Price SharesSell
Earning Net Cost Profit Total Profit CashJun-17 MCD 94.62 50 4750.99
Jun-17 MSFT 45.55 50 2297.49
Jun-17 AMZN 430.27 35 15039.46 149.06
Jun- AAPL 127.11 50 6335.51 -154.01 381.34 32899.92
91

17
Table 5.4.57.Positioning Trading Week Four Day Three Simulation Results
Week Four day four Thursday, June 18 2015
As we can see in the table below, all the stock prices increased in the fourth day of the
week. Especially, AMZN increased around $10 in a single day. (See Table 5.4.6) And this meant
that the decision of buying stocks in Wednesday was a correct choice. And if the increasing
trend of the market still exists in Friday, I will buy more stocks since I have a lot of cash.
Name Open High Low Close VolumeAAPL 127.23 128.31 127.22 127.88 35,241,100MSFT 46.22 46.8 46.17 46.72 32,184,500GOOG 531 538.15 530.79 536.73 1,828,100YHOO 41.04 41.27 40.79 40.91 10,003,000AMZN 430.3 439.73 429.41 439.39 3,369,700EBAY 60.65 61.12 60.63 60.69 6,966,100AAL 39.8 40.22 39.61 39.98 10,619,800TXN 53.48 54.37 53.34 54.22 5,678,200MCD 95.69 96.63 95.28 96.17 4,846,200SBUX 53.5 54.28 53.4 54.11 10,711,000
Table 5.4.58.Positioning Trading Week Four Day Four Simulation Results
Week Four day five Friday, June 19 2015
92

During the fifth day of this week, most of the stock prices decreased a little bit. (See
Table 5.4.7) Although this was not as expected, I still think the stock prices will increase in the
next week. So I bought 100 shares of MCD, AAL and SBUX. And compared with the original
price, GOOG has increased about $7 per share. So I decided to sell all the 50 shares of GOOG to
make some profit. (See Table 5.4.8)
Name Open High Low Close VolumeAAPL 127.71 127.82 126.4 126.6 54,181,300MSFT 46.79 46.83 45.99 46.1 57,500,600GOOG 537.21 538.25 533.01 536.69 1,885,700YHOO 40.9 40.93 40.37 40.51 11,586,600AMZN 440.26 444.99 433.24 434.92 4,481,100EBAY 60.79 61.46 60.66 61.17 10,458,200AAL 40.3 41.89 40.3 41.56 20,155,500TXN 54.25 54.59 53.54 54.51 9,925,100MCD 96.39 97.14 95.98 96.08 7,221,800SBUX 54.08 54.44 53.84 53.93 10,582,100
Table 5.4.59.Positioning Trading Week Four Day Five Share Prices
Date SymbolBuy/sell
Price Shares Sell EarningNet Cost Profit Total Profit Cash
Jun-19 MCD 96.34 100 9653.99
Jun-19 AAL 40.76 100 4095.99
Jun-19 SBUX 53.91 100 5410.99
Jun-19 GOOG 537.92 50 26876.01 327.51 708.85 40614.96
Table 5.4.60.Positioning Trading Week One Day Five Simulation Results
During the last week, I bought MCD twice, which was way different from the decisions I
made in the first three weeks. And at the same time, I sold all the GOOG I had. So I want to
93

analysis these two stocks to explain the reason why I started to buy in MCD and sell GOOG in
the fourth week.
McDonald’s Corp
As we can see in trend line of MCD (See Figure 5.4.1), during the last week, the share
price of MCD was in a rapid growth. Also, in the 1-month trend line, this stock kept decreasing
for almost the whole month. Definitely there is not such a stock that will decrease forever. And I
think MCD was around its bottom point. So this was a perfect time to buy in some shares of
MCD because this stock will increase again if it reaches its bottom.
Figure 5.4.38.MCD Week Four Share Price Trend Line
Google Inc.
As we can see in the 1-month trend line below (See Figure 5.4.2), GOOG’s share price
kept fluctuating in the last month. And on the Friday of the fourth week, the trend line was
smooth. According to the trend line, the price has a high possibility of decrease in the next week.
94

Furthermore, the share price of GOOG increased about $7 per share. So I decided to sell all the
shares of GOOG to guarantee the profit.
Figure 5.4.39.GOOG Share Price Trend Line in The Last Month
5.5 Week Five Simulation Results
We simulated for five days during the last week. And we traded on Tuesday, Thursday and
Friday. But on Friday we just sold all the stocks we had. As a result of the five-week simulation,
the total profit was $2095.75, which was not so bad since we are just beginners. The changes of
profit and cash are shown in the table below. (See Table 5.5.1)
Date Profit ($) Cash ($)2015/6/22 708.85 40614.962015/6/23 1280.58 55878.692015/6/24 1280.57 55878.692015/6/25 1280.57 2401.712015/6/26 2095.75 102095.75
95

Table 5.5.61.Positioning Trading Week Five Simulation Results
Week Five day one Monday, Jun 22 2015
As we can see in the table below, (See Table 5.5.2) when we look just the close prices
and the open prices, the stocks were almost the same. But when we look into the highest price of
the day, we can easily observe that GOOG and AMZN increased some bit and that thanks to the
high share prices of the two stocks. At the same time, I did not make any transactions on Monday
since some companies may put out some new polices that could affect the share prices.
Name Open High Low Close VolumeAAPL 127.49 128.06 127.08 127.61 33,833,500MSFT 46.33 46.72 46.16 46.23 20,278,600GOOG 539.59 543.74 537.53 538.19 1,242,500YHOO 40.66 40.89 40.54 40.73 6,127,200AMZN 437 439.24 434.18 436.29 1,765,500EBAY 61.59 61.9 61.28 61.75 5,094,300AAL 42.92 43.25 42.24 43.03 15,104,000TXN 54.62 55.52 54.62 55.5 9,275,900MCD 96.31 97.03 96.14 96.87 3,707,100SBUX 54.33 54.43 53.88 53.9 7,091,600
Table 5.5.62.Positioning Trading Week Five Day One Share Prices
Week Five day two Tuesday, Jun 23 2015
On the second day of the week, I sold all the AAPL I had although the sell price was
lower than the original price because this stock kept a decreasing trend during the past few
weeks. I decided to sell this stock to prevent further loss. At the same time, I sold 35 shares of
AMZN, which earned a lot of profit. And I bought 100 shares of SBUX because from the recent
share price trend line, this stock had an increasing trend. After the second day, the total profit
96

was $1280.57 and the cash was $55878.69. (See Table 5.5.4) And the share price of Tuesday is
shown in the table below. (See Table 5.5.3)
Name Open High Low Close VolumeAAPL 127.48 127.61 126.88 127.03 30,137,100MSFT 46.13 46.28 45.62 45.91 25,787,000GOOG 539.64 541.5 535.25 540.48 1,196,000YHOO 40.74 40.8 40.51 40.65 6,846,300AMZN 435.59 447.04 433.69 445.99 3,209,400EBAY 61.76 62 61.44 61.93 5,444,300AAL 42.98 43.42 42.35 42.73 10,698,400TXN 55.31 55.6 54.71 54.83 5,055,800MCD 97.59 97.96 97.12 97.18 4,486,900SBUX 54.04 54.18 53.72 54.12 5,679,000
Table 5.5.63.Positioning Trading Week Five Day Two Share Prices
Date Symbol Buy/sell Price SharesSell
Earning Net Cost Profit Total Profit CashJun-23 AMZN 446.62 35 15611.71 721.31
Jun-23 AAPL 127.35 40 5074.01 -149.59
Jun-23 SBUX 54.02 100 5421.99 1280.57 55878.69
Table 5.5.64.Positioning Trading Week Five Day Two Simulation Results
Week Five day three Wednesday, Jun 24 2015
We can easily see from the table that almost every single stock decreased during the day
and AAPL was the only stock that increased. (See Table 5.5.5) Because of this situation, I did
not trade during the third of the week.
Name Open High Low Close VolumeAAPL 127.21 129.8 127.12 128.11 54,964,900MSFT 45.67 46.25 45.55 45.64 34,784,600GOOG 540 540 535.66 537.84 1,283,400
97

YHOO 40.68 41.23 40.58 40.94 11,444,300AMZN 444.97 446.47 440.23 440.84 2,614,400EBAY 62.11 62.39 61.51 61.61 8,388,000AAL 42.7 42.92 42.07 42.24 6,857,400TXN 54.65 54.81 53.93 53.99 4,196,500MCD 96.75 97.45 96.64 96.64 3,919,800SBUX 53.75 53.97 53.52 53.71 5,512,100
Table 5.5.65.Positioning Trading Week Five Day Three Share Prices
Week Five day four Thursday, Jun 25 2015
Although most of the stocks decreased during this day, (See Table 5.5.6) I still bought
100 shares of AMZN and 100 shares of MCD (See Table 5.5.7) because I thought these two
stocks were around their lowest point. After the third day of week five, the cash became
$2401.71.
Name Open High Low Close VolumeAAPL 128.86 129.2 127.5 127.5 31,816,700MSFT 46.03 46.06 45.5 45.65 20,569,500GOOG 538.87 540.9 535.23 535.23 1,331,500YHOO 41.1 41.39 40.9 41.07 10,764,100AMZN 438.07 443.47 436.39 440.1 2,235,600EBAY 61.68 62 61.48 61.6 6,000,600AAL 42.65 43.42 42.2 42.24 8,165,700TXN 54.23 54.42 53.74 53.8 3,755,800MCD 96.7 96.91 95.78 95.79 4,266,200SBUX 54.09 54.45 54 54.07 5,382,300
Table 5.5.66.Positioning Trading Week Five Day Four Share Prices
Date Symbol Buy/sell Price Shares Net Cost Profit CashJun-25 AMZN 437.89 100 43808.99Jun-25 MCD 96.48 100 9667.99 2401.71
Table 5.5.67.Positioning Trading Week Five Day Four Simulation Results
Week Five day five Friday, Jun 26 2015
98

Friday was the last day of the simulation and I sold all the stocks I had. The final
simulation results were shown in the table below (See Table 5.5.9) and the final profit was
$2095.75. Compared with the initial value, the profit rate was 2.1%, which was acceptable. And
among the 10 stocks, AMZN brought me more than $1000 profit, which showed that this
company was in great condition during the past few weeks. The share prices of the last day is
shown below. (See Table 5.5.8)
Name Open High Low Close VolumeAAPL 127.67 127.99 126.51 126.75 42,111,000MSFT 45.65 46.28 45.03 45.26 45,610,900GOOG 537.26 537.76 531.35 531.69 2,011,500YHOO 40.83 40.87 39.93 40.06 16,011,600AMZN 441.76 443.49 435.06 438.1 2,529,500EBAY 61.6 61.71 60.7 61.04 6,289,000AAL 42.44 42.58 41.33 41.44 9,596,300TXN 53.39 53.75 52.43 52.9 7,566,600MCD 96.13 97.35 95.93 97.29 5,822,800SBUX 54.46 54.75 54.3 54.62 6,367,100
Table 5.5.68.Positioning Trading Week Five Day Five Share Prices
Date SymbolBuy/sell
Price Shares Sell Earning Profit Total Profit CashJun-25 MSFT 45.94 150 6871.01 -49.49
Jun-25 AMZN 442.24 100 44204.01 415.01
Jun-25 EBAY 61.51 30 1825.31 -66.79
Jun-25 YHOO 40.65 60 2419.01
-152.59
Jun-25 MCD 97.29 200 19438.01 314.51
Jun-25 SBUX 54.66 250 13645.01 302.51
Jun-25 AAL 42.49 180 7628.21 217.01
Jun-25 TXN 52.94 100 5274.01
-164.99 2095.75 102095.8
Table 5.5.69.Positioning Trading Week Five Day Five Simulation Results
99

As we can see in the simulation results, the profit on AMZN was more than $1000 in this
week. So I want to analysis this stock to see the recent price changes of it.
Amazon.com Inc.
From the share price trend line of the last week, (See Figure 5.5.1) it is hard to tell how
this stock performed during the past five days because the share price first increased and reached
its peak point on Tuesday and then decreased to its original level on Friday. However, when we
look into the price trend line of the last month, the increasing trend is pretty obvious and this is
the reason why this stock can give me so much profit in the last week.
Figure 5.5.40.AMZN Price Trend Line in Week Five
100

Figure 5.5.41.AMZN Price Trend Line in June
6. Comparison
6.1 Final Stock Value Analysis
After five weeks simulations, we summarized our day trading simulation results in follow
figures (see Fig. 6.1.1 and Fig. 6.1.2). In addition, the detailed numerical data are included in
appendix (see Table A1). The stock simulation starts with $100,000 and ends with $103,340.9.
Therefore, the total profit of day trading stock simulations is $3,340.9.
101

5/26 5/31 6/5 6/10 6/15 6/20 6/25 6/3098000
99000
100000
101000
102000
103000
104000
Day Trading Stock Simulation Total Asset Value Change
Date
Tota
l Ass
et V
alue
(USD
)
Figure 6.1.42 Overall Day Trading Stock Simulation Total Asset Value Change
From the Figure 6.1.1, we can see that the main trend of overall cash change is rising.
With the trading experience learned from first three week, we become more skillful in day
trading method, which is shown in steep rising cash changes in last two weeks.
5/26
5/28
5/30 6/1 6/3 6/5 6/7 6/9
6/11
6/13
6/15
6/17
6/19
6/21
6/23
6/25
-400
-200
0
200
400
600
800
1000
1200
1400
Day Trading Stock Simulation Profit Results
Date
Dai
ly P
rofit
(USD
)
Figure 6.1.43. Overall Day Trading Stock Simulation Profit Results
102

From the Figure 6.1.2, we can see that the highest daily profit is about $1,100. Also, in
most of trading days, we are earning profits, and the profits are higher than losses.
The position trading simulation results are shown in bellow (see Fig. 6.1.3). Position
trading strategy is different day trading strategy. With position trading method, investors buy and
hold their stocks to wait for higher price to sell. The hold period depends on stocks price trends.
However, investors may also sell their holding stocks at lower price to avoid big losses. The
position trading stock simulation starts with $100,000 and end with $102095.8. Therefore, the
overall profit of position trading simulation is $2,095.8.
5/26 5/31 6/5 6/10 6/15 6/20 6/25 6/3085000
90000
95000
100000
105000
110000
115000
Position Trading Stock Simulation Total asset Value Change
Date
Tota
l Ass
et V
alue
(USD
)
Figure 6.1.44. Overall Position Trading Stock Simulation Total Asset Value Change
From the Figure 6.1.3, we can see that, in most of the time, we are active investors since
we keep to buy and hold stocks instead of keeping high amount of cash in our account. In this
process, we also need to sell low profit stocks and high profit stocks.
More important, there are stocks with different type price trends need to be analyzed (see
Fig. 6.1.4, Fig. 6.1.5 and Fig. 6.1.6).
103
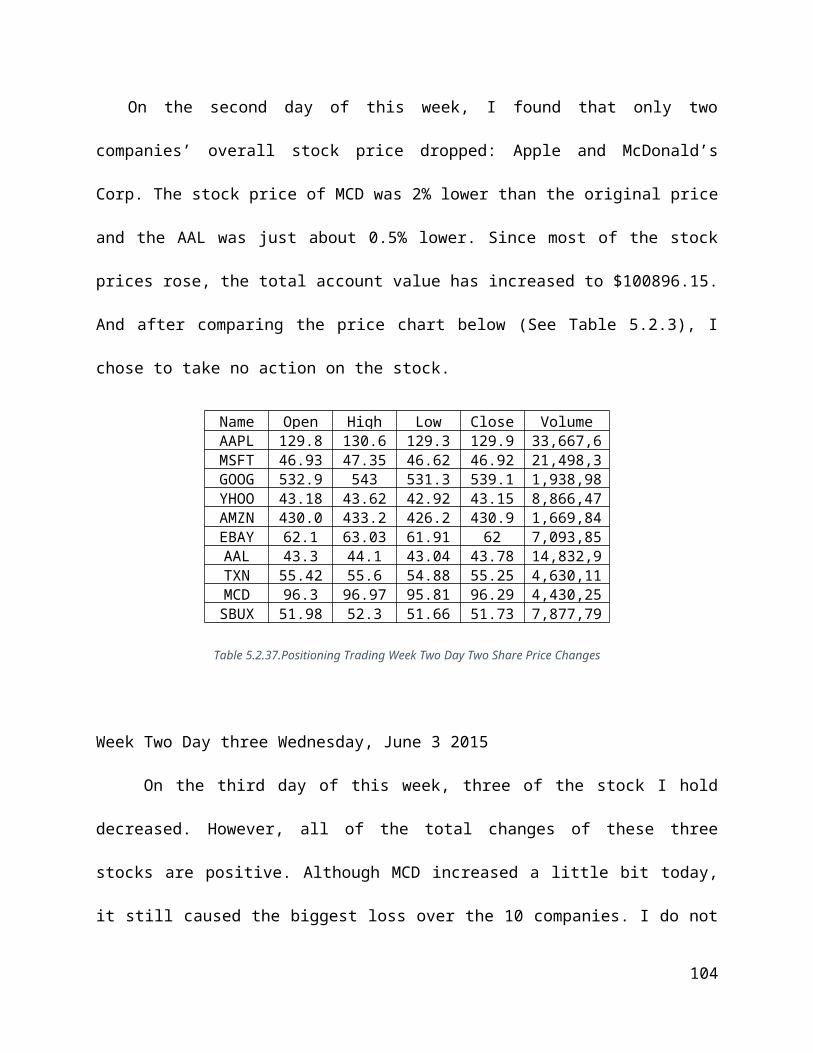
Figure 6.1.45. “U” and “N” Shape Price Trend
From the Figure 6.1.4, we can see that the price trend over a week has a few “U” and “N”
shaped curves. The stocks with this type of price trend is preferred because it creates high price
difference which means high profit, and within a day, the stock prices are relatively stable.
However, high profits come with high risks.
Figure 6.1.46. Increasing Price Trend
The Figure 6.1.5 shows an increasing price trend, investing on stocks with this type of
price trend will promise profit but not high profit. It is preferred for beginning investors.
104

Figure 6.1.47. Decreasing Price Trend
The Figure 6.1.6 shows a decreasing price trend, investing on stocks with this type of
price trend will definitely causes loss. Therefore, the stocks with decreasing price trend should be
sold as earlier as possible to avoid continuous losses.
The last thing we learned from our simulation is that the first half of the week has high
possibility to earn, and the second half of the week has high possibility to loss. Therefore, we
trade more in beginning of each week and trade less in the end. Also, trading less stocks with
more shares is another good practice to earn profits.
7. Conclusion From the project stock market simulation, we learned the basic knowledge of stock market
and stock trading techniques. Compared with position trading strategy, day trading strategy is
easier to earn profit because investors who use day trading strategy trade more frequently to earn
more profit or avoid bigger loss. There are three typical price trend such as “U” shape price
trend, increasing price trend and decreasing price trend. In addition, trading more in earlier of
each week and trading less in later of each week are also strategies to earn profit from stock
105

trades. Trading less stocks with more shares will let investors concentrate on these a few stocks,
which is also a good practice.
With the knowledge and techniques learned from this project, each team member will have
more confidence to invest on stocks in the future.
Reference1. Finance - Zacks,. (2015). Advantages of Investing in the Stock Market. Retrieved 8 July
2015, from http://finance.zacks.com/advantages-investing-stock-market-2054.html
2. Investopedia,. (2005). Stock Market Definition | Investopedia. Retrieved 8 July 2015, from http://www.investopedia.com/terms/s/stockmarket.asp
3. Wikipedia,. (2015). Stock market. Retrieved 8 July 2015, from https://en.wikipedia.org/wiki/Stock_market
4. Value Stock Guide,. (2015). Stock Market Terms for Beginners. Retrieved 8 July 2015, from http://valuestockguide.com/stock-market-terminology-for-beginners
5. Wikipedia,. (2015). Day trading. Retrieved 8 July 2015, from https://en.wikipedia.org/wiki/Day_trading
6. Kristina Zucchi, C. (2011). 4 Common Active Trading Strategies. Investopedia. Retrieved 8 July 2015, from http://www.investopedia.com/articles/active-trading/11/four-types-of-active-traders.asp
106

7. Wikipedia,. (2015). Market liquidity. Retrieved 8 July 2015, from https://en.wikipedia.org/wiki/Market_liquidity
8. Wikipedia,. (2015). Volatility (finance). Retrieved 8 July 2015, from https://en.wikipedia.org/wiki/Volatility_(finance)
9. Investopedia,. (2003). Candlestick Definition | Investopedia. Retrieved 8 July 2015, from http://www.investopedia.com/terms/c/candlestick.asp
10. Fontinelle, A. (2003). Electronic Communication Network (ECN) Definition | Investopedia. Investopedia. Retrieved 8 July 2015, from http://www.investopedia.com/terms/e/ecn.asp
11. Wikipedia,. (2015). Stock market data systems. Retrieved 8 July 2015, from https://en.wikipedia.org/wiki/Stock_market_data_systems
12. Wikipedia,. (2015). Position (finance). Retrieved 8 July 2015, from https://en.wikipedia.org/wiki/Position_(finance)
13. DailyFX,. (2015). Forex Trading News & Analysis - DailyFX. Retrieved 5 July 2015, from http://www.dailyfx.com/
14. Wikipedia,. (2015). Apple Inc.. Retrieved 5 July 2015, from https://en.wikipedia.org/wiki/Apple_Inc.
15. Wikipedia,. (2015). Microsoft. Retrieved 5 July 2015, from https://en.wikipedia.org/wiki/Microsoft
16. Wikipedia,. (2015). Amazon.com. Retrieved 5 July 2015, from https://en.wikipedia.org/wiki/Amazon.com
17. Wikipedia,. (2015). EBay. Retrieved 5 July 2015, from https://en.wikipedia.org/wiki/EBay
18. Wikipedia,. (2015). Google. Retrieved 5 July 2015, from https://en.wikipedia.org/wiki/Google
19. Wikipedia,. (2015). Yahoo!. Retrieved 5 July 2015, from https://en.wikipedia.org/wiki/Yahoo!
20. Wikipedia,. (2015). American Airlines. Retrieved 5 July 2015, from https://en.wikipedia.org/wiki/American_Airlines
21. Wikipedia,. (2015). Texas Instruments. Retrieved 5 July 2015, from https://en.wikipedia.org/wiki/Texas_Instruments
107

22. Wikipedia,. (2015). Starbucks. Retrieved 5 July 2015, from https://en.wikipedia.org/wiki/Starbucks
23. Wikipedia,. (2015). McDonald's. Retrieved 5 July 2015, from https://en.wikipedia.org/wiki/McDonald%27s
AppendixThe day trading stock simulation numerical results are shown in below (see Table A1).
The table below records daily profits and cash values (note: the negative number means trading
loss). Also, the data are plotted into corresponding figures (see Fig. 6.1.1 and Fig. 6.1.2).
Date Profit Total Asset Value26-May -81.9 99918.127-May 80.48 99998.5828-May 222.56 100221.129-May 61.76 100282.91-Jun 28.58 100311.52-Jun 264.58 100576.13-Jun -13.92 100562.14-Jun -97.32 100464.85-Jun -31.94 100279.58-Jun 204.56 100637.49-Jun 128.06 100765.510-Jun -21.92 100743.611-Jun 173.06 100916.612-Jun 54.02 100970.7
108

15-Jun 69.08 101039.716-Jun 174.58 101214.317-Jun 97.56 101311.918-Jun 1131.06 102442.919-Jun -306.46 102136.522-Jun 286.46 102422.923-Jun 737.86 103160.824-Jun 115.04 103275.825-Jun 94.04 103369.926-Jun -28.96 103340.9
Table A1. Day Trading Stock Simulation Summary Results
The position trading stock simulation numerical results are shown in below (see Table A2
and Table A3). Table A2 records date, daily cash values and daily total asset value. Also, the
daily asset values data are plotted into corresponding Fig. 6.1.3. Table A3 records weekly profits
(note: the negative number means loss).
Date Cash Total Asset ValueMay-26 6084.1 99813.6May-27 7728.62 101081.52May-28 6018.61 97301.01May-29 1660.83 96960.74Jun-1 1660.83 97539.93Jun-2 1660.83 97553.88Jun-3 1660.83 97947.08Jun-4 2366.65 97080.75Jun-5 1722.27 97938.82Jun-8 10866.39 96710.79Jun-9 10866.39 96796.09Jun-10 18573.43 91980.48Jun-11 18573.43 91770.88Jun-12 18573.43 91367.33Jun-15 18573.4 90723.15Jun-16 18573.4 90999.4Jun-17 32899.92 91235.92Jun-18 32899.92 91962.62Jun-19 40614.96 92032.96Jun-22 40614.96 92600.16Jun-23 55878.69 113202.49Jun-24 55878.69 112787.09
109

Jun-25 2401.71 103230.11Jun-26 102095.8 102095.75
Table A2. Position Trading Stock Simulation Summary Results
Week Accumulated Profit ($)One -4.77Two -134.15Three 386.29Four 708.85Five 2095.75
Table A3. Position Trading Stock Simulation Weekly Accumulated Profits
110