ABSTRACT - University of Michigan · ABSTRACT Garrell, Monika ... Ma from Magnequench who provided...
95
ABSTRACT Garrell, Monika Gerda. Mechanical Properties of Injection-Molded Nd-Fe-B Type Permanent Magnets. (Under the direction of Dr. Albert Shih) The goal of this research was to investigate the mechanical properties of injection molded Nylon and PPS-based Nd-Fe-B type magnets. The development of new Nd-Fe-B type magnetic materials and the advancement of near-net shape injection molding processes for magnetic component manufacturing have driven the needs to evaluate the mechanical properties of these newly developed materials. PPS (Polyphenylene-Sulfide) and Nylon (Polyamide) are the two most common binders used for these injection molded rare earth magnets. Since magnetic materials are usually used at elevated and cryogenic temperatures in the automotive and computer industry, the temperature dependent properties ranging from –40 to 180 o C are critical for the design of devices utilizing permanent magnetic materials. To enlarge the use of bonded magnets, it is essential to establish a data-base of mechanical characteristics over the operational temperature range. This will provide valuable information for material designers to tailor the formulation and process parameters to achieve the desired mechanical properties. This research included a series of mechanical properties testing following appropriate ASTM standards. Tensile and bending strengths were evaluated, since these are considered to be the most fundamental characteristics describing the mechanical behavior of materials. Young’s modulus was measured using the dynamic impulse vibration method and compared with that obtained from tensile tests. Scanning Electron Microscopy (SEM) analyses indicated that the debonding on the Nd-Fe-B particle and Nylon interface was the main cause of failure at room and elevated temperatures.
Transcript of ABSTRACT - University of Michigan · ABSTRACT Garrell, Monika ... Ma from Magnequench who provided...

ABSTRACT Garrell, Monika Gerda. Mechanical Properties of Injection-Molded Nd-Fe-B Type Permanent Magnets. (Under the direction of Dr. Albert Shih)
The goal of this research was to investigate the mechanical properties of injection molded
Nylon and PPS-based Nd-Fe-B type magnets. The development of new Nd-Fe-B type
magnetic materials and the advancement of near-net shape injection molding processes for
magnetic component manufacturing have driven the needs to evaluate the mechanical properties
of these newly developed materials. PPS (Polyphenylene-Sulfide) and Nylon (Polyamide) are
the two most common binders used for these injection molded rare earth magnets.
Since magnetic materials are usually used at elevated and cryogenic temperatures in the
automotive and computer industry, the temperature dependent properties ranging from –40 to
180 oC are critical for the design of devices utilizing permanent magnetic materials. To enlarge
the use of bonded magnets, it is essential to establish a data-base of mechanical characteristics
over the operational temperature range. This will provide valuable information for material
designers to tailor the formulation and process parameters to achieve the desired mechanical
properties.
This research included a series of mechanical properties testing following appropriate
ASTM standards. Tensile and bending strengths were evaluated, since these are considered to
be the most fundamental characteristics describing the mechanical behavior of materials.
Young’s modulus was measured using the dynamic impulse vibration method and compared
with that obtained from tensile tests. Scanning Electron Microscopy (SEM) analyses indicated
that the debonding on the Nd-Fe-B particle and Nylon interface was the main cause of failure at
room and elevated temperatures.

MECHANICAL PROPERTIES OF INJECTION-
MOLDED ND-FE-B TYPE PERMANENT MAGNETS
by MONIKA GERDA GARRELL
A Thesis submitted to the Graduate Faculty of North Carolina State University
in partial fulfillment of the requirements for the Degree of Master of Science
DEPARTMENT OF MECHANICAL AND AEROSPACE ENGINEERING
Raleigh
April 4, 2002
APPROVED BY:
Chair of Advisory Committee

ii
BIOGRAPHY
Monika Garrell was born outside of Bamberg, Germany in April 1966. She is the daughter
of Klaus and Margot Ring. After moving to the United States in 1997, she decided to enroll at
North Carolina State University where she completed the undergraduate degree in Mechanical
Engineering in three years. Monika spent the last two years pursuing a Master of Science
Degree in Mechanical Engineering under the guidance of Dr. Albert Shih.

iii
ACKNOWLEDGEMENTS I would like to thank Dr. Albert Shih for his supervision and support. Without his efforts, I
would have not been able to finish my degree in time. I also want to thank Dr. Joseph David for
his encouragement, wisdom, and friendship, all of which I have deeply missed since his death.
His advice ultimately led to my decision to pursue my Graduate Degree at North Carolina State
University. Special thanks go to the Mechanical Characterization and Analysis Group of the
HTML program at Oak Ridge National Labs. Especially to Dr. Edgar Lara-Curzio, whose
support and advice during the testing was greatly appreciated. And I would like to thank Dr.
Ma from Magnequench who provided funding and support throughout the project. Finally, I
want to thank my daughter Anna, without whose patience and love I would have never made it
through those last two years.

iv
TABLE OF CONTENTS LIST OF FIGURES ................................................................................................................ v LIST OF TABLES ............................................................................................................... vii NOMENCLATURE ............................................................................................................. viii 1 INTRODUCTION......................................................................................................... 1 1.1 Magnetic Material Development .............................................................................. 2 1.2 Injection Molding Development ............................................................................... 5 1.3 Previously Conducted Tests...................................................................................... 7 1.4 Mechanical Tests to be Conducted ........................................................................... 8 2 TEST SETUP............................................................................................................... 9 2.1 ASTM-Standards ...................................................................................................... 9 2.1.1 Tensile Tests (at various temperatures) ................................................................. 9 2.1.2 Bending Tests....................................................................................................... 10 2.1.3 Ultrasonic Determination of Young’s Modulus .................................................. 10 2.2 Injection Molded Materials to be Tested ................................................................ 11 2.3 Geometry of Specimen............................................................................................ 14 2.4 Different Temperature Tests ................................................................................... 14 2.4.1 Manual Grips........................................................................................................ 15 2.4.2 Elevated Temperature Tests................................................................................. 17 2.4.3 Cryogenic Temperature Tests .............................................................................. 17 2.5 Bending Tests.......................................................................................................... 18 2.6 Ultrasonic Tests....................................................................................................... 19 3 ANSYS ANALYSIS ............................................................................................... 21 3.1 Construction of the Model ...................................................................................... 22 3.2 Calculating the Gauge Length................................................................................. 23 3.3 Stress Concentration in the ASTM Model.............................................................. 26 3.3.1 Current Type IV Test Specimen .......................................................................... 26 3.3.2 Stress Concentrations on all ASTM D 638-99 Specimens .................................. 29 3.3.3 Re-Design of Type IV Test Samples ................................................................... 30 3.3.3.1 Single Radius Modifications and Stress-Concentration Factors....................... 31 3.3.3.2 Double Radius Modifications and Stress-Concentration Factors ..................... 32 4 RESULTS AND DISCUSSION.................................................................................. 36 4.1 Averaging................................................................................................................ 36 4.2 Tensile Results ........................................................................................................ 38 4.2.1 Tensile Results for Nylon-Compounds................................................................ 38 4.2.2 Tensile Results for PPS-Compounds ................................................................... 53 4.3 Bending Results ...................................................................................................... 62 4.4 Ultrasonic Results ................................................................................................... 65 5 SCANNING ELECTRON MICROSCOPY.................................................. 67 5.1 Fractured Surfaced of Nylon-Compounds .............................................................. 67 5.2 Fractured Surfaces of PPS-Compounds .................................................................. 71 6 CONCLUSION .......................................................................................................... 74 REFERENCES .................................................................................................................... 76 APPENDIX A..................................................................................................................... 78

v
LIST OF FIGURES CHAPTER 1 Figure 1.1 Permanent Magnet Applications in a Typical Automobile ......................... 1 Figure 1.2 Jet Casting ................................................................................................... 3 Figure 1.3 Hot Plastic Deformation Process ................................................................. 3 Figure 1.4a Example of Metallic Permanent Magnets.................................................... 4 Figure 1.4b Example of Bonded Permanent Magnets .................................................... 4 Figure 1.5 The Reciprocal Screw Process .................................................................... 5 Figure 1.6 Details of the Injection Mold....................................................................... 6 CHAPTER 2 Figure 2.1 Type IV Tensile Specimen.......................................................................... 9 Figure 2.2 Test Set-up for Dynamic Modulus Testing ............................................... 11 Figure 2.3 Flow Chart of the Injection Molding Process............................................ 12 Figure 2.4 SEM micrographs of the two types of Nd-Fe-B particles ......................... 13 Figure 2.5 Dimensioned Drawing of Tensile Specimen (Type IV) ............................ 14 Figure 2.6 Dimensioned Drawing of Flexure Specimen ............................................ 14 Figure 2.7 Set-up for Tensile Tests at Elevated Temperatures ................................... 15 Figure 2.8 Interior of Furnace ..................................................................................... 15 Figure 2.9 Pure Nylon Specimen held by Manual Grips ............................................ 16 Figure 2.10 Connection of Threaded Rod to Crosshead ............................................... 16 Figure 2.11 Utilization of Manual Grips....................................................................... 16 Figure 2.12 Set-up for Tensile Tests at Cryogenic Temperature .................................. 18 Figure 2.13 ATS Controller and Liquid Nitrogen Tank ............................................... 18 Figure 2.14 Fixture for Flexure Tests ........................................................................... 19 Figure 2.15 Dimensioned Drawing for Ultrasonic Setup ............................................. 20 CHAPTER 3 Figure 3.1 Quarter Model of the Type IV Tensile Specimen for ANSYS ................. 22 Figure 3.2 Fractured Ny597 Specimen....................................................................... 26 Figure 3.3 Von-Mises Stress Distribution in the Type IV Quarter Model ................. 27 Figure 3.4 Von-Mises Stress Distribution in the Type IV Half Model ...................... 27 Figure 3.5 Close-Up View of the Area of Maximum Stress....................................... 28 Figure 3.6 Quarter Model with One Radius................................................................ 31 Figure 3.7 Quarter Model with Two Different Radii.................................................. 33 CHAPTER 4 Figure 4.1 Averaging Procedure shown on PPS614 ................................................... 37 Figure 4.2 Pictures of three fractured or deformed tens ile test specimens tested at 100
ºC (a) Ny597, (b) NyZK620, and (c) Ny................................................... 41 Figure 4.2 Comparison of strength at different temperatures for Nylon based
compound with 59.7 vol% of irregular Nd-Fe-B particles ........................ 43 Figure 4.3 Comparison of strength at different temperatures for Nylon based
compound with 59.9 vol% of irregular Nd-Fe-B particles ........................ 44

vi
Figure 4.4 Comparison of strength at different temperatures for Nylon based compound with 60.4 vol% of irregular Nd-Fe-B particles ....................... 45
Figure 4.5 Comparison of strength at different temperatures for Nylon based compound with 71.0 vol% of irregular Nd-Fe-B particles ........................ 46
Figure 4.6 Comparison of strength at different temperatures for Nylon based compound with 62.0 vol% of spherical Nd-Fe-B particles ....................... 47
Figure 4.7 Comparison of strength at different temperatures for the matrix (pure Nylon 11).............................................................................................................. 48
Figure 4.8 Comparison of strength at –40 0C of Nylon based compounds with different concentration of irregular and spherical Nd-Fe-B particles ...................... 49
Figure 4.9 Comparison of strength at 23 0C of Nylon based compounds with different concentration of irregular and spherical Nd-Fe-B particles ...................... 50
Figure 4.10 Strength at 80 0C of Nylon based compounds with spherical Nd-Fe-B particles...................................................................................................... 51
Figure 4.11 Comparison of strength at 100 0C of Nylon based compounds with different concentration of irregular and spherical Nd-Fe-B particles ...................... 52
Figure 4.13 Comparison of strength at different temperatures for PPS based compound with 50.3 vol% of irregular Nd-Fe-B particles.......................................... 54
Figure 4.14 Comparison of strength at different temperatures for PPS based compound with 51.7 vol% of irregular Nd-Fe-B particles.......................................... 55
Figure 4.15 Comparison of strength at different temperatures for PPS based compound with 61.0 vol% of irregular Nd-Fe-B particles.......................................... 56
Figure 4.16 Comparison of strength at different temperatures for PPS based compound with 61.4 vol% of irregular Nd-Fe-B particles.......................................... 57
Figure 4.17 Comparison of strength at –40 0C of PPS based compounds with different concentration of irregular Nd-Fe-B particles ............................................ 58
Figure 4.18 Comparison of strength at 23 0C of PPS based compounds with different concentration of irregular Nd-Fe-B particles ............................................ 59
Figure 4.19 Comparison of strength at 100 0C of PPS based compounds with different concentration of irregular Nd-Fe-B particles ............................................ 60
Figure 4.20 Comparison of strength at 180 0C of PPS based compounds with different concentration of irregular Nd-Fe-B particles ............................................ 61
Figure 4.21 Comparison of bending strength at 23 0C of Nylon-based compounds with different concentration of irregular shape Nd-Fe-B particles.................... 63
Figure 4.22 Comparison of bending strength at 23 0C of PPS-based compounds with different concentration of irregular shape Nd-Fe-B particles.................... 64
CHAPTER 5 Figure 5.1 SEM micrographs of fracture surfaces of Ny597 with irregular plate shape
particles...................................................................................................... 68 Figure 5.2 SEM micrographs of the fractures surfaces of NyZK620 with spherical
shape particles ........................................................................................... 70 Figure 5.3 SEM micrographs of the fractures surfaces of PPS503 with irregular plate
shape particles ........................................................................................... 72

vii
LIST OF TABLES CHAPTER 2 Table 2.1 Numbering Scheme....................................................................................... 13 CHAPTER 3 Table 3.1 Maximum Stresses from ANSYS ................................................................. 24 Table 3.2 Summary of Calculated Gauge Length......................................................... 25 Table 3.3 Contour-Plots and Stress Concentration Factors of ASTM D 638-99 Test
Specimen....................................................................................................... 30 Table 3.4 Contour-Plots and Stress Concentration Factors of Modified Test Specimen
with One Radius............................................................................................ 32 Table 3.5 Contour-Plots and Stress Concentration Factors of Modified Test Specimen
with Two Radii.............................................................................................. 35 CHAPTER 4 Table 4.1 Dynamic Modulus Comparison.................................................................... 66

viii
NOMENCLATURE b width of flexural bar (mm) d applied displacement (mm) ff fundamental resonant frequency of bar in flexure in Hz l original gauge length of specimen (mm) ?l change in gauge length (mm) m mass of flexural bar in gramm (g) t thickness of flexural bar (mm) x horizontal coordinate of point of intersection of arcs (mm) y vertical coordinate of point of intersection of arcs (mm) E Young’s Modulus (MPa or GPa) Kf Stress Concentration factor L length of flexural bar (mm) R Grindo-Sonic reading RI inner radius (mm) RO outer radius (mm) T1 Correction factor e Strain (mm/mm or %) ? Angle describing arclength µ Poisson’s Ratio s Stress (MPa)

1
1 INTRODUCTION
Permanent magnetic materials play an important part in powering accessories,
emission control, and energy conversion in modern automobiles and trucks. In 2000, an
average car employed approximately 25 electric motors, actuators, and sensors that
contain permanent magnets. Some applications of the permanent magnets are as
illustrated in Figure 1.1. Due to the high demand for better emissions control and more
automation in the car, the average number of permanent magnet applications in a car is
expected to rise to 32 by 2005.
Ferrite, a magnet material developed in the 1950’s, is currently the dominating
permanent magnet material used in automotive applications, with a (BH)max of about 2 to
4 MGOe. There are two new developments that enable the application of much higher
Cruise Control
Mirror Motors
TailGate Motor
Door LockMotor
Four Wheel
Steering
Anti-skidSensor and
Motor
WindowLift
MotorSuspension
System
FuelPumpMotor
Chip Collector
Seat Belt
Motor
Seat AdjustMotors
AntennaLift
Motor
TractionControl
Heat-AirCondition
Motor
Throttle and
CrankshaftPositionSensors
WindshieldWiperMotor
StarterMotor
CoolantFan
Motor
IgnitionSystems
HeadlightDoorMotor
Economy and
PollutionControl
LiquidLevel
Indicators
WindshieldWasherPump
Gauges
TapeDriveMotor
HeadRest
Motor
SunRoofMotor
ElectricPower
Steering and Sensor
Lumbar Support
AutomaticTemperature
Control
DoorGasket
DefoggerMotor Speakers
Cruise Control
Mirror Motors
TailGate Motor
Door LockMotor
Four Wheel
Steering
Anti-skidSensor and
Motor
WindowLift
MotorSuspension
System
FuelPumpMotor
Chip Collector
Seat Belt
Motor
Seat AdjustMotors
AntennaLift
Motor
TractionControl
Heat-AirCondition
Motor
Throttle and
CrankshaftPositionSensors
WindshieldWiperMotor
StarterMotor
CoolantFan
Motor
IgnitionSystems
HeadlightDoorMotor
Economy and
PollutionControl
LiquidLevel
Indicators
WindshieldWasherPump
GaugesGauges
TapeDriveMotor
HeadRest
Motor
SunRoofMotor
ElectricPower
Steering and Sensor
Lumbar Support
AutomaticTemperature
Control
DoorGasket
DefoggerMotor Speakers
Figure 1.1 Permanent Magnet Applications in a Typical Automobile

2
performance ((BH)max of 8 to 12 MGOe) permanent magnetic material in the
transportation industry. One is the development of new nano-structured Neodymium-
Ferrite-Boron (Nd-Fe-B) intermetallic permanent magnetic materials. Another is the use
of the injection molding process to mass-produce bonded Nd-Fe-B permanent magnets,
making them cost competitive with the traditional Ferrite. The use of such high (BH)max
permanent magnets could increase the efficiency and reduce the weight of motors and
actuators on cars and trucks. This, in turn, can improve the vehicle’s fuel efficiency.
These injection molded Nd-Fe-B magnets could also have widespread impact upon the
energy savings and performance of electrical motors used in various other industries.
1.1 MAGNETIC MATERIAL DEVELOPMENT
High-energy magnets based on Nd2Fe14B were first reported in late 1983 [1,2].
Since then, much research has been devoted to the improvement of the intrinsic material
properties and the development of fabrication techniques to use various rapid
solidification methods to produce the desired nano-structured Nd-Fe-B powders.
The Nd2Fe14B intermetallic compound is the main phase of the magnetic material.
Alloys with nominal compositions near the stoichiometric Nd2Fe14B are prepared by melt
spinning or jet casting, as illustrated in Figure 1.2, to achieve a 106 ºC/sec or faster
cooling rate. This rapid cooling reduces the α-Fe phase, maximizes the Nd-Fe-B phase,
and allows the desired magnetic properties.

3
The ribbons or flakes that are produced are then ground to particles of less than 40
ANSI mesh size. Afterwards, a controlled thermal treatment is usually applied to
develop appropriate microstructure and desired magnetic properties. Because of the fine
crystalline size, powders obtained are typically magnetically isotropic. This isotropy can
be converted into anisotropic characteristics by using a hot plastic deformation process to
press the NdFeB powder at an elevated temperature above 700 ºC as shown in Figure 1.3.
Anisotropic powder should yield magnetic properties of much higher (BH)max, if an
appropriate magnetic field is used to align the crystals to a preferred direction. (For the
Nd2Fe14B type materials, the c-axis is the preferred direction.) Because most of the
crystals are aligned in the same direction, a significantly higher Br and, consequently,
(BH)max can be obtained when compared to isotropic powder. To gain the full advantage
Figure 1.3 Hot Plastic Deformation Process
Figure 1.2 Jet Casting

4
of this anisotropic characteristic, powders also need to be aligned to their preferred
orientation by applying a magnetic field of sufficient strength (> 10 kOe) during the
injection molding process. Thus, the aligning magnetic field configuration and the mold
design are important.
The Nd-Fe-B type magnets can be typically classified in two categories: metallic and
bonded. Figure 1.4 shows examples of metallic and bonded permanent magnets. The
metallic magnet can be produced either by the conventional alloy casting and powder
metallurgy method or by a technique involving hot pressing and die upsetting. In
general, metallic Nd-Fe-B magnets are fully dense and anisotropic in nature with (BH)max
ranging from 25 to 45 MGOe. Metallic Nd-Fe-B magnets do, however, require grinding
steps to bring them into the required shape and dimensional tolerances. A surface coating
is also required to prevent environmental corrosion or degradation. These two steps
usually contribute a significant portion to the magnet production costs. Further, the
finishing grinding steps limit their usage in applications where complicated geometry is
required.
Figure 1.4 a Example of Metallic Permanent Magnets
Figure 1.4 b Example of Bonded Permanent Magnets

5
1.2 INJECTION MOLDING DEVELOPMENT
Injection molding offers an efficient means to produce magnets of near net shape and
low cost. This process offers great potential for cost reduction for the electromotors and
actuators industry. Net shape manufacturing offers the advantage of high-volume
production of magnets with accurate dimension tolerances. Moreover, polymer binders,
if properly selected, can also serve as an insulator to isolate the magnetic powder from
exposure to the environment and act, therefore, as a protection against possible corrosion.
Unlike metallic magnets, bonded magnets require a binder to “glue” magnetic
powders together. The Nd-Fe-B magnetic powder is mixed with the thermo-set or
thermo-plastic type polymer/resin and other additives. This mixed powder is then
kneaded and pelletized before injecting to a mold.
The reciprocal screw rotating in a heated barrel, as illustrated in Figure 1.5, is used to
inject the molten mixture of magnetic powder and polymer resin to a mold.
Figure 1.5 The Reciprocal Screw Process

6
As shown in Figure 1.6, the mold has runner, secondary runner, spruce, and gate to
direct the material to the cavity, which is shaped to match the part geometry. Multiple
parts, all with near net-shape geometry, can be made in each injection stroke. This has
made the injection molding process ideal for high volume production for the
transportation industry.
There are two means to increase the (BH)max of bonded magnets. One is to increase
the volumetric percentage of the magnetic powder in the bonded magnet. The other is to
use an anisotropic powder and to utilize a magnetic field to align the magnetic powder
during the injection molding process. Increasing the concentration of particles, however,
will weaken the strength of bonded magnets.
Two commonly used polymer resins to mix with magnetic powder for injection
molding are Polyamide (Nylon) and Polyphenylenesulfide (PPS). PPS has better
toughness at elevated temperature (180 ºC) than Nylon. However, since PPS has higher
Figure 1.6 Details of the Injection Mold
7
viscosity, injection molding of a PPS/NdFeB compound is more difficult. The screw and
mold clamping forces are higher, the operating temperatures in the barrel and mold are
higher, and wear of screw and mold are more prominent.
1.3 PREVIOUSLY CONDUCTED TESTS
In addition to the magnetic properties, the mechanical properties such as the tensile
and bending strength, as well as Young's modulus are also of importance to automotive
applications. To assure non-failing operations in automotive applications, the injection
molded magnets must meet certain minimum mechanical strength requirements within
the entire operation temperature range, typically from –40 to 180 ºC.
The magnetic properties of bonded magnets have been previously studied [3,4].
However, the design of magnets for motors and actuators does not just encompass the
selection of magnetic properties. Mechanical properties at cryogenic and elevated
operating temperatures are just as crucial in the correct choice of material. This data,
however, is not available for newly developed Nylon-based injection molded Nd-Fe-B
magnets. Previously, mechanical properties of sintered Nd-Fe-B type magnets have been
researched. The typical properties determined encompassed the bending strength [5],
fracture toughness [6], and uniaxial tensile strength [7] of sintered Nd-Fe-B magnets.
Ikuma et al. [8] measured the shear strength of extrusion-molded Nd-Fe-B magnets.
Xiao and Otaigbe [9] studied the effect of liquid crystal polymer and surface modification
on mechanical properties of PPS bonded magnets.

8
1.4 MECHANICAL TESTS TO BE CONDUCTED
The objective of this study was to determine the mechanical properties of Nylon
bonded Nd-Fe-B specimens according to ASTM standards D638-99 [10] for tensile tests,
D790-99 [11] for flexural bending tests, and C1259-98 [12] for dynamic Young’s
modulus measurements. Two types of Nd-Fe-B particles were studied. One type of
particle was of irregular plate shape; the other was of spherical shape. Tensile strength
was tested at –40, 23, and 100 ºC to investigate the strength of Nylon bonded magnets at
all operating temperatures. PPS-based magnets were analyzed at –40, 23, 100, and 180
ºC. Only room temperature (23 ºC) tests were conducted for the bending and dynamic
Young’s modulus tests. SEM was used to examine the fracture surface and gain insight
into the failure mechanism.

9
2 TEST SETUP
2.1 ASTM-STANDARDS
2.1.1 Tensile Tests (at various temperatures)
To test the tensile properties of the materials, ASTM Standard D 638-99 [10] was
used. This testing method can be applied to unreinforced and reinforced plastics in the
form of dumbbell-shaped test specimens under defined conditions of pretreatment,
temperature, humidity, and testing machine speed. The specimens were held in place by
hydraulic grips. The loadcell had a capacity of 100 kN. The material to be tested was
injection molded into the geometry of specimen Type IV as shown in Figure 2.1. This
type was chosen since the materials were expected to behave like nonrigid plastics and
since the thickness of the specimens did not exceed 4 mm.
Figure 2.1 Type IV Tensile Specimen

10
2.1.2 Bending Tests
The ASTM Standard D 790-99 [11] was chosen to determine the flexural properties
of the Nd-Fe-B compounds. In context with the standard, a four-point bend test was
selected. The main difference between the three-point bend and the four-point bend is
the location of the maximum bending moment and thus, the maximum axial stresses. In
the 3-point bend, the maximum stresses occur on a line under the loading nose, whereas
in the 4-point bend the maximum stresses can be found over an area between the loading
noses.
2.1.3 Ultrasonic Determination of Young's Modulus
To determine the dynamic Young's modulus, ASTM Standard D 1259-98 [12] was
applied. This method makes the determination of dynamic elastic properties possible. It
can be applied to advanced isotropic ceramics at ambient temperatures. This test is based
on the fact that advanced ceramics possess specific mechanical resonant frequencies in
the flexural mode of vibration that are directly related to Young's modulus, mass, and
geometry of the test specimen. Now, since mass and geometry are known, and the
resonant frequency can be measured with the correct apparatus, the elastic modulus can
easily be determined. The specimens used in this test were of the same dimensions as the
ones used for the bending tests. Figure 2.2 shows the Grindo-Sonic MK4i tester that was
used for the measuring of the frequency, as well as the test setup.

11
2.2 INJECTION MOLDED MATERIALS TO BE TESTED
Injection molding of Nd-Fe-B type magnets offers an economically efficient means
to produce magnets of any shape. Polymer binders, such as Polyamide-11 (Nylon-11) or
Polyphenylenesulfide (PPS) can serve as a protection against possible corrosion and,
more importantly, will increase the mechanical properties of the material. The steps
necessary to form magnets of various shapes through the injection molding process are
shown in Figure 2.3. First, the NdFeB powder is mixed with the synthetic resin (i.e.
Nylon or PPS) and other additives. This compound is then kneaded and pelletized before
it is being injected into a mold. During the molding, a magnetic field is applied to
generate anisotropic magnets. This anisotropy, however, is only applicable to the
magnetic properties, not to the mechanical properties of the magnets. The part is then
cooled, removed from the mold, deburred and finally, magnetized.
Figure 2.2 Test Set-up for Dynamic Modulus Testing

12
Eight of the tested materials contained irregular plate shape Nd2Fe14B particles (150
µm x 150 µm x 30 µm) embedded in either a Nylon or a PPS matrix. Another magnetic
material tested contained spherical Nd2Fe14B particles with a diameter of 30 µm,
embedded in a Nylon matrix. The irregular plate shape Nd-Fe-B particles (Figure 2.4 (a))
were produced through the melt-spinning and grinding methods. This procedure creates
thin plates of about 35 µm thickness. The size of the flakes varies significantly from as
small as 10 µm to as large as 500 µm. The spherical particles (Figure 2.4 (b)) were
produced with the atomization method. Their sizes vary as well, ranging from 5 µm to
50 µm diameters. These two types of particles were injection molded at different volume
percentages to create tensile and flexural specimens.
Figure 2.3 Flow Chart of the Injection Molding Process

13
The chosen numbering scheme reflects the volume percentage of particles to matrix.
For example, PPS517 is a PPS matrix with 51.7 volume % of Nd2Fe14B particles. The
volume percent was calculated using specific densities of particles and matrix. Table 2.1
below summarizes the tested materials.
* denotes spherical shape particles, all others contain irregular plate shape particles
Numbering Scheme Matrix Estimated vol-%
Ny597 Nylon-11 59.7
Ny599 Nylon-11 59.9
Ny604 Nylon-11 60.4
Ny710 Nylon-11 71.0
NyZK620 * Nylon-11 62.0
PPS503 Polyphenylenesulfide (PPS) 50.3
PPS517 Polyphenylenesulfide (PPS) 51.7
PPS610 Polyphenylenesulfide (PPS) 61.0
PPS614 Polyphenylenesulfide (PPS) 61.4
Table 2.1 Numbering Scheme
(a) (b) Figure 2.4 SEM Micrographs of the Two Types of Nd-Fe-B Particles Used in this Study (a) Irregular, Plate Shape Particle Made by Melt Spinning and Grinding and
(b) Spherical Shape Particle Made by Atomization.

14
2.3 GEOMETRY OF SPECIMEN
The specimens for the tensile and bending tests were injection molded based on the
specified dimensions in the two ASTM standards (D 638-99 and D 790-99) [10,11].
Figures 2.5 and 2.6 below show dimensioned drawings of the tensile and the bending
specimen, respectively.
2.4 DIFFERENT TEMPERATURE TESTS
The higher and lower temperature tensile tests were carried out based on ASTM
Standard D 638-99 [11] as well. An Applied Test Systems (ATS) furnace was used in
combination with an ATS PID-controller (see Figures 2.7 and 2.8.) Since the materials
were expected to yield under much lower load, the loadcell for this test format was
chosen with a capacity of 1000 N.
Figure 2.5 Dimensioned Drawing of Tensile Specimen (Type IV)
Figure 2.6 Dimensioned Drawing of Flexure Specimen

15
2.4.1 Manual Grips
The ATS furnace made the use of manual grips necessary. These grips were
machined from steel in two parts. The base was secured to threaded rods, which in turn
were connected to the base of the MTS tester and the cross-head. The base as well as the
cover were serrated to assure better grip of the specimen. The cover was held in place by
two screws. Lock-washers and anti-seize compound were used to assure smooth
operation under the varying load conditions. Figure 2.9 shows a pure Nylon specimen
clamped into the manual grips before mounting it onto the MTS tester. Figures 2.10 and
2.11 show the connection from the threaded rod to the cross-head and the mounted
specimen in the interior of the furnace.
Figure 2.8 Interior of Furnace Figure 2.7 Set-up for Tensile Tests at Elevated Temperatures

16
Figure 2.9 Pure Nylon Specimen held by Manual Grips
Figure 2.10 Connection of Threaded Rod to Crosshead
Figure 2.11 Utilization of Manual Grips

17
2.4.2 Elevated Temperature Tests
In order to determine the time needed for the specimen to reach the necessary
temperatures, one thermocouple was mounted onto the gauge section of the specimen and
one thermocouple was placed into the furnace to monitor temperature increase. The high
fluctuations in temperature through the overshoot of the PID controller made a higher
setpoint of 113 ºC necessary for the 100 ºC tests. Time and temperature were monitored
to find the delay until the furnace and the surface of the specimen had reached a stable
100 ºC. This point was reached after 15 minutes. An additional 5 minutes were granted
for the specimen to uniformly reach 100 ºC. Thus, 20 minutes were set aside before each
material could be tested.
The same procedure was followed to determine the time-delay for the 180 ºC tests.
Here, the setpoint of the controller was chosen to 195 ºC. Again, 20 minutes were
deemed sufficient for the specimen to reach a uniform temperature distribution of 180 ºC.
2.4.3 Cryogenic Temperature Tests
The same Applied Test Systems (ATS) furnace and ATS PID-controller were used
for the low temperature tests (-40 ºC) of the compounds. The furnace was connected to a
liquid Nitrogen (LN) bottle through a thermally insulated rubber hose. Since the
overshoot of the controller could now be restricted through the manually adjusted valve
on the LN tank, the setpoint on the controller was selected to be –42 ºC. Again, the time
was monitored until the specimen reached a uniform temperature. This was achieved
after 10 minutes. Figures 2.12 and 2.13 below show the setup for the cryogenic testing.

18
The black hose in the picture is the connection to the liquid nitrogen tank. Figure 2.12
shows the ATS controller in the background.
2.5 BENDING TESTS
The four-point flexural tests were performed on a MTS 120 testing machine. To
control the crosshead speed and to measure the deflection of the specimen under load, an
INSTRON 8500 controller was used. The crosshead speed was set to 0.01 mm/s. Figure
2.14 shows the fixture for the 4-point bend test.
Figure 2.12 Set-up for Tensile Test at Cryogenic Temperature
Figure 2.13 ATS Controller and Liquid Nitrogen Tank

19
2.6 ULTRASONIC TESTS
The same specimens that were used for the bending tests were utilized in the
ultrasonic determination of the dynamic modulus. The specimens were placed onto two
rubber supports, spaced apart as described in the applicable ASTM standard [12]. Figure
2.15 shows a dimensioned drawing of the correct setup. This simply supported beam was
then tapped with a small metal hammer and probed to measure the frequency response.
Since the same specimens that were used for the bending tests were utilized in the
ultrasonic determination of the dynamic modulus, it was impossible to test for the shear
modulus as well, and thus for Poisson's ratio. Poisson's ratio, however, is necessary to
analyze the data. Therefore, different values for Poisson’s ratio in a range from 0.2
(ceramics) [13] to 0.4 (Nylon and/or PPS) [14] were selected and Young’s modulus was
determined for each of those values.
Figure 2.14 Fixture for Flexure Tests

20
Figure 2.15 Dimensioned Drawing for Ultrasonic Setup

21
3 ANSYS ANALYSIS
While the MTS extensometer delivered very repeatable and reliable data from the
tests carried out at room temperature, its response taken at elevated and cryogenic
temperatures proved not dependable. During testing, it was already realized that at
elevated temperatures the extensometer slipped numerous times. The way of affixing the
extensometer to the test specimen was the reason for the slipping. The extensometer was
attached to the sample via rubber bands, which was sufficient at room temperature. At
elevated temperatures, however, rubber stretches and the extensometer slipped therefore.
A clip-on extensometer would have given more reliable data, as the preliminary testing
showed. The clip-on extensometer, however, was not for the final testing.
At cryogenic temperatures, the extensometer froze up. This could have been avoided
by using a furnace with humidity control. Unfortunately, such a furnace was not
accessible for testing.
The issues with the extensometer left the strength data to be presented relative to the
displacement of the cross-head. Such data, however, is customarily presented in relation
to the percent strain the specimen undergoes. Since the cross-head displacement data was
reliable, the gauge- length of the specimen had to be found.
It was thus decided to develop a finite-element model of the sample, apply a
prescribed displacement at the end-nodes (where the grip would be holding the specimen)
and calculate the stress in the specimen. Applying Hooke's Law and the Stress-Strain
relationship, the gauge- length of the samples was determined.

22
The finite-element analysis provided not only means to calculate the gauge- length,
but showed stress-concentrations in the specimen. This stress-concentration was
noticeable during testing, as all specimens failed in the transition between gauge-area and
grip-area. Additional finite-element models were constructed to counteract the effect of
stress-concentration through a change in geometry of the test specimen.
3.1 CONSTRUCTION OF THE MODEL
To simplify the analysis, a quarter-model of the specimen was constructed. To do
this, the correct geometry was laid out in AutoCad. The key-points were taken from that
model, and a quarter of it was modeled in ANSYS. Figure 3.1 below shows the quarter
model as input into ANSYS.
Edge AB of this model was constrained with rollers in the x-direction and fixed in
the y-direction. The right hand side (BD) was modeled with rollers in the y-direction and
fixed in the x-direction. The section of the left side (AC) that would be held by the grip
Figure 3.1 Quarter Model of the Type IV Tensile Specimen for ANSYS
A
D
C
B
y
x

23
(of a length of 17 mm) was replaced with a prescribed displacement of 0.1 mm in the
negative x-direction (to the left).
Plane2 triangular structural solid elements were chosen in ANSYS over Plane42
structural solid elements. Both elements can be used for 2-D modeling of solid structures
by invoking either the plane stress or the plane strain option. The nodes that make up
each element have two degrees of freedom each: one in the x-direction and one in the y-
direction. The displacement behavior of the Plane2 elements is quadratic, much like the
Plane42 elements. Plane2 elements, however, are 6-node triangular with 12 degrees of
freedom and thus are better suited for irregular meshes than the Plane42 elements, which
are 4-node rectangular.
The model was generated with a mesh of 442 elements. The ANSYS built in h-
solver analyzed the problem as a static, structural analysis with plane stress option.
3.2 CALCULATING THE GAUGE LENGTH
Since the materials were expected to have different moduli of elasticity, a range for
Young’s modulus was chosen. The Poisson’s ratio of the tested compounds was
unknown as well, so there too, a range was selected. The ANSYS model was run several
times with fixed geometry, fixed constraints, and fixed applied displacement. The only
changing variables were Young’s modulus and Poisson’s ratio. The stresses resulting
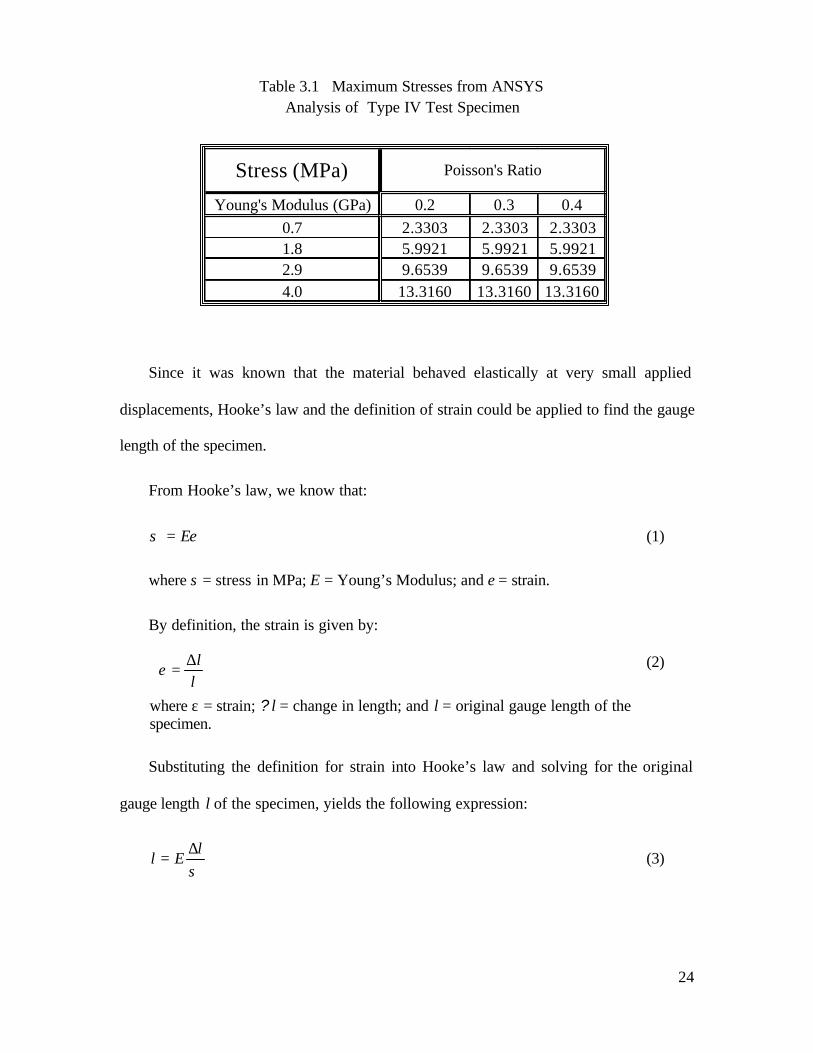
from these analyses were recorded and tabulated as can be seen in Table 3.1 below.
24
Since it was known that the material behaved elastically at very small applied
displacements, Hooke’s law and the definition of strain could be applied to find the gauge
length of the specimen.
From Hooke’s law, we know that:
εσ E= (1)
where s = stress in MPa; E = Young’s Modulus; and e = strain.
By definition, the strain is given by:
(2)
where ε = strain; ?l = change in length; and l = original gauge length of the specimen.
Substituting the definition for strain into Hooke’s law and solving for the original
gauge length l of the specimen, yields the following expression:
σl
El∆
= (3)
Young's Modulus (GPa) 0.2 0.3 0.40.7 2.3303 2.3303 2.33031.8 5.9921 5.9921 5.99212.9 9.6539 9.6539 9.65394.0 13.3160 13.3160 13.3160
Stress (MPa) Poisson's Ratio
Table 3.1 Maximum Stresses from ANSYS Analysis of Type IV Test Specimen
ll∆
=ε

25
Now, the change in length was the applied displacement, d. However, since only a
quarter of the actual specimen was modeled, this displacement had to be doubled before
it could be substituted in to the above equation. Therefore:
dl 2=∆ (4)
where d = applied displacement in the x-direction.
Thus, the gauge length of the specimen could now be determined through the
following expression:
σd
El2
= (5)
Table 3.2 below gives a summary of the calculated gauge length for varying Young’s
modulus and Poisson’s ratio.
The values in the above table were averaged and the standard deviation was
calculated. The gauge length of the tensile specimen was thus determined to be 60.0787
mm, with a standard deviation of 0.0005936 mm.
Young's Modulus (GPa) 0.2 0.3 0.40.7 60.0781 60.0781 60.07811.8 60.0791 60.0791 60.07912.9 60.0793 60.0793 60.07934.0 60.0781 60.0781 60.0781
Gaugelength (mm) Poisson's Ratio
Table 3.2 Summary of Calculated Gaugelength in mm
26
3.3 STRESS CONCENTRATION IN THE ASTM MODEL
3.3.1 Current Type IV Test Specimen
The ANSYS analysis of the Type IV tensile test specimen not only provided the
necessary data for the strain calculations, but also supported a failure phenomenon which
became apparent during testing. All of the tensile specimen, whether Nylon or PPS
based, fractured during cryogenic and room temperature tests in the same area, namely, in
the area of stress concentration. This stress concentration arises through a change in
geometry from the slender test section to the larger section at which the grips are
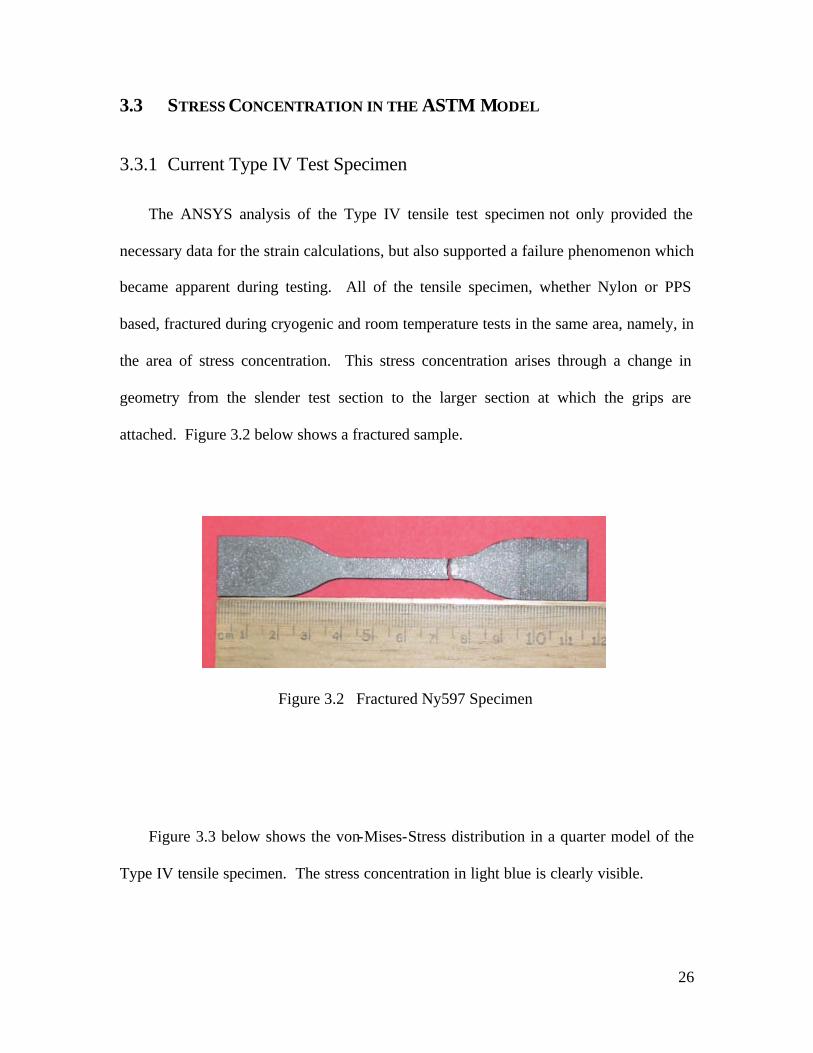
attached. Figure 3.2 below shows a fractured sample.
Figure 3.3 below shows the von-Mises-Stress distribution in a quarter model of the
Type IV tensile specimen. The stress concentration in light blue is clearly visible.
Figure 3.2 Fractured Ny597 Specimen

27
Figure 3.4 Von-Mises Stress Distribution in the Type IV Half Model
Figure 3.3 Von-Mises Stress Distribution in the Type IV Quarter Model
Nominal Stresses for Kf calculation
Maximum Stresses for Kf calculation

28
To verify the validity of the quarter model, as well as to check the magnitude of the
stress concentration, one half of the specimen was modeled. Figure 3.4 above shows the
result of this analysis with the same prescribed displacement, the same Young’s Modulus
and the same Poisson’s ratio as chosen for the qua rter model of Figure 3.3 above.
Figure 3.5 below shows a close-up of the area of stress concentration. The stress
concentration factor (Kf) that resulted from this analysis lies at 1.08 and was calculated
by comparing the nominal stresses in the gauge-section to the maximum stress at the
point of stress concentration as shown in Figure 3.3.
Figure 3.5 Close-up View of the Area of Maximum Stress in the Type IV
specimen

29
3.3.2 Stress Concentrations on all ASTM D 638-99 Specimens
In addition to Type IV specimens, ASTM standard D 638-99 offers three other
shapes. Type I and II are specimens to be used for materials with a thickness of less than
7 mm, whereas Type III specimen are required for materials with a thickness between 7
and 14 mm. Type I specimen must be used to test reinforced composites and are the
preferred form for rigid and semirigid plastics. Type II samples may be used if Type I
samples do not break in the narrow section. Type III specimens must be used for all
materials with a thickness greater than 7 mm. As mentioned above, Type IV specimens
are only permitted for testing nonrigid plastics with a thickness of 4 mm or less.
The finite-element analysis of the different specimens was carried out in the same
manner as for the Type IV sample. The same Plane2 elements were chosen with the
plane stress option. The models were generated with a mesh of 442 elements. The
ANSYS built in h-solver analyzed the problem as a static, structural analysis. The same
Young's modulus, Poisson's ratio, and thickness were used, and the same boundary
conditions were applied.
Table 3.3 below shows the different contour plots reflecting the von-Mises stresses
of the various test specimens and summarizes the stress-concentration factors. As was to
be expected, Type II specimens show the smallest stress-concentration factor due to the
large radius in the transitional area.

30
ASTM 638-99 Samples Contour-Plots (Von-Mises Stress in MPa)
Stress-Concentration
Factor Kf
Type I
1.046
Type II
1.014
Type III
1.068
Type IV
1.119
3.3.3 Re-Design of Type IV Test Samples
Following the good results obtained in the analysis of Types I through III, the next
step was to re-design the current Type IV sample. The simpler geometry with one radius
only of Types I through III was especially appealing, since it would simplify
manufacturing of the specimens drastically. Therefore, the first modification involved a
change to a simpler geometry with only one radius. Overall length, overall width, narrow
section length and width were left as described by ASTM standard D 638-99. Thickness,
Table 3.3 Contour-Plots and Stress Concentration Factors of ASTM D 638-99 Test Specimens
31
Young's modulus, Poisson's ratio, and prescribed displacement were held constant, as
was the mesh of the specimen.
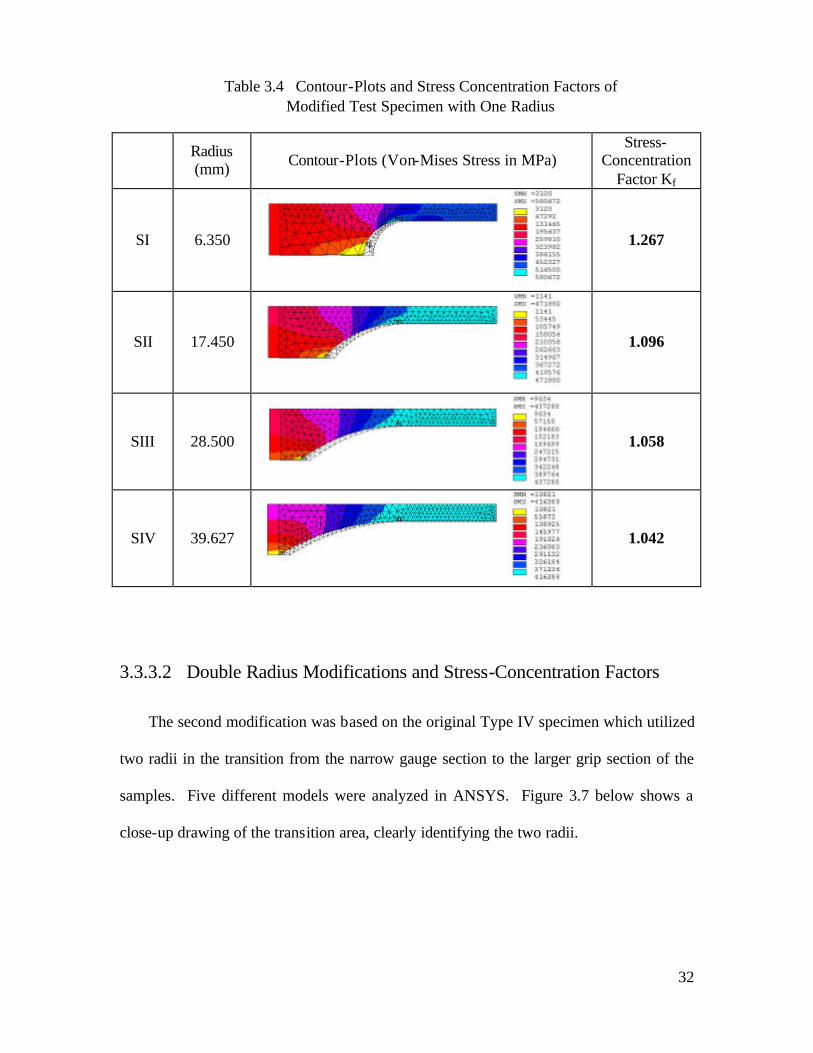
3.3.3.1 Single Radius Modifications and Stress-Concentration Factors
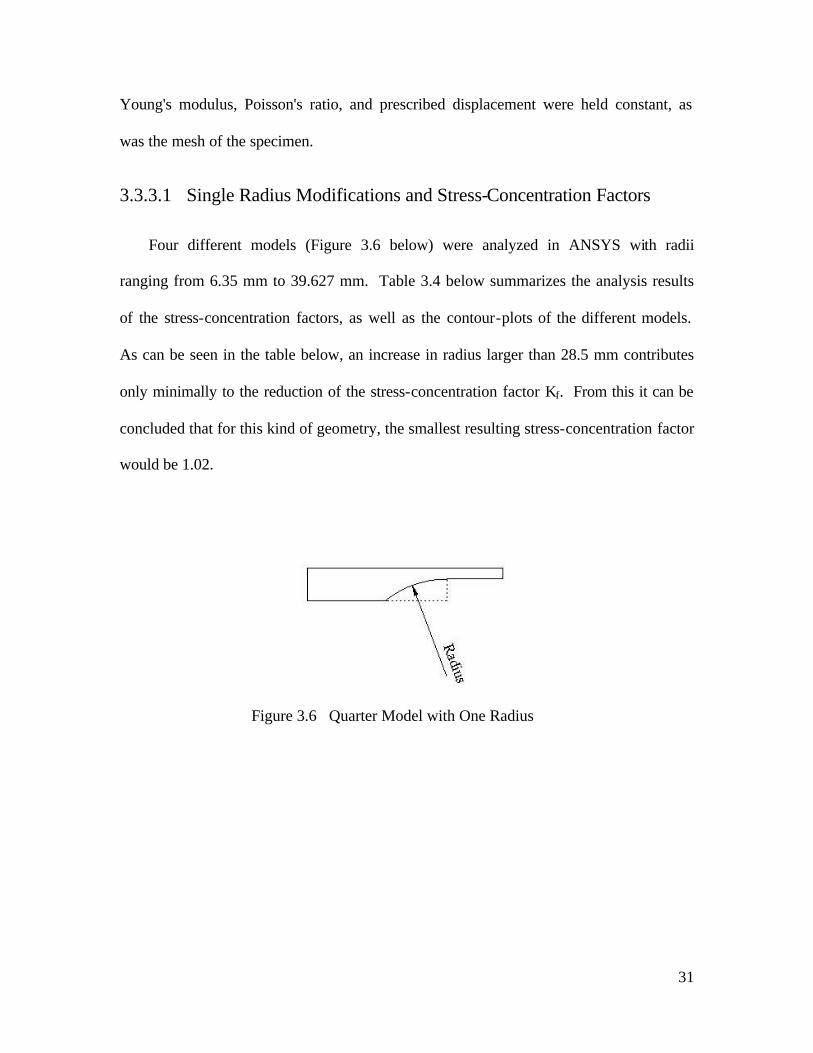
Four different models (Figure 3.6 below) were analyzed in ANSYS with radii
ranging from 6.35 mm to 39.627 mm. Table 3.4 below summarizes the analysis results
of the stress-concentration factors, as well as the contour-plots of the different models.
As can be seen in the table below, an increase in radius larger than 28.5 mm contributes
only minimally to the reduction of the stress-concentration factor Kf. From this it can be
concluded that for this kind of geometry, the smallest resulting stress-concentration factor
would be 1.02.
Figure 3.6 Quarter Model with One Radius
32
Radius (mm) Contour-Plots (Von-Mises Stress in MPa)
Stress-Concentration
Factor Kf
SI 6.350
1.267
SII 17.450
1.096
SIII 28.500
1.058
SIV 39.627
1.042
3.3.3.2 Double Radius Modifications and Stress-Concentration Factors
The second modification was based on the original Type IV specimen which utilized
two radii in the transition from the narrow gauge section to the larger grip section of the
samples. Five different models were analyzed in ANSYS. Figure 3.7 below shows a
close-up drawing of the transition area, clearly identifying the two radii.
Table 3.4 Contour-Plots and Stress Concentration Factors of Modified Test Specimen with One Radius

33
From rules of geometry, the two angles that describe the arclength have to be equal
and can thus be related through the following equations:
(6)
(7)
where: RI = inner radius, RO = outer Radius, y = vertical coordinate of the point of intersection of arcs, x = horizontal coordinate of the point of intersection of arcs
Setting the equations from set (1) equal to each other and solving for RO yields:
yyRI
RO−
=35.6
(8)
Doing the same to equation set (2) and solving for RI yields:
ROx
xRI
−=
516.21 (9)
( ) ( )( )( )( ) xRO
xRI
yROROyRIRI
=−=
−=−−=
θθ
θθ
sin515.21sin
cos35.6cos
Figure 3.7 Quarter Model with Two Different Radii

34
Substituting (4) into (3) and solving for x yields:
yx35.6516.21
= (10)
Using Pythagoream theorem and substituting equation (5) for x yields:
(11)
Substituting (6) back into (5), and the resulting expression back into (4), yields the
following relationship between the two radii:
RORI −+
=7.12
35.6516.21 22 (12)
Table 3.5 below summarizes the selected radii for the modification, the
corresponding contour-plots, and the corresponding stress-concentration factors. Model
D1 is the current Type IV specimen. As was expected, the model with the larger radii at
the transition point from narrow gauge-section to larger grip-section shows the lowest
stress-concentration factor.
( )
( )ROy
xyRORO
22
2
222
35.6516.21
35.62
+=
+−=

35
Radius
RI (mm)
Radius RO
(mm) Contour-Plots (Von-Mises Stress in MPa)
Stress-Concentration
Factor Kf
DI 14.224 25.400 1.119
DII 16.627 23.000 1.113
DIII 19.816 19.816 1.084
DIV 22.627 17.000 1.073
DV 25.400 14.224 1.090
Table 3.5 Contour-Plots and Stress Concentration Factors of Modified Test Specimen with Two Radii
36
4 RESULTS AND DISCUSSION
4.1 AVERAGING
Five tensile tests were carried out for each compound of Table 2.1 at different
temperatures. In addition, some of the compounds were tested in bending. There, seven
tests were performed. In order to find representable data, the results for each compound
were compared. Test results that fell outside a range of acceptable data were discarded.
Figure 4.1 shows the averaging process of PPS614 at room temperature. The data was
averaged up to the point were the first specimen broke. This resulted in presenting the
lowest possible ultimate tensile strength. The data resulting from this averaging
procedure enabled a comparison of the different compounds at various temperatures as
well as a comparison of the varying strength with changing temperature per compound.
The bending results were averaged in the same manner to yield a comparison of
bending strength in different compounds with regard to their volume percentage of
particles.

37
0
10
20
30
40
50
0 0.05 0.1 0.15 0.2 0.25Strain (%)
Stre
ss (M
Pa)
PPS614RT01
PPS614RT02
PPS614RT03
PPS614RT04
PPS614RT05
AVERAGE
.02% Offset
Figure 4.1 Averaging Procedure shown on PPS614
38
4.2 TENSILE RESULTS
Four different temperature tests were carried out for each PPS compound of Table
2.1. Unlike PPS based compounds, Nylon based compounds could only withstand
temperatures up to 100 0C. Nylon based injection molded magnetic materials containing
irregular particles were tested at only three different temperatures (-40 0C, 23 0C, and 100
0C), while the compound containing spherical particles was tested at four temperatures.
The values represent the arithmetic average of all the measurements made for each
compound. The sample standard deviation for the strength at any strain did not exceed
5.63 MPa, which indicates that the samples were of uniform quality and the tests were
reproducible. The presented values are engineering stresses and strains.
4.2.1 Tensile Results for Nylon-Compounds
Figures 4.3 through 4.8 reflect a comparison of tensile strength vs. strain at different
testing temperatures for each Nylon-based compound. Figures 4.9 through 4.12 show the
relationships of tensile strength and strain for the different compounds at each testing
temperature.
More than 60% reduction on the tensile strength at high temperatures for Nylon
based compounds was observed. For higher temperatures (80 °C and 100 °C), the
amorphous regions of the nylon matrix deform as a thermoplastic, while the crystalline
regions deform as a rigid solid [15]. The apparent strain hardening effect is due to the
increased flow resistance of the matrix as the polymer chains elongate and transfer load
to the crystalline regions. There is also a severe constraint due to the high volume

39
fraction of the Nd-Fe-B particles. Localized strains in ligaments surrounding the
particles can be significantly larger than the nominal strain.
The tensile strength for Ny597 and NyZK620 at –40 °C is increased by over 50%
relative to that of room temperature. This can be explained with the transition of the
Nylon bond to a more brittle, glassy phase at low temperature. At cryogenic temperature,
the difference in thermal expansion coefficient of Nylon (2.3 -11x10-5 /°C) [16] and Nd-
Fe-B (4 – 8x10⁻⁶ /°C) [17] generates a compressive residual stress on the Nd-Fe-B
particle by the surrounding Nylon bond. This compressive residual stress on the interface
between the matrix and Nd-Fe-B particle can help improve the tensile strength of Nylon
injection molded magnets at cryogenic temperature.
The ultimate tensile strength increases in general with increasing volume percentage
of Nd-Fe-B particles. The compounds with higher percentage of Nd-Fe-B, Ny710,
showed overall much lower strength compared to that the other two compounds. One
compound with 59.9 vol% of Nd-Fe-B particles behaved unpredictably. To follow the
general trend, it was expected that its ultimate tensile strength would fall within that of
Ny604 and that of Ny597. Instead it exceeded the tensile results of Ny604. Scanning
Electron Microscopy showed that Silicon-Carbide-Fibers were used as a reinforcement of
the matrix in this particular compound.
In comparison to the Nylon-11 based compounds containing rectangular particles, a
Nylon-11 matrix surrounding spherical Nd-Fe-B particles with a concentration of 62 vol-
% was tested. This compound was tested at four temperatures (-40 0C, 23 0C, 80 0C and
100 0C). As can be seen in Figure 4.6, this combination behaves in a much more ductile
manner than the other tested compounds. The overall tensile strength, however, has been

40
drastically reduced at all tested temperatures. The difference in the behavior of the
compound at –40 and 23 0C as compared to the behavior at 80 and 100 0C can be
explained with the glass transition temperature of Nylon-11. This temperature lies at
around 50 0C [16] and is the reason for the shift from brittle to ductile behavior. A strain
hardening effect comes into play at elevated temperatures as well and explains the
increased tensile strength at 80 and 100 0C. The difference in the thermal expansion
coefficient of Nylon-11 [16] and Nd-Fe-B [17] particles explains why the material
exhibits higher tensile strength at cryogenic temperature in comparison to the results at
room temperature.
Pure Nylon-11 was tested as well. This offered a verification of the tensile results, as
the ultimate tensile strength of this material is openly available. This material was tested
at four temperatures (-40 0C, 23 0C, 70 0C and 120 0C). Figure 4.8 shows a comparison
of the test results at these temperatures. At room-temperature the specimen did not reach
the maximum tensile strength. Rather, the tests were interrupted because the maximum
range of the tensile tester was reached. The data gathered from the cryogenic
temperature test resulted in an expected curve. From the curves of the elevated
temperature test data it can be clearly seen that a material hardening effect as a function
of strain set in after about 10 % strain were achieved. The failure mode at these elevated
temperatures is different as well. A relative linear increase in strength with increased
strain points toward necking of the material, which was clearly visible during the test as
well.

41
At all temperatures, the strain to fracture for the NyZK620, the compound containing
spherical particles (Figure 4.7) is much larger than for Nylon-based compounds
containing irregular shape particles (Figures 4.3 through 4.6). This is illustrated in
pictures of the deformed test samples in Figure 4.2. Different levels of strain can be seen
on Ny597, NyZK620, and Ny tensile specimen tested at 100 °C. The Ny597 sample
shown in Figure 4.2(a) has small strain to fracture. This specimen still resembles the
original geometry of tensile test specimen. Figure 4.2(b) illustrates the relatively large
deformation (15% strain) achieved on the NyZK620 with spherical particles. As shown
in Figure 4.2(c), the pure Nylon, Ny, sample continued to deform and did not fracture at
the end of test when 160% strain was attained.
(a)
(c)
(b)
Figure 4.2 Pictures of three fractured or deformed tensile test specimens tested at 100 ºC (a) Ny597, (b) NyZK620, and (c) Ny

42
The very large effect of particle shape on the strain-to-fracture at about the same
volume fraction of particles (NyZK620 vs. NY597) is surprising. The sharp angular
particles, and perhaps also the fine dispersion of very small angular particles, evidently
initiates very rapid fracture of the matrix ligaments as strain is increased. The particle
angularity causes much larger stress intensification compared to the spherical particles.
In addition, the higher strength levels reached for the compound with irregular shape
particles at the given strain seem to accelerate failure.

43
0
10
20
30
40
0.0 0.2 0.4 0.6 0.8 1.0Strain (%)
Stre
ss (M
Pa)
23 deg. C
100 deg. C
-40 deg. C
Ny597
Figure 4.3 Comparison of strength at different temperatures for Nylon based compound with 59.7 vol% of irregular Nd-Fe-B particles

44
0
10
20
30
40
0 0.2 0.4 0.6 0.8 1
Strain (%)
Stre
ss (M
Pa)
Ny599
23 deg. C
Figure 4.4 Comparison of strength at different temperatures for Nylon based compound with 59.9 vol% of irregular Nd-Fe-B particles

45
0
10
20
30
0 0.2 0.4 0.6 0.8 1Strain (%)
Stre
ss (M
Pa)
Ny604
23 deg. C
100 deg. C
Figure 4.5 Comparison of strength at different temperatures for Nylon based compound with 60.4 vol% of irregular Nd-Fe-B particles

46
0
10
20
30
40
50
0 0.2 0.4 0.6 0.8 1Strain (%)
Stre
ss (M
Pa)
Ny710
100 deg. C
23 deg. C
-40 deg. C
Figure 4.6 Comparison of strength at different temperatures for Nylon based compound with 71.0 vol% of irregular Nd-Fe-B particles

47
0
10
20
0 2 4 6 8 10 12 14 16
Strain (%)
Stre
ss (M
Pa)
-40 deg. C80 deg. C
100 deg. C
23 deg. C
NyZK620
Figure 4.7 Comparison of strength at different temperatures for Nylon based compound with 62.0 vol% of spherical Nd-Fe-B particles

48
0
20
40
60
80
0 40 80 120 160 200
Strain (%)
Stre
ss (M
Pa)
-40 deg. C
70 deg. C
120 deg. C
23 deg. C
Nylon 11
Figure 4.8 Comparison of strength at different temperatures for the matrix (pure Nylon 11)

49
Figure 4.9 Comparison of strength at –40 0C of Nylon based compounds with different concentration of irregular and spherical Nd-Fe-B particles
0
10
20
30
40
50
0 0.2 0.4 0.6 0.8 1Strain (%)
Stre
ss (M
Pa)
Ny597
Ny710
NyZK: max. Strain @ ~ 1.94 % max. Stress @ ~ 8.26 MPa
-40 deg. C

50
0
10
20
30
40
50
0 0.2 0.4 0.6 0.8 1Strain (%)
Stre
ss (M
Pa)
Ny710
Ny599
NyZK: max. Strain @ ~ 7.8 % max. Stress @ ~ 4.9 MPa
Ny597
Ny604
23 deg. C
Figure 4.10 Comparison of strength at 23 0C of Nylon based compounds with different concentration of irregular and spherical Nd-Fe-B particles
51
0
2
4
6
8
10
12
14
16
0 2 4 6 8 10 12 14 16
Strain (%)
Stre
ss (M
Pa)
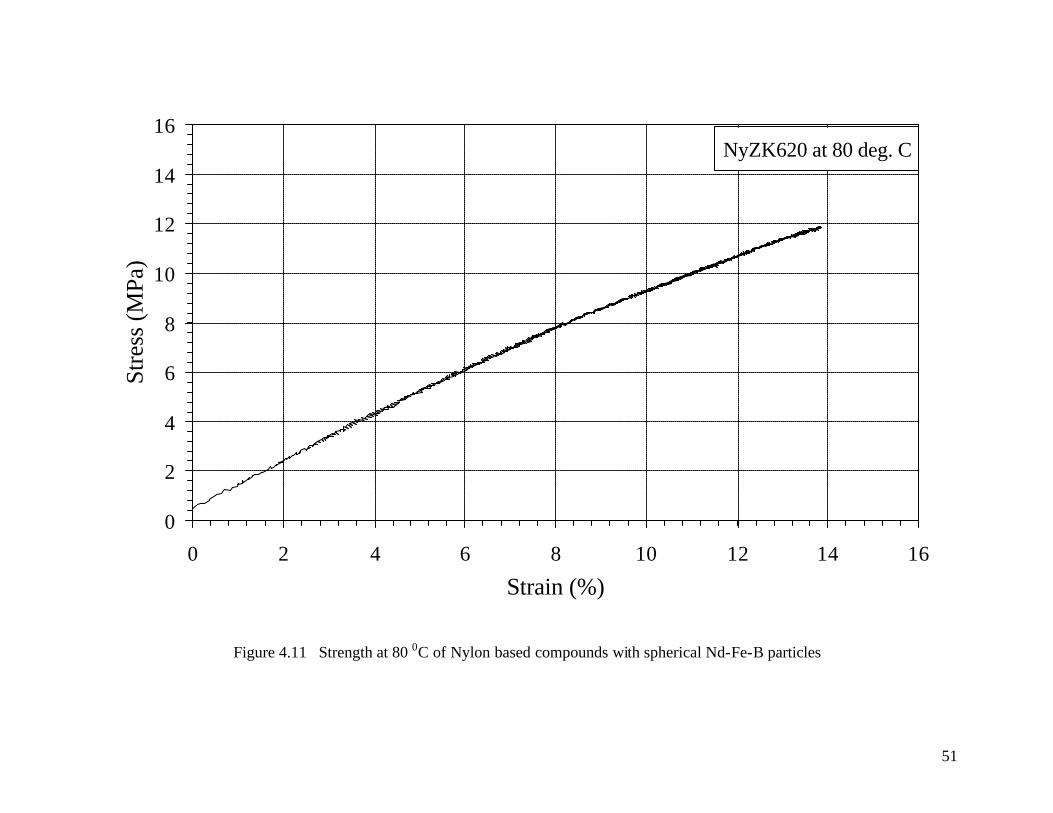
NyZK620 at 80 deg. C
Figure 4.11 Strength at 80 0C of Nylon based compounds with spherical Nd-Fe-B particles

52
0
5
10
0 0.2 0.4 0.6 0.8 1Strain (%)
Stre
ss (M
Pa)
Ny710
Ny597
Ny604
NyZK: max. Strain @ ~ 14.64 % max. Stress @ ~ 10.7 MPa
100 deg. C
Figure 4.12 Comparison of strength at 100 0C of Nylon based compounds with different concentration of irregular and spherical Nd-Fe-B particles

53
4.2.2 Tensile Results for PPS-Compounds
The test results confirm that the PPS injection molded magnets can withstand the 180
°C operation temperature required for some automotive applications. However, more
than 60% reduction on the tensile strength at high temperatures (100 and 180 °C) for all
four PPS compounds is observed.
The tensile strength for PPS503 and PPS517 at –40 °C is increased by about 20%
relative to that of room temperature. This can be explained by the transition of the PPS
bond to a more brittle, glassy phase at low temperature. At cryogenic temperature, the
difference in thermal expansion coefficient of PPS (5.3x10⁻⁵ /°C) [18] and Nd-Fe-B (4 –
8x10⁻⁶ /°C) [17] generates a compressive residual stress on the Nd-Fe-B particle by the
surrounding PPS bond. This compressive residual stress on the interface between the
PPS bond and Nd-Fe-B particle can help improve the tensile strength of PPS injection
molded magnets at cryogenic temperature.
The ultimate tensile strength decreases in general with increasing volume percentage
of Nd-Fe-B particles. The two compounds with higher percentage of Nd-Fe-B, PPS610
and PPS614, showed overall much higher strength compared to that the other two
compounds.

54
0
10
20
30
40
50
60
70
80
90
0 0.2 0.4 0.6 0.8 1 1.2 1.4 1.6 1.8
Strain (%)
Stre
ss (M
Pa)
PPS503
-40 deg. C
23 deg.
180 deg. C
100 deg.
Figure 4.13 Comparison of strength at different temperatures for PPS based compound with 50.3 vol% of irregular Nd-Fe-B particles

55
0
10
20
30
40
50
60
70
0 0.2 0.4 0.6 0.8 1 1.2 1.4 1.6 1.8
Strain (%)
Stre
ss (M
Pa)
PPS517
100 deg. C
23 deg. C
180 deg. C
-40 deg. C
Figure 4.14 Comparison of strength at different temperatures for PPS based compound with 51.7 vol% of irregular Nd-Fe-B particles

56
0
10
20
30
0 0.2 0.4 0.6 0.8 1 1.2 1.4 1.6 1.8
Strain (%)
Stre
ss (M
Pa)
100 deg. C
PPS610
23 deg. C
180 deg. C
Figure 4.15 Comparison of strength at different temperatures for PPS based compound with 61.0 vol% of irregular Nd-Fe-B particles

57
0
10
20
30
40
0 0.2 0.4 0.6 0.8 1 1.2 1.4 1.6 1.8
Strain (%)
Stre
ss (M
Pa)
PPS614
100 deg.
23 deg. C
180 deg.
Figure 4.16 Comparison of strength at different temperatures for PPS based compound with 61.4 vol% of irregular Nd-Fe-B particles

58
0
10
20
30
40
50
60
70
80
90
0 0.2 0.4 0.6 0.8 1 1.2 1.4 1.6Strain (%)
Stre
ss (M
Pa) PPS503
PPS517
-40 deg. C
Figure 4.17 Comparison of strength at –40 0C of PPS based compounds with different concentration of irregular Nd-Fe-B particles

59
0
10
20
30
40
50
60
70
0 0.2 0.4 0.6 0.8 1 1.2 1.4 1.6Strain (%)
Stre
ss (M
Pa)
PPS517
PPS503
PPS 614
PPS610
23 deg. C
Figure 4.18 Comparison of strength at 23 0C of PPS based compounds with different concentration of irregular Nd-Fe-B particles

60
0
10
20
30
0 0.2 0.4 0.6 0.8 1 1.2 1.4 1.6Strain (%)
Stre
ss (M
Pa)
PPS503
PPS614
PPS517
PPS610
100 deg. C
Figure 4.19 Comparison of strength at 100 0C of PPS based compounds with different concentration of irregular Nd-Fe-B particles

61
Figure 4.20 Comparison of strength at 180 0C of PPS based compounds with different concentration of irregular Nd-Fe-B particles
0
10
20
0 0.2 0.4 0.6 0.8 1 1.2 1.4 1.6Strain (%)
Stre
ss (M
Pa)
PPS610
PPS614
PPS517
PPS503
180 deg. C

62
4.3 BENDING RESULTS
Since the tensile tests had proven that the properties are very similar for similar
volume percentage of particles in the matrix, the tests were carried out for only two of the
PPS compounds and only three of the Nylon compounds of Table 4.1. Seven bending
tests were performed for each material. The averaged results are presented in Figures
4.20 and 4.21. The values represent the arithmetic average of all the measurements made
for each compound. The sample standard deviation for the strength at any displacement
across the test range did not exceed 5.5 MPa. This indicates that the samples were of
uniform quality and the tests were reproducible.
The results of the bending tests follow the general trend that was observed in the
tensile tests. The PPS compound with lower volume percent of Nd-Fe-B did withstand
not only higher stress but also larger displacement. Compared to the tensile strength data
at 23 °C, the bending strength is higher, i.e., 65 vs. 40 MPa for PPS614 and 85 vs. 63
MPa for PPS517.
The bending tests on the Nylon compounds followed the general trend observed
from the tensile data as well. The bending strength increased as well with increasing
concentration of particles. Compared to the tensile strength at 23 °C, the bending
strength is higher here as well, 50 vs. 23 MPa for Ny604, 55 vs. 33 MPa for Ny599, and
40 vs. 20 MPa for Ny597. Due to the non-uniform loading in bending, such trend is
commonly observed in comparing the strength results in bending and tensile tests.

63
0
10
20
30
40
50
60
0 0.1 0.2 0.3 0.4 0.5 0.6 0.7 0.8
Deflection (mm)
Stre
ss (M
Pa)
Ny597
Ny604Ny599
Figure 4.21 Comparison of bending strength at 23 0C of Nylon-based compounds with different concentration of irregular shape Nd-Fe-B particles

64
0
10
20
30
40
50
60
70
80
90
0 0.1 0.2 0.3 0.4 0.5 0.6 0.7
Displacement (mm)
Stre
ss (M
Pa)
PPS614
PPS517
Figure 4.22 Comparison of bending strength at 23 0C of PPS-based compounds with different concentration of irregular shape Nd-Fe-B particles

65
4.4 ULTRASONIC RESULTS
Again, due to the similarity in properties, only two of the PPS compounds and only
three of the Nylon compounds were considered in this test. Ten frequency readings that
fell within a standard deviation of 1.5 were obtained following the ASTM Standard [12]
procedure. The Dynamic Young's modulus was then calculated in the following manner:
( )( ) 1332 //9465.0 TtLbmfE f= (13)
where: E = Young's Modulus; m = mass of bar in g; b = width of bar in mm; L = length of bar in mm; t = thickness of bar in mm; ff = fundamental resonant frequency of bar in flexure in Hz; given by:
(14)
R = Grindo-Sonic reading T1 = correction factor as to be determined according to ASTM Standard [12].
The correction factor T1 is a function of Poisson's ratio, which was unknown and
could not be determined experimentally, since specimen geometry did not allow testing
for the shear modulus. Young's modulus was thus calculated using different values for
Poisson's ratio, ranging from 0.2 for ceramics [13] to 0.4 for plastics such as Nylon or
PPS [14]. Poisson's ratio, however, only contributes minimally to the calculation of
Young's modulus. So is, for example, Young's modulus for Ny604 17.63 GPa with a
Poisson's ratio of 0.2 and 17.66 GPa with a Poisson's ratio of 0.4.
Rf f /000,000,2=
66
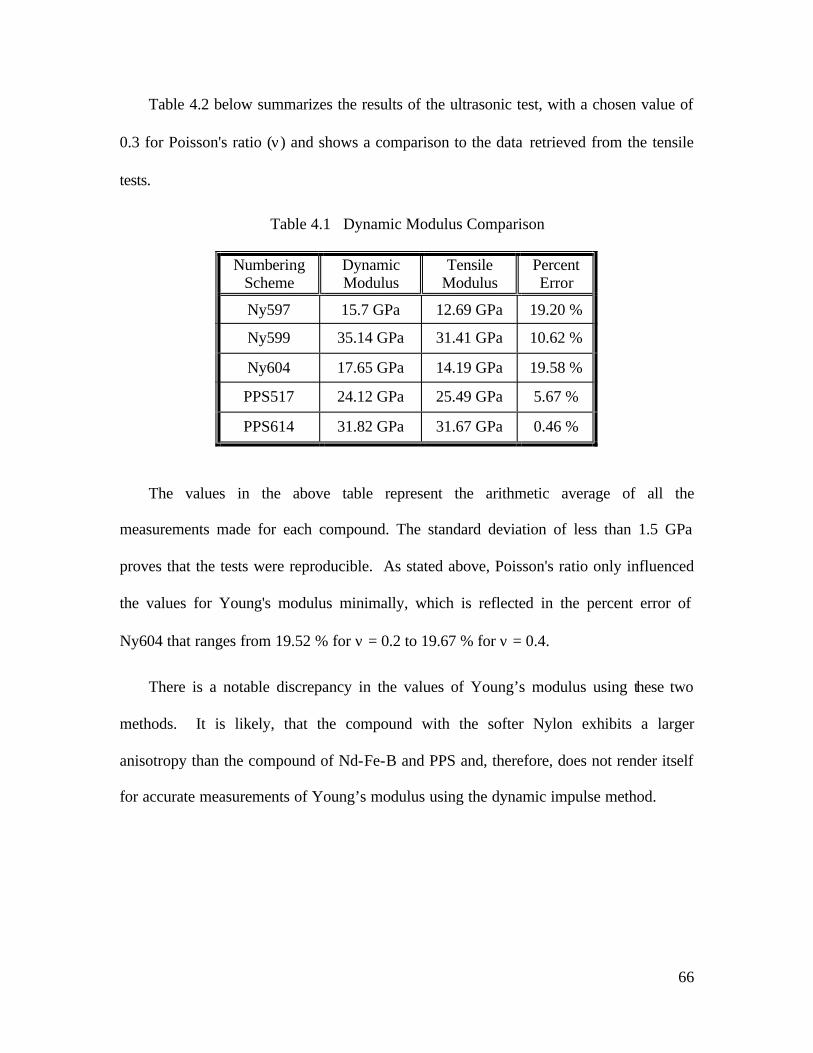
Table 4.2 below summarizes the results of the ultrasonic test, with a chosen value of
0.3 for Poisson's ratio (ν) and shows a comparison to the data retrieved from the tensile
tests.
The values in the above table represent the arithmetic average of all the
measurements made for each compound. The standard deviation of less than 1.5 GPa
proves that the tests were reproducible. As stated above, Poisson's ratio only influenced
the values for Young's modulus minimally, which is reflected in the percent error of
Ny604 that ranges from 19.52 % for ν = 0.2 to 19.67 % for ν = 0.4.
There is a notable discrepancy in the values of Young’s modulus using these two
methods. It is likely, that the compound with the softer Nylon exhibits a larger
anisotropy than the compound of Nd-Fe-B and PPS and, therefore, does not render itself
for accurate measurements of Young’s modulus using the dynamic impulse method.
Numbering
Scheme Dynamic Modulus
Tensile Modulus
Percent Error
Ny597 15.7 GPa 12.69 GPa 19.20 %
Ny599 35.14 GPa 31.41 GPa 10.62 %
Ny604 17.65 GPa 14.19 GPa 19.58 %
PPS517 24.12 GPa 25.49 GPa 5.67 %
PPS614 31.82 GPa 31.67 GPa 0.46 %
Table 4.1 Dynamic Modulus Comparison

67
5 SCANNING ELECTRON MICROSCOPY
RCA Laboratory reported the first research model Scanning Electron Microscope
(SEM) in 1942 [19]. The first commercial SEM became available in 1964 [20] due to
advances in signal processing and amplification. Today, Scanning Electron Microscopy
is commonly used to examine fractured surfaces and to determine failure modes.
SEM utilizes a wide, aligned beam of electrons, which scans across an object. Some
of the electrons are reflected, others are absorbed by the material as the beam of electrons
strikes the object of observation. When electrons are absorbed, the object emits other
electrons. Energy and direction of the reflected and emitted electrons are then detected
and used to produce a picture of the surface features [20].
For an SEM to work properly, conductive materials must be used, since a build up of
net charge is undesirable, causing spots or images that are too bright to be recorded. In
order to view surfaces of non-conductive materials, these materials have to be coated
with conductive powder (typically gold).
The fractured surfaces were examined using the Scanning Electron Microscope
(SEM) to gain insight into the failure mechanism.
5.1 FRACTURED SURFACES OF NYLON-COMPOUNDS
Figure 5.1 show the fracture surfaces of Ny597 in tensile tests at –40, 23, and 100
°C. The irregular plate shape Nd-Fe-B particles can be recognized on the fracture

68
surface. As described in section 2.2, the plate shape particles are aligned during the
injection molding process with the help of a magnetic field. Figure 5.1(c) shows an
overall view of the fracture surface. A vortex shape core can be seen in the middle of the
sample fracture surface. This vortex is created by the flow and cooling of the matrix and
Nd-Fe-B mixture during the injection molding process. The alignment of irregular plate
shape particles along the flow direction helps to retain the brittle characteristics of the
Nd-Fe-B particles, which is reflected in the results of the tensile and bending tests.
At 23 °C, the Nd-Fe-B particles do not fracture. Instead, the particles are pulled out
and leave pockets on the fracture surface, as can be seen in Figure 5.1(d). Figure 5.1(f)
shows such particles pulled out or debonded on the fracture surface of a specimen tested
at 100 °C. The Nylon is soft at 100 °C, and burrs or extrusions on the fracture surface
can be recognized. At –40 °C, the Nylon compound is brittle and the fracture surface is
glassy. Pockets due to particle pull-out cannot be easily identified. It is likely that Nd-
Fe-B particles fracture at cryogenic conditions.
(a) -40 °C (d) -40 °C, close-up view
A

69
Figure 5.2 shows the fracture surfaces of the Nylon compound containing spherical
particles (NyZK620) for the tensile tests conducted at –40, 23, and 100 °C. Debonding
or separation of spherical particles with Nylon bonds is apparently the failure mechanism.
The 62.0 vol-% of spherical Nd-Fe-B particles does not provide structural support, which
Figure 5.1 SEM micrographs of fracture surfaces of Ny597 with irregular
plate shape particles
(e) 100 °C (f) 100 °C, close-up view
(c) 23 °C (d) 23 °C, close-up view
B

70
makes this type of sample very weak in tensile strength. The transition from a glassy,
brittle facture surface at –40 °C to the burr and flash morphology of the fracture surface
at 100 °C can also be seen in Figure 5.2.
(c) 23 °C (d) 23 °C, close-up view
(a) -40 °C (b) -40 °C, close-up view of C
C

71
5.2 FRACTURED SURFACES OF PPS-COMPOUNDS
Figures 5.3 (a through h) show the fracture surfaces of PPS503 at four testing
temperatures. The vortex shape core that was clearly identified in Figure 4.1 (c) is visible
here as well. Again, debonding on the surface between Nd-Fe-B particle and PPS matrix
can be identified as the source for failure. Figure 5.3 ( ) shows the pockets that are left in
the matrix after the particles are pulled out. There is a notable change in the fractured
surface pattern from cryogenic to high temperature tests. At –40 °C, the PPS compound
is brittle and the fractured surface is glassy. At 100 and 180 °C, the PPS matrix is
softened and PPS extrusions or residual burrs can be observed on the rough fracture
surface.
Figure 5.2 SEM micrographs of the fractures surfaces of NyZK620 with spherical shape particles
(e) 100 °C (f) 100 °C, close-up view of D D

72
(a) –40 °C (b) –40 °C, close-up view
(c) 23 °C (d) 23 °C, close-up view of E
E
(e) 100 °C (f) 100 °C, close-up view of F
F

73
Figure 5.3 SEM micrographs of the fractures surfaces of PPS503 with irregular plate shape particles
(g) 180 °C (h) 180 °C, close-up view of G
G

74
6 CONCLUSION
Since the development of new fabrication techniques for high-energy magnets based
on Nd2Fe14B, much research has been devoted to the improvement of the intrinsic
properties of these rare-earth magnets. With the introduction of injection molding as a
means to produce near net shape magnets at low production cost, the need has risen for
the knowledge of the mechanical properties of these bonded, injection-molded magnets.
The automotive and computer industry typically utilizes these magnetic materials.
Therefore, it is essential that the temperature dependent mechanical properties of these
compounds be known for a temperature range of –40 to 180 oC. Since these mechanical
properties are critical for the design of devices utilizing permanent magnetic materials,
tests were conducted to form a database of mechanical characteristics covering the
operational temperature range. This will provide valuable information for material
designers to tailor the formulation and process parameters to achieve the desired
mechanical properties.
Tensile and bending strength, as well as Young’s modulus of Nylon-11 and PPS
bonded Nd-Fe-B magnets were investigated in this study. Two types of particles were
available for testing: irregular plate shape particles with sizes ranging from 10 µm to 500
µm, with a thickness of 30 µm, and spherical particles with diameters ranging from 5 µm
to about 50 µm. The spherical particles, however, were available for testing only in the
Nylon matrix.

75
The tensile strength for all types of compounds showed strong temperature
dependence. Overall, more than 60 % reduction of the tensile strength at high
temperatures for either the Nylon-based or the PPS-based compounds was observed. The
tensile strength at cryogenic temperatures, however, increased in general by over 50 %.
A strong dependence on the concentration of particles, as well as the type of
particles was observed as well. While the tensile strength of PPS compounds decreased
in general with increasing volume percentage of Nd-Fe-B particles, it increased for Nylon
compounds with increasing concentration. The only exception was Ny599, a fiber
enforced Nylon-11 compound with 59.9 vol% of Nd-Fe-B particles. The ultimate tensile
strength of NyZK620, the compound with spherical particles, was drastically reduced at
all testing temperatures. This compound, however, can easily be identified as an
extremely ductile material and could be used for magnetized extruded plastic sheet or
other applications were flexibility is highly desirable.
Scanning Electron Microscopy (SEM) analyses indicated that the debonding on the
Nd-Fe-B particle and Nylon interface was the main cause of failure at room and elevated
temperatures. Fracture of Nd-Fe-B particles was observed on compounds with irregular
shape particle at cryogenic temperature.
In this study it was proven that bending tests give reliable enough results to guide in
the development of new compounds, as trends that follow the bending tests can be
observed during the tensile tests as well. Limitations, however, were observed in using
the impulse vibration method to measure Young’s modulus of bonded magnets.

76
REFERENCES
[1] J. J. Croat, J. F. Herbst, R. W. Lee and F. E. Pinkerton, "Pr-Fe and Nd-Fe-based materials; A new class of high-performance permanent magnets", J. Appl. Phys. 55, 2078-2082 (1984).
[2] M. Sagawa, S. Fujimura, N. Togawa, H. Yamamoto, and Y. Mstsuura, "New material for permanent magnets on a base of Nd and Fe", J. Appl. Phys. 55, 2083-2087 (1984).
[3] V. Panchanathan, "Current status of melt spun NdFeB Magnets", Recent Res. Devel. Magnetics, 1 (2000) 115-137 ISBN81-86846-89-1, Transworld Research Network, T. C. 36/248(1) Trivandrum-695 008, India.
[4] B. M. Ma, J. W. Herchenroeder, D. N. Brown, and Z. Chen, “Recent development in bonded NdFeB magnets,” Journal of Magnetism and Magnetic Materials (in press).
[5] J. Jiang, Z. Zeng, J. Wu and M. Tokunaga, "Influence on alloying elements on mechanical properties and microstructures of sintered Nd-Fe-Co-B magnets," Journal of Magnetism and Magnetic Materials, vol. 214, pp. 61-68, 2000.
[6] J. A. Horton, J. L. Wright, and J. W. Herchenroeder, “Fracture toughness of commercial magnets,” IEEE Trans on Magn, vol. 32, pp. 4374-4376, 1996.
[7] Y. M. Rabinovich, V. V. Sergeev, A. D. Maystrenko, V. Kulakovsky, S. Szymura, and H. Bala, "Physical and mechanical properties of sintered Nd-Fe-B type permanent magnets," Intermetallics, vol. 4, pp. 641-645, 1996.
[8] Ikuma, K., Akioka, K., Shimoda, T., Watanabe, R., and Miyadera, H., “High-energy extrusion-molded Nd-Fe-B magnets,” IEEE Transaction Journal on magnets in Japan, vol. 9, No. 5, pp. 94-99m 1994.
[9] J. Xiao, and J. U. Otaigbe, "Polymer Bonded Magnets. II. Effect of liquid crystal polymer and surface modification on magneto-mechanical properties," Polymer Composites, vol. 21, pp. 332-342, 2000.
[10] ASTM standard D638-99, Standard Test Method for Tensile Strength of Plastics, American Society for Testing and Materials, 1999.
[11] ASTM standard D790-99, Standard Test Methods for Flexural Properties of Unreinforced and Reinforced Plastics and Electrical Insulation Materials, American Society for Testing and Materials, 1999.
[12] ASTM standard C1259-01, Standard Test Method for Dynamic Young's Modulus, Shear Modulus, and Poisson's Ratio for Advanced Ceramics by Impulse Excitation of Vibration, American Society for Testing and Materials, 1998.
[13] B. J. Hamrock, B. Jacobson, S. T. Schmid, "Fundamentals of Machine Elements," McGraw-Hill, Boston, 1999.

77
[14] J. M. Gere, "Mechanics of Materials," 5th Ed., Brooks/Cole Thomson Learning, CA, 2001.
[15] W. D. Callister, "Materials Science and Engineering", p. 357, Wiley, 1985.
[16] N. A. Waterman and M. F. Ashby, "The Materials Selector," Vol. 1, 2nd Ed., Chapman & Hall, 1997.
[17] C. H. Chen, M. S. Walmer, M. H. Walmer, W. Gong, and B. M. Ma, "The relationship of thermal expansion to magnetocrystalline anisotropy, spontaneous magnetization, and Tc for permanent magnets," Journal of Applied Physics, vol. 85, n. 8, pp. 5669-5671, 1999.
[18] D. G. Brady, "Polyphenylene Sulfide (PPS)," Engineering Plastics, Engineered Materials Handbook, ASM International, vol. 2, pp. 186-191, 1995.
[19] V. R. Zworkykin, J. Hillier, and R. L. Snyder, "A Scanning Electron Microscope," ASTM Bulletin, No. 117.
[20] I. Watt, "The Principles and Practice of Electron Microscopy," Cambridge University Press, Cambrigde, 1985.

78
35x 150x 350x 1000x Ny597 –40 °C
Ny597 23 °C (30x, 100x, 500x, 700x)
Ny597 100 °C
Ny597 100 °C (failed 2 Mpa under ave.) (30x, 200x, 350x, 400x)

79
35x 150x 350x 1000x Ny599 23 °C (45x, 90x, 450x, 800x)
Ny604 23 °C (30x, 130x, 300x, 1000x)
Ny604 100 °C
Ny710 –40 °C
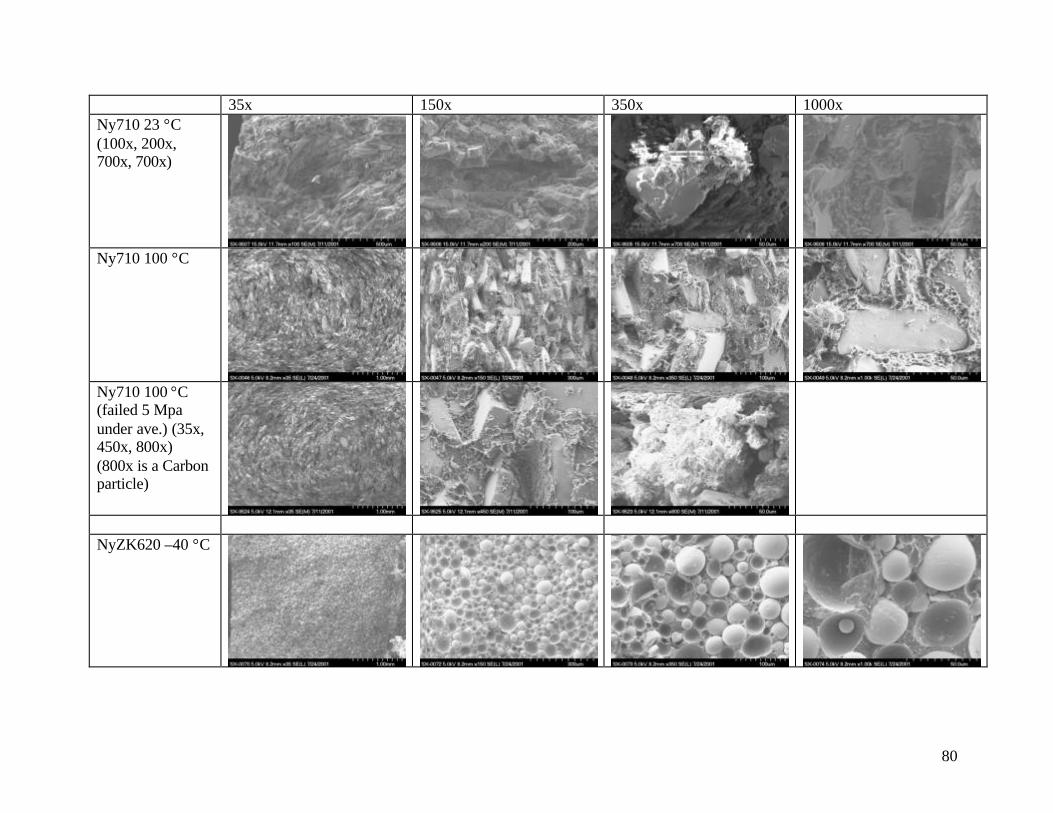
80
35x 150x 350x 1000x Ny710 23 °C (100x, 200x, 700x, 700x)
Ny710 100 °C
Ny710 100 °C
(failed 5 Mpa under ave.) (35x, 450x, 800x) (800x is a Carbon particle)
NyZK620 –40 °C

81
35x 150x 350x 1000x NyZK620 23 °C (80x, 180x, 350x, 700x)
NyZK620 80 °C
NyZK620 100 °C
PPS503 –40 °C (30x, 400x, 450x)

82
35x 150x 350x 1000x PPS503 –40 °C (failed 25 MPa below ave.) (30x, 200x)
PPS503 –40 °C (dto. opposite fracture surface) (45x, 90x, 350x, 600x)
PPS503 23 °C
PPS503 100 °C

83
35x 150x 350x 1000x PPS503 100 °C (failed 10 MPa above ave.) (35x, 100x, 350x, 2000x)
PPS503 180 °C
PPS503 180 °C (failed 4 MPa below ave.) (30x, 250x, 350x, 2000x)
PPS517 –40 °C

84
35x 150x 350x 1000x PPS517 23 °C
PPS517 100 °C
PPS517 180 °C
PPS610 23 °C (30x, 150x, 450x, 1000x)

85
35x 150x 350x 1000x PPS610 100 °C
PPS610 100 °C (failed 2 MPa under ave.) (35x, 150x, 250x, 500x)
PPS610 180 °C
PPS614 23 °C (40x, 350x, 700x, 2000x)

86
35x 150x 350x 1000x PPS614 100 °C
PPS614 100 °C
(failed @ 8 MPa above ave.) (30x, 180x, 350x, 2000x)
PPS614 180 °C