ABSTRACT - University of Melbourne · strategies must be deeply embedded in the classroom reading...
73
Cued use of the R.I.D.E.R strategy improves the listening comprehension of Year One students. ABSTRACT Reading is a complex process. It involves the reader being able to decode words whilst also thinking about the meaning of those words. A proficient reader is one that is adept at both decoding and being able to extract meaning from print. Comprehension is an area of reading in which many students experience difficulty – even those who posses sound decoding skills. One cause of poor comprehension has been identified as the inability to visualise and create meaningful mental images when reading. Research on the development of comprehension skills affirms that the strategy of visualisation is an effective tool for improving students’ comprehension. The present study examined explicit instruction in the R.I.D.E.R strategy with a hypothesis stating cued use of the R.I.D.E.R strategy improves the listening comprehension of Year One students. This study compared two groups of students; an intervention group of four students who received explicit instruction in the R.I.D.E.R strategy and a control group of four students who did not receive any form of intervention. All students were pre and post tested using the same measures. The intervention sessions took place in the classroom as part of the normal Literacy program and during each intervention session students were cued to use the R.I.D.E.R strategy and create mental images about the text they listened to. Results indicate support for the hypothesis as the listening comprehension scores for all students in the intervention group improved following the period of intervention. Findings of the study suggest that teaching students to visualise using the R.I.D.E.R strategy results in students being able to retell a greater number of ideas and events from texts they have been read.
Transcript of ABSTRACT - University of Melbourne · strategies must be deeply embedded in the classroom reading...

Cued use of the R.I.D.E.R strategy improves the listening comprehension of
Year One students.
ABSTRACT
Reading is a complex process. It involves the reader being able to decode words whilst
also thinking about the meaning of those words. A proficient reader is one that is adept
at both decoding and being able to extract meaning from print. Comprehension is an
area of reading in which many students experience difficulty – even those who posses
sound decoding skills. One cause of poor comprehension has been identified as the
inability to visualise and create meaningful mental images when reading. Research on
the development of comprehension skills affirms that the strategy of visualisation is an
effective tool for improving students’ comprehension.
The present study examined explicit instruction in the R.I.D.E.R strategy with a
hypothesis stating cued use of the R.I.D.E.R strategy improves the listening
comprehension of Year One students. This study compared two groups of students; an
intervention group of four students who received explicit instruction in the R.I.D.E.R
strategy and a control group of four students who did not receive any form of
intervention. All students were pre and post tested using the same measures. The
intervention sessions took place in the classroom as part of the normal Literacy program
and during each intervention session students were cued to use the R.I.D.E.R strategy
and create mental images about the text they listened to.
Results indicate support for the hypothesis as the listening comprehension scores for all
students in the intervention group improved following the period of intervention.
Findings of the study suggest that teaching students to visualise using the R.I.D.E.R
strategy results in students being able to retell a greater number of ideas and events
from texts they have been read.

1
This study supports the work of various researchers who found that comprehension
outcomes are improved when students are taught to visualise.
The implication for teaching practice arising out of this study is that comprehension
strategies must be deeply embedded in the classroom reading program and instruction
of the strategies must be explicit and repetitive.
2
INTRODUCTION
Learning to read is a difficult process. Not only do readers have to deal with the
demands of decoding what they are reading, they must also understand what they are
reading – they must comprehend. Harvey and Goudvis (2000) talk about the reading
process involving a two-pronged attack – it requires the reader to be able to crack the
alphabetic code to read words and think about the meaning of those words. Center,
Freeman, Robertson and Outhred (1999) suggest that a proficient reader is one that is
adept at both decoding and being able to extract meaning from print.
Comprehension is a complex process, which various researchers have attempted to
explain in a number of ways. Graham and Bellert (2005, p.73) suggest, “The primary
function of reading is extracting meaning from text.” In the text ‘Strategies that work’,
Harvey and Goudvis (2007) highlight the active role of the reader in constructing
meaning and understanding what they are reading. Bell (1991) identifies that
comprehension includes being able to recall facts, understand the main idea, make
inferences, draw conclusions, predict and evaluate. Researchers are united in the belief
that comprehension instruction must be deeply embedded in classroom practice.
Mastropierei and Scruggs (1997, p.197) state, “Reading comprehension is, arguably,
the most important academic skill learned in school”.
Whilst many children in the early years of schooling learn to become competent
decoders they continue to experience difficulty in comprehending what they are reading.
Bell (1991, p.253) states simply, “Many good decoders are not able to comprehend
efficiently”. Gee (1998), examining children who experience difficulties learning to read,
explains that these students expend so much effort on the process of decoding that they
have very little attention left to attend to the process of meaning-making. If, as Gee
(1998, p.246) purports, “The goal of reading is to understand the text, and reading only
really occurs when it is understood” a large proportion of good decoders are apparently

3
not achieving what we know good readers do. Oakhill (1982; cited in Center et al.,
1999) identifies that poor comprehenders fail to remember and understand connected
text. Very frequently, a lack of understanding of what is being read leads to the reader
becoming disengaged and at worst, a reluctant reader.
According to Gill (2008) the most recent research on comprehension instruction has
focused on identifying the strategies that a good reader uses implicitly and instructing
poor comprehenders in the use of these strategies. A number of research studies have
revealed the following strategies to be effective tools for improving comprehension:
• activating prior knowledge
• generating questions while reading
• visualising the text
• summarising and;
• analysing the structure of stories
(Pressley and Afflerbach, 1995; cited in Gill, 2008)
Visualisation is the ability to construct mental images as one reads. According to
Menner (2007, no page number available online) “The forming of mental images as we
read is crucial to the extensive comprehension of a text.” There exists a powerful body
of evidence to support the premise that visualisation improves comprehension
(Gambrell and Bales, 1986, Pressley, 1976, Sadoski, 1985; cited in Center et.al, 1994;
Sheikh and Sheikh, 1985; cited in Mastropieri and Scruggs, 1997; Clark, Deshler,
Schumaker, Alley and Warner, 1984). Hibbing and Rankin-Erickson (2003, p.760) state
explicitly “Research on mental imagery demonstrates that comprehension of text is
enhanced when students are prompted or taught to use mental imagery.” After Oliver
(1982; cited in Bell, 1991, p.250) had concluded his research into visual imagery and it’s
effect on reading comprehension in children he was able to conclude, “Teachers should
try to help children develop the metacognitive skill of visual imagery as a strategy for
improving comprehension….Visualisation enhances comprehension.”

4
It is thought that creating visual images improves comprehension in three ways. Firstly,
it enables details from the text to be stored as ‘chunks’ of information thus freeing up
storage space and increasing the capacity of the student’s working memory. Secondly,
when generating visual images it appears the student is involved in making
comparisons or analogies – that is matching stored knowledge and experiences with
information in the text. Thirdly, imagery acts as an organisational tool for storing
meaning gained from the text. (Long, Winograd and Bridge, 1989; cited in Bell, 1991).
Furthermore, researchers suggest that the generation of meaningful images has
multiple effects on a reader. It enhances the degree of engagement and enjoyment in
reading (Harvey and Goudvis, 2007; Woolley and Hay, 2004) thus contributing to the
development of life long reading habits. In addition it engages students in the habit of
actively thinking about what they are reading thereby resulting in greater retention and
understanding (Puett Miller, 2004).
“When readers visualise they are actually constructing meaning by creating mental
images…teaching children to construct their own mental images when reading helps
them to stop, think about and understand the information” (Harvey and Goudvis, 2007,
p.18 & 19). In their work with low-ability readers who experienced difficulties visualising,
Hibbing and Rankin Erickson (2003) discuss the use of two techniques that can be
successfully employed to assist students in generating meaningful images. Firstly they
use the analogy of a ‘television in the mind’. This analogy assists the reader in
recognising that there is more to the reading process than simply barking at the words –
reading involves watching images that you create on a ‘mental screen’ as you engage
with a text. Central to this approach is that the pictures on the mental screen need to
match the words of the text. Secondly, they discuss the use of drawings to help
students who are unable to create a picture in their mind due to such factors as difficulty
decoding words in the text, a lack of background knowledge or limited vocabulary.

5
Puett-Miller (2004, no page number available online) affirms this, stating, “The physical
act of creating a picture can help students grasp the concept of visualisation.”
Clark, Deshler, Schumaker, Alley and Warner (1984) devised the R.I.D.E.R strategy to
assist students with poor visual imagery skills. The strategy involves the following steps:
• Read - read the first sentence
• Image – try to make a picture in your mind
• Describe – describe your image
• Evaluate – evaluate the image for completeness. Adjust your image if necessary
• Repeat – read the next sentence and repeat the steps
This strategy, The RIDER strategy requires a student to read a passage and to create
images that are representative of the content of the passage and was shown by Clark et
al. (1984) to be successful in improving comprehension.
In her research identifying imagery as critical to basic comprehension, Bell (1991,
p.248) notes that “Good comprehenders reported good imaging and poor
comprehenders reported weak imaging.” Research has demonstrated that poor readers
do not acquire strategic reading behaviours in the manner that good readers do. That is,
they do not acquire these strategies by themselves (Swanston and De La Paz, 1998).
Readers who do not visualise are considered non-strategic readers and many of these
low ability readers who experience comprehension difficulties are not able to describe
images they form in their mind as they read (Hibbing and Rankin-Erickson, 2003).
There exists a strong base of evidence to support the idea that imagery training can
improve students’ comprehension (Oakhill and Yuill, 1995; cited in Center et al, 1999;
Wooley and Hay, 2004; Pressley, 1976; cited in Woolley and Hay, 2004). Studies
involving the teaching of visual imagery training to poor comprehenders reveal an
improvement in memory and comprehension (Center et al. 1999).
A review of literature on the topics of comprehension and visualisation reveals a
common thread on which all researchers agree - that is the need for explicit instruction
6
of comprehension strategies. Menner (2007), in discussing those strategies which
research has shown to be successful in improving comprehension emphasises that for
‘effective’ comprehension development to occur it is vital that teachers give a name to
the strategy and explain its purpose. When explicit teaching of these
metacomprehension strategies occurs, the reader is able to use them to construct
meaning when they interact with the text. “The National Reading Panel (Institute of
Child Health and Human Development, 2000) reported that when informed and
professional teachers applied research based explicit strategy instruction in the
classroom there was an improvement in comprehension.” (Woolley and Hay, 2004,
p.85)
Studies with students in the early years of schooling reveal that visualisation can be
taught resulting in improved recall of text (Pressley, 1976; Romeo, 2002; cited in
Woolley and Hay, 2004) and improved listening and reading comprehension (Center et
al., 1999). As a result of their research with low listening comprehenders, Center et al.
(1999) propose that visualisation instruction does not need to be delayed until students
have sufficiently developed decoding skills, provided that the visualisation instruction is
undertaken in the context of listening comprehension.
Woolley and Hay (2004) identified some key elements in the teaching of visualisation.
These include teacher explanation, teacher modelling, scaffolding through guided
practice and independent practice. Repeated instruction on a range of texts is also
suggested as a key factor in the teaching of visualisation (Block and Pressley, 2003;
cited in Onofrey and Theurer, 2007). Research indicates that an effective model for
teaching young children comprehension-based strategies is the Gradual Release of
Responsibility model (Pearson and Gallagher, 1983; cited in Pardo, 2004).
Fielding and Pearson (1994) have identified four components of comprehension
instruction to be used with the model:

7
1. Teacher modelling – the teacher explains the strategy and demonstrates how to
apply it. During this phase they think out aloud to model the mental processes used
when visualising.
2. Guided Practice – Following explicit modelling, the teacher and student practise the
strategy together whilst the teacher scaffolds the students’ attempts at using the
strategy.
3. Independent Practice – Students attempt to apply the strategy on their own whilst
still continuing to receive feedback from the teacher.
4. Application of the strategy in real reading situations – The student is able to apply
the strategy when interacting with a text.
Whilst working collaboratively with the students, the teacher slowly withdraws the
amount of support they provide as the students become more confident, knowledgeable
and capable. Thus the students assume more responsibility for applying the strategy as
they interact with text.
This present investigation aims to extend the earlier research by examining the
influence of the cued use of the R.I.D.E.R strategy on listening comprehension.
Hypothesis: Cued use of the R.I.D.E.R strategy improves the listening comprehension
of Year One students.
8
METHOD
Design
The study uses a case study OXO design. Gains in listening comprehension, following
cued use of the R.I.D.E.R strategy, were monitored for Year One students. The study
compares two groups of students, an intervention group and a control group. Explicit
teaching of the R.I.D.E.R strategy was given to the class to which the intervention
students belonged. During this time they were cued in the use of this strategy on text
Participants
The participants are Year One students taken from the two Year One classes within the
school. A total of eight students participated in the study – four from each class. The
four students from the class that the researcher teaches became the intervention group
and the remaining four students from the other class were designated as the control
group. Students were chosen to participate in the study based on their text reading
level, which was assessed at the beginning of the current school year as part of the
Prep – Year Two Literacy Testing. It was decided to have a cross section of reading and
comprehension abilities represented in the student sample to ascertain the effect the
R.I.D.E.R strategy has on students of differing decoding and comprehension abilities.
The students chosen were matched as closely as possible in an effort to make sure that
each group had a similar cohort of students. For the purposes of the study it was
decided not to select Reading Recovery participants to be part of the intervention or
control groups due to the amount of time they are withdrawn from the classroom
environment. Reading Recovery students took part in the teaching sessions; they were
just not selected to use their data. Relevant details for the participants are shown in
Table 1.

9
Student
0 = Intervention 1=Control Group
Age in MONTHS Sex
ESL 0=No 1=Yes
Earlier Intervention 0=No 1=Visual 3=Auditory 4=Speech
Funded/ Teacher Aid Assisted 0=No 1=Yes
I.L.P 0=No 1=Yes
EMA 0=No 1=Yes
Text level PRE
A 0 79 F 0 0 0 0 0 7 B 0 82 M 0 0 0 0 0 13 C 0 75 M 0 0 0 0 0 21 D 0 84 F 0 0 0 0 0 27 E 1 81 F 0 0 0 0 0 7 F 1 81 F 0 0 0 0 0 12 G 1 87 M 0 0 0 0 0 20 H 1 83 M 0 0 0 0 0 27
Table 1 Participant Information
Materials
Pre and Post Test Assessments:
• Running Records – Alpha Asses series (PRE TEST only)
Students read passages of text from books, which have been specially designed to
provide information on their literacy development, and are levelled using Fry’s
Readability Procedure. The reading level of the student is ascertained by having them
continue to read levelled texts until they encounter two consecutive texts levelled at
‘difficult’ (below 90% reading accuracy). The students’ level is recorded as the last text
they read at the ‘easy’ or ‘instructional’ level before the two difficult texts. The test
provides a record of text reading behaviour.
• Record of Oral Language
Students listen to sentences being read to them by the researcher/ teacher and attempt
to repeat them exactly as they have been said. The teacher records the students’
response. The sentences become increasingly complex in nature. A point is awarded
for each sentence repeated correctly. The test provides a measure of the students’ level
of language performance.

10
• Munro Test of Listening Comprehension (Refer to Appendix Four)
Students listened to a short passage of text. At the completion of the passage, students
were asked to recall the story. A checklist was devised for the passage of text and
points were allocated for each of the main ideas/ events students were able to recall.
The test provided a measure of students’ listening comprehension.
• Spontaneous and Cued Retell Analysis (Munro) (Refer to Appendix Five and Six)
Both texts levelled at instructional for Year 1 using Fry’s Readability Procedure.
Students listened to a text being read to them. At the completion of the story, students
were asked to retell the story in their own words (spontaneously) before cued questions
were used to elicit any further details. A checklist was devised for the text and points
were allocated for each of the main ideas/ events students were able to retell under
spontaneous and cued conditions. The test provided a measure of students’
comprehension (literal and inferred) of the text.
• Visualisation Task (Munro) (Refer to Appendix Seven and Eight)
Students were read sentences from a text; initially it was single sentences eventually
building up to two or more sentences. After listening to the sentence/s students were
asked to draw their visualisation. It was explained to students that the focus of the
activity was not on the quality of the drawing, rather the details they included in the
picture. After completing the drawing, students were asked to discuss/ describe their
drawing. A checklist was devised for the text and points were allocated for each of the
main ideas/ events students included in their visualisation (either drawing or
description). The test provided a measure of students’ ability to create mental imagery.
• Teaching Sequence (Refer to Appendix Two)
10 lessons providing explicit instruction in the use of the R.I.D.E.R strategy

11
• Teaching texts
Session 1 - The Messy Pony (Alpha Assess, Text Level 14) levelled at instructional for
Year 1 using Fry’s Readability Procedure.
Sessions 2 to 10 - Nine fiction texts taken from E.R.I.K program (University of
Melbourne and Catholic Education Office) levelled at instructional for Year 1. They
contained a high degree of imageable content. The text format was consistent in
appearance including a title and pictorial content limited to a few black and white
illustration/s. These texts were selected as they provided minimal visual support for
students; therefore there was less likelihood their visualisations would be influenced by
the illustrations.
• R.I.D.E.R Cue Cards (Refer to Appendix Three)
Cards used to provide a visual prompt and cue students in the use of this strategy on
text
• Student Journals (Refer to Appendix Nine)
During intervention teaching sessions (two through six) students drew the visualisations
they made in a scrapbook whilst listening to text being read (at the Describe phase of
the R.I.D.E.R strategy).
• Dictaphone
Used to record students responses during teaching sessions and pre and post testing
Procedure
The students’ listening comprehension was tested using the following measures. The
students’ ability in listening comprehension was established to determine whether or not
by teaching students to visualise, listening comprehension, in turn improved.

12
• Pre Testing
All students were withdrawn form the classroom and pre tested one on one using the
following measures. The tasks were presented to the students in the following order:
• Running Record on Text
• Record of Oral Language
• Munro Test of Listening Comprehension
• Spontaneous and Cued Retell (Great Lion and Tiny Mouse)
• Visualisation Task (The Pocket Dogs Go on Holiday)
Each of the students’ responses was recorded on the dictaphone to allow for an
accurate collection of data. Raw scores were calculated for each of the pre tests and
converted to percentages then to averages to allow for direct comparison between
students (Refer to Appendix One).
With the exception of the Running Record assessment, pre testing of all students took
place one week prior to the teaching of the intervention sessions.
• Teaching Sequence
The intervention sessions were conducted over a three-week period with one of the
Year One classes, of which the researcher is the classroom teacher.
All students in the class, not only the intervention group, participated in ten forty-minute
sessions. The whole class sessions were conducted in the classroom each morning
from 9:00am as part of the shared reading component of the literacy program. Over the
course of the ten sessions the R.I.D.E.R strategy, developed by Clark, Deshler,
Schumaker, Alley and Warner (1984), was explicitly taught and students were cued to
use it on text. This visual imagery strategy entailed teaching the following steps. For the
purposes of this study, the researcher made two modifications to the R.I.D.E.R strategy.
They are indicated in italics.

13
1. Read Read a sentence
(Teacher reads the sentence to the students)
2. Imagine Try to make an image – a picture in your mind
3. Describe Draw your image – in your journal draw the picture you
have made in your mind Describe your image
4. Evaluate Evaluate your image and check if it matches the sentence
5. Repeat Read the next sentence and repeat steps 1 – 4
The teaching sequence was modelled on the gradual release of responsibility model
(Pearson and Gallagher, 1983; cited in Pardo, 2004). The four components of
comprehension instruction identified by Fielding and Pearson (1994) - teacher
modelling, guided practice, independent practice and application of the strategy in real
situations were built into the intervention sessions.
Described below is a brief overview of the sequence and content of the sessions. A
detailed description of each session can be found in Appendix Two.
• Session One
Students were introduced to the strategy of visualising (using the description taken from
John Munro’s sequence for teaching visualising). This session focused on teaching
students to visualise individual words, then single sentences. Using words taken from
the text ‘The Messy Pony’ the teacher modelled the process of visualising individual
words and drawing the picture that she had made in her mind. The students were each
given a journal and the purpose of the journal was explained. The students then
attempted the task of visualising individual words and drawing their visualisations. The
same procedure was then followed when introducing how to visualise a whole sentence.

14
At the completion of the session, the teacher explicitly named the strategy again,
revisited what it involved and summarised how it helps to understand what you are
reading. Students were invited to share what they enjoyed about the session and what
they learnt.
• Session Two
The session began with a revision of visualising at the word and single sentence level.
Following this recap, students were shown a new text and invited to make predictions
about the text. Students were then introduced to the R.I.D.E.R strategy. The R.I.D.E.R
cue cards were presented and it was explained how this strategy would help them to
visualise. Using the cue cards, the teacher modelled the process of using the R.I.D.E.R
strategy to visualise single sentences. The teacher then cued the students to use the
R.I.D.E.R strategy to visualise singe sentences. There was a high degree of scaffolding
as the teacher ‘stepped’ the students through each stage of the R.I.D.E.R strategy.
Students recorded their visualisations in their journal. At the conclusion of the text,
working in pairs, students took it in turns to retell the story they had just heard. At the
completion of the session, students reflected on and explicitly verbalised what they had
learnt.
• Sessions Three to Six
Sessions three through six followed a similar procedure to session two. Each session
began by rereading the text from the previous day and the teacher and students
revisited the visualisations they had made. The new text was then introduced and
students encouraged to make predictions about the text. Using the cue cards, each step
in the R.I.D.E.R strategy was revised. Using a read to strategy the teacher read the text
to the students, stopping at various intervals to cue students in the use of the R.I.D.E.R
strategy. The high degree of scaffolding remained as the teacher continued to step the
students through each stage of the R.I.D.E.R strategy. During sessions three and four
students worked at single sentence level. By sessions five and six, students were
15
visualising pairs of sentences. Students recorded their visualisations in their journal. At
the conclusion of each text, working in pairs, students took it in turns to retell the story
they had just heard. At the completion of the session, students reflected on and
explicitly verbalised what they had learnt.
• Sessions Seven to Ten
Sessions seven through ten followed a similar procedure to sessions three to six in that
each session began by rereading the text from the previous day. The teacher and
students revisited the visualisations they had made. A new text was then introduced and
students encouraged to make predictions about the text. For the final four sessions the
degree of teacher scaffolding was decreased to allow for a greater degree of
independent practice by the students. The teacher continued to cue the use of the
R.I.D.E.R strategy with the cue cards but did not walk students through each step of the
strategy. In addition to this, the drawing element at the ‘Describe’ stage was removed so
that the description became oral only. For sessions seven and eight, the students
worked at single sentence level and for the last two sessions (nine and ten) the students
visualised pairs of sentences. At the conclusion of the text, working in pairs, students
took it in turns to retell the story they had just heard. At the completion of the session,
students reflected on and explicitly verbalised what they had learnt.
• Post Testing
In the week following the completion of the intervention sessions all students were
withdrawn from the classroom and post tested one on one using the same measures
that were used during the pre testing phase. Tasks were presented to the students in
the following order:
• Record of Oral Language
• Munro Test of Listening Comprehension
• Spontaneous and Cued Retell (Great Lion and Tiny Mouse & Pigs Love Mud!)
• Visualisation Task (The Pocket Dogs Go on Holiday & Mr Moo)
16
Two additional tasks were included in the post testing phase and were carried out to
gain extra information about the hypothesised improvements in students’ listening
comprehension. An additional retell (spontaneous and cued) and visualisation task were
completed on unseen texts. Both the intervention and control groups completed these
additional tasks.
During post testing on each of these measures students in the intervention group were
asked what they could do whilst they were listening to the text being read to them. If
they did not mention visualising as a strategy they could use, they were prompted to do
so by the researcher. The cue cards that were used during the teaching sessions were
placed in front of these students during the post testing sessions to provide an explicit
reminder to implement the R.I.D.E.R strategy. The control group were post tested under
exactly the same conditions that existed during pre testing.
Each of the students’ responses was recorded on the dictaphone to allow for an
accurate collection of data. Raw scores were calculated for each of the post tests and
converted to percentages then to averages to allow for direct comparison between
students (Refer to Appendix One).

17
RESULTS
Student performance is described in six sections:
1. Oral Language
2. Listening Comprehension
3. Spontaneous and Cued Retell of Seen and Unseen Text
4. Visualisation of Seen and Unseen Texts
5. R.I.D.E.R Strategy Imagery Scores
6. Trends for Individual Students
1. Oral Language
Record of Oral Language (R.O.L)
0
10
20
30
40
50
60
70
80
90
100
A B C D E F G H
Student
% A
ccu
racy
Pre Test
Post Test
Figure 1: Comparison of Scores on Record of Oral Language Task

18
Average Improvement for Intervention and Control Groups -
Record of Oral Language
0
10
20
30
40
50
60
70
80
90
100
Intervention Control
Group
Avera
ge S
co
re %
Pre Test
Post Test
%
Improvement
Figure 2 Average Improvements for Intervention and Control Group – Record of Oral Language
The results in Figure 1 indicate that all bar one student made gains in their performance
on this task. Students B and C from the Intervention group both improved their scores
by 9%. Student D improved minimally, by 5% - of the improvements made by the
intervention group it is the smallest gain, however, as indicated in Figure 1 her pre test
score was the highest achieved by any student (either intervention or control group)
thus creating less potential for a value added component. Student A who did receive
intervention recorded a decrease of 19% in her post test score. A closer look at the
assessment task reveals that whilst the student often maintained the meaning of the
sentence, they substituted words thus resulting in a number of errors.
Interestingly, all students in the control group (Students E-F) also made similar
improvements in their post test scores. Student F improved by 7%, Student G by 5%
and Student H by 9%. Student F who did not receive any intervention recorded the
largest gain, improving by 19%. However, it is once again important to note their pre
test score was the lowest achieved by any student (either intervention or control group)
thus allowing for a larger value added component. Figure 2 reveals that it was in fact the
control group who made the greatest average improvement in the performance on the
oral language task.

19
2. Listening Comprehension
Munro Test of Listening Comprehension
0
10
20
30
40
50
60
70
80
90
100
A B C D E F G H
Student
% o
f id
eas/
even
ts r
ecall
ed
Pre Test
Post Test
Figure 3 Comparison of Scores on Munro’s Listening Comprehension Task
Average Improvement for Intervention and Control Group -
Munro Test of Listening Comprehension
-10
0
10
20
30
40
50
60
70
80
90
100
Intervention Control
Group
Avera
ge S
co
re %
Pre Test
Post Test
% Improvement
Figure 4 Average Improvements for Intervention and Control Group – Munro Test of Listening Comprehension
Figure 3 reveals that students in the intervention group (A – D) made the greatest
improvement in the area of listening comprehension and ability to recall events
spontaneously. Figure 4 reveals that on average, listening comprehension amongst
students in the intervention group improved by 21%. During the post testing phase,
students in the intervention group (A-D) were prompted to create visual images as they

20
listened to the story. Student A, who recorded the highest pre test score of 60% of
ideas/ events recalled, improved their performance by 10%. Student B who recorded
the lowest pre test score of all students (A – E) recorded the largest improvement
between pre and post tests being able to recall 35% more ideas/ events. Student C
improved his performance by 15% and Student D by 25%. By comparison, the results
achieved by students in the control group (E – H) were varied in the absence of any
intervention. Students G and H recorded only a minimal improvement of 5% while
students E and F recorded a decrease in performance, by 15% and 5% respectively.
3. Spontaneous and Cued Retell on Seen and Unseen Texts
Spontaneous and Cued Retell of Text
Pre-Test
0
10
20
30
40
50
60
70
80
90
100
A B C D E F G H
Student
% o
f id
eas/
even
ts
reto
ld
Spontaneous
RetellCued Retell
Figure 5 Comparison of Pre Test Scores on Spontaneous and Cued Retell of Text
When looking at the results achieved by the students for the spontaneous and cued
retell (Figure 5), two trends are evident. Firstly, all students recorded much lower scores
on the cued component of the retell task. With the exception of student E (3%
difference) and H (14% difference) there were differences ranging from 20% to 43%
between scores in what students were able to recall spontaneously and when prompted
using cued questions. Secondly, students A, C and D (intervention group) all achieved
higher scores for the spontaneous retell than students in the control group prior to any
intervention taking place. Student B from the intervention group was the exception,
scoring minimally lower (50%) than student F from the control group (53%).

21
Spontaneous Retell of Text (Pre v Post Test)
0
10
20
30
40
50
60
70
80
90
100
A B C D E F G HStudent
% o
f id
ea
s/
ev
en
ts r
eto
ld
sp
on
tan
eo
us
ly
Pre-Test
Post-Test
Figure 6 Comparison of Pre and Post Test Scores on Spontaneous Retell of Seen Text (direct comparison data)
Average Improvement for Intervention and Control Group -
Spontaneous Retell of Seen Text
-20-10
01020
304050
607080
90100
Intervention Control
Group
Avera
ge S
co
re %
Pre Test
Post Test
% Improvement
Figure 7 Average Improvements for Intervention and Control Group – Spontaneous Retell of Seen Text
Figure 6 reveals that following intervention in the form of the R.I.D.E.R strategy, all
students in the intervention group (A-D) made improvements in their ability to
spontaneously retell a narrative story. Using spontaneous retell as a measure of
listening comprehension, Figure 7 reveals that on average, students in the intervention
group improved their listening comprehension by 13%. During the post testing phase,
students in the intervention group were prompted to form a visual image. Student A

22
improved her retell by 10%, Student B improved by 16%, Student C improved by 20%
and Student D by 6%. It is interesting to note that three of the four students in the
control group actually recorded decreases in their spontaneous retell scores between
pre and post testing on the seen text. Excluding student G, there was a decrease of
between 10% to 20% in their ability to spontaneously retell the story. Student G, despite
no intervention, improved his score by 10%.
Cued Retell of Text (Pre v Post Test)
0
10
20
30
40
50
60
70
80
90
100
A B C D E F G HStudent
% o
f id
eas/
even
ts
reto
ld w
ith
cu
ein
g
Pre Test
Post Test
Figure 8 Comparison of Pre and Post Test Scores on Cued Retell of Seen Text (direct comparison data)
Average Improvement for Intervention and Control Group -
Cued Retell of Seen Text
-10
010
20
3040
5060
70
8090
100
Intervention Control
Group
Avera
ge S
co
re %
Pre Test
Post Test
% Improvement
Figure 9 Average Improvements for Intervention and Control Group – Cued Retell of Seen Text

23
The trends in Figure 8 match those shown earlier in Figure 5, that is, all students
performed more strongly in the spontaneous retell as compared to the cued retell task.
Figure 8 reveals an inconsistency in the results for cued retell of the seen text with
students from the intervention group. Following intervention in the form of explicit
teaching of the R.I.D.E.R strategy, students A and C both recorded decreases in the
amount of detail they were able to recall under cued conditions whilst student B and D
improved by 4% and 7% respectively. Students F, G and H who did not receive
intervention actually increased the amount of information they recalled under cued
conditions. Only student E recorded a decrease in her score of 13%. Data reveals that
cued retell on the seen text was one of the few measures on which the control group
outperformed the intervention group (Figure 9).
Spontaneous Retell of Texts
0
10
20
30
40
50
60
70
80
90
100
A B C D E F G H
Student
% o
f id
eas/
even
ts r
eto
ld
sp
on
tan
eo
usly Pre Test
Post Test
(Seen
Text)
Post Test
(Unseen
Text)
Figure 10 Comparison of Post Test Scores on Spontaneous Retell of Seen and Unseen Texts
24
Average Improvement for Intervention and Control Group -
Spontaneous Retell of Seen vs Unseen Text
-30
-20
-10
0
10
20
30
40
50
60
70
80
90
100
Intervention Control
Group
Avera
ge S
co
re %
Pre Test
Post Test
% Improvement
Figure 11 Average Improvements for Intervention and Control Group Spontaneous Retell of Seen vs. Unseen Texts
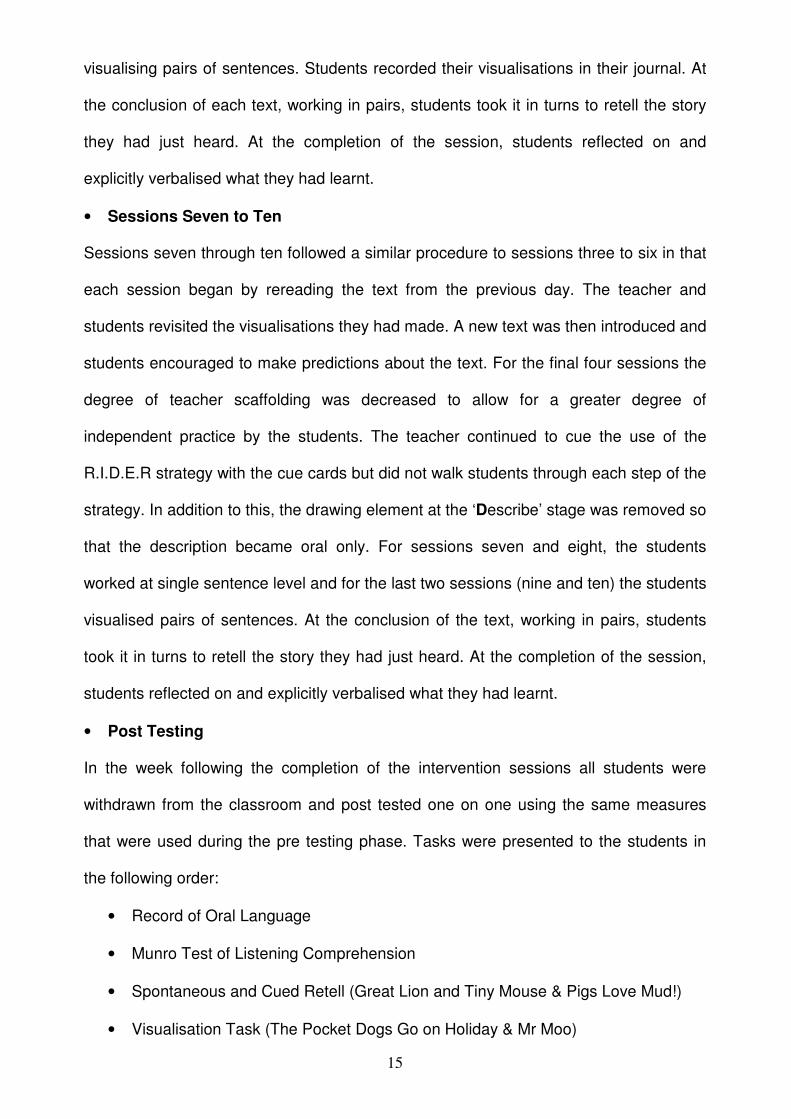
In addition to the seen text that was used in the pre and post testing, all students
completed a second spontaneous and cued retell on an unseen text during the post
testing phase. Overall, all students did not perform as strongly on this task with neither
the intervention nor control groups showing an increase in their listening comprehension
(Figure 11). Figure 10 reveals that all students in the intervention group recorded a
lower spontaneous retell score even when they were prompted to use the R.I.D.E.R
strategy and create a visual image as they listened to the text. On the unseen text,
student A was only able to retell 50% of the ideas/ events in the story, which was 30%
less than for the seen text. Student B recorded the lowest result, only retelling 13% of
ideas/ events, a decrease of 50% from the seen text. Student C retold 33% of ideas/
events, a decrease of 37% from the seen text. Student D who achieved the highest
result for spontaneous retell on the seen text (83% of ideas/ events) also scored the
highest result on the unseen text, being able to retell 63% of ideas/ events. Figure 10
also reveals that there was a smaller difference between the percentage of ideas/
events recalled on seen and unseen text for all students in the control group. Student E
recalled 6% less ideas/ events, student G 23% less and student H 7% less ideas/
events. Student F recorded the same result on both texts. As with Student D in the
25
intervention group who recorded the highest result on both the seen and unseen texts,
student E recorded the lowest results on both the seen and unseen texts in the control
group.
Cued Retell of Texts
0
10
20
30
40
50
60
70
80
90
100
A B C D E F G H
Student
% o
f id
eas/ even
ts r
eto
ld
usin
g c
uein
g
Pre Test
Post Test
(Seen Text)
Post Test
(Unseen Text)
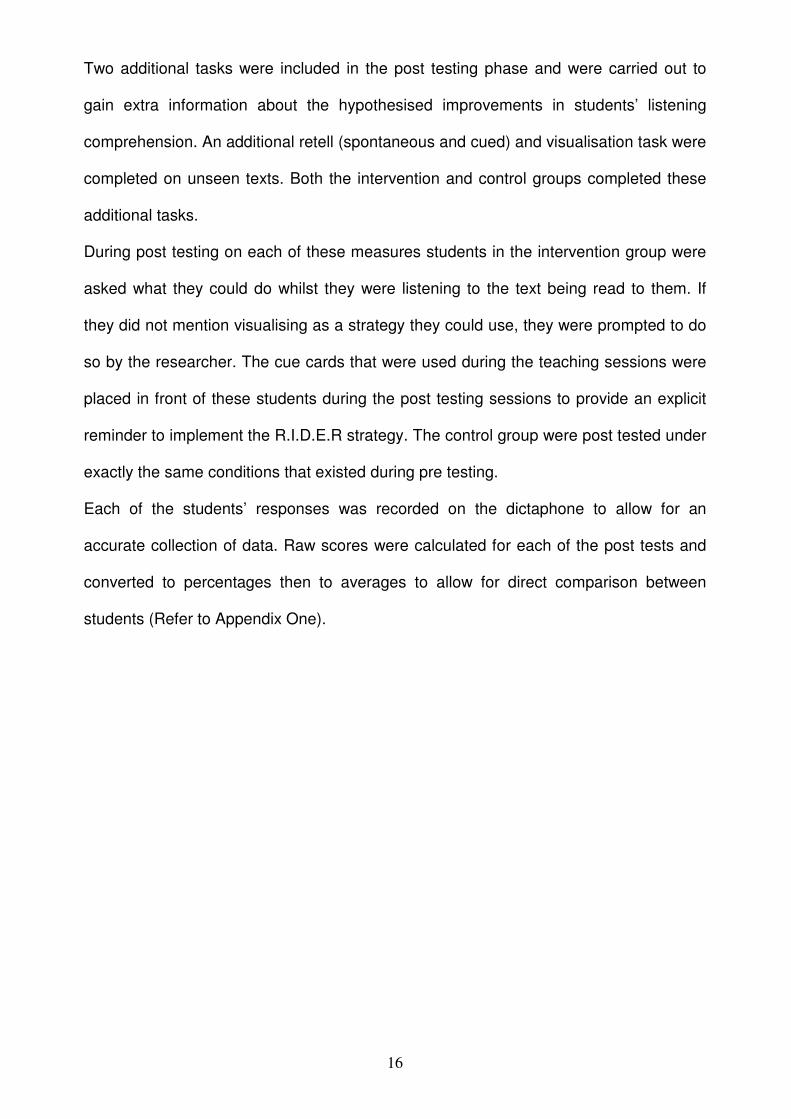
Figure 12 Comparison of Post Test Scores on Cued Retell of Seen and Unseen Texts
Average Improvement for Intervention and Control Group -
Cued Retell on Seen vs Unseen Texts
-20-10
0102030405060708090
100
Intervention Control
Group
Avera
ge S
co
re %
Pre Test
Post Test
% Improvement
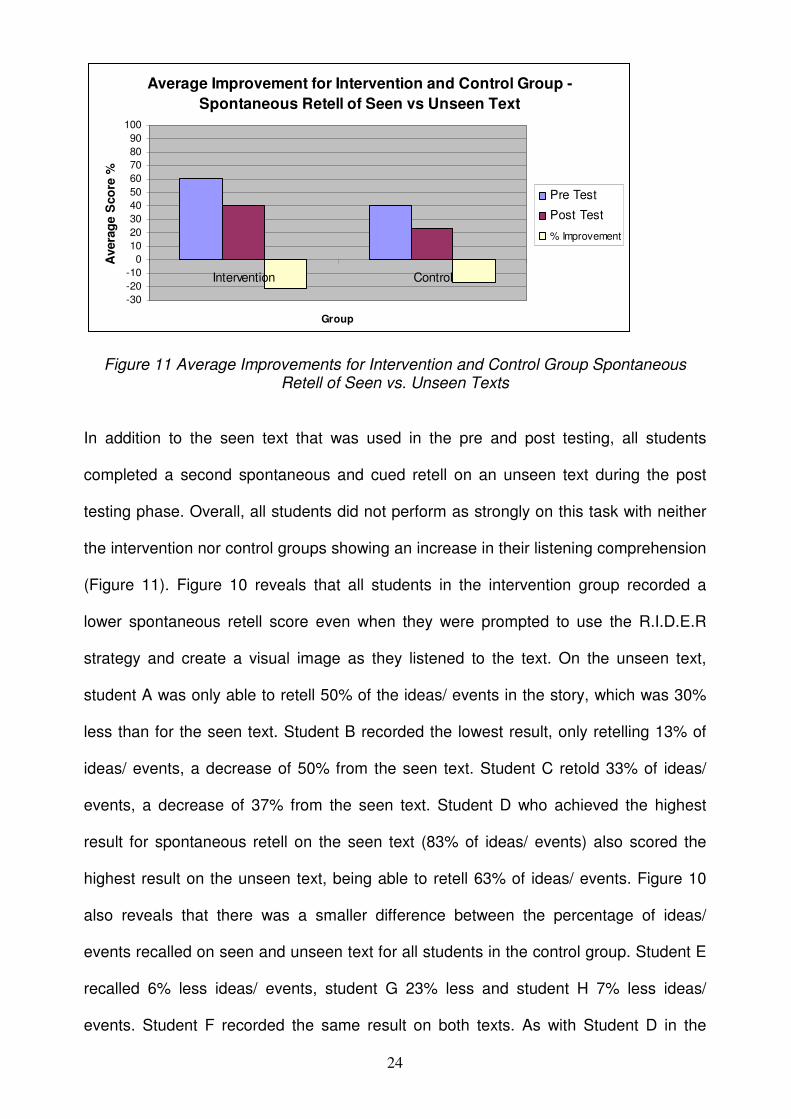
Figure 13 Average Improvements for Intervention and Control Group – Cued Retell of Seen vs. Unseen Texts
Figure 12 reveals that despite intervention taking place with students A-D, there was no
improvement in the amount of detail retold under cued conditions. Once again, student’s
26
results were poorer on the cued retell. Students A and C recorded the same results for
the % of ideas/ events they were able to retell on both the seen and unseen text – 27%
and 13% respectively. Student B recorded a decrease of 10% and student D a
decrease of 7%. Once again Student D recorded the highest retell results.
All students in the intervention group (E-H) were able to recall fewer ideas/ events under
cued conditions on the unseen text. Figure 13 reveals that the average percentage by
which the intervention group regressed was less than that of the control group.
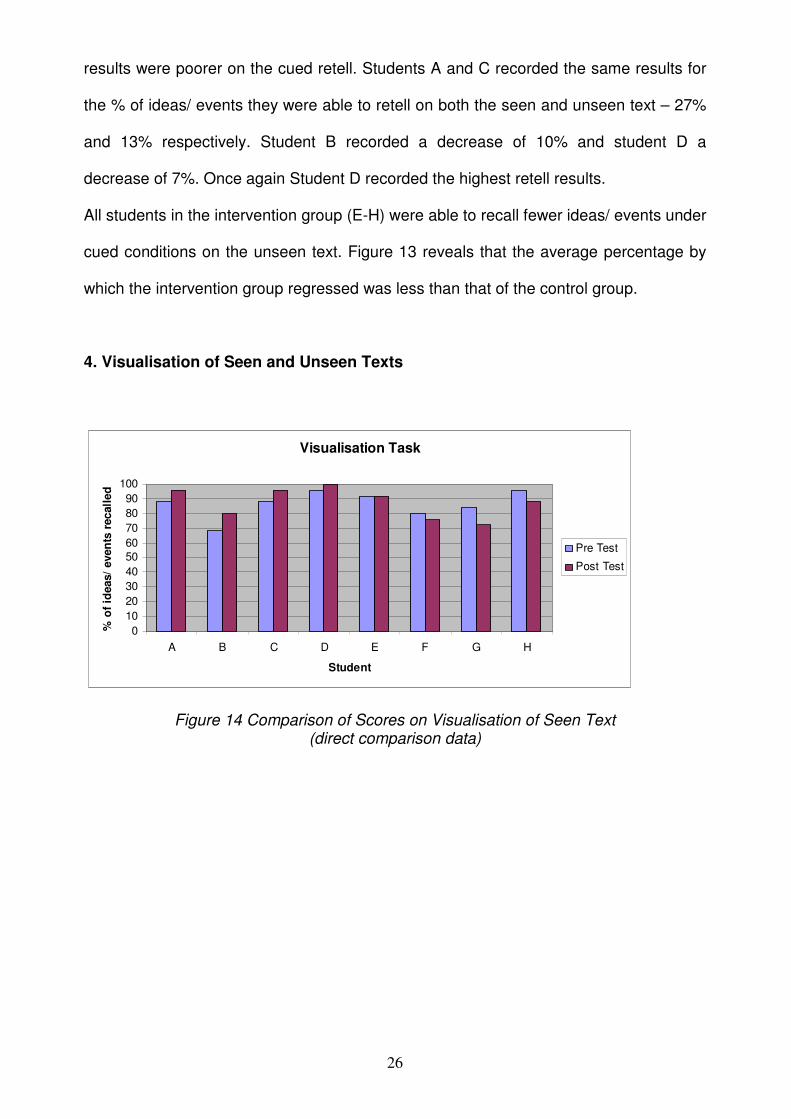
4. Visualisation of Seen and Unseen Texts
Visualisation Task
0
10
20
30
40
50
60
70
80
90
100
A B C D E F G H
Student
% o
f id
eas/
even
ts r
ecall
ed
Pre Test
Post Test
Figure 14 Comparison of Scores on Visualisation of Seen Text (direct comparison data)

27
Average Improvement for Intervention and Control Group -
Visualisation of Seen Text
-20-10
0102030405060708090
100
Intervention Control
Group
Avera
ge S
co
re %
Pre Test
Post Test
% Improvement
Figure 15 Average Improvements for Intervention and Control Group – Visualisation of Seen Text
Figure 14 reveals that all students (A-H) performed strongly on the visualisation task
that used the same passage of text for both pre and post testing. The minimum score
achieved on this task was 68% by student B during the pre testing phase. This was the
highest minimum score achieved on any of the testing measures. Students in the
intervention group (A-D) all recorded positive increases in their ability to visualise the
same passages of text after listening to them being read aloud. Gains of between 4%
(student D) and 12% (student B) were achieved following a period of intervention using
the R.I.D.E.R strategy. Student D managed to achieve a maximum score for this task.
Whilst the results for student E did not change, the results for students F, G and H all
demonstrate a small decrease.

28
Visualisation Task
0
10
20
30
40
50
60
70
80
90
100
A B C D E F G H
Student
% o
f id
ea
s/
ev
en
ts
rec
all
ed Pre Test
Post Test (Seen
Text)
Post Test
(Unseen Text)
Figure 16 Comparison of Scores on Visualisation of Texts
Average Improvement for Intervention and Control Group -
Visualisation of Seen vs Unseen Texts
-30-20-10
0102030405060708090
100
Intervention Control
Group
Avera
ge S
co
re %
Pre Test
Post Test
% Improvement
Figure 17 Average Improvements for Intervention and Control Group – Visualisation of Seen vs. Unseen Texts
In addition to the text that was used in the pre and post testing, a second text was also
used for the visualisation task. As with the retell task where a second post test was
carried out on an unseen text, the average results show a decrease in performance by
both the intervention and control group (Figure 17). Figure 16 reveals inconsistent
results for the intervention group (A-D) with only student B showing improved scores in
both post tests – 12% with the seen text and 20% on with the unseen text. This could be

29
explained by the fact that student B recorded the lowest pre test result of all students
(A-E) thus had potential for the greatest value added result after a period of intervention.
Student C recorded the greatest decrease between the pre test and post test with the
unseen text as well as the greatest difference between the two post test results. Similar
trends are evident amongst the control group (E-H) where all students recorded a
decrease between their pre test and post test results. Decreases ranged from 12%
(student H) to 26% (student F) on the post test with an unseen text.
5. R.I.D.E.R Strategy Imagery Scores
Session 2
Session 3
Session 4
Session 5
Session 6
1st image
2nd image
1st image
2nd image
1st image
2nd image
1st image
2nd image
1st image
2nd image
Student
A
25%
75%
50%
75%
75%
100%
50%
100%
50%
100%
Student
B
25%
50%
25%
50%
75%
75%
25%
75%
50%
75%
Student
C
25%
75%
25%
50%
75%
75%
50%
100%
25%
75%
Student
D
75%
100%
75%
75%
100%
100%
75%
100%
75%
100%
Table 2 R.I.D.E.R Visualisation Scores
Key: 1st image = 1st visualisation of text 2nd image = 2nd visualisation of text
0 % = no ideas present in drawing 25% = few ideas present in drawing 50% = ½ ideas present in drawing 75% = ¾ ideas present in 100% = All ideas present in drawing

30
Table 2 presents data that was collected during intervention sessions with students A-D.
It indicates that in each of the five sessions in which the students were required to draw
their visualisation of the sentence/s that were read to them, some improvement
occurred in the students’ listening comprehension. Comparing 1st and 2nd images from
each of the sessions, all students showed an increase in the amount of detail they
visualised and included in their drawings. Each of the 2nd images from sessions 2
through 6 included a minimum of half of the ideas contained within the sentence/s.
Whilst the results of student D are consistently high and demonstrate an improvement in
listening comprehension, it is in fact student A whose scores demonstrate the greatest
value added component from intervention using the R.I.D.E.R procedure.
6. Trends for Individual Students
Student A
-40-30-20-10
0102030405060708090
100
Ora
l Language
Lis
tenin
g
Com
pre
hensio
n
Sponta
neous
Rete
ll
Sponta
neous
Rete
ll S
een/
Unseen text
Cued R
ete
ll
Cued R
ete
ll
Seen/ U
nseen
text
Vis
ualis
atio
n
Vis
ualis
atio
n
Seen/ U
nseen
text
% S
co
re
Pre Test
Post Test
% Improvement
Figure 18 Student A Intervention Group - Individual Trends
The results of Student A indicate that she performed quite strongly across the range of
pre and post test tasks. In all bar the cued retell task student A scored at 50% or better.
Figure 18 shows that following a period of intervention student A made improvements in
the areas of listening comprehension, spontaneous retell (seen text) and visualisation

31
(seen text). The value added component for student A was not large, perhaps explained
by her strong pre test performance. Interestingly, the greatest decrease in performance
was on the R.O.L. On those tasks where student A was tested on an unseen text, her
performance did not reflect the positive gains that had been made in spontaneous retell
and visualisation.
Student B
-60-50-40-30-20-10
0102030405060708090
100
Ora
l Langu
age
Lis
tenin
g
Com
pre
hen
sio
n
Sponta
ne
ous
Rete
ll
Sponta
ne
ous
Rete
ll S
een/
Unseen
text
Cued R
ete
ll
Cued R
ete
ll
Seen/ U
ns
een
text
Vis
ualis
atio
n
Vis
ualis
atio
n
Seen/ U
ns
een
text
% S
co
re Pre Test
Post Test
% Improvement
Figure 19 Student B Intervention Group – Individual Trends The pre test results of student B showed that he performed strongly in the areas of oral
language, spontaneous retell (seen text) and visualisation. Figure 19 shows that
following a period of intervention student B made improvements in the oral language,
listening comprehension, spontaneous and cued retell (seen text) and visualisation
(seen and unseen texts) tasks. The area in which there was the greatest value added
component was listening comprehension. On the retell task where student B was tested
on an unseen text, his performance did not reflect the positive gains that had been
made on the retell task with a seen text.

32
Student C
-50-40-30-20-10
0102030405060708090
100
Ora
l Langua
ge
Lis
tenin
g
Co
mpre
hens
ion
Sponta
neo
us
Rete
ll
Sponta
neo
us
Rete
ll S
ee
n/
Unseen te
xt
Cued R
ete
ll
Cued R
ete
ll
Seen/ U
nse
en
text
Vis
ualis
atio
n
Vis
ualis
atio
n
Seen/ U
nse
en
text
% S
co
re
Pre Test
Post Test
%
Improvement
Figure 20 Student C Intervention Group – Individual Trends
The pre test results of student C reveal that, similar to student B, he performed strongly
in the areas of oral language, spontaneous retell (seen text) and visualisation. Figure 19
shows that following a period of intervention student B made improvements on all tasks
except spontaneous retell and visualisation on unseen texts. The area in which there
was the greatest value added component was spontaneous retell (seen text).
Student D
-30-20-10
0102030405060708090
100
Ora
l Language
Lis
tenin
g
Com
pre
hensio
n
Sponta
neous
Rete
ll
Sponta
neous
Rete
ll S
een/
Unseen text
Cued R
ete
ll
Cued R
ete
ll
Seen/ U
nseen
text
Vis
ualis
atio
n
Vis
ualis
atio
n
Seen/ U
nseen
text
% S
co
re Pre Test
Post Test
% Improvement
Figure 21 Student D Intervention Group – Individual Trends
The results of Student D indicate that they performed strongly across the range of pre
and post test tasks. In all bar the cued retell task student D scored at 50% or better. In
the R.O.L and visualisation tasks she achieved close to the maximum scores. Figure 18

33
shows that following a period of intervention student D made improvements in the areas
of oral language, listening comprehension, spontaneous and cued retell on seen text
and visualisation on seen text. The value added figure for each task was small due
mostly to the limited scope for improvement resulting from high pre test scores. On
those tasks where student D was tested on an unseen text, her performance did not
reflect the positive gains that had been made in spontaneous retell and visualisation
with a seen text.
Student E
-30-20-10
0102030405060708090
100
Ora
l Language
Lis
tenin
g
Com
pre
hensio
n
Spon
taneous
Rete
ll
Spon
taneous
Rete
ll S
een/
Uns
een text
Cu
ed R
ete
ll
Cue
d R
ete
ll
Seen
/ U
nseen
text
Vis
ualis
atio
n
Vis
ualis
atio
n
Seen
/ U
nseen
text
% S
co
re Pre Test
Post Test
% Improvement
Figure 22 Student E Control Group – Individual Trends
Figure 22 shows that student E only scored above 50% on three out of the eight
assessment tasks given. Figure 22 also reveals that the only improvement to occur was
on the oral language task. In the absence of intervention, scores for each of the tasks
decreased or remained level indicating a lack of improvement in listening
comprehension.

34
Student F
-40-30-20-10
01020304050
60708090
Ora
l Langua
ge
Lis
tenin
g
Co
mpre
hens
ion
Sponta
neo
us
Rete
ll
Sponta
neo
us
Rete
ll S
ee
n/
Unseen te
xt
Cued R
ete
ll
Cued R
ete
ll
Se
en/ U
nse
en
text
Vis
ualis
atio
n
Vis
ualis
atio
n
Se
en/ U
nse
en
text
% S
co
re
Pre Test
Post Test
%
Improvement
Figure 23 Student F Control Group – Individual Trends
Figure 23 shows that student F only scored above 50% on four out of the eight
assessment tasks given. From Figure 23 it is evident that small gains were achieved in
oral language and cued retell. In the absence of intervention, scores for each of the
tasks decreased or remained level indicating a lack of improvement in listening
comprehension.
Student G
-40-30-20-10
0102030405060708090
100
Ora
l Language
Lis
tenin
g
Com
pre
hensio
n
Spo
nta
neous
Rete
ll
Spo
nta
neous
Re
tell
Seen/
Un
seen text
Cued R
ete
ll
Cu
ed R
ete
ll
Seen
/ U
nseen
text
Vis
ualis
atio
n
Vis
ualis
atio
n
Seen
/ U
nseen
text
% S
co
re
Pre Test
Post Test
%
Improvement
Figure 24 Student G Control Group – Individual Trends

35
Figure 24 shows that student G only scored above 50% on three out of the eight
assessment tasks given. Figure 24 reveals that in the absence of intervention student G
made small improvements on the most number of tasks as compared to all students in
the control group. Improvements occurred in oral language, listening comprehension
and spontaneous and cued retell of seen text.
Student H
-20-10
0102030405060708090
100
Ora
l Language
Lis
tenin
g
Com
pre
hensio
n
Sponta
neous
Rete
ll
Sponta
neous
Rete
ll S
een/
Unseen t
ext
Cued R
ete
ll
Cued R
ete
ll
Seen/
Unseen
text
Vis
ualis
ation
Vis
ualis
ation
Seen/
Unseen
text
% S
co
re
Pre Test
Post Test
%
Improvement
Figure 25 Student H Control Group – Individual Trends
Figure 25 shows that similar to student E and G, student H only scored above 50% on
three out of the eight assessment tasks given. From Figure 25 it is evident that in the
absence of any intervention, small gains were achieved in oral language, listening
comprehension and cued retell of seen text. Scores for each of the remaining tasks
decreased.

36
DISCUSSION
The results of this study offer support for the hypothesis that cued use of the R.I.D.E.R
strategy improves the listening comprehension of Year One students. However, given
the small size of the study and the fact that no test of statistical significance was used to
treat the data, the results must be viewed as a preliminary indication rather than
absolute evidence.
Overall the researcher believes that students who were given intervention in the form of
explicit teaching of a comprehension strategy (R.I.D.E.R) and taught the skill of
visualising demonstrated greater improvements in listening comprehension than those
students who did not receive intervention.
The intervention group’s scores on the Munro Test of Listening Comprehension,
spontaneous retell of seen text, visualisation of seen text and images from R.I.D.E.R
session visualisations were superior to the control group resulting in the researcher
making the above assertion.
Results taken from the Munro Test of Listening Comprehension (Figures 3 and 4)
provide the strongest support for the researcher’s hypothesis. During the pre testing
phase excluding student A, all other students recalled less than half of the details in the
story (Figure 3). Typically, the retell of the story was slow as students attempted to
remember key events and often chunks of information were missing. Post testing
revealed that the intervention group improved on average by 21.25% (Figure 4) in their
ability to listen to a story then recall the ideas and events contained within it. On the
post test they outperformed the control group by and average of 23.75% (Figure 4).
Anecdotal evidence revealed some noticeable differences existed between students
from the intervention and control groups during the post testing phase – most
noticeably, students from the intervention group completed this task with much greater
confidence. During the retell, which equates to the Describe phase of the R.I.D.E.R
procedure, the students used more precise language to recall a greater amount of
37
detail. Also having been prompted to visualise the story as they listened to it (Imagine
phase of R.I.D.E.R), it was evident that their visualisation skills had improved as the
images they described were rich in detail.
Whilst the results gained from the spontaneous retell of seen text were not as high they
still support the original hypothesis (Figures 6 and 7). Post testing reveals that the
intervention group improved on average by 13% in their ability to retell literal ideas/
events from the text they had listened to (Figure 7). They outperformed the control
group by an average of 21.25% (Figure 7). Some of the gains made on this task may
have resulted from the students’ familiarity with the text. They had previously listened to
and retold the story during the pre testing phase and the pre and post testing sessions
occurred within a period of four weeks of each other. However, exactly the same testing
conditions existed for the control group and the post testing results for this group of
students show that they recorded a decrease in the amount detail they could retell
(Figure 7). During the post testing phase the intervention group were asked prior to
listening to the text if there was anything they could do whilst listening to the story being
read to them. All four students responded that they could use the steps they had learnt
as part of the cued use of the R.I.D.E.R procedure. Had they not responded in this
manner, they would have been prompted to use the strategy.
Looking at the data gathered from the visualisation of seen text, Figure 15 shows that in
term of the tasks on which the intervention group outperformed the control group, this
was the task on which the intervention group made the least improvement. Despite this,
average improvement by the intervention group was 8% and the total average by which
they outperformed the control group was 14%. As with the spontaneous retell, the
visualisation task involved students being re-exposed to a text. The limited improvement
shown by the intervention group may in part be due to the fact that they scored quite
highly in the pre testing phase thus preventing a large add on value. Once again, the
control group who were tested under the same conditions recorded an average

38
decrease of 6%. Whilst sentence structure and complexity of the language being used
to describe images was not being assessed by this study, it was interesting to note the
improvements that were evident in these two areas in students in the intervention group.
The opportunities these students had been given to share and discuss images they had
visualised during R.I.D.E.R sessions had a positive impact upon the structure and type
of language they were able to use by the post testing phase. An interesting trend to
note was the control group who had not received explicit instruction in the use of the
R.I.D.E.R strategy were more inclined to add irrelevant or inaccurate details, especially
during the oral description of their visualisation.
An assessment of the visualisations (in the form of drawn images) that students made
during intervention sessions also supports the researcher’s original hypothesis. From
Table 2 it is evident that as the sessions progressed and students became more
proficient in the use of the R.I.D.E.R strategy, the amount of detail they included in their
visualisations and descriptions increased thus indicating an increase in listening
comprehension.
At this point it is important to mention that the study did yield results that did not fit
predicted trends and do not support the original hypothesis. The cued retell of seen and
unseen texts, spontaneous retell of unseen text and visualisation of unseen text all had
less favourable results. The study found that the intervention group made no
improvement in the post test results of these measures. Before discussing these results
it is interesting to examine the Record of Oral Language which presented some
confounding results. Results shown in Figure 1 indicate that oral language skills
improved for all students in the study, not only those in the intervention group. In fact,
this was the only task apart from the cued retell of seen text on which the control group
outperformed the intervention group. It appears that the results of two students –
student A (intervention) and student F (control) impacted upon average results (Figure
2). Student A recorded a 19% decrease between pre and post tests. Conversely,

39
student F recorded a 19% increase between pre and post tests. Apart from these
extreme results all other students made similar gains. In any case, it is not completely
surprising that the control group recorded greater gains since oral language skill
development is an integral component of the literacy program in both classrooms where
students in the study were drawn from.
In some part, the results of the cued retell tasks may have resulted from the design and
nature of questions used for cueing (Refer to Appendix Five and Six). Another factor
which may explain the low results is that the cued questions required students to deal
with inferential ideas and be able to make inferences from the texts – a skill that is not
yet well developed in readers of this age.
Whilst both texts (seen and unseen) used for the retell task were levelled at Year 1
using the Fry Reliability Procedure, the unseen text contained; (a) a greater number of
ideas and events in the storyline and (b) ideas and events that were more complex in
nature. Also, having been previously exposed to the seen text, students were more
familiar with the characters, ideas/ events and themes presented in that text.
For the purposes of the visualising task whilst the same number of sentences were
used from both texts (seen and unseen) the unseen text appeared to have more detail
within some of the sentence units, which could explain the poorer performance by the
students.
The finding of this study, that cued use of the R.I.D.E.R strategy improves the listening
comprehension of Year One students, is in line with the findings of a number of other
researchers such as Hibbing and Rankin-Erickson (2003) whose research substantiated
that comprehension of text is improved when students are taught to use mental
imagery. More specifically, the finding of this study reflects that made by Center et al.
(1999) – that imagery training improves listening comprehension. Using the R.I.D.E.R
strategy on text enabled students in the intervention group to code the words they were
listening to into meaningful images and store this knowledge. Long, Winograd and

40
Bridge (1989; cited in Bell, 1991) highlight this process as one of the three ways in
which visualisation helps to improve comprehension.
The teaching sessions that the intervention group participated in involved very explicit
instruction in the use of the R.I.D.E.R strategy. In each session the students were made
aware of what they would be learning, the strategy was specifically named and it was
explained how this strategy would help them. By the end of the intervention sessions
the students were becoming more proficient at using the R.I.D.E.R strategy and by the
post testing phase students from the intervention group were able to verbalise that they
were going to use this strategy as they completed the listening comprehension, retell
and visualisation tasks. Harvey and Goudvis (2007 p.20) are resolute in their assertion
that the teaching of comprehension strategies needs to be explicit and they emphasise
the distinction between mentioning a strategy and explicitly teaching it.
A feature of the intervention sessions was having the students in the intervention group
draw the images they had visualised. As these lessons were the students first
experience of explicit instruction in visualisation the researcher wanted to provide a high
level of support and scaffolding before gradually fading it out and transferring
responsibility to the students. It was felt that incorporating a concrete nature to the
R.I.D.E.R strategy would provide the necessary scaffolding. For sessions two through
five, at the ‘Imagine’ phase of the R.I.D.E.R strategy, students recorded their
visualisations in their R.I.D.E.R journal. It is felt that incorporating this component
contributed to the success of the intervention and had a positive effect on improving
listening comprehension through the students becoming more adept at using the mental
imagery strategy. The research of Hibbing and Rankin Erickson (2003) supports this
pedagogy. They suggest that the physical act of drawing pictures provides support to
those students who have difficulty creating images in their mind.
41
There are a number of implications arising from this study in regards to teaching
practice.
• Most importantly, the teaching of comprehension strategies must be embedded
in the classroom reading program and instruction must be explicit. Teachers
must be aware of the need for this to occur.
• Teaching of comprehension strategies needs to be explicit, repetitive and
targeted at the ability level of students.
• R.I.D.E.R strategy instruction as a means of teaching visualisation and improving
listening comprehension could be very successfully incorporated into
components of the daily literacy program, for example shared and guided
reading, across all levels of the school.
• Students need to be given adequate time to verbalise and discuss their learning
with their peers.
• Students could be provided with individual copies of the R.I.D.E.R cue cards, for
example in the form of a bookmark, which could provide a prompt to use the
strategy of visualisation when they are completing their home reading tasks or
reading for enjoyment.
Whilst the results of this study are promising it is suggested by the researcher that this
study be replicated using a larger sample size so that the results can be generalized
with greater confidence.
Considerations for further research also include:
• Investigating the effect of the R.I.D.E.R strategy on students listening and
reading comprehension of non-fiction texts.
• Investigating the effect of the R.I.D.E.R strategy on reading comprehension.
Having students independently read text and use pre and post tests designed to
measure reading comprehension.
42
• Investigating a multi-strategy approach to comprehension. Use other strategies
such as paraphrasing and questioning in conjunction with the R.I.D.E.R strategy.
• Increase the period of intervention and include a greater number of teaching
sessions so that teacher scaffolding can take place over a longer period during
the guided practice phase.

43
REFERENCES Bell, N. (1991) Gestalt Imagery: A critical factor in language comprehension. The Orton
Dyslexia Society Annals of Dyslexia, 41, 246-260.
Center, Y., Freeman, L., Robertson, G. & Outhred, L. (1999). The effect of visual
imagery training on the reading and listening comprehension of low listening
comprehenders in Year 2. Journal of Research in Reading, 22, 3, 241-256.
Clark, F., Deshler, D., Schumaker, J., Alley, G. & Warner, M. (1984) Visual imagery and
Self questioning: Strategies to improve comprehension of written material. Journal of
Learning Disabilities, 17, 3, 145-149.
Fielding, L. & Pearson, D. (1994) Reading comprehension: What works. Educational
Leadership, 51, 5, 62-68.
Gambrell, L. & Jawitz, P. (1993) Mental imagery, text illustrations and children’s story
comprehension and recall. Reading Research Quarterly, 28, 3, 265-276.
Gee, H. (1998) Metacomprehension strategies: Help for struggling readers. Primary
English Notes (Pen), 112.
Gill, S. (2008) The comprehension matrix: A tool for designing comprehension
instruction. The Reading Teacher, 62, 2, 106-113.
Graham, L. & Bellert, A. (2005) Reading comprehension difficulties experienced by
students with learning disabilities. Australian Journal of Learning Disabilities, 10, 2, 71-
78.
Harvey, S. and Goudvis, A. (2007). Strategies That Work: Teaching Comprehension for
Understanding and Engagement. Portland, Maine: Stenhouse
Hibbing, A. & Rankin-Erickson, J. (2003) A picture is worth a thousand words: Using
visual images to improve comprehension for middle school struggling readers. The
Reading Teacher, 56, 8, 758-770.

44
Mastropieri, M. & Scruggs, T. (1997) Best practices in promoting reading
comprehension in students with learning disabilities. Remedial and Special Education,
18, 4, 197-213.
Menner, M. (2007) Are we teaching or testing reading comprehension? Practically
Primary, 12, 1.
Onofrey, K. & Theurer, J. (2007) What’s a teacher to do: Suggestions for
comprehension strategy instruction. The Reading Teacher, 60, 7, 681-684.
Pardo, L.S. (2004, November). What Every Teacher Needs to Know About
Comprehension. The Reading Teacher, 58, 3, 272–280.
Puett Miller, C. (2004). Opening the door: Teaching students to use visualisation to
improve comprehension.
http://www.education-world.com/a_curr/profdev/profdev094.shtml Downloaded 20 May,
2009.
Swanson, P. & De La Paz, S. (1998) Teaching effective comprehension strategies to
students with learning disabilities. Intervention in School and Clinic, 33, 4, 209-216.
Woolley, G. & Hay, I. (2004). Using imagery as a strategy to enhance students'
comprehension of read text. In W. Scott and B. Knight (Eds.), Learning Disabilities:
Multiple Perspectives, 85-101. Melbourne: Pearson.

45
RESOURCES
E.R.I.K Session Stories (Taken from Stories1-30) (University of Melbourne & Catholic
Education Office Melbourne)
Hill, S. & Feely, J. (2004) Alpha Assess. Melbourne, Australia; Oxford University Press.
Munro, J. (2008) Visualising Strategy. Literacy Intervention Notes.
Wild, M. & Bentley, J. (2002) Mr Moo. Sydney, New South Wales; Australian
Broadcasting Corporation Books.
Wild, M. & King, S. (2008) The Pocket Dogs go on Holiday. Malvern, South Australia;
Scholastic.

46
APPENDIX ONE – Data Set for Participants
Student
0 = Intervention/ 1=Control Group
Age in MONTHS Sex
ESL No=0 Yes=1
Earlier Intervention 0=No 1=Visual 3=Auditory 4=Speech
Funded/ Teacher Aid Assisted 0=No 1=Yes
I.L.P 0=No 1=Yes
EMA No=0 Yes=1
Text level PRE
R.O.L PRE Raw Score
% Score
R.O.L POST Raw Score
% Score
Test of Listening Comprehension PRE Raw Score (/20)
% Score
Test of Listening Comprehension POST Raw Score (/20)
% Score
A 0 79 F 0 0 0 0 0 7 40 95 32 76 12 60 14 70
B 0 82 M 0 0 0 0 0 13 31 74 35 83 4 20 11 55
C 0 75 M 0 0 0 0 0 21 36 86 40 95 7 35 10 50
D 0 84 F 0 0 0 0 0 27 40 95 42 100 10 50 15 75
E 1 81 F 0 0 0 0 0 7 27 64 30 71 10 50 7 35
F 1 81 F 0 0 0 0 0 12 23 55 31 74 9 45 8 40
G 1 87 M 0 0 0 0 0 20 38 90 40 95 5 25 6 30
H 1 83 M 0 0 0 0 0 27 36 86 41 97 5 25 6 30
Student
Test of Listening Comprehension POST Raw Score (/20)
% Score
Retell PRE Test Spontaneous Retell (Raw Score)
% Score
Retell PRE Test Cued Retell (Raw Score)
% Score
Retell POST Test Seen Text Spontaneous Retell (Raw Score)
% Score
Retell POST Test Seen Text Cued Retell (Raw Score)
% Score
Retell POST Test Unseen Text Spontaneous retell (Raw Score)
% Score
Retell POST Test Unseen Text Cued Retell (Raw Score)
% Score
Visulation Task PRE Test (Raw Score)
% Score
Visulation Task POST Test Seen Text (Raw Score)
A 14 70 21 70 9 30 24 80 8 27 15 50 8 27 22 88 24
B 11 55 14 47 4 13 19 63 5 17 4 13 2 7 17 68 20
C 10 50 15 50 8 27 21 70 4 13 10 33 4 13 22 88 24
D 15 75 23 77 9 30 25 83 11 37 19 63 9 30 24 96 25
E 7 35 10 33 9 30 7 23 5 17 5 17 4 13 23 92 23
F 8 40 16 53 5 17 9 30 6 20 9 30 5 17 20 80 19
G 6 30 12 40 6 20 15 50 8 27 8 27 4 13 21 84 18
H 6 30 11 37 7 23 8 27 8 27 6 20 5 17 24 96 22

47
APPENDIX TWO – Sequence of Lessons
Session: 1 Year Level: 1 Format: Whole Class
Duration: 40 minutes
Text: The Messy Pony (Alpha Assess, Level 14)
Equipment: enlarged copy of text, large poster paper, whiteboard, student journals, pencils
Before Reading
• Introducing the strategy Explain to students that the purpose of the lesson is to learn a new skill. “I am going to teach you something that you can do that will help you to remember what you read. It is called visualising. This is what you do. After you have read each sentence you make a picture in your mind and say what the picture is. We will begin doing this with words, then sentences, then pairs of sentences”.
• Orient the text Using the title and front cover, orient the text and activate students’ prior knowledge about the topic. Encourage students to make predictions about the characters, setting, and story line. Identify and discuss meanings of unfamiliar vocabulary.
While Reading
• Teacher Modelling Teacher selects the word ‘pony’ from the text and models what visualising looks like using this word. Teacher thinks aloud when visualising to model the strategy and talks about having a ‘television’ in our mind that we can makes pictures on. Also introduces drawing component and models visualisation of pony on the poster paper. Explain that the quality of the drawing is not the most important thing but the ideas that are included in the picture. It doesn’t have to be a ‘perfect’ drawing - it can be a quick sketch.
• Guided Practice Give students their journal and explain that it is their own space to record their visualisations. Teacher selects the word ‘farm’ and the teacher and students practise the strategy together. Teacher continues to think out aloud. Teacher scaffolds and supports the students’ attempts giving specific feedback. After drawings are complete, teacher asks students to close their book and invites the students to describe the image they have created. Draw attention to the fact that not everyone’s pictures look the same. Repeat the process with the words ‘farmer’ and ‘pigs’. Move from word to sentence level using the same procedure of teacher modelling followed by guided practice (as above) Teacher selects the following sentences and models to students:
1. ‘Penny was a white pony’. 2. ‘She lived on a farm’.
Teacher continues reading the text and pauses at the following sentences for guided practice of visualising
1. ‘Penny put her nose in the bucket and tipped it over 2. ‘Penny was covered in food’ 3. ‘Penny climbed up too, and tipped the paint over’ 4. ‘Penny was covered in paint’
Teacher reads remainder of story to students
After Reading
• Review of learning At the completion of the lesson, teacher restates the name of the skill that has been learned, what it involves and how it helps. Students are invited to share their learning with the group and what they enjoyed about this session.

48
Session: 2 Year level: 1 Format: Whole Class
Duration: 40 minutes
Text: Catching a Butterfly (E.R.I.K program)
Equipment: enlarged copy of texts, R.I.D.E.R cue cards, whiteboard, student journals, pencils
Before Reading
• Revision of previous session Teacher revises what visualising involves – revisit the analogy of a ‘television’ in the mind. Teacher and students revisit their visualisations at word and sentence level from session one.
• Introduce and orient new text Using the title and front cover, orient the text and activate students’ prior knowledge about the topic. Encourage students to make predictions about the characters, setting, and topic of the story. Identify and discuss meanings of unfamiliar vocabulary.
• Introduce the R.I.D.E.R strategy Using the cue cards, teacher introduces the R.I.D.E.R strategy and explains how this strategy will help students when they are listening/ reading. Teacher goes through each step of the strategy and explains it to students. Read Teacher reads a sentence to students Imagine Make a picture of the sentence in your mind on your television screen. Remember the picture has to match the sentence. Describe Draw your picture. Describe your picture to your partner Evaluate Evaluate your picture. Have you included all the important information that was in the sentence? If not, make changes to your picture. Repeat Read the next sentence and repeat the same steps
While Reading
• Teacher Modelling Teacher reads the first sentence in the text ‘Brett put on his cap and set off for the park’. Using this sentence and cue cards, teacher explicitly models how to use the R.I.D.E.R strategy. ‘Walk’ through each step in the strategy, thinking aloud to provide scaffolding for students. Make explicit the link between the action and the stage in the R.I.D.E.R strategy (Link action to letter in acronym). Reinforce that the picture does not have to be perfect – it can be a quick sketch.
• Guided Practice Students are given the opportunity to visualise the same sentence ‘Brett put on his cap and set off for the park’ using the R.I.D.E.R strategy. Teacher scaffolds the students’ attempts by stepping them through the strategy constantly referring to the cue cards. Teacher continues to read the text and pauses at the following sentences to engage in guided practice with the students:
- In his bag he had a map and a net. - Brett saw a butterfly on the tap. - It flew away.
Teacher continues to think out aloud. At the ‘Describe’ stage, after drawings are complete, teacher asks students to close their book and invites the students to describe the image they have created to their partner.
After Reading
• Oral Retell Working in pairs, students take turns to spontaneously retell the story
• Review of learning At the completion of the lesson students reflect on what they have learned and are invited to share responses to the following questions:
- What did you learn? - What did you enjoy about today’s session?

49
Session: 3 Year Level: 1 Format: Whole Class
Duration: 40 minutes
Text: Brad’s Farm (E.R.I.K program)
Equipment: enlarged copy of texts, R.I.D.E.R cue cards, whiteboard, student journals, pencils
Before Reading
• Revision of previous session Teacher revises what visualising involves – revisit the analogy of a ‘television’ in the mind. Teacher reads the text from the previous session and students revisit their visualisations of single sentences from session two.
• Revise the R.I.D.E.R strategy Using the cue cards, teacher revises the R.I.D.E.R strategy and explains how this strategy will help students when they are listening/ reading. Teacher revisits each step of the strategy and reinforces it to students. Read Teacher reads a sentence to students Imagine Make a picture of the sentence in your mind on your television screen. Remember the picture has to match the sentence. Describe Draw your picture. Describe your picture to your partner Evaluate Evaluate your picture. Have you included all the important information that was in the sentence? If not, make changes to your picture. Repeat Read the next sentence and repeat the same steps
• Introduce and orient new text Using the title and front cover, orient the text and activate students’ prior knowledge about the topic. Encourage students to make predictions about the characters, setting, and topic of the story. Identify and discuss meanings of unfamiliar vocabulary.
While Reading
• Teacher Modelling Teacher reads the first sentence in the text ‘Brad and his family lived on a farm’. Using this sentence and cue cards, teacher explicitly models the R.I.D.E.R strategy. ‘Walk’ through each step in the strategy, thinking aloud to provide scaffolding for students. Make explicit the link between the action and the stage in the R.I.D.E.R strategy.
• Guided Practice Students are given the opportunity to visualise the same sentence ‘Brad and his family lived on a farm’ using the R.I.D.E.R strategy. Teacher scaffolds the students’ attempts by stepping them through the strategy constantly referring to the cue cards. Teacher continues to read the text and pauses at the following sentences to engage in guided practice with the students:
- It was a big farm with lots of animals. - One day, Brad got stuck behind a cow. - His dad pushed the cow but it was too big.
Teacher continues to think out aloud. At the ‘Describe’ stage, after drawings are complete, teacher asks students to close their book and invites the students to describe the image they have created to their partner. Teacher reads whole story to students.
After Reading
• Oral Retell Working in pairs, students take turns to spontaneously retell the story
• Review of learning At the completion of the lesson students reflect on what they have learned and are invited to share responses to the following questions:
- What did you learn? - What did you enjoy about today’s session?

50
Session: 4 Year Level: 1 Format: Whole Class
Duration: 40 minutes
Text: My Friend Bob (E.R.I.K program)
Equipment: enlarged copy of texts, R.I.D.E.R cue cards, whiteboard, student journal, pencils
Before Reading
• Revision of previous session Teacher revises what visualising involves – revisit the analogy of a ‘television’ in the mind. Teacher reads the text from the previous session and students revisit their visualisations of single sentences from session three.
• Revise the R.I.D.E.R strategy Using the cue cards, teacher revises the R.I.D.E.R strategy and explains how this strategy will help students when they are listening/ reading. Teacher revisits each step of the strategy and reinforces it to students. Read Teacher reads a sentence to students Imagine Make a picture of the sentence in your mind on your television screen. Remember the picture has to match the sentence. Describe Draw your picture. Describe your picture to your partner Evaluate Evaluate your picture. Have you included all the important information that was in the sentence? If not, make changes to your picture. Repeat Read the next sentence and repeat the same steps
• Introduce and orient new text Using the title and front cover, orient the text and activate students’ prior knowledge about the topic. Encourage students to make predictions about the characters, setting, and topic of the story. Identify and discuss meanings of unfamiliar vocabulary.
While Reading
• Teacher Modelling Teacher reads the first sentence in the text ‘Once there was a dog called Bob’. Using this sentence and cue cards, teacher explicitly models the R.I.D.E.R strategy. ‘Walk’ through each step in the strategy, thinking aloud to provide scaffolding for students. Make explicit the link between the action and the stage in the R.I.D.E.R strategy.
• Guided Practice Students are given the opportunity to visualise the same sentence ‘Once there was a dog called Bob’ using the R.I.D.E.R strategy. Teacher scaffolds the students’ attempts by stepping them through the strategy constantly referring to the cue cards. Teacher continues to read the text and pauses at the following sentences to engage in guided practice with the students:
- Sal was a frog and lived inside a log. - Sal was at her job one day and a mob of frogs took her log. - After a long time, they saw a log in the fog.
Teacher continues to think out aloud. At the ‘Describe’ stage, after drawings are complete, teacher asks students to close their book and invites the students to describe the image they have created to their partner. Teacher reads whole story to students.
After Reading
• Oral Retell Working in pairs, students take turns to spontaneously retell the story
• Review of learning At the completion of the lesson students reflect on what they have learned and are invited to share responses to the following questions:
- What did you learn? - What did you enjoy about today’s session?

51
Session: 5 Year Level: 1 Format: Whole Class
Duration: 40 minutes
Text: Chicken Pox (E.R.I.K program)
Equipment: enlarged copy of texts, R.I.D.E.R cue cards, whiteboard, student journals, pencils
Before Reading
• Revision of previous session Teacher revises what visualising involves – revisit the analogy of a ‘television’ in the mind. Teacher reads the text from the previous session and students revisit their visualisations of single sentences from session four.
• Revise the R.I.D.E.R strategy Using the cue cards, teacher revises the R.I.D.E.R strategy and explains how this strategy will help students when they are listening/ reading. Teacher revisits each step of the strategy and reinforces it to students. Read Teacher reads a sentence/ pair of sentences to students Imagine Make a picture of the sentence/s in your mind on your television screen. Remember the picture has to match the sentence. Describe Draw your picture. Describe your picture to your partner Evaluate Evaluate your picture. Have you included all the important information that was in the sentence? If not, make changes to your picture. Repeat Read the next sentence and repeat the same steps
• Introduce and orient new text Using the title and front cover, orient the text and activate students’ prior knowledge about the topic. Encourage students to make predictions about the characters, setting, and topic of the story. Identify and discuss meanings of unfamiliar vocabulary.
While Reading
• Teacher Modelling Teacher reads the first sentence in the text ‘The other day when Max woke up he had lots of spots on his tummy’. Using this sentence and cue cards, teacher explicitly models the R.I.D.E.R strategy. ‘Walk’ through each step in the strategy, thinking aloud to provide scaffolding for students. Make explicit the link between the action and the stage in the R.I.D.E.R strategy.
• Guided Practice Students are given the opportunity to visualise the same sentence ‘The other day when Max woke up he had lots of spots on his tummy’ using the R.I.D.E.R strategy. Teacher scaffolds the students’ attempts by stepping them through the strategy constantly referring to the cue cards. Explain that the way in which students use the strategy is going to change. Instead of one sentence at a time, students are now going to visualise a pair of sentences. Move from a single sentence to pairs of sentences following the same procedure of teacher modelling followed by guided practice (as above) Teacher continues to read the text and pauses at the following sentences to engage in guided practice with the students:
- His face was spotty too. Max had one, two, three, four, five, six spots on his face.
- Max’s mum took him to the doctor. The doctor told Max that he had the chicken pox.
- All his red spots were gone. Max was happy

52
Teacher continues to think out aloud. At the ‘Describe’ stage, after drawings are complete, teacher asks students to close their book and invites the students to describe the image they have created to their partner. Teacher reads whole story to students.
After Reading
• Oral Retell Working in pairs, students take turns to spontaneously retell the story
• Review of learning At the completion of the lesson students reflect on what they have learned and are invited to share responses to the following questions:
- What did you learn? - What did you enjoy about today’s session?

53
Session: 6 Year Level: 1 Format: Whole Class
Duration: 40 minutes
Text: Cliff’s Birthday Surprise (E.R.I.K program)
Equipment: enlarged copy of texts, R.I.D.E.R cue cards, whiteboard, student journal, pencils
Before Reading
• Revision of previous session Teacher revises what visualising involves – revisit the analogy of a ‘television’ in the mind. Teacher reads the text from the previous session and students revisit their visualisations of pairs of sentences from session five.
• Revise the R.I.D.E.R strategy Using the cue cards, teacher revises the R.I.D.E.R strategy and explains how this strategy will help students when they are listening/ reading. Teacher revisits each step of the strategy and reinforces it to students. Read Teacher reads a pair of sentences to students Imagine Make a picture of the sentences in your mind on your television screen. Remember the picture has to match the sentences. Describe Draw your picture. Describe your picture to your partner Evaluate Evaluate your picture. Have you included all the important information that was in the sentences? If not, make changes to your picture. Repeat Read the next pair of sentences and repeat the same steps
• Introduce and orient new text Using the title and front cover, orient the text and activate students’ prior knowledge about the topic. Encourage students to make predictions about the characters, setting, and topic of the story. Identify and discuss meanings of unfamiliar vocabulary.
While Reading
• Teacher Modelling Teacher reads the first pair of sentences in the text ‘It was Cliff’s birthday. Cliff and his mum went to the mal to look for some presents’. Using this sentence and cue cards, teacher explicitly models the R.I.D.E.R strategy. ‘Walk’ through each step in the strategy, thinking aloud to provide scaffolding for students. Make explicit the link between the action and the stage in the R.I.D.E.R strategy.
• Guided Practice Students are given the opportunity to visualise the same pair of sentences ‘It was Cliff’s birthday. Cliff and his mum went to the mal to look for some presents’ using the R.I.D.E.R strategy. Teacher scaffolds the students’ attempts by stepping them through the strategy constantly referring to the cue cards. Teacher continues to read the text and pauses at the following sentences to engage in guided practice with the students:
- Cliff saw his mum outside the shop. She had a big bag full of presents. - That night, Cliff got new socks, a clock and the big red ball. His mum
hung his new clock on his bedroom wall. Teacher continues to think out aloud. At the ‘Describe’ stage, after drawings are complete, teacher asks students to close their book and invites the students to describe the image they have created to their partner. Teacher reads whole story to students.
After Reading
• Oral Retell Working in pairs, students take turns to spontaneously retell the story
• Review of learning At the completion of the lesson students reflect on what they have learned and are invited to share responses to the following questions:
- What did you learn? - What did you enjoy about today’s session?

54
Session: 7 Year Level: 1 Format: Whole Class
Duration: 40 minutes
Text: A Day at the Beach (E.R.I.K program)
Equipment: enlarged copy of texts, R.I.D.E.R cue cards, whiteboard
Before Reading
• Revision of previous session Teacher reads the text from the previous session and students revisit their visualisations of pairs of sentences from session six.
• Revise the R.I.D.E.R strategy (Draw component is removed) Display the cue cards above the text to provide a visual cue for students. Explain to students that they will no longer draw the image they have made in their mind; instead they will describe it to a partner. Read Teacher reads a sentence to students Imagine Make a picture of the sentence in your mind on your television screen. Remember the picture has to match the sentence. Describe Describe your picture to your partner Evaluate Evaluate your picture. Have you included all the important information that was in the sentence? If not, make changes to your picture. Repeat Read the next sentence and repeat the same steps
• Introduce and orient new text Using the title and front cover, orient the text and activate students’ prior knowledge about the topic. Encourage students to make predictions about the characters, setting, and topic of the story. Identify and discuss meanings of unfamiliar vocabulary.
While Reading
Teacher reads the first pair of sentences in the text ‘Mum put some fresh bread rolls and some ham in her mesh bag. She filled it with ice to chill the food’. Teacher thinks aloud at the Describe stage to provide modelling for students.
• Independent Practice Students are given the opportunity to visualise the same pair of sentences ‘Mum put some fresh bread rolls and some ham in her mesh bag. She filled it with ice to chill the food’ using the R.I.D.E.R strategy. Teacher cues the use of the R.I.D.E.R strategy and students attempt to use it independently on text. Teacher provides scaffolding where necessary. Teacher continues to read the text and pauses at the following sentences to give students the opportunity to visualise using the R.I.D.E.R strategy:
- When they go to the beach, Beck’s mum put a rug out on the sand. Beck saw some kids playing with a ball.
- Just as she got near the ball, one of the boys shouted, “Look out!” A bird flew down and bit Beck on the neck.
Teacher reads whole story to students.
After Reading
• Oral Retell Working in pairs, students take turns to spontaneously retell the story
• Review of learning At the completion of the lesson students reflect on what they have learned and are invited to share responses to the following questions:
- What did you learn? - What did you enjoy about today’s session?

55
Session: 8 Year Level: 1 Format: Whole Class
Duration: 40 minutes
Text: Playing in the Loft (E.R.I.K program)
Equipment: enlarged copy of texts, R.I.D.E.R cue cards, whiteboard
Before Reading
• Revision of previous session Teacher reads the text from the previous session and students revisit their visualisations of pairs of sentences from session seven.
• Revise the R.I.D.E.R strategy Display the cue cards above the text to provide a visual cue for students.
• Introduce and orient new text Using the title and front cover, orient the text and activate students’ prior knowledge about the topic. Encourage students to make predictions about the characters, setting, and topic of the story. Identify and discuss meanings of unfamiliar vocabulary.
While Reading
Teacher reads the first pair of sentences in the text ‘Jenny lived in a big house. At the top of the house, in the roof, there was a loft’. Independent Practice Students are given the opportunity to visualise the same pair of sentences ‘Jenny lived in a big house. At the top of the house, in the roof, there was a loft’ using the R.I.D.E.R strategy. Teacher cues the use of the R.I.D.E.R strategy and students attempt to use it independently on text. Teacher provides scaffolding where necessary. Teacher continues to read the text and pauses at the following sentences to give students the opportunity to visualise using the R.I.D.E.R strategy:
- One day Jenny and her friend Mary went up in the loft. I n the loft there were boxes everywhere.
- In the box there were lots of dolls. Mary took out a big doll with soft blond hair.
Teacher reads whole story to students.
After Reading
• Oral Retell Working in pairs, students take turns to spontaneously retell the story
• Review of learning At the completion of the lesson students reflect on what they have learned and are invited to share responses to the following questions:
- What did you learn? - What did you enjoy about today’s session?

56
Session: 9 Year Level: 1 Format: Whole Class
Duration: 40 minutes
Text: Helping the Farmer (E.R.I.K program)
Equipment: enlarged copy of texts, R.I.D.E.R cue cards, whiteboard
Before Reading
• Revision of previous session Teacher reads the text from the previous session and students revisit their visualisations of pairs of sentences from session eight.
• Revise the R.I.D.E.R strategy Display the cue cards above the text to provide a visual cue for students.
• Introduce and orient new text Using the title and front cover, orient the text and activate students’ prior knowledge about the topic. Encourage students to make predictions about the characters, setting, and topic of the story. Identify and discuss meanings of unfamiliar vocabulary.
While Reading
Teacher reads the first pair of sentences in the text ‘Max and Fred went on a trip to a farm to see the animals. They met Mr Blunt who was the farmer’. Independent Practice Students are given the opportunity to visualise the same pair of sentences ‘Max and Fred went on a trip to a farm to see the animals. They met Mr Blunt who was the farmer’ using the R.I.D.E.R strategy. Teacher cues the use of the R.I.D.E.R strategy and students attempt to use it independently on text. Teacher provides scaffolding where necessary. Teacher continues to read the text and pauses at the following sentences to give students the opportunity to visualise using the R.I.D.E.R strategy:
- “I have lots of animals,” said Mr Blunt. “I have horses, cows, sheep, goats and dogs.”
- ‘In a paddock, the little colt was lying on the ground near a big horse. The colt looked sad and it had a little stick stuck in its front leg’.
Teacher reads whole story to students.
After Reading
• Oral Retell Working in pairs, students take turns to spontaneously retell the story
• Review of learning At the completion of the lesson students reflect on what they have learned and are invited to share responses to the following questions:
- What did you learn? - What did you enjoy about today’s session?

57
Session: 10 Year Level: 1 Format: Whole Class
Duration: 40 minutes
Text: The Farm Truck (E.R.I.K program)
Equipment: enlarged copy of texts, R.I.D.E.R cue cards, whiteboard
Before Reading
• Revision of previous session Teacher reads the text from the previous session and students revisit their visualisations of pairs of sentences from session nine.
• Revise the R.I.D.E.R strategy Display the cue cards above the text to provide a visual cue for students.
• Introduce and orient new text Using the title and front cover, orient the text and activate students’ prior knowledge about the topic. Encourage students to make predictions about the characters, setting, and topic of the story. Identify and discuss meanings of unfamiliar vocabulary. Identify and discuss meanings of unfamiliar vocabulary.
While Reading
Teacher reads the first pair of sentences in the text ‘One day they were going to town with some ducks in the back of the old truck. The truck hit a rock’. Independent Practice Students are given the opportunity to visualise the same pair of sentences ‘One day they were going to town with some ducks in the back of the old truck. The truck hit a rock’ using the R.I.D.E.R strategy. Teacher cues the use of the R.I.D.E.R strategy and students attempt to use it independently on text. Teacher provides scaffolding where necessary. Teacher continues to read the text and pauses at the following sentences to give students the opportunity to visualise using the R.I.D.E.R strategy: -‘In the back of the truck was their dog Fang and the ducks. Fang sprang out of the truck and onto the road’. - ‘Just then Mr Rich came past in his truck. Bess sang out, “Hey! Mr Rich, Stop! Please!” Teacher reads whole story to students.
After Reading
• Oral Retell Working in pairs, students take turns to spontaneously retell the story
• Review of learning At the completion of the lesson students reflect on what they have learned and are invited to share responses to the following questions:
- What did you learn? - What did you enjoy about today’s session?

58
APPENDIX THREE – R.I.D.E.R Cue Cards used during teaching sequence
�
�

59
ead

60
magine
magine
magine

61
escribe
escribe

62
valuate
�
�

63
epeat
1 2
3 4
�
�

64
APPENDIX FOUR - Munro Test of Listening Comprehension (Pre and Post Test)
Munro Test of Listening Comprehension – Scoring Sheet
Idea No. Idea � or X Idea No. Idea � or X
1 Jane 11 dirty
2 at school 12 told her friend
3 went outside 13 Susan
4 sit 14 Susan took sandwich from her
lunch box
5 on seats 15 shared it with Jane
6 eat lunch 16 after lunch
7 opened her lunchbox 17 Jane and Susan
8 fell over 18 went into playground
9 lunch on the ground 19 had a good time
10 sandwiches 20 playing chasey
� Pre-Test � Post-Test
Observations:
Student I.D: Student A B C D E F G H

65
APPENDIX FIVE - Spontaneous and Cued Retell (Pre and Post Test)
Student I.D: Student A B C D E F G H Title of selected passage/story: Great Lion and Tiny Mouse (PM Benchmark Kit Level 16) Fry’s Readability: Yr.1
Characteristic of retelling
Ideas in the story No of ideas/ points
Student’s response –
spontaneous
Student’s response –
cued
Main Characters Lion, Mouse 2
Theme A story about a lion and a mouse helping each other 2
Events of the story 1. A great big lion liked to sleep in the sun 2. Mouse did not see the lion and ran over his paw 3. Lion woke up and caught the mouse 4. The mouse could not escape 5. The mouse begged the lion not to eat her 6. The mouse said she could help the lion one day 7. The lion laughed at the mouse 8. The lion let the mouse go 9. The mouse ran away 10. The lion went out hunting at night 11. Some hunters caught the lion in a net 12. The lion was roaring “Help me!” 13. The mouse went to help the lion 14. The mouse nibbled a hole in the net 15. The lion got out of the net 16. The lion thanked the mouse for helping him
3 2 2 1 1 1 1 1 1 2 2 2 2 2 1 2
30
Analysis of the reader’s listening comprehension using retelling

66
Cued Retell Questions
1. Can you tell me anything else about this story? 2. Who are the main characters in this story? 3. What is the story about? 4. How were the animals helpful to each other?

67
APPENDIX SIX - Spontaneous and Cued Retell (Post Test Unseen Text)
Student I.D: Student A B C D E F G H Title of selected passage/story: Pigs love mud! (Cambridge Bright Sparks) Fry’s Readability: Yr.1
Characteristic of retelling
Ideas in the story No of ideas/ points
Student’s response –
spontaneous
Student’s response –
cued
Main Characters Pig, Duck, Cow 3
Theme A story about animals that play in the mud 1
Events 17. It was a hot day on the farm 1
18. Animals were hot and thirsty 2
19. Dark clouds appeared in the sky 1
20. Piglet didn’t know what rain was 1
21. Piglet had never seen rain before 1
22. Rain is water from the sky 1
23. Pigs like rain 1
24. Pigs love mud 1
25. Drop of rain fell on piglets nose 1
26. Rain fell on the dusty ground 2
27. Cow mooed in the rain 1
28. Duck flapped her wings in the rain 1
29. Piglet shivered in her pen 2
30. Ground was covered with mud 1
31. Piglet felt soft, sticky mud 1
32. Cow and duck pushed piglet into the mud 2
33. Piglet squealed 1
Analysis of the reader’s listening comprehension using retelling

68
34. Cow and duck splashed piglet with mud 2
35. A huge mud fight 1
36. Animals played in the mud 1
37. Piglet said, “I love mud” 1
30
Cued Retell Questions
1. Can you tell me anything else about this story? 2. Who are the main characters in this story? 2. What is the story about?

69
APPENDIX SEVEN - Visualisation Task (Pre and Post Test)
Title of selected passage/story: The Pocket Dogs go on Holiday
Student I.D: Student A B C D E F G H
Ideas in the story No of ideas/ points
Idea present in drawing
Idea mentioned in discussion
As they walked to the beach, everyone said “Hello Mr. Pockets! What big pockets you have, Mr Pockets”.
Mr Pockets Biff and Buff walked to beach people said hello big pockets on coat
1 2 1 1 2
While Buff chased the waves and Biff ran away from the waves, Mr Pockets took off his coat, rolled up his sleeves and started building a kennel castle.
Buff chased waves Biff ran away from waves Mr Pockets took off coat rolled up sleeves built kennel castle
1 1 1 1 1
Biff and Buff played “We’re the Kings of the Kennel Castle” until Mr Pockets said, “Right, it’s time to catch some fish for our tea. So they walked further along the beach to the rocks.
Biff and Buff Playing Kings of the kennel castle Mr Pockets fishing rod walked along the beach rocks
2 1 1 1 1 1
Mr Pockets caught 3 fish, one for each of them, Biff and Buff were most impressed. So they went back down the beach to collect Mr. Pockets’ coat.
Mr Pockets 3 fish Biff and Buff most impressed/ happy Mr. Pocket’s coat
1 1 2 1 1
Total ideas 25
Analysis of the reader’s visualisation

70
APPENDIX EIGHT - Visualisation Task (Post Test Unseen Text)
Title of selected passage/story: Mr Moo (Unseen Text)
Student I.D: Student A B C D E F G H Ideas in the story No of ideas/
points Idea present in
drawing Idea
mentioned in discussion
Mr Moo was happy – he had a lovely house, a garden, and a shed to work in AND he had a river.
Mr Moo felt happy house garden shed river
1 1 1 1 1
In the middle of the river was an island and on the island was a very big tree.
island in the middle of the river big tree
1 1 1
Sometimes Mr Moo’s neighbours, Finder the dog and Phillip and Phoebe, popped by for a chat, or for a swim in the river. Sometimes he invited them over for a dinner and a dance. He liked to rock n’ roll.
Mr Moo neighbours swim in the river dinner dancing liked rock n’ roll
1 3 1 1 1 1
Analysis of the reader’s visualisation

71
One afternoon Mr Moo packed up his tool bag. He would need a hammer, a saw and lots of nails. Then he packed up some planks of wood and went down to the river to work on his rowboat.
Mr Moo afternoon tool bag hammer saw nails planks of wood river build a row boat
1 1 1 1 1 1 1 1 1
Total ideas
25

72
APPENDIX NINE – Example of a Student Journal (from Intervention
Teaching Sessions)