ABSTRACT - University Of Maryland€¦ · · 2016-03-29from Louis Lin of NanYa Plastics...
75
ABSTRACT Title of Document: CHARACTERIZATION OF FR-4 PRINTED CIRCUIT BOARD LAMINATES BEFORE AND AFTER EXPOSURE TO LEAD-FREE SOLDERING CONDITIONS Ravikumar Sanapala, Master of Science, 2008 Directed By: Chair Professor, Michael G. Pecht, Department of Mechanical Engineering The transition to lead-free soldering of printed circuit boards (PCBs) using solder alloys such as Sn/Ag/Cu has resulted in higher temperature exposures during assembly compared with traditional eutectic Sn/Pb solders. The knowledge of possible variations in the PCB laminate material properties due to the soldering conditions is an essential input in the selection of appropriate laminates. An experimental study was conducted to investigate the effects of lead-free processing on key thermomechanical, physical, and chemical properties of a range of FR-4 PCB laminate materials. The laminate material properties were measured as per the IPC/UL test methods before and after subjecting to multiple lead-free soldering cycles. The effect of lead-free soldering conditions was observed in some of the material types and the variations in properties were related to the material constituents. Fourier transform infrared (FTIR) spectroscopy and combinatorial property analysis were performed to investigate the material-level transformations due to soldering exposures.
Transcript of ABSTRACT - University Of Maryland€¦ · · 2016-03-29from Louis Lin of NanYa Plastics...
ABSTRACT
Title of Document: CHARACTERIZATION OF FR-4 PRINTED
CIRCUIT BOARD LAMINATES BEFORE AND AFTER EXPOSURE TO LEAD-FREE SOLDERING CONDITIONS
Ravikumar Sanapala, Master of Science, 2008 Directed By: Chair Professor, Michael G. Pecht, Department
of Mechanical Engineering The transition to lead-free soldering of printed circuit boards (PCBs) using
solder alloys such as Sn/Ag/Cu has resulted in higher temperature exposures during
assembly compared with traditional eutectic Sn/Pb solders. The knowledge of
possible variations in the PCB laminate material properties due to the soldering
conditions is an essential input in the selection of appropriate laminates.
An experimental study was conducted to investigate the effects of lead-free
processing on key thermomechanical, physical, and chemical properties of a range of
FR-4 PCB laminate materials. The laminate material properties were measured as per
the IPC/UL test methods before and after subjecting to multiple lead-free soldering
cycles.
The effect of lead-free soldering conditions was observed in some of the
material types and the variations in properties were related to the material
constituents. Fourier transform infrared (FTIR) spectroscopy and combinatorial
property analysis were performed to investigate the material-level transformations
due to soldering exposures.

CHARACTERIZATION OF FR-4 PRINTED CIRCUIT BOARD LAMINATES
BEFORE AND AFTER EXPOSURE TO LEAD-FREE SOLDERING CONDITIONS
By
Ravikumar Sanapala
Thesis submitted to the Faculty of the Graduate School of the University of Maryland, College Park, in partial fulfillment
of the requirements for the degree of Master of Science,
Mechanical Engineering. August, 2008
Advisory Committee: Dr. Michael Pecht, Chair Professor of Mechanical Engineering Dr. Patrick McCluskey, Associate Professor, Mechanical Engineering Dr. Peter Sandborn, Associate Professor, Mechanical Engineering Dr. Diganta Das, Faculty Research Scientist, Mechanical Engineering

© Copyright by
Ravikumar Sanapala
2008

ii
Dedication
I wish to dedicate this thesis to my parents for their unconditional love and support
through out my life
iii
Acknowledgements
I would like to express my sincere gratitude to my advisor, Prof. Michael
Pecht, for giving me the opportunity to be involved in this experimental study, and for
all his support and guidance. I am also very much indebted to Bhanu Sood for his
consistent supervision and productive discussion on my work. I also thank
Dr. Diganta Das for his helpful insights on giving directions to my thesis and constant
guidance throughout my stay at University of Maryland. I wish to extend my thanks
to Dr. Patrick McCluskey and Dr. Peter Sandborn for serving on my thesis committee
and reviewing my work.
I want to personally thank Dr Michael Azarian for his valuable inputs related
to my thesis. I would like to thank all the CALCE EPS consortium members for their
support in performance of this study. I also appreciate and acknowledge the inputs
from Louis Lin of NanYa Plastics Corporation, Taiwan, and Joe Beers of Gold
Circuit Electronics, USA, during the course of my thesis.
Lastly, I wish to express my thanks to all my friends and faculty at CALCE
for making it an enjoyable place to work.
iv
Table of Contents
Dedication ..................................................................................................................... ii Acknowledgements...................................................................................................... iii Table of Contents......................................................................................................... iv List of Tables ............................................................................................................... vi List of Figures ............................................................................................................. vii Chapter 1: Introduction ................................................................................................. 1
1.1 Overview of PCB fabrication........................................................................ 1 1.2 Literature Review.......................................................................................... 3 1.3 Objectives of Thesis...................................................................................... 6 1.4 Overview of Thesis ....................................................................................... 6
Chapter 2: Constituents of FR-4 Laminates.................................................................. 8 2.1 Reinforcement............................................................................................... 8 2.2 Resin system ................................................................................................. 9
2.2.1 Curing agents ...................................................................................... 10 2.2.2 Flame retardants.................................................................................. 12 2.2.3 Fillers .................................................................................................. 13 2.2.4 Accelerators ........................................................................................ 13
Chapter 3: Test Materials and Exposure Conditions .................................................. 14 3.1 Test materials .............................................................................................. 14 3.2 Material construction .................................................................................. 17 3.3 Exposure conditions.................................................................................... 18
Chapter 4: Material Properties and Test Methods ...................................................... 20 4.1 Glass transition temperature (Tg) ................................................................ 20 4.2 Coefficient of thermal expansion (CTE)..................................................... 22 4.3 Decomposition temperature (Td)................................................................. 25 4.4 Time-to-delamination (T-260) .................................................................... 26 4.5 Water absorption......................................................................................... 28 4.6 Flammability ............................................................................................... 28
Chapter 5: Results and Discussion.............................................................................. 31 5.1 Glass transition temperature (Tg) ................................................................ 31 5.2 Coefficient of thermal expansion (CTE)..................................................... 33 5.3 Decomposition temperature (Td)................................................................. 36 5.4 Time-to-delamination (T-260) .................................................................... 40 5.5 Water absorption......................................................................................... 41 5.6 Flammability ............................................................................................... 42
Chapter 6: Analysis of Results................................................................................... 45 6.1 Fourier transform infrared (FTIR) spectroscopy analysis .......................... 45
6.1.1 Introduction......................................................................................... 45 6.1.2 Analysis............................................................................................... 47
6.2 Combinatorial property analysis ................................................................. 52 Chapter 7: Summary and Conclusions........................................................................ 55 Chapter 8: Contributions............................................................................................. 57

v
Appendix I: Datasheet values for the material properties studied .............................. 58 Appendix II: FTIR spectra of control and 6X reflowed samples of material B ......... 59 Bibliography ............................................................................................................... 60
vi
List of Tables Table 1: Some of the common PCB material types [4] ................................................ 2 Table 2: Typical constituents of FR-4 laminates .......................................................... 8 Table 3: Typical constituents of E-Glass [4] ................................................................ 9 Table 4: Laminate material classification ................................................................... 15 Table 5: EDS analysis of laminates ............................................................................ 16 Table 6: Material properties and test methods............................................................ 20 Table 7: The Tg comparison between DSC and TMA methods ................................. 33 Table 8: Control in-plane (warp and fill) CTE measurement results.......................... 35 Table 9: Post exposure in-plane (warp) CTE measurement results ............................ 35 Table 10: Post exposure in-plane (fill) CTE measurement results ............................. 36 Table 11: Typical functional groups and wave numbers present in epoxy systems... 48 Table 12: Summary of variations in properties for materials B and H....................... 52

vii
List of Figures Figure 1: Typical steps involved in FR-4 printed circuit assembly fabrication............ 2 Figure 2: Typical glass-weave styles used in PCBs...................................................... 9 Figure 3: Formation of DGEBA [4]............................................................................ 10 Figure 4: Tetra-functional and multi-functional epoxy monomers [4]....................... 10 Figure 5: Typical structures of DICY and phenolic-cured resin systems [15] ........... 11 Figure 6: Chemical structure of Tetrabromobisphenol A (TBBPA) .......................... 12 Figure 7: Chemical structure of DOPO (9, 10-Dihydro-9-oxa-10-phosphophenanthren-10-oxide) .................................................................................. 13 Figure 8: Chemical structure of Imidazole ................................................................. 13 Figure 9: ESEM picture showing filler particles in material B .................................. 16 Figure 10: Flow of test materials ................................................................................ 17 Figure 11: 6-ply laminate structure............................................................................. 18 Figure 12: 12 layered fabricated board structure ........................................................ 18 Figure 13: Lead-free reflow profile used for the exposures ....................................... 19 Figure 14: Perkin Elmer DSC..................................................................................... 21 Figure 15: Glass transition temperature measurement plot (material J) ..................... 22 Figure 16: Perkin Elmer TMA.................................................................................... 23 Figure 17: Out-of-plane CTE measurement plot (material B).................................... 23 Figure 18: In-plane CTE (warp) measurement plot (material B) ............................... 24 Figure 19: In-plane CTE (fill) measurement plot (material B)................................... 24 Figure 20: Shimadzu TGA 50..................................................................................... 25 Figure 21: Decomposition temperature measurement plot (material F)..................... 26 Figure 22: T-260 measurement plot (material B) ....................................................... 27 Figure 23: Typical PCB combustion steps [31].......................................................... 29 Figure 24: Test set up for flammability measurement ................................................ 30 Figure 25: Effect of lead-free soldering exposures on Tg of the laminates................ 32 Figure 26: Effect of lead-free soldering exposures on out-of-plane CTE of the laminates ..................................................................................................................... 34 Figure 27: Effect of lead-free soldering exposures on Td of the laminates ................ 36 Figure 28: Td comparison between materials A and J ................................................ 37 Figure 29: Td comparison between materials A and G1............................................. 37 Figure 30: Effect of type of curing agent on Td of the laminates ............................... 38 Figure 31: Td comparison between materials C1 and C2 ........................................... 38 Figure 32: Effect of presence of fillers on Td of the laminates................................... 39 Figure 33: Td comparison between materials A and B ............................................... 39 Figure 34: Td comparison between materials H and I................................................. 40 Figure 35: Effect of type of flame retardant on Td of the laminates ........................... 40 Figure 36: Effect of lead-free soldering exposures on T-260 of the laminates .......... 41 Figure 37: Effect of lead-free soldering exposures on water absorption .................... 42 Figure 38: Effect of lead-free soldering exposures on flammability of the laminates (total burning time) ..................................................................................................... 43 Figure 39: Effect of lead-free soldering exposures on flammability of the laminates (Average burning time)............................................................................................... 43 Figure 40: Common molecular bending movements [38] .......................................... 46
viii
Figure 41: Typical functional groups present in the epoxy laminate systems............ 50 Figure 42: FTIR spectrum of control sample with functional groups identified (material H)................................................................................................................. 51 Figure 43: FTIR spectra of a control and 6X reflowed sample (material H).............. 51 Figure 44: Effect of baking on the Tg of laminates..................................................... 54
1
Chapter 1: Introduction
Printed circuit boards (PCBs) are the baseline in electronic packaging upon which
electronic components are formed into electronic systems. The directive on
Restriction of certain hazardous substances (RoHS) [1], and the Waste electrical and
electronic equipment (WEEE) directive [2] have led to the adoption of lead-free
soldering conditions in the PCB assembly process. The drive towards lead-free
electronics has resulted in the use of lead-free solders in the PCB assembly. Common
lead-free solder alloys such as Sn/Ag/Cu and Sn/Ag typically require a peak reflow
temperature increase of 30-40oC for longer time periods compared to eutectic Sn/Pb
reflow soldering conditions [3]. Rework and repair of assembled circuit boards also
contribute to additional high temperature exposures. These exposures can alter the
circuit board laminate material properties thereby creating a shift in the expected
reliability of the PCB and the entire electronic assembly. The dependence of the
laminate properties on the material constituents combined with the possible variations
due to lead-free soldering exposures has not yet been extensively investigated.
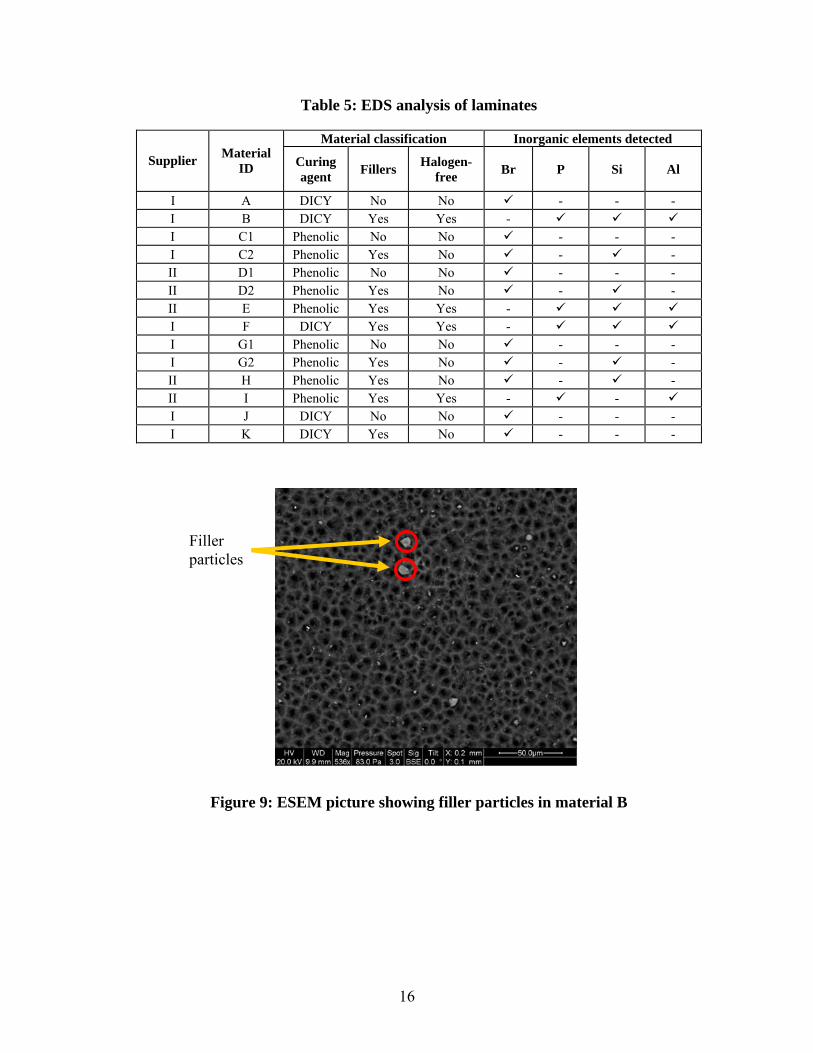
1.1 Overview of PCB fabrication
The basic building blocks of a PCB are composites of resin and reinforcement. A
wide variety of resin and reinforcement types that are commonly used in the PCB
industry are listed in Table 1. The nomenclature shown for each type of material
corresponds to the grades developed by National Electrical Manufacturers
Association (NEMA).

2
Table 1: Some of the common PCB material types [4]
Nomenclature Reinforcement Resin Flame retardant
FR-2 Cotton paper Phenolic Yes FR-3 Cotton paper Epoxy Yes FR-4 Woven glass Epoxy Yes
CEM-1 Cotton paper/woven glass Epoxy Yes CEM-2 Cotton paper/woven glass Epoxy No CEM-3 Woven glass/matte glass Epoxy Yes
FR-4 PCB is a composite of epoxy resin with woven fiberglass reinforcement and it
is the most widely used printed circuit board (PCB) material. The steps involved in
the fabrication of FR-4 printed circuit assembly (PCA) are shown in Figure 1.
Glass Raw Materials(e.g., Silica, Calcium oxide, Aluminum oxide)
Copper Foil
Glass Fiber Production(Melting, Formation, Coating/Binders)
Glass Fabric (e.g, 1080, 2116, 7628 weave styles)
Prepregs (B-stage resin)
Cores (Laminates)(C-stage resin)
Resin Raw Materials(Petrochemicals)
Epoxy Resin Production (A-stage resin)
Additives• Curing agents
• Flame Retardants
• Fillers
• Accelerators
Printed Circuit Board• Single/double sided
• Multi-layered
Oxide Coatings
Drilling
Plating Materials
Solder Mask
Fluxes, Etchants, Cleaners
Coupling Agent
Electronic Components
Reflow/Wave Soldering
Assembly Process
Printed Circuit Assembly
Figure 1: Typical steps involved in FR-4 printed circuit assembly fabrication
Glass raw materials are melted in a furnace and extruded to form fiberglass
filaments that are combined into strands of multiple fiber yarn. Yarns are then weaved
to form fiberglass cloth. A coupling agent, typically an organosilane, is coated onto
the fabric to improve the adhesion between organic resin and inorganic glass. Resin is
obtained from processing the petrochemicals and in its pure (uncured) form is called

3
A-stage resin. Additives such as curing agents, flame retardants, fillers, and
accelerators are added to the resin to tailor the performance of the board.
A prepreg is fabricated from a glass fabric impregnated with the semi-cured (B-
stage) epoxy resin. Multiple prepregs are thermally pressed to obtain a core or
laminate (C-stage resin). Copper foil is then typically electrodeposited to obtain a
copper clad laminate. Several prepregs and cores (with copper cladding etched as per
the circuit requirements) are stacked together under temperature and pressure
conditions to fabricate a multi-layered PCB. Through-holes and micro-via
interconnects are drilled in the PCB as per the application specific design data and
then plated with copper. Solder mask is applied on the board surface exposing the
areas to be soldered. Flux is applied at regions where the electronic components are to
be soldered. The boards are then subjected to reflow and/or wave soldering process
depending upon the type of components (surface mount or through-hole) to obtain the
printed circuit assembly.
1.2 Literature Review
Very few studies were conducted to characterize FR-4 laminate materials and
assess the variations in material properties due to multiple lead-free soldering profile
exposures. Bergum [5] characterized some of the laminate materials (low Tg DICY &
non-DICY-cured, mid Tg halogen-free, and high Tg DICY & non-DICY-cured) by
analyzing the material properties such as glass transition temperature (Tg), coefficient
of thermal expansion (CTE), decomposition temperature (Td), and flexural modulus
combined with their variations due to simulated thermal excursions. The thermal
exposures were carried out by standard analytical techniques, such as differential

4
scanning calorimetry (DSC), thermomechanical analysis (TMA), dynamic
mechanical analysis (DMA), and thermogravimetric analysis (TGA) to simulate the
thermal excursions experienced by the laminates during assembly process. Multiple
cycles were repeated on the same sample at peak temperatures of 235oC and 260oC to
observe the variations in properties.
Kelley, et al., ([6], [7]) reported the effect of thermal exposures associated with
typical Sn/Pb and Sn/Ag/Cu reflow conditions on epoxy-based laminates by assessing
the decomposition temperature. The laminates were exposed to multiple thermal
cycles in TGA with peak temperatures of 235oC and 260oC and a change in the
percentage weight loss of the sample was monitored. The study illustrated the
possibility of rapid thermal degradation in the epoxy systems of conventional high Tg
materials with repeated cycling at peak temperature of 260oC. The authors also
demonstrated the usage of a methodology in the selection of lead-free compatible
laminates for appropriate applications. The methodology was developed based on the
PCB design features such as overall thickness, number of layers, copper foil weight,
aspect ratio, resin content and process conditions such as number of reflow cycles.
The study was focused on four types of laminate materials with different
combinations of Tg and Td.
Kelley [8] also illustrated the differences in four types of laminate materials
(combination of low Tg, high Tg, low Td, and high Td) by assessing the properties of
Tg, Td, thermal expansion and time-to-delamination (T260/T288). The study also
reported the evaluation of reliability of multilayered PCBs fabricated out of the four
materials. Survivability of the boards with multiple lead-free soldering exposures was

5
assessed. Interconnect stress test (IST) was performed before and after exposure of
the boards to multiple reflow cycles to estimate the effect of exposures on the
reliability of PCBs.
Ehrler [9] in his study investigated the response of two types of DICY-cured epoxy
laminate materials to lead-free reflow cycles by assessing the reliability with repeated
reflow tests and thermal cycling tests. He demonstrated that the DICY-cured
materials tested were not able to withstand the thermal stresses during lead-free
soldering exposures
Christiansen et al., [10] reported the comparative analysis on different types of
epoxy-based laminate materials (high Tg, mid Tg and low Tg; halogen-free and
halogenated; DICY and non-DICY cured) by measuring the properties of Tg, CTE,
Td, and T260/T288.
Valette et al., [11] have also followed the approach of characterizing epoxy
laminates based on material properties such as Tg, CTE, Td, dielectric constant and
assessed the performance of certain laminates that have higher thermal stability and
lower dielectric constant in comparison to conventional FR-4 laminates.
Pecht et al., [12] characterized a range of PCB laminate materials (low Tg FR-4,
high Tg FR-4, polyimide, cyanate ester, and bismaleimide triazine) based on the
moisture absorption capability at various relative humidity and temperature levels.
Qi et al., [13] assessed the effect of type of PCB material on the durability of solder
joints by characterizing certain types of laminate materials (low Tg FR-4, high Tg FR-
4, and polyimide).

6
1.3 Objectives of Thesis
Based on the literature review, there have been few attempted studies that were
conducted on characterizing certain types of FR-4 laminates and assessing the impact
of lead-free soldering assembly conditions on reliability of printed circuit boards. To
date, no comprehensive report is available on the effect of lead-free soldering
exposures on laminate material properties. Furthermore, a wide variety of laminate
types that are commercialized as ‘Lead-free process compatible’ are available
recently and selection of appropriate laminates has been a challenge for the electronic
industry. An insight into the laminate material constituents and variations in their
material properties due to lead-free soldering exposures is essential in the selection of
appropriate laminate materials. The broad objective of this thesis is to characterize a
wide range of commercially available FR-4 PCB laminate materials and investigate
the effects of lead-free processing on the thermomechanical, physical, and chemical
properties. The analysis is aimed at correlating the properties to the material
constituents of laminates.
1.4 Overview of Thesis
The constituents of FR-4 laminates are discussed in Chapter 2. The test materials
and construction is presented in Chapter 3. Lead-free soldering exposures namely,
three reflow cycles, six reflow cycles, and combination of one wave and two reflow
cycles, considered for this study are also discussed in Chapter 3. In Chapter 4, the
definitions of the material properties and the measurement procedures as per IPC /UL
test standards are discussed. Results and the discussion on the effect of lead-free

7
soldering exposures on the material properties are presented in Chapter 5. Chapter 6
consists of discussion on Fourier transform infrared spectroscopy (FTIR) analysis and
combinatorial material property analysis to investigate the potential material-level
transformations due to the soldering exposures. Summary and conclusions of the
research are listed in Chapter 7. Research contributions are discussed in Chapter 8.

8
Chapter 2: Constituents of FR-4 Laminates
The typical constituents of a FR-4 laminate are listed in Table 2 and are discussed
in detail in the subsequent sections. Each of these constituents is important in its own,
and in combination they determine the properties of the laminates.
Table 2: Typical constituents of FR-4 laminates
Constituent Major function(s) Example material(s)
Reinforcement Provides mechanical strength and electrical properties Woven glass (E-grade) fiber
Coupling agent Bonds inorganic glass with organic resin and transfers stresses across the matrix Organosilanes
Resin Acts as a binder and load transferring agent Epoxy (DGEBA)
Curing agent Enhances linear/cross polymerization in the resin
Dicyandiamide (DICY), Phenol novolac (phenolic)
Flame retardant Reduces flammability of the material Halogenated (TBBPA) or Halogen-free (Phosphorous compounds)
Fillers Reduces thermal expansion Silica
Accelerators Increases reaction rate, reduces curing temperature, controls cross-link density
Imidazole, Organophosphine
2.1 Reinforcement
The woven glass (generally E-grade) fiber cloth acts as reinforcement for the
laminate, primarily providing mechanical strength and electrical properties. Glass
fabric is woven with two sets of fiber yarns (fibers are combined into strands of
multiple fiber yarn). Warp yarn fibers lie in the machine direction of the fabric while
those of fill yarn lie perpendicular to the warp direction. The typical constituents of
glass (E-grade) used in FR-4 laminates are shown in Table 3. The type of glass-weave
style is defined by the parameters such as glass fiber bundle diameter, number of fiber
bundles, and linear density of the fabric ([4], [14]). The difference in the fabric styles
that are commonly used in PCBs (1080, 2116 and 7628 weave styles) is represented

9
in Figure 2. The order of decreasing fabric density and thickness of the fabric among
the glass-weave styles shown is 7628>2116>1080.
Table 3: Typical constituents of E-Glass [4]
Constituent Composition (%) Silicon dioxide (SiO2) Calcium oxide (CaO2) Aluminum oxide (Al2O3) Boron oxide (B2O3) Sodium oxide (Na2O) + Potassium oxide (K2O) Magnesium oxide (MgO) Iron oxide (Fe2O3) Titanium oxide (TiO2) Fluorides
52-56 16-25 12-16 5-10 0-2 0-5
0.05-0.4 0-0.8 0-1
1080 weave 2116 weave 7628 weave
Figure 2: Typical glass-weave styles used in PCBs
2.2 Resin system
The resin system of a FR-4 laminate primarily consists of bi, tetra or multi-
functional epoxy groups. Resin is derived from the reaction of Bisphenol-A with
Epichlorohydrin which creates “Diglycidyl Ether of Bisphenol A” called DGEBA,
also referred as Oxirane (shown in Figure 3). The epoxy groups present in DGEBA
react in subsequent resin polymerization and result in curing of the resin system.
Higher cross-linking in the cured system is achieved by the use of epoxy monomers
with more than two epoxy functional groups per molecule (shown in Figure 4).

10
Figure 3: Formation of DGEBA [4]
Figure 4: Tetra-functional and multi-functional epoxy monomers [4]
Additives such as curing agents, flame retardants, fillers, and accelerators are added
to the resin system to improve the performance of laminate. These are added to the A-
stage resin before prepreg fabrication.
2.2.1 Curing agents
Curing agents are added to the resin system to enhance cross-linking thereby
thermosetting the composite structure. They are usually aliphatic or cycloaliphatic
amines and polyamines or amides. Most widely used curing agents in the PCB
industry are dicyandiamide (commonly known as DICY) and phenol novolac
(phenolic). The chemical formulae of DICY and phenolic curing agents and typical
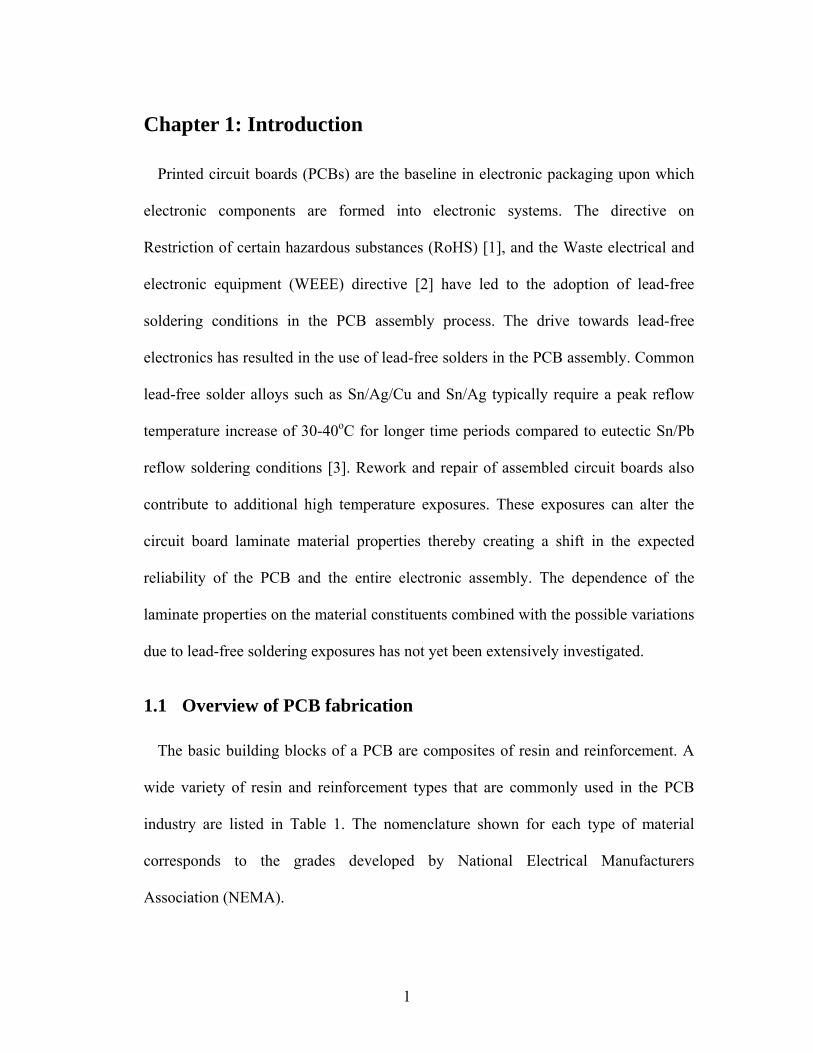
molecular structures of the respective cured resin systems are shown in Figure 5.
Epoxide groupEpoxide group
11
Dicyandiamide (DICY) DICY-cured epoxy system
Phenol novolac (phenolic) Phenolic-cured epoxy system
Figure 5: Typical structures of DICY and phenolic-cured resin systems [15]
The properties of DICY and phenolic cured systems differ because of the inherent
differences in their molecular structures. DICY and its cured epoxy systems are linear
aliphatic molecules compared to the aromatic structure of phenolic and its cured
epoxy systems. This makes the phenolic-cured systems to be more thermally stable
than DICY-cured systems. DICY-cured systems are more hydrophilic than phenolic-
cured systems due to the presence of highly polar carbamidine-carbamide bond in
their chemical structure. Also, at higher temperatures the strong polar nitrogen atom
present in the DICY-cured system can destabilize the brominated epoxy resin
resulting in the production of corrosive bromide ions. Overall, phenolic-cured resin
systems offer better thermal resistance, chemical resistance, humidity resistance and
improved mechanical properties but poor processability (e.g., drilling) compared to
DICY-cured systems [15].
H2NCNHC≡N
NH=
H2NCNHC≡N
NH=OH
CH2
OH
CH2
n
OH

12
2.2.2 Flame retardants
Flame retardants are added to the resin system to reduce flammability of the
laminate material. Tetrabromobisphenol-A (TBBPA) is the most commonly used
halogenated (brominated) flame retardant for epoxy resin systems. The chemical
structure of TBBPA is shown in Figure 6. Brominated flame retardants decompose
during ignition, and retard combustion by trapping radicals generated from resins and
by forming gas-phase barriers against oxygen [16].
Figure 6: Chemical structure of Tetrabromobisphenol A (TBBPA)
Halogen-free flame retardant epoxy systems are gaining importance recently
because of the shift in market trends to halogen-free products due to the public
consciousness of the hazardous halogenated products, the industrial end user
initiatives and the environmental legislations. Phosphorous compounds (such as
Organophosphate esters) and metal hydroxides (such as Aluminum hydroxide and
Magnesium hydroxide) are some of the commonly used halogen-free flame
retardants. Organophosphate esters work by forming flame retarding glass-like
barriers on the resin surface during ignition thereby cutting off oxygen necessary for
combustion ([17], [18], [19]). The chemical structure of one of the most commonly
used organophosphate ester (DOPO) is shown in Figure 7. Metal hydroxides retard
flames by absorbing the heat during ignition, when added in large amounts [20].

13
.
Figure 7: Chemical structure of DOPO (9, 10-Dihydro-9-oxa-10-
phosphophenanthren-10-oxide)
2.2.3 Fillers
Fillers are added to the resin system for specific performance requirements such as
lowering out-of-plane coefficient of thermal expansion (CTE) and to prevent barrel
cracks in plated through holes. Fillers are also added to enhance the flame retardancy
to meet UL 94V-0 flammability rating and to reduce material costs (as they replace
resin). Typical fillers used in FR-4 PCBs are Silica and Aluminum silicate.
2.2.4 Accelerators
Accelerators are added to the resin system to increase the curing rate, reduce curing
temperature and control cross-link density. Imidazole is one of the commonly used
accelerators in FR-4 PCBs. The chemical structure of Imidazole is shown in Figure 8.
N N CH2
CH3
Figure 8: Chemical structure of Imidazole

14
Chapter 3: Test Materials and Exposure Conditions
Laminate material classification, material construction and lead-free soldering
exposure conditions used for the study are discussed in the following subsections.
3.1 Test materials
Fourteen commercially available FR-4 PCB laminates from two suppliers (I and II)
were used in this study. The laminate materials used for the study were classified as
shown in Table 4. Suppliers were chosen from different geographic locations with
suppliers I and II from Taiwan and Japan respectively. Laminates were broadly
categorized on the basis of their glass transition temperatures (Tg) as high-Tg
(Tg>165oC), mid-Tg (140oC<Tg<165oC), and low-Tg (Tg<140oC) materials. Under
each Tg category, laminates were grouped based on the type of curing agent
(dicyandiamide [DICY] or phenol novolac [phenolic]), presence or absence of fillers,
and type of flame retardants (halogenated or halogen-free). Laminates marketed for
the high frequency applications (materials E and K) were also considered for the
study. Coupling agents and accelerators were not controlled in the laminate materials.
Laminates amongst the pairs C1/C2, D1/D2 and G1/G2 differ only in the presence
of fillers. The difference between C1/C2 and G1/G2 pairs is the ratio of high Tg resin.
Material pair C1/C2 has higher percentage of tetrafunctional high Tg resin than that of
G1/G2. The material type C2 also has a higher percentage of fillers than G2. The rest
of the formulations are same amongst C1/C2 and G1/G2.

15
Table 4: Laminate material classification
Material classification Supplier Material
ID Glass transition temperature (Tg)
Curing agent Fillers Halogen-free
I A No No I B DICY Yes Yes I C1 No No I C2 Yes No II D1 No No II D2 Yes No II E
High Tg (Tg > 165oC) Phenolic
Yes Yes I F DICY Yes Yes I G1 No No I G2 Yes No II H Yes No II I
Mid range Tg (140oC<Tg<165oC) Phenolic
Yes Yes I J No No I K
Low Tg (Tg <140oC) DICY Yes No
Electro dispersive spectroscopy (EDS) analysis of the laminates (shown in Table
5) revealed that the flame retardant used in all the halogen-free materials is a
phosphorous based compound; whereas halogenated materials have brominated
compounds. Also, the EDS analysis showed that the choice of type of fillers and
flame retardants in the laminates varies from supplier to supplier. Halogenated
laminates C2, G2 from supplier I and D2, H from supplier II contain silicon based
fillers (probably SiO2). Halogen-free laminates B, F from supplier I contain silicon
and aluminum based fillers (probably SiO2, Al(OH)3), whereas only laminate E from
supplier II contain silicon and aluminum based fillers. Laminate I do not contain
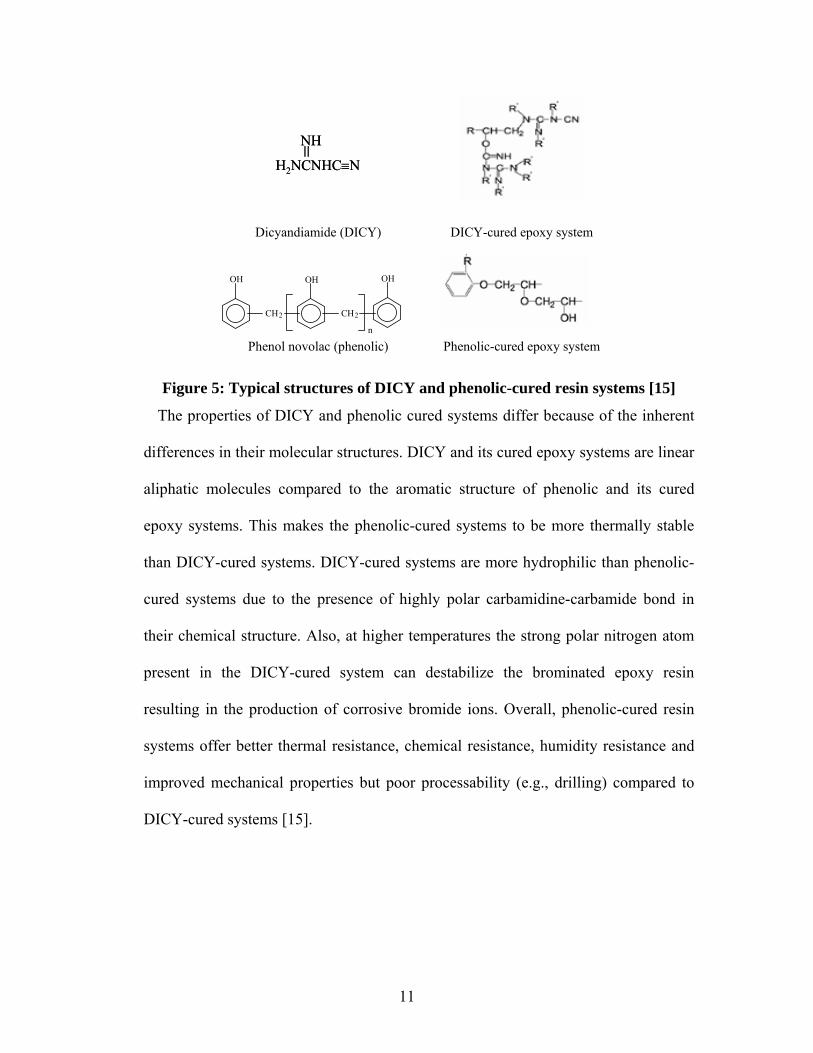
silicon based fillers. Environmental scanning electron microscopy (ESEM) analysis
on the laminates with fillers (shown in Figure 9 for material B) revealed the
microstructure of the filler particles.
16
Table 5: EDS analysis of laminates
Material classification Inorganic elements detected
Supplier Material ID Curing
agent Fillers Halogen- free Br P Si Al
I A DICY No No - - - I B DICY Yes Yes - I C1 Phenolic No No - - - I C2 Phenolic Yes No - - II D1 Phenolic No No - - - II D2 Phenolic Yes No - - II E Phenolic Yes Yes - I F DICY Yes Yes - I G1 Phenolic No No - - - I G2 Phenolic Yes No - - II H Phenolic Yes No - - II I Phenolic Yes Yes - - I J DICY No No - - - I K DICY Yes No - - -
Figure 9: ESEM picture showing filler particles in material B
Filler particles

17
3.2 Material construction
The logistics involved in obtaining the materials for the study is shown in Figure
10. Laminates (cores) from supplier I and II with a nominal thickness of 1.2 mm and
1 oz (0.036 mm) copper cladding were considered for evaluating most of the
properties.
Board fabricator
CALCE
CALCE
3X Reflow 6X Reflow 2X Reflow+1X-WaveControl
Cores and Prepregs Cores(Laminates)
Properties Measurement at CALCE
Supplier I Supplier II
Fabricated boards
Board fabricator
CALCE
CALCE
3X Reflow 6X Reflow 2X Reflow+1X-WaveControl
Cores and Prepregs Cores(Laminates)
Properties Measurement at CALCE
Supplier I Supplier II
Fabricated boards
Figure 10: Flow of test materials
Laminates from supplier I have 6-plies of 7628 glass weave style with a resin
content of 41%, and those from supplier II have 6-plies of 7629 glass weave style.
Some of the property measurements require fabricated boards which were made at
Gold circuit electronics, Taiwan. Fabricated boards consist of 12-layered stack up
(nominal thickness of 2.5 mm, resin content: 53%) with alternative layers of cores
and prepregs of 1080, 2116 and 7628 weave styles. Fabricated boards were available
only for materials A, B, C1, C2, G1, J and they span the range of Tg, curing agents,
flame retardants and fillers. The 6-ply structure of the cores and the 12-layered
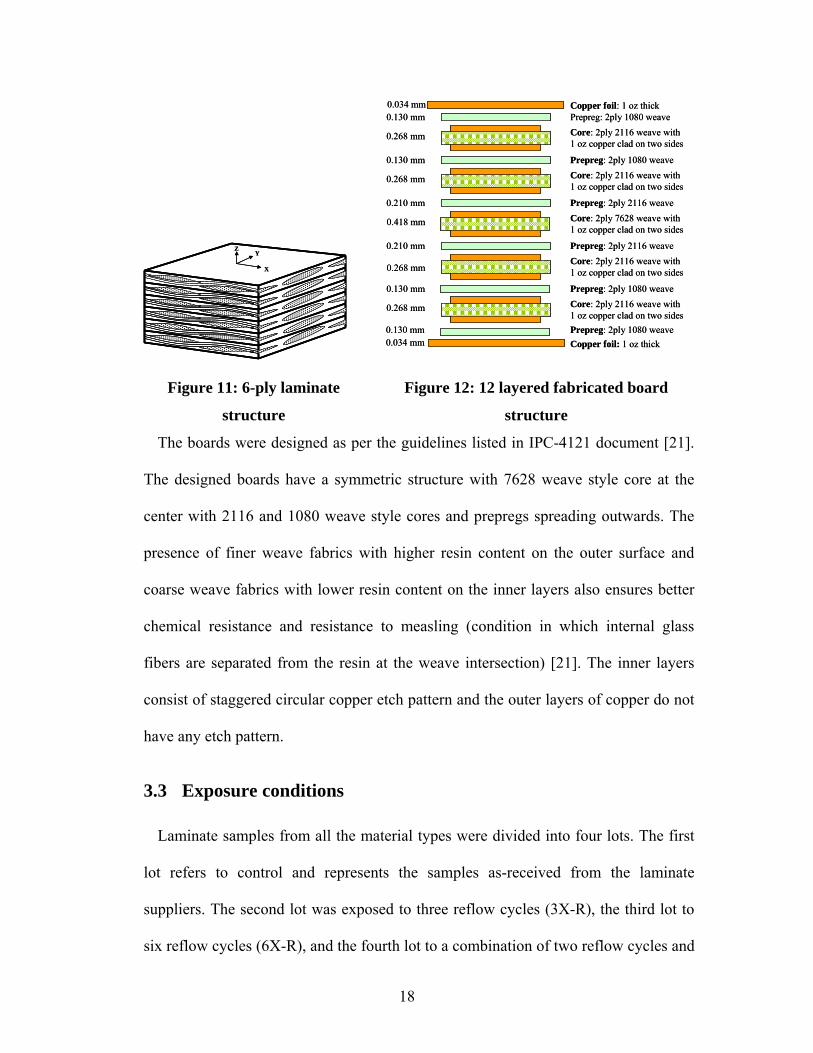
structure of the fabricated boards are represented in Figure 11.
18
X
ZY
X
ZY
Prepreg: 2ply 1080 weaveCore: 2ply 2116 weave with 1 oz copper clad on two sides
Prepreg: 2ply 2116 weaveCore: 2ply 7628 weave with 1 oz copper clad on two sides
Prepreg: 2ply 2116 weave
Core: 2ply 2116 weave with 1 oz copper clad on two sidesPrepreg: 2ply 1080 weave
Copper foil: 1 oz thick
Copper foil: 1 oz thick
0.034 mm
0.130 mm
0.268 mm
0.210 mm
0.418 mm
0.210 mm
0.268 mm
0.130 mm0.034 mm
0.130 mm Prepreg: 2ply 1080 weave
Core: 2ply 2116 weave with 1 oz copper clad on two sides0.268 mm
Core: 2ply 2116 weave with 1 oz copper clad on two sides
0.268 mm
Prepreg: 2ply 1080 weave0.130 mm
Figure 11: 6-ply laminate
structure
Figure 12: 12 layered fabricated board
structure
The boards were designed as per the guidelines listed in IPC-4121 document [21].
The designed boards have a symmetric structure with 7628 weave style core at the
center with 2116 and 1080 weave style cores and prepregs spreading outwards. The
presence of finer weave fabrics with higher resin content on the outer surface and
coarse weave fabrics with lower resin content on the inner layers also ensures better
chemical resistance and resistance to measling (condition in which internal glass
fibers are separated from the resin at the weave intersection) [21]. The inner layers
consist of staggered circular copper etch pattern and the outer layers of copper do not
have any etch pattern.
3.3 Exposure conditions
Laminate samples from all the material types were divided into four lots. The first
lot refers to control and represents the samples as-received from the laminate
suppliers. The second lot was exposed to three reflow cycles (3X-R), the third lot to
six reflow cycles (6X-R), and the fourth lot to a combination of two reflow cycles and
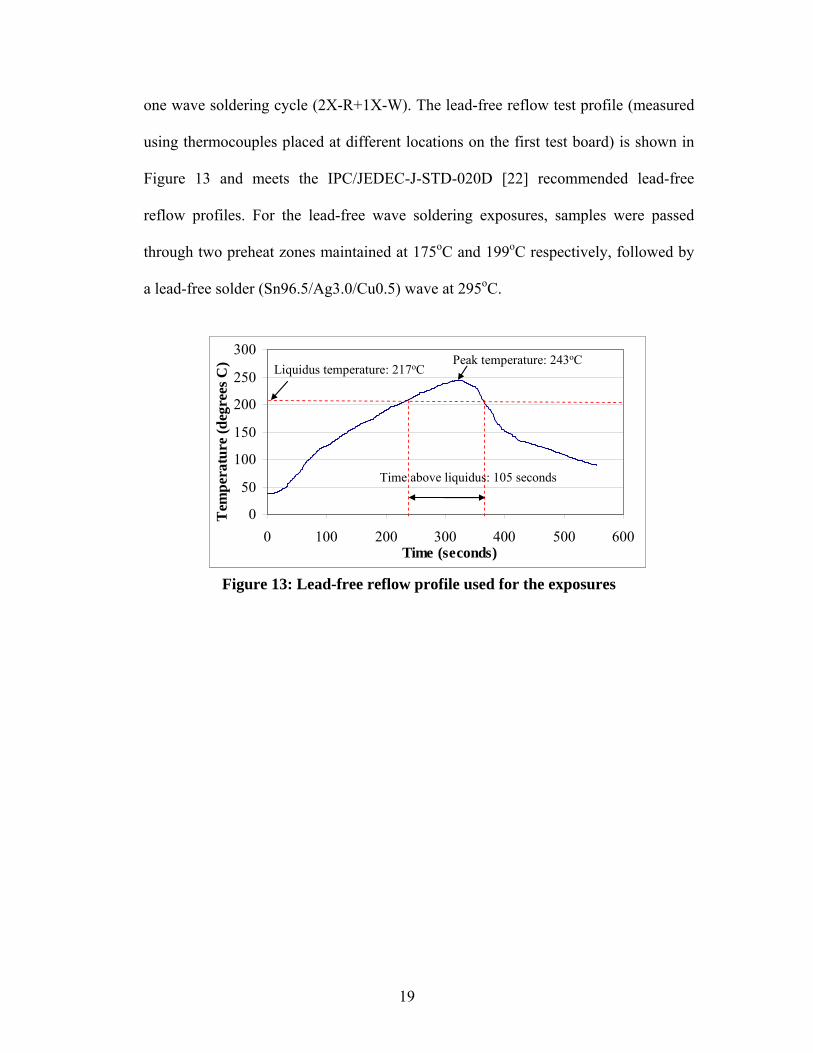
19
one wave soldering cycle (2X-R+1X-W). The lead-free reflow test profile (measured
using thermocouples placed at different locations on the first test board) is shown in
Figure 13 and meets the IPC/JEDEC-J-STD-020D [22] recommended lead-free
reflow profiles. For the lead-free wave soldering exposures, samples were passed
through two preheat zones maintained at 175oC and 199oC respectively, followed by
a lead-free solder (Sn96.5/Ag3.0/Cu0.5) wave at 295oC.
0
50
100
150
200
250
300
0 100 200 300 400 500 600Time (seconds)
Tem
pera
ture
(deg
rees
C) Liquidus temperature: 217oC
Time above liquidus: 105 seconds
Peak temperature: 243oC
0
50
100
150
200
250
300
0 100 200 300 400 500 600Time (seconds)
Tem
pera
ture
(deg
rees
C) Liquidus temperature: 217oC
Time above liquidus: 105 seconds
Peak temperature: 243oC
Figure 13: Lead-free reflow profile used for the exposures

20
Chapter 4: Material Properties and Test Methods
The key thermomechanical, physical, and chemical properties of the PCB laminates
considered for evaluation and the corresponding test methods are listed in Table 6.
Previous studies ([5], [6], [8], [10]) have identified the properties of Tg, CTE, Td, and
T-260 as some of the primary metrics in assessing the lead-free process compatibility
of laminates.
Table 6: Material properties and test methods
Property Unit Test method Equipment
Glass transition temperature (Tg) oC IPC-TM-650
2.4.25 Differential scanning calorimeter (DSC)
Coefficient of thermal expansion (CTE) (out-of-plane, in-plane) ppm/oC
IPC-TM-650 2.4.24 Thermo mechanical analyzer (TMA)
Decomposition temperature (Td) oC IPC-TM-650
2.4.24.6 Thermo gravimetric analyzer (TGA)
Time-to-delamination (T-260) min IPC-TM-650 2.4.24.1 Thermo mechanical analyzer (TMA)
Water absorption % IPC-TM-650 2.6.2.1 Micro-balance
Flammability sec UL 94 (V-0) Bunsen burner and gas supply
4.1 Glass transition temperature (Tg)
Glass transition temperature (Tg) of a resin system is the temperature at which
material transforms from rigid and glass like state to a rubbery and compliant state
due to the reversible breakage of Van der Waals bonds between the polymer
molecular chains. The Tg of a FR-4 laminate system primarily depends on the type of
the epoxy resin and its percentage composition. Material properties such as

21
coefficient of thermal expansion, Young’s modulus, heat capacity, and dielectric
constant undergo a change around Tg.
The Tg of laminates was measured using Perkin-Elmer differential scanning
calorimeter (Pyris 1 DSC) as per IPC-TM-650 2.4.25 test method [23]. The test
equipment with the sample and reference containers is shown in Figure 14.
Two samples weighing between 15-30 mg were used for the measurements. Copper
cladding was etched from the samples using sodium persulphate solution. Samples
were then baked at 105oC for 2 hours and cooled to room temperature in a dessicator
prior to the measurements. Samples were subjected to a temperature scan of 25°C to
220°C at a ramp rate of 20oC/min, and Tg was identified as the midpoint of step
transition in the DSC measurement plot. The representative glass transition
temperature measurement plot is shown in Figure 15.
Sample container
Reference container
Display
Figure 14: Perkin Elmer DSC
Sample and reference containers

22
27
28
29
30
31
32
50 70 90 110 130 150 170 190 210Temperature (degrees C)
Hea
t flo
w (m
W)
Glass transition temperature = 137.6oC
27
28
29
30
31
32
50 70 90 110 130 150 170 190 210Temperature (degrees C)
Hea
t flo
w (m
W)
Glass transition temperature = 137.6oC
Figure 15: Glass transition temperature measurement plot (material J)
4.2 Coefficient of thermal expansion (CTE)
Coefficient of thermal expansion (CTE) of a laminate is the fractional change of
linear dimensions with temperature. Out-of-plane CTE influences failure mechanisms
such as barrel cracking and delamination, whereas in-plane CTE in warp and fill
directions affects shear failures of solder joints.
CTE of laminate materials in out-of-plane and in-plane directions were measured
using Perkin-Elmer thermomechanical analyzer (Pyris TMA 7) as per IPC-TM-650
2.4.24 test method [24]. The test equipment used for the measurement is shown in
Figure 16.
Two samples of 7 mm x 7 mm size were used for the measurements. Copper
cladding was etched and the samples were baked at 105oC for 2 hours followed by
cooling to room temperature in a dessicator prior to the measurements. Samples were
subjected to a temperature scan of 25oC to 250oC at 10oC/minute ramp rate for out-of-
plane CTE measurements, and 25oC to 220oC at 10oC/minute ramp rate for in-plane
CTE measurements. The Tg was identified as the temperature at which slope of the

23
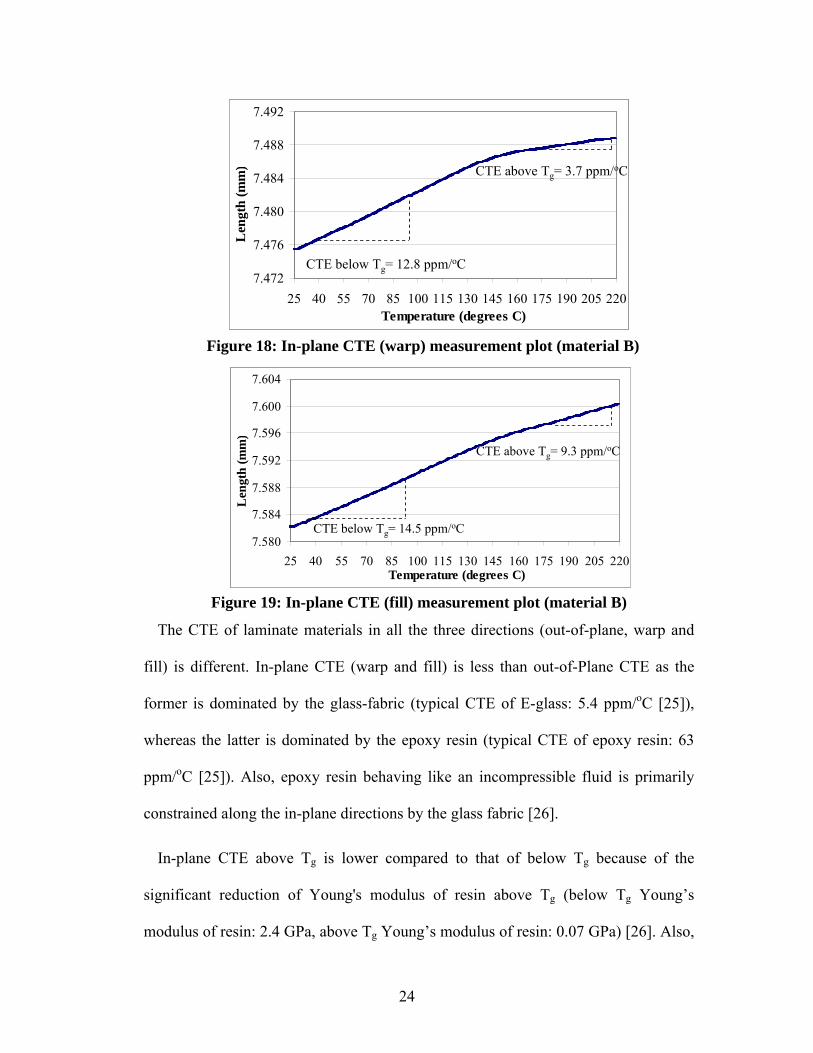
TMA measurement plot change, and CTE was measured below and above Tg. The
representative out-of-plane and in-plane CTE (warp/fill) measurement plots are
shown in Figure 17 to Figure 19.
Figure 16: Perkin Elmer TMA
Sample placement
1.225
1.230
1.235
1.240
1.245
1.250
1.255
1.260
25 40 55 70 85 100 115 130 145 160 175 190 205 220 235 250Temperature (degrees C)
Len
gth
(mm
)
CTE below Tg = 41.1 ppm/oC
CTE above Tg = 153.8 ppm/oC
1.225
1.230
1.235
1.240
1.245
1.250
1.255
1.260
25 40 55 70 85 100 115 130 145 160 175 190 205 220 235 250Temperature (degrees C)
Len
gth
(mm
)
CTE below Tg = 41.1 ppm/oC
CTE above Tg = 153.8 ppm/oC
Figure 17: Out-of-plane CTE measurement plot (material B)
Glass probe
Furnace
Sample
24
7.472
7.476
7.480
7.484
7.488
7.492
25 40 55 70 85 100 115 130 145 160 175 190 205 220Temperature (degrees C)
Len
gth
(mm
)
CTE below Tg= 12.8 ppm/oC
CTE above Tg= 3.7 ppm/oC
7.472
7.476
7.480
7.484
7.488
7.492
25 40 55 70 85 100 115 130 145 160 175 190 205 220Temperature (degrees C)
Len
gth
(mm
)
CTE below Tg= 12.8 ppm/oC
CTE above Tg= 3.7 ppm/oC
Figure 18: In-plane CTE (warp) measurement plot (material B)
7.580
7.584
7.588
7.592
7.596
7.600
7.604
25 40 55 70 85 100 115 130 145 160 175 190 205 220Temperature (degrees C)
Len
gth
(mm
)
CTE below Tg= 14.5 ppm/oC
CTE above Tg= 9.3 ppm/oC
7.580
7.584
7.588
7.592
7.596
7.600
7.604
25 40 55 70 85 100 115 130 145 160 175 190 205 220Temperature (degrees C)
Len
gth
(mm
)
CTE below Tg= 14.5 ppm/oC
CTE above Tg= 9.3 ppm/oC
Figure 19: In-plane CTE (fill) measurement plot (material B)
The CTE of laminate materials in all the three directions (out-of-plane, warp and
fill) is different. In-plane CTE (warp and fill) is less than out-of-Plane CTE as the
former is dominated by the glass-fabric (typical CTE of E-glass: 5.4 ppm/oC [25]),
whereas the latter is dominated by the epoxy resin (typical CTE of epoxy resin: 63
ppm/oC [25]). Also, epoxy resin behaving like an incompressible fluid is primarily
constrained along the in-plane directions by the glass fabric [26].
In-plane CTE above Tg is lower compared to that of below Tg because of the
significant reduction of Young's modulus of resin above Tg (below Tg Young’s
modulus of resin: 2.4 GPa, above Tg Young’s modulus of resin: 0.07 GPa) [26]. Also,

25
epoxy acting as incompressible liquid when expanding along out-of-plane direction
shrinks in the warp and fill directions. As the expansion rate along out-of-plane
significantly increases above Tg, this may result in a reduction of above Tg in-plane
CTE.
Difference between above Tg in-plane CTE and below Tg in-plane CTE along warp
direction is higher than that along fill direction [27]. Changes in the tension and
spacing of the warp and fill fiber bundles during weaving result in varying degrees of
flexibility and hence different properties along the two directions [14].
4.3 Decomposition temperature (Td)
Decomposition temperature (Td) is the temperature at which a resin system
irreversibly undergoes physical and chemical degradation with thermal destruction of
cross-links, resulting in weight loss of the material.
The Td of laminates was measured using Shimadzu thermogravimetric analyzer
(Shimadzu TGA 50) as per IPC-TM-650 2.4.24.6 test method [28]. The equipment
used for the measurement is shown in Figure 20.
Figure 20: Shimadzu TGA 50
Furnace
Weight balance mechanism

26
One test specimen from each material type weighing between 8-20 mg was used for
the measurement. Copper cladding was etched and the samples were baked at 110oC
for 24 hours followed by cooling to room temperature in a dessicator prior to the
measurement. Sample was subjected to a temperature scan of 25oC to 400oC at a
ramp rate of 10oC/minute in an inert nitrogen atmosphere (purged at 50 ml/minute).
The change in weight of the sample was obtained as a function of temperature, and Td
was recorded at 2% and 5% weight loss (compared to sample weight at 50oC as per
the test method). The representative decomposition temperature measurement plot is
shown in Figure 21.
75
80
85
90
95
100
0 50 100 150 200 250 300 350 400Temperature (degrees C)
% w
eigh
t
Td at 2% weight loss
Td at 5% weight loss
75
80
85
90
95
100
0 50 100 150 200 250 300 350 400Temperature (degrees C)
% w
eigh
t
Td at 2% weight loss
Td at 5% weight loss
Figure 21: Decomposition temperature measurement plot (material F)
4.4 Time-to-delamination (T-260)
Time-to-delamination is the time taken by a laminate material to delaminate
(separation between layers of prepregs and copper clad cores in a multilayered
structure), when exposed to a constant temperature. Due to lead-free soldering
process reaching peak temperatures of around 260oC, time-to-delamination measured
at 260oC (T-260) is being used as a metric for assessing lead-free process

27
compatibility of laminates. It is a measure of the ability of a laminate material to
withstand multiple soldering cycles without delamination.
The T-260 of fabricated boards was measured using Perkin-Elmer
thermomechanical analyzer (Pyris TMA 7) as per IPC-TM-650 2.4.24.1 test method
[29]. Two samples of 7 mm x 7 mm size were used for the measurements. Samples
were baked at 105oC for 2 hours and then cooled to room temperature in a dessicator
prior to the measurements. Samples were then subjected to a temperature scan of
25oC to 260oC at 10oC/minute ramp rate and held at 260oC until an irreversible
change in thickness (assumed to be caused by layer to layer delamination) of the
sample was observed. The test was terminated at 60 minutes for the laminate
materials that did not delaminate until then. Time-to-delamination was determined as
the time between onset of isotherm (260oC) and the onset of delamination. The
representative T-260 measurement plot is shown in Figure 22.
2.28
2.30
2.32
2.34
2.36
2.38
2.40
2.42
0 5 10 15 20 25 30 35Time (minutes)
Thi
ckne
ss (m
m)
3.6 minutes
Onset of isotherm (260oC)
Onset of delamination
2.28
2.30
2.32
2.34
2.36
2.38
2.40
2.42
0 5 10 15 20 25 30 35Time (minutes)
Thi
ckne
ss (m
m)
3.6 minutes
Onset of isotherm (260oC)
Onset of delamination
Figure 22: T-260 measurement plot (material B)

28
4.5 Water absorption
Water absorption is a measure of the amount of water absorbed by laminate
materials when immersed in distilled water for 24 hours at room temperature. Water
absorption of the laminates was measured as per IPC-TM-650 2.6.2.1 test method
[30].
Three samples of 50 mm x 50 mm size were used for the measurements. Copper
cladding was etched and the samples were baked at 105oC for 1 hour followed by
cooling to room temperature in a dessicator prior to the measurements. Samples were
weighed using microbalance before and after immersion in distilled water for 24
hours and percentage water absorption was calculated by the following expression:.
4.6 Flammability
Flammability is a measure of the material’s tendency to extinguish the flame once
the specimen has been ignited and separated from the flame source. FR-4 PCB
laminates, being plastics, are inherently flammable and flame retardants are added to
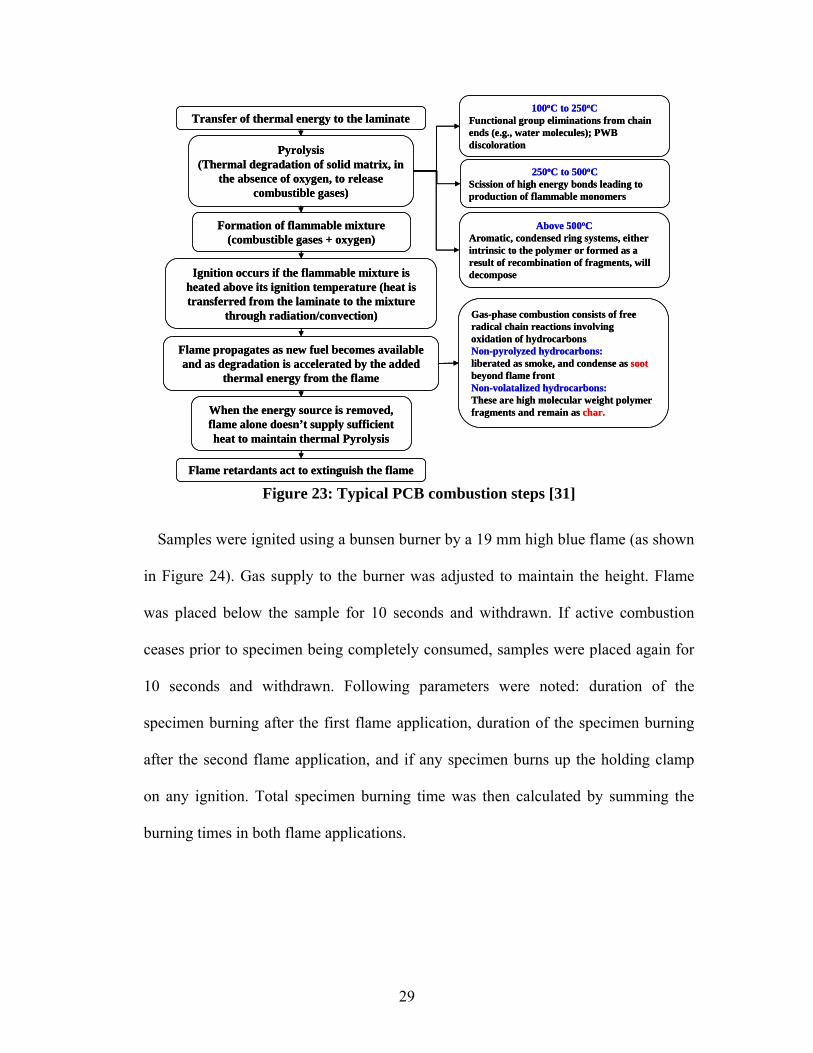
the resin system in order to enhance their self-extinguishing property. Typical steps
involved in a PCB combustion process are shown in Figure 23.
The flammability of laminates was measured as per UL 94 test method [32]. Five
specimens per material type were cut into sizes of 127 mm x 12.7 mm. Copper
cladding was etched and the samples were conditioned at 25oC, 50% relative
humidity for 48 hours prior to testing.
100 weightdConditione
weightdConditioneWet weightabsorptionWater % ×−
=
29
Transfer of thermal energy to the laminate
Pyrolysis (Thermal degradation of solid matrix, in
the absence of oxygen, to release combustible gases)
100oC to 250oCFunctional group eliminations from chain ends (e.g., water molecules); PWB discoloration
250oC to 500oCScission of high energy bonds leading to production of flammable monomers
Formation of flammable mixture (combustible gases + oxygen)
Ignition occurs if the flammable mixture is heated above its ignition temperature (heat is transferred from the laminate to the mixture
through radiation/convection)
Flame propagates as new fuel becomes available and as degradation is accelerated by the added
thermal energy from the flame
When the energy source is removed, flame alone doesn’t supply sufficient heat to maintain thermal Pyrolysis
Flame retardants act to extinguish the flame
Gas-phase combustion consists of free radical chain reactions involving oxidation of hydrocarbonsNon-pyrolyzed hydrocarbons:liberated as smoke, and condense as soot beyond flame frontNon-volatalized hydrocarbons:These are high molecular weight polymer fragments and remain as char.
Above 500oCAromatic, condensed ring systems, either intrinsic to the polymer or formed as a result of recombination of fragments, will decompose
Figure 23: Typical PCB combustion steps [31]
Samples were ignited using a bunsen burner by a 19 mm high blue flame (as shown
in Figure 24). Gas supply to the burner was adjusted to maintain the height. Flame
was placed below the sample for 10 seconds and withdrawn. If active combustion
ceases prior to specimen being completely consumed, samples were placed again for
10 seconds and withdrawn. Following parameters were noted: duration of the
specimen burning after the first flame application, duration of the specimen burning
after the second flame application, and if any specimen burns up the holding clamp
on any ignition. Total specimen burning time was then calculated by summing the
burning times in both flame applications.

30
19 mm
9.5 mm
Laminate
Bunsen burner
127 mm
12.7 mm
Clamp 6.4 mm
19 mm
9.5 mm
Laminate
Bunsen burner
127 mm
12.7 mm
Clamp
19 mm
9.5 mm
Laminate
Bunsen burner
127 mm
12.7 mm
Clamp 6.4 mm
Figure 24: Test set up for flammability measurements
The test results were compared against UL 94 V-0 flammability criteria, according
to which, the time of burning per specimen after either flame application should not
be greater than 10 seconds, and total burning time for the 10 flame applications for
each set of 5 specimens should not be greater than 50 seconds.
31
Chapter 5: Results and Discussion
In all the properties considered, pre-exposure measurement results were used to
characterize the laminate materials. The laminate material data sheet values are listed
in Appendix I. In the following subsections, the effects of laminate material
constituents (such as curing agent, fillers, and flame retardant) in relationship to
changes in the material properties due to lead-free soldering exposures are discussed.
5.1 Glass transition temperature (Tg)
The pre and post-exposure Tg measurement results were grouped by material (e.g.,
A, B, C1) as shown in Figure 25. Under each material group the results of four sets of
data are represented. The first set of data points shown in each group corresponds to
the results of control samples, the second set to 3X reflowed samples, the third set to
6X reflowed samples, and the fourth set to the samples that were exposed to a
combination of 2X reflow and 1X wave soldering cycles. This pattern of data
representation is followed in all the properties except time-to-delamination and
flammability. The materials that underwent a mean-to-mean variation of greater than
5oC in Tg after the exposures are highlighted in Figure 25.
The control sample results show to have a similar Tg range for the laminates,
irrespective of the type of curing agent, the type of flame retardant, and the presence
of fillers. For example, materials A to E have a Tg range of 165oC to 180oC even
though they differ by the material constituents. The Tg of a laminate system primarily
depends on the type of epoxy (bi, tetra or multi-functional) and its percentage

32
composition. Higher cross-linking density in the multi-functional epoxy systems
compared to their bi-functional counterparts results in a higher Tg.
130135140145150155160165170175180185
Gla
ss tr
ansit
ion
tem
pera
ture
(deg
rees
C)
A C1 D1 D2C2B G1 G2 H I J KHigh Tg Mid Tg Low Tg
FE130135140145150155160165170175180185
Gla
ss tr
ansit
ion
tem
pera
ture
(deg
rees
C)
A C1 D1 D2C2B G1 G2 H I J KHigh Tg Mid Tg Low Tg
FEA C1 D1 D2C2B G1 G2 H I J KHigh Tg Mid Tg Low Tg
FE
Figure 25: Effect of lead-free soldering exposures on Tg of the laminates
The post-exposure results show that five out of seven high Tg and four out of five
mid Tg materials have relatively stable Tg with a variation of less than 5oC. All of
these are phenolic-cured materials. The materials (A, B, F, J and K) that underwent a
mean-to-mean variation in Tg of greater than 5oC are all DICY-cured. A decrease in
Tg was observed in high and mid Tg DICY-cured materials, whereas an increase in Tg
was observed in low Tg DICY-cured materials. The highest variation in Tg (a
reduction of about 20oC from control) was observed in the high Tg DICY-cured
halogen-free material (B).
The Tg of laminates was also obtained from the coefficient of thermal expansion
measurement plots by TMA. The Tg comparison between DSC and TMA is shown in
Table 7. The difference in Tg values between DSC and TMA methods is due to the
difference in measurement method. In DSC, the midpoint of transition in heat

33
capacity is taken as Tg, whereas in TMA the point at which slopes of CTE plot
change is taken as Tg.
Table 7: The Tg comparison between DSC and TMA methods
Control 3X Reflow 6X Reflow 2X-R+1X-W # Datasheet DSC TMA DSC TMA DSC TMA DSC TMA
A 165-175 (DSC) 170.1 172.0 166.3 171.8 163.2 163.7 167.5 159.8
B 165-175 (DSC) 170.3 160.0 159.7 158.0 154.9 154.9 151.1 151.3
C1 165-175 (DSC) 170.1 167.6 168.0 163.8 166.6 163.9 170.4 165.8
C2 165-175 (DSC) 168.5 167.1 163.8 166.3 164.2 168.5 164.7 161.1
D1 173-183 (DSC) 174.4 152.9 176.6 162.0 178.9 163.8 178.8 165.3
D2 170-175 (DSC) 171.1 163.8 166.9 161.8 169.5 163.9 167.8 158.6
E 170-180 (TMA) 172.2 170.3 172.8 167.4 175.4 165.7 174.1 165.4
F 145-155 (DSC) 152.2 157.1 152.8 151.5 143.3 147.7 137.9 145.4
G1 150-160 (DSC) 150.3 156.3 149.0 149.8 152.1 152.1 147.7 153.0
G2 145-155 (DSC) 147.4 156.0 148.6 153.4 147.8 151.7 146.9 148.7
H 135-145 (DSC) 148.1 149.2 151.7 146.9 145.7 148.6 149.2 146.8
I 140-150 (TMA) 152.0 138.1 153.2 138.1 150.8 134.5 152.4 137.2
J 135-145 (TMA) 135.4 137.2 138.0 144.2 140.3 141.2 140.9 137.0
K 175-185 (DMA) 134.2 136.2 140.2 139.5 138.0 139.8 139.2 136.7
5.2 Coefficient of thermal expansion (CTE)
The out-of-plane CTE (below and above Tg) measurement results are shown in
Figure 26. The materials that underwent a mean-to-mean variation of greater than
15% in (above Tg) CTE after the exposures are highlighted in the figure.

34
20406080
100120140160180200220240260
CT
E (p
pm/d
egre
es C
)
Above TgBelow Tg
A C1 D1 D2C2B G1 G2 H I J KHigh Tg Mid Tg Low Tg
FE20406080
100120140160180200220240260
CT
E (p
pm/d
egre
es C
)
Above TgBelow Tg
A C1 D1 D2C2B G1 G2 H I J KHigh Tg Mid Tg Low Tg
FE
Figure 26: Effect of lead-free soldering exposures on out-of-plane CTE of the
laminates
The control results show that high Tg material (A) has lower CTE compared to a
low Tg material (J) with similar constituents (DICY-cured with halogenated flame
retardant). This is because of the higher cross-linking density in the epoxy resin
system of high Tg materials that resists the thermal expansion of the laminate. DICY
and phenolic-cured materials have similar CTE range (A vs. C1). Filled materials
have lower CTE values compared to unfilled materials (C2 vs. C1, D2 vs. D1, G2 vs.
G1), as fillers replace the epoxy in filled materials. Halogen-free materials have lower
CTE values than halogenated materials (B vs. A, I vs. H). This could be because of
the combined effect of presence of fillers and material chemistry of halogen-free
laminates that typically result in lower CTE values than the halogenated laminates
[10].
The post-exposure results show a reduction of out-of-plane CTE in most of the
materials, with a highest reduction of approximately 25% observed in the above Tg

35
CTE of material B. The reduction in CTE could be due to further curing of the resin
system, resulting in an increase in the cross-linking density.
The control in-plane (warp and fill) CTE measurements were performed on all the
materials and the results are shown in Table 8. The post-exposure measurements were
performed on six materials A, B, C1, F, G2 and J (shown in Table 9 and Table 10) as
similar CTE values were observed in all the materials irrespective of the type of
curing agent, flame retardant and presence of fillers. Post-exposure in-plane CTE
results did not show noticeable variation.
Table 8: Control in-plane (warp and fill) CTE measurement results
Material classification Warp Fill Supplier Material
ID Curing agent Fillers Halogen-
free Below
Tg Above
Tg Below
Tg Above
Tg I A DICY No No 11.8±0.2 1.1±0.1 15.4±0.5 7.9±1.4 I B DICY Yes Yes 12.2±0.7 2.7±1.0 14.8±0.3 9.8±0.5 I C1 Phenolic No No 13.4±1.5 4.3±1.1 16.3±0.5 12.2±0.7 I C2 Phenolic Yes No 12.6±0.5 3.9±0.7 14.6±0.5 11.6±0.5 II D1 Phenolic No No 14.7±2.3 3.3±0.6 16.9±1.5 11.3±1.0 II D2 Phenolic Yes No 13.4±0.9 3.9±1.1 18.9±1.4 13.4±0.8 II E Phenolic Yes Yes 15.2±1.5 3.2±0.6 16.2±0.8 9.5±0.5 I F DICY Yes Yes 12.1±0.8 4.9±1.0 16.8±1.9 10.6±0.5 I G1 Phenolic No No 13.1±0.7 2.0±0.2 15.2±0.8 10.4±1.2 I G2 Phenolic Yes No 15.2±2.7 3.5±2.5 14.6±0.4 10.9±0.8 II H Phenolic Yes No 14.1±0.8 4.2±0.2 18.8±1.2 13.5±2.4 II I Phenolic Yes Yes 17.9±1.2 3.1±0.9 17.8±1.2 7.9±0.3 I J DICY No No 12.1±0.5 2.2±1.1 14.9±0.5 10.2±1.8 I K DICY Yes No 13.0±1.1 2.8±0.4 15.7±0.3 10.8±0.1
Table 9: Post exposure in-plane (warp) CTE measurement results
Control 3X Reflow 6X Reflow 2X R+ 1X wave Material
ID Below Tg
Above Tg
Below Tg
Above Tg
Below Tg
Above Tg
Below Tg
Above Tg
A 11.8±0.2 1.1±0.1 14.1±0.1 1.4±0.2 13.7±1.5 0.9±0.1 15.3±1.3 1.8±0.5 B 12.2±0.7 2.7±1.0 13.5±1.1 3.4±0.8 12.9±3.1 2.1±0.6 14.8±2.7 3.2±1.5
C1 13.4±1.5 4.3±1.1 15.7±1.1 3.5±0.9 13.6±2.7 4.5±1.7 15.2±1.9 3.8±0.9 F 12.1±0.8 4.9±1.0 15.9±1.8 2.2±1.9 13.6±2.4 1.8±0.7 11.2±1.5 2.4±0.5
G2 15.2±2.7 3.5±2.5 13.3±1.3 4.2±1.1 16.3±2.1 3.8±0.9 12.3±0.8 2.3±1.1 J 12.1±0.5 2.2±1.1 14.9±2.3 4.9±2.8 13.6±1.7 2.6±1.3 12.7±1.9 4.5±2.1

36
Table 10: Post exposure in-plane (fill) CTE measurement results
Control 3X Reflow 6X Reflow 2X R+ 1X wave Material
ID Below Tg
Above Tg
Below Tg
Above Tg
Below Tg
Above Tg
Below Tg
Above Tg
A 15.4±0.5 7.9±1.4 14.2±1.1 9.1±0.7 16.3±1.6 8.7±0.7 15.9±1.1 8.6±0.4 B 14.8±0.3 9.8±0.5 16.8±1.2 8.6±1.3 15.1±0.9 9.1±1.4 15.2±0.4 8.4±0.9
C1 16.3±0.5 12.2±0.7 15.7±0.2 11.8±0.2 15.1±1.6 10.6±0.9 15.3±1.2 11.1±1.0 F 16.8±1.9 10.6±0.5 15.1±0.8 9.8±0.3 15.9±1.1 9.1±1.5 16.7±0.7 11.6±0.2
G2 14.6±0.4 10.9±0.8 15.7±1.5 10.1±1.2 13.1±0.9 8.8±0.8 15.1±1.0 9.9±1.1 J 14.9±0.5 10.2±1.8 13.1±1.2 9.1±0.7 14.1±1.9 10.1±1.5 16.8±1.4 11.2±0.5
5.3 Decomposition temperature (Td)
The decomposition temperature measurement results corresponding to 2% and 5%
weight loss are plotted in Figure 27. Lead-free soldering exposures did not show
noticeable variation in Td (>10oC), and hence no materials are highlighted in the
figure.
310
320
330
340
350
360
370
380
390
Dec
ompo
sitio
n te
mpe
ratu
re (d
egre
es C
)
Td (2% weight loss)
Td (5% weight loss)
A C1 D1 D2C2B G1 G2 H I J K
High Tg Mid Tg Low Tg
FE310
320
330
340
350
360
370
380
390
Dec
ompo
sitio
n te
mpe
ratu
re (d
egre
es C
)
Td (2% weight loss)
Td (5% weight loss)
A C1 D1 D2C2B G1 G2 H I J K
High Tg Mid Tg Low Tg
FE
Figure 27: Effect of lead-free soldering exposures on Td of the laminates
The control measurement results show that low Tg material (J) has higher Td
compared to high Tg material (A) with similar constituents [8]. The comparison of
degradation behavior between materials A and J is plotted in Figure 28.

37
707580859095
100105110
25 75 125 175 225 275 325 375Temperature (degrees C)
% W
eigh
t
High Tg (A)Low Tg (J)
Low Tg (J)
High Tg (A)
707580859095
100105110
25 75 125 175 225 275 325 375Temperature (degrees C)
% W
eigh
t
High Tg (A)Low Tg (J)
Low Tg (J)
High Tg (A)
707580859095
100105110
25 75 125 175 225 275 325 375Temperature (degrees C)
% W
eigh
t
High Tg (A)Low Tg (J)
Low Tg (J)
High Tg (A)
Figure 28: Td comparison between materials A and J
Amongst the halogenated materials, phenolic-cured materials (G1, C1) have higher
Td compared to their DICY-cured counterparts (A, J). The lower decomposition
temperatures in DICY-cured epoxy systems could be attributed to the presence of
linear aliphatic molecular bonds with amine linkages, compared to more thermally
stable aromatic bonds with ether linkages of phenolic-cured systems ([10], [15])
These observations are shown in Figure 29 and Figure 30.
7075
8085
9095
100105
110
25 75 125 175 225 275 325 375Temperature (degrees C)
% W
eigh
t
DICY cured (A)Phenolic cured (G1)
DICY cured (A)
Phenolic cured (G1)
7075
8085
9095
100105
110
25 75 125 175 225 275 325 375Temperature (degrees C)
% W
eigh
t
DICY cured (A)Phenolic cured (G1)
7075
8085
9095
100105
110
25 75 125 175 225 275 325 375Temperature (degrees C)
% W
eigh
t
DICY cured (A)Phenolic cured (G1)
DICY cured (A)
Phenolic cured (G1)
Figure 29: Td comparison between materials A and G1

38
High Tg
High Tg
Low TgLow Tg
High Tg
Mid TgMid Tg
High Tg
290
300
310
320
330
340
350
360
370
380
Dec
ompo
sitio
n te
mpe
ratu
re (d
egre
es C
) J
A
G1 C1
J
A
G1 C1
2% weight loss 5% weight loss
Dicy cured
Phenolic curedHigh Tg
High Tg
Low TgLow Tg
High Tg
Mid TgMid Tg
High Tg
290
300
310
320
330
340
350
360
370
380
Dec
ompo
sitio
n te
mpe
ratu
re (d
egre
es C
) J
A
G1 C1
J
A
G1 C1
2% weight loss 5% weight loss
Dicy cured
Phenolic cured
Figure 30: Effect of type of curing agent on Td of the laminates
Laminates with fillers have lower Td compared to their counterparts without fillers
(C2 vs. C1, D2 vs. D1, G2 vs. G1). Inorganic fillers such as alumina or silica
accelerate the thermal decomposition process by lowering the activation energy
required for decomposition, thereby acting as catalysts ([33], [34], [35]). These
observations are shown in Figure 31 and Figure 32.
70
75
80
85
90
95
100
105
110
25 75 125 175 225 275 325 375Temperature (degrees C)
% W
eigh
t
No fillers (C1)Fillers present (C2)
Fillers present (C2)
No fillers (C1)
70
75
80
85
90
95
100
105
110
25 75 125 175 225 275 325 375Temperature (degrees C)
% W
eigh
t
No fillers (C1)Fillers present (C2)
70
75
80
85
90
95
100
105
110
25 75 125 175 225 275 325 375Temperature (degrees C)
% W
eigh
t
No fillers (C1)Fillers present (C2)
Fillers present (C2)
No fillers (C1)
Figure 31: Td comparison between materials C1 and C2
39
No fillers
Fillers present
310
320
330
340
350
360
370
Dec
ompo
sitio
n te
mpe
ratu
re (d
egre
es C
)
High Tg Midrange Tg Low Tg
C1C2
G1G2
J K
No fillers
Fillers present
310
320
330
340
350
360
370
Dec
ompo
sitio
n te
mpe
ratu
re (d
egre
es C
)
High Tg Midrange Tg Low Tg
C1C2
G1G2
J K
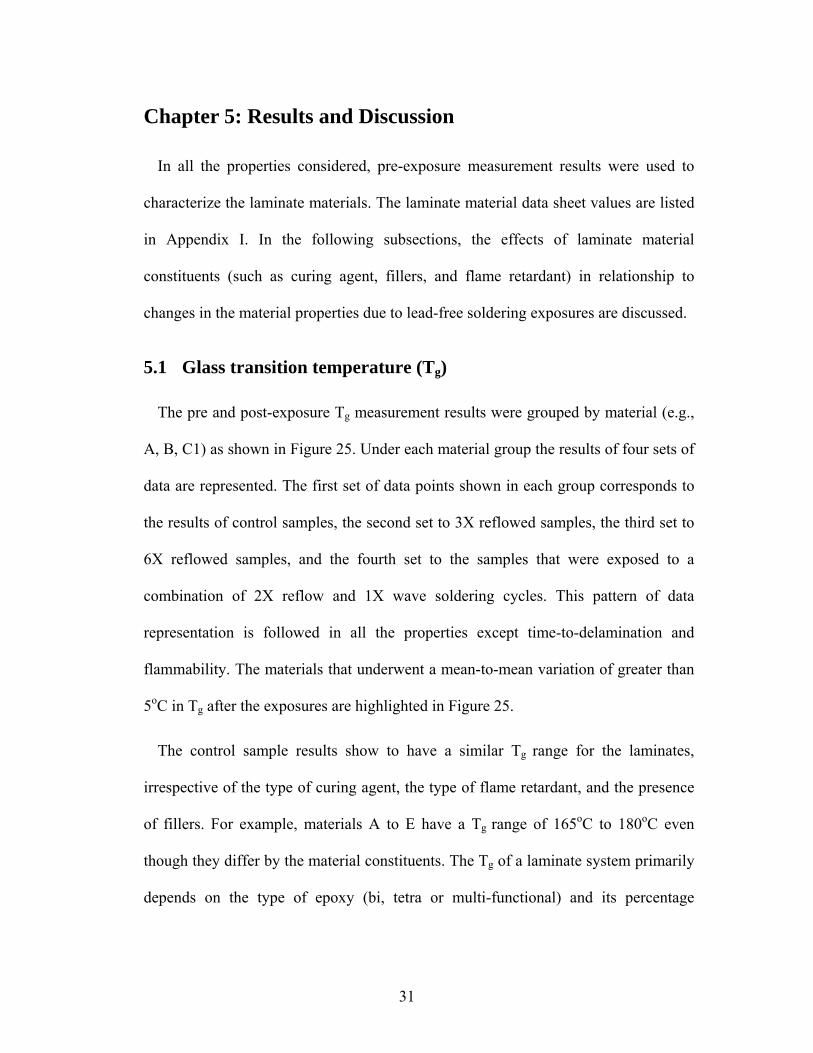
Figure 32: Effect of presence of fillers on Td of the laminates
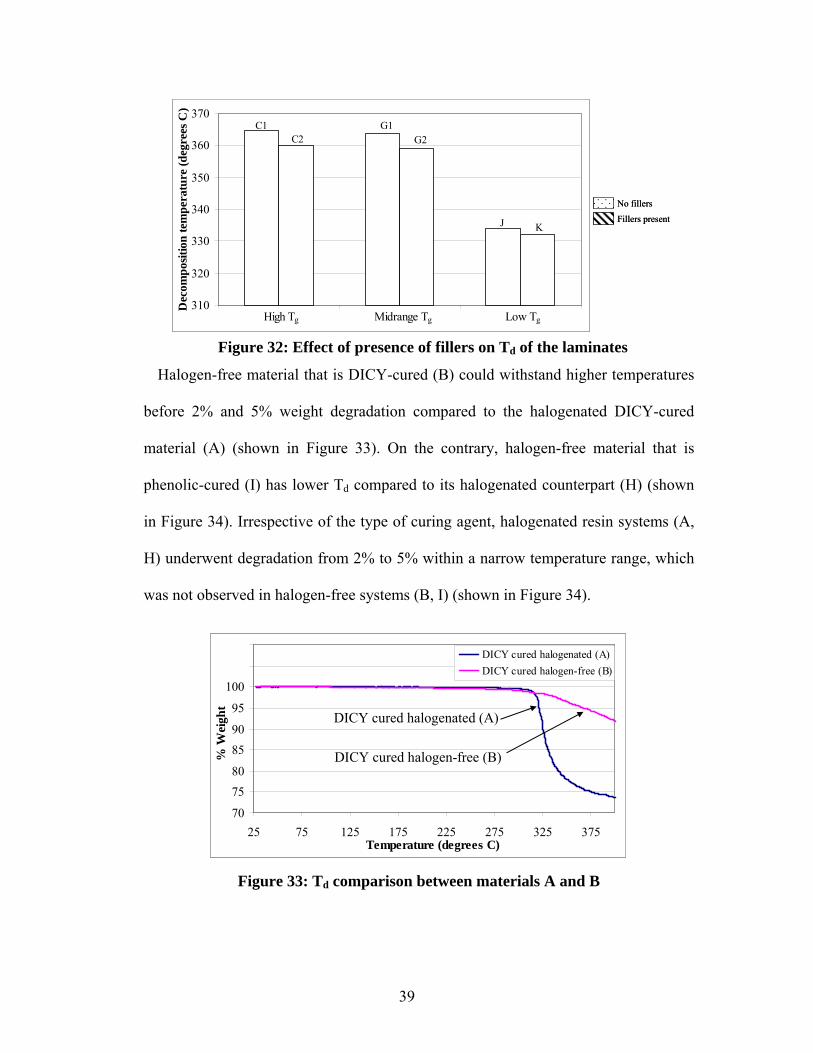
Halogen-free material that is DICY-cured (B) could withstand higher temperatures
before 2% and 5% weight degradation compared to the halogenated DICY-cured
material (A) (shown in Figure 33). On the contrary, halogen-free material that is
phenolic-cured (I) has lower Td compared to its halogenated counterpart (H) (shown
in Figure 34). Irrespective of the type of curing agent, halogenated resin systems (A,
H) underwent degradation from 2% to 5% within a narrow temperature range, which
was not observed in halogen-free systems (B, I) (shown in Figure 34).
70
7580
8590
95
100105
110
25 75 125 175 225 275 325 375Temperature (degrees C)
% W
eigh
t
DICY cured halogenated (A)DICY cured halogen-free (B)
DICY cured halogenated (A)
DICY cured halogen-free (B)
70
7580
8590
95
100105
110
25 75 125 175 225 275 325 375Temperature (degrees C)
% W
eigh
t
DICY cured halogenated (A)DICY cured halogen-free (B)
DICY cured halogenated (A)
DICY cured halogen-free (B)
Figure 33: Td comparison between materials A and B

40
70
7580
85
90
95100
105
110
25 75 125 175 225 275 325 375Temperature (degrees C)
% W
eigh
t
Phenolic cured halogenated (H)Phenolic cured halogen-free (I)
Phenolic cured halogenated (H)Phenolic cured halogen-free (I)
70
7580
85
90
95100
105
110
25 75 125 175 225 275 325 375Temperature (degrees C)
% W
eigh
t
Phenolic cured halogenated (H)Phenolic cured halogen-free (I)
70
7580
85
90
95100
105
110
25 75 125 175 225 275 325 375Temperature (degrees C)
% W
eigh
t
Phenolic cured halogenated (H)Phenolic cured halogen-free (I)
Phenolic cured halogenated (H)Phenolic cured halogen-free (I)
Figure 34: Td comparison between materials H and I
ADicy
ADicy
HPhenolicH
PhenolicB
Dicy
BDicy
IPhenolic
I Phenolic
290
300
310
320
330
340
350
360
370
380
Dec
ompo
sitio
n te
mpe
ratu
re (d
egre
es C
)
Halogen-free
Halogenated
2% weight loss 5% weight loss
ADicy
ADicy
HPhenolicH
PhenolicB
Dicy
BDicy
IPhenolic
I Phenolic
290
300
310
320
330
340
350
360
370
380
Dec
ompo
sitio
n te
mpe
ratu
re (d
egre
es C
)
Halogen-free
Halogenated
2% weight loss 5% weight loss
Figure 35: Effect of type of flame retardant on Td of the laminates
The post-exposure results show a maximum variation of 7oC in decomposition
temperature of the laminates. The effect of material constituents such as curing
agents, fillers, and flame retardants on the decomposition temperatures for the control
samples remained the same after the exposures.
5.4 Time-to-delamination (T-260)
Time-to-delamination was measured for fabricated boards on a subset of materials
i.e., A, B, C1, C2, G1, and J and the results are shown in Figure 36. The order of data
representation under each material is the same as that of Tg results.

41
0.010.020.030.040.050.060.070.080.0
Tim
e-to
-del
amin
atio
n (m
inut
es)
Control
3X-R
6X-R
2X-R+1X-W
A C1 C2B G1 JHigh Tg Mid Tg Low Tg
Time-to-delamination longer than 60 minutes
0.010.020.030.040.050.060.070.080.0
Tim
e-to
-del
amin
atio
n (m
inut
es)
Control
3X-R
6X-R
2X-R+1X-W
A C1 C2B G1 JHigh Tg Mid Tg Low Tg
Time-to-delamination longer than 60 minutes
Figure 36: Effect of lead-free soldering exposures on T-260 of the laminates
The control results show that three materials A, B and J delaminated within 20
minutes whereas materials C1, C2 and G1 did not delaminate for 60 minutes.
Material J has higher T-260 than that of A and B. Thus, DICY-cured materials have
lower time-to-delamination compared to phenolic-cured materials irrespective of their
Tg. Low Tg DICY-cured materials have higher T-260 compared to their high Tg
counterparts. The effect of type of flame retardant and presence of fillers is not as
prominent as that of curing agent.
Lead-free soldering exposures tend to lower the time-to-delamination of materials
A, B, and J all of which are DICY-cured materials. Materials C1, C2 and G1 which
are phenolic-cured did not delaminate below 60 minutes even after exposures.
5.5 Water absorption
The pre and post-exposure water absorption measurement results are shown in
Figure 37. Average and the range of results from the average of three measurements
are plotted. Materials with a variation of greater than 25% in water absorption from
control are shown within separate boxes in Figure 37.
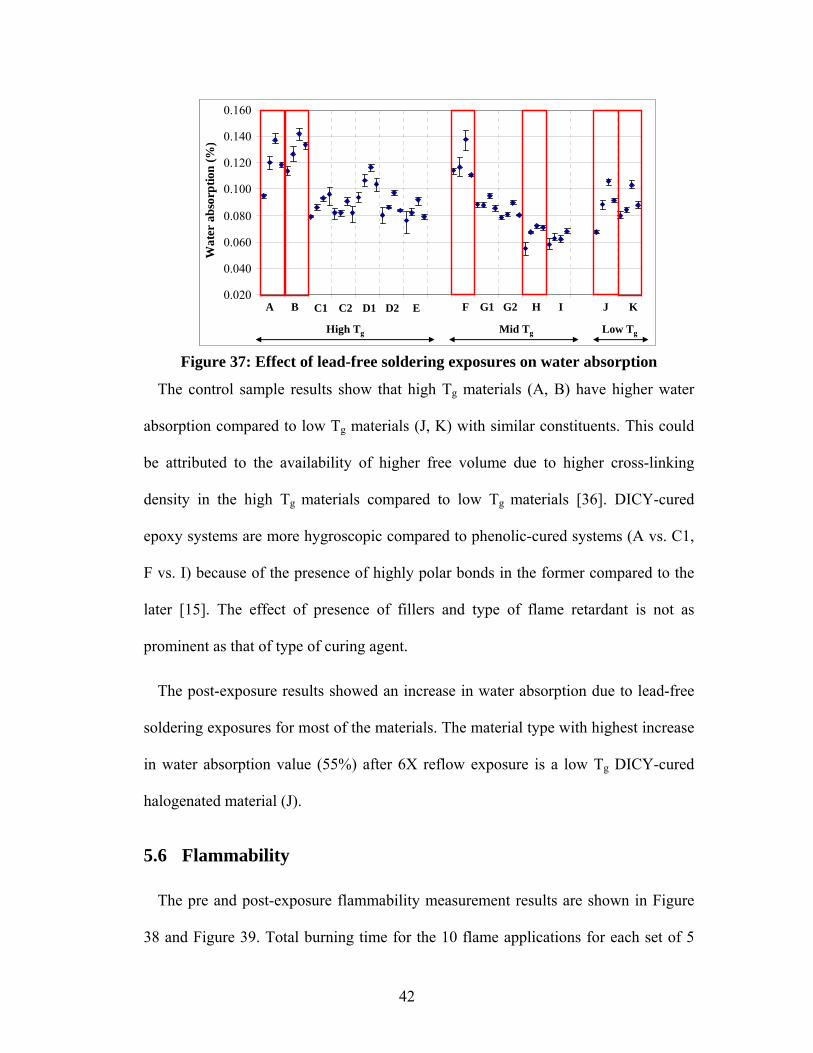
42
0.020
0.040
0.060
0.080
0.100
0.120
0.140
0.160
Wat
er a
bsor
ptio
n (%
)
A C1 D1 D2C2B G1 G2 H I J K
High Tg Mid Tg Low Tg
FE0.020
0.040
0.060
0.080
0.100
0.120
0.140
0.160
Wat
er a
bsor
ptio
n (%
)
A C1 D1 D2C2B G1 G2 H I J K
High Tg Mid Tg Low Tg
FE
Figure 37: Effect of lead-free soldering exposures on water absorption
The control sample results show that high Tg materials (A, B) have higher water
absorption compared to low Tg materials (J, K) with similar constituents. This could
be attributed to the availability of higher free volume due to higher cross-linking
density in the high Tg materials compared to low Tg materials [36]. DICY-cured
epoxy systems are more hygroscopic compared to phenolic-cured systems (A vs. C1,
F vs. I) because of the presence of highly polar bonds in the former compared to the
later [15]. The effect of presence of fillers and type of flame retardant is not as
prominent as that of type of curing agent.
The post-exposure results showed an increase in water absorption due to lead-free
soldering exposures for most of the materials. The material type with highest increase
in water absorption value (55%) after 6X reflow exposure is a low Tg DICY-cured
halogenated material (J).
5.6 Flammability
The pre and post-exposure flammability measurement results are shown in Figure
38 and Figure 39. Total burning time for the 10 flame applications for each set of 5

43
specimens is plotted in Figure 38, whereas average burning time and one standard
deviation is plotted in Figure 39. The UL 94 V-0 flammability criteria i.e., total
burning time for the 10 flame applications for each set of 5 specimens should not be
greater than 50 seconds, is shown in Figure 38.
0
10
20
30
40
50
60
70
80
Tot
al b
urni
ng ti
me
(sec
onds
)
A C1 D1 D2C2B G1 G2 H I J K
High Tg Mid Tg Low Tg
FE
UL 94 V-0 criteria
0
10
20
30
40
50
60
70
80
Tot
al b
urni
ng ti
me
(sec
onds
)
A C1 D1 D2C2B G1 G2 H I J K
High Tg Mid Tg Low Tg
FE
UL 94 V-0 criteria
Figure 38: Effect of lead-free soldering exposures on flammability of the
laminates (total burning time)
0.00
5.00
10.00
15.00
20.00
Ave
rage
bur
ning
tim
e (s
econ
ds)
A C1 D1 D2C2B G1 G2 H I J K
High Tg Mid Tg Low Tg
FE0.00
5.00
10.00
15.00
20.00
Ave
rage
bur
ning
tim
e (s
econ
ds)
A C1 D1 D2C2B G1 G2 H I J K
High Tg Mid Tg Low Tg
FE
Figure 39: Effect of lead-free soldering exposures on flammability of the
laminates (Average burning time)
The control sample results show that UL 94 V-0 flammability criteria are satisfied
by all the samples. The effect of material constituents on the flammability of the
laminates is more prominent in Figure 38 compared to Figure 39. Low Tg material (J)
44
has higher flammability compared to high Tg material (A) with similar constituents.
DICY-cured materials (A, B, F, J, K) have higher burning times compared to
phenolic-cured systems irrespective of Tg, type of flame retardant and presence of
fillers. This could be because of the highly aromatic structure of phenolic-cured
systems that can produce a substantial amount of char which forms a boundary layer
between the flame front and the combustible material reducing the flame propagation
[31]. Also, the flammable mixture of phenolic-cured systems could still contain
higher energy bonds compared to that of DICY-cured systems. The effects of
presence of fillers and type of flame retardant are not as prominent as that of the
curing agent.
The post-exposure measurement results show that samples still meet UL 94 V-0
flammability criteria after lead-free soldering exposures with a common trend of
increase in combustion times observed in most of the materials.

45
Chapter 6: Analysis of Results
The high temperature exposures associated with lead-free soldering resulted in a
noticeable variation in the laminate material properties. The exposures could have
possibly resulted in the cleavage of bonds at the chain ends of the epoxy system
leading to an ‘enhanced-cure’ structure; or resulted in the cleavage of bonds in
polymer backbone leading to a ‘degraded’ structure. The former mechanism results in
an increase in the cross-linking density of the epoxy matrix whereas the later results
in a change in the material structure due to loss of certain functional groups [37], both
of which can potentially change the material properties of laminates. Fourier
transform infrared spectroscopy (FTIR) analysis was performed to verify the possible
degradation in the epoxy structure, and combinatorial analysis of material properties
is performed to verify the enhanced-cure structure.
6.1 Fourier transform infrared (FTIR) spectroscopy analysis
6.1.1 Introduction
Fourier transform infrared (FTIR) spectroscopy is a tool that provides structural
information about the presence of certain functional groups in a material.
Electromagnetic radiation in the infrared (IR) region is directed at the sample which
absorbs (or transmits) the infrared radiation at different frequencies and produces a
unique spectra based on the frequencies at which it absorbs (or transmits) IR, and the
intensity of the absorption (or transmission). The absorption (or transmission) is
shown as a peak in the FTIR spectrum. The wave number corresponding to the peak

46
is an indication of the energy absorbed (or transmitted). Each molecule has its own
distinct quantized vibrational energy level, and hence the wave number which are
related by the following expression.
∆Evib = hc ν , h-Planck’s constant; c- speed of light, ν - wave number
Each wave number depends on several factors such as mass of the atoms, force
constants of the bonds, and geometry of the molecules. The absorbed energy of
infrared radiation is converted into atomic bond vibrations. Different types of
molecular bending movements are shown in Figure 40.
Figure 40: Common molecular bending movements [38]
The atomic vibrations are classified as either stretching or bending. Stretching
vibrations are categorized as being either symmetrical (movement in the same
direction) or asymmetrical (movement in opposite directions). Bending vibrations are
classified as scissoring, rocking, twisting, or wagging.
47
6.1.2 Analysis
FTIR analysis is performed on the laminates to identify the key functional groups
in the material systems and investigate their possible changes due to lead-free
soldering exposures, and correlate the compositional changes to the variation in
material properties. Samples from control and 6X reflowed lots of materials B and H
that underwent significant variation in the properties were selected for the analysis.
Mattson FTIR spectrometer with Galaxy Microscope attachment was used for the
analysis. A small piece of the material was taken from the sample using a stainless
steel scalpel and mounted on an IR-reflective brass plate. IR beam was passed
through the sample and then reflected off of the brass plate and passed back through
the sample where it was detected and analyzed. Each sample was scanned 32 times
with 4 cm-1 resolution to obtain the spectrum.
FTIR library was prepared from the literature with typical wave numbers
corresponding to the functional groups present in epoxy systems and is shown in
Table 11. Due to the nature of various types of atomic vibrations, a functional group
appears with different wave numbers in the library. From the knowledge of basic
chemical structures present in the epoxy systems, the functional groups present in the
laminate materials were identified. The wave numbers corresponding to the
functional groups are listed in Figure 41 based on the prepared FTIR library.

48
Table 11: Typical functional groups and wave numbers present in epoxy systems
Absorption (cm-1)
Functional groups Origin Reference
3500-3400 -OH or -NH2 -OH from opening of epoxy ring and -NH2 from
DICY curing agent [39]
3350-3200 -NH2 and -NH From BAP, TAM (phosphorus containing-amine curing agents) cured epoxy systems [17]
3410 phenyl-OH From DHPDOPO (phosphorous based flame retardant) [40]
3323 phenyl-OH From BPHPPO (phosphorous based flame retardant) [41] 2900 -CH From epoxy resin [42]
2980-2850 -CH From WSR-HPPE (epoxy resin with phosphorus flame retardant) [43]
2384 P-H stretch From DOPO (monomer for DHPDOPO-phosphorous based flame retardant) [40]
2180 -C≡N (Nitrile) From DICY-cured epoxy [44] 1740 -C=O (Carbonyl) From DICY-cured epoxy [44]
1728, 1721 -C=O From organo phosphate esters, (phosphorus containing copoly esters (PET-co-PEPPs)) [18]
1723 -C=O From WSR-HPPE (epoxy resin with phosphorus based flame retardant) [43]
1660 -C=N (Imine stretch) From DICY-cured epoxy [44]
1650 -C=N From DICY-cured epoxy [44]
1640 -C=O From BAP, TAM (phosphorus containing-amine curing agents) cured epoxy systems [17]
1630, 1565 -N-H (Amine bend) From DICY-cured epoxy [44]
1604, 1492 Aromatic C-C From BPHPPO-containing epoxy resin (phosphorus based flame retardant system) [41]
1594 Aromatic C-C From DDS curing agent [39]
1591 phenyl-P From DHPDOPO (phosphorous based flame retardant) [40]
1591, 1298, 715 phenyl-NH2 From epoxy resin [42]
1509 Aromatic C-C From DGEBA (unbrominated epoxy resin) [39] 1506 Aromatic C-C From epoxy resin [42]
1479 Aromatic C-C From BPHPPO (phosphorus containing flame retardant) [41]
1466 Aromatic C-C From DGEBTBA (brominated epoxy) [39]
1461, 1350 phenyl-P From BGPPO (phenyl phosphine) resin with DDS curing agent [45]
1457 phenyl-P From DGEBA with DHPDOPO and BPA (phosphorus containing epoxy system) [40]
1363 -CH3 From DGEBA with DHPDOPO and BPA
(phosphorus containing epoxy system) [40]
1296 P=O From WSR-HPPE (epoxy resin with phosphorus flame retardant) [43]

49
Absorption (cm-1)
Functional groups Origin Reference
1289 P=O From BPHPPO-containing epoxy resin (phosphorus based flame retardant epoxy system) [41]
1283 P=O From BGPPO (phenyl phosphine) resin with DDS curing agent [45]
1276 P=O From BPHPPO (phosphorus based flame retardant) [41]
1276 S=O From DDS curing agent [39] 1272 phenly-O From DGEBTBA (brominated epoxy) [39]
1263, 995 phenyl-C-P From BPHPPO-containing epoxy resin (phosphorus based flame retardant epoxy system) [41]
1249, 1228 P=O From organo phosphate esters (phosphorus containing copoly esters (PET-co-PEPPs)) [18]
1246 phenyl-O From DGEBA [39]
1246 phenyl-O From DGEBA with DHPDOPO and BPA (phoshporus containing epoxy system) [40]
1234, 979 phenyl-O-P stretch
From BPHPPO (phosphorus based flame retardant) [41]
1236, 817 -C-O-C- From epoxy resin [42] 1195 P=O From DHPDOPO flame retardant [40]
1184 P=O From DGEBA with DHPDOPO and BPA (phosphorus containing epoxy system) [40]
1176, 1131 P-O-C From organo phosphate esters (phosphorus containing copoly esters (PET-co-PEPPs)) [18]
1066 phenyl-Br From DGEBTBA (brominated epoxy) [39] 1036 phenyl-O-C From DGEBA (unbrominated epoxy) [39]
1034 P-O-C From WSR-HPPE (phosphorus based flame retardant epoxy system) [43]
1001 phenyl-O-C DGEBTBA (brominated epoxy) [39]
970 P-O From organo-phosphate esters (phosphorus containing copoly esters (PET-co-PEPPs)) [18]
926, 755 phenyl-O-P From DHPDOPO flame retardant [40]
915 CH2-O-CH2 (epoxide ring) From epoxy resin monomer [44]
915 CH2-O-CH2
(epoxide ring) From DGEBA with DHPDOPO and BPA
(phosphorus containing epoxy system) [40]
909 CH2-O-CH2 From BPHPPO-containing epoxy resin
(phosphorus based flame retardant system) [41]
739 phenyl-H DGEBTBA (brominated epoxy) [39]

50
1. Resin (DGEBA) Functional
groups Absorption
(cm-1) -C-OH 3500-3400 -C-H 3000-2850
1600-1450
phenyl-O-C 1040-1000
915-905
2. Curing agent
DICY curing agent Phenolic curing agent
Functional groups
Absorption (cm-1)
Functional groups
Absorption (cm-1)
-NH- 3350-3200
-C=N- 1650
Functional groups listed in 1 (Resin) also exist in
phenolic curing agent
3. Flame retardant (FR)
Bromine based FR Phosphorus based FR Functional
groups Absorption
(cm-1) Functional groups Absorption (cm-1)
phenyl-P 1590, 1460, 1350 phenyl-Br 1066
P=O 1300-1180
Figure 41: Typical functional groups present in the epoxy laminate systems
Complex molecular structure of the laminates combined with the overlap of bond
energies made it difficult to interpret the spectra by locating the exact wave numbers
corresponding to the functional groups. The peaks corresponding to key functional
groups were identified in the FTIR spectra of material H (control sample) (shown in
Figure 42). Material H is a mid Tg phenolic-cured brominated flame retardant system
with fillers and hence the following functional groups exist in the material: OH:
3500−3400 cm-1, CH: 3000−2850 cm-1, Benzene ring: 1600−1450 cm-1, Phenyl-Br:
1066 cm-1. The spectra corresponding to the control and 6X reflowed samples of

51
material H is shown in Figure 43 for illustration. The spectra of material B is shown
in Appendix II.
0.10
0.20
0.30
0.40
0.50
0.60
0.70
800 1300 1800 2300 2800 3300 3800Wave number (cm-1)
Abs
orpt
ion
0.10
0.20
0.30
0.40
0.50
0.60
0.70
800 1300 1800 2300 2800 3300 3800Wave number (cm-1)
Abs
orpt
ion
Figure 42: FTIR spectrum of control sample with functional groups identified
(material H)
0.100.200.300.400.500.600.700.800.901.00
800 1300 1800 2300 2800 3300 3800Wave number (cm-1)
Abs
orpt
ion
Control
6X Reflowed
0.100.200.300.400.500.600.700.800.901.00
800 1300 1800 2300 2800 3300 3800Wave number (cm-1)
Abs
orpt
ion
Control
6X Reflowed
0.100.200.300.400.500.600.700.800.901.00
800 1300 1800 2300 2800 3300 3800Wave number (cm-1)
Abs
orpt
ion
Control
6X Reflowed
Figure 43: FTIR spectra of a control and 6X reflowed sample (material H)
FTIR results did not show noticeable change in the wave numbers corresponding to
the functional groups between control and 6X reflowed samples (shape of the
spectrum is retained). This indicates that the variation in material properties could
possibly be attributed to an increase in cross-linking of the resin system than to the
degradation of the polymer network. The results of decomposition temperature

52
measurements also compliment this as no noticeable variation in Td of the materials
was observed due to lead-free soldering exposures.
6.2 Combinatorial property analysis
A combinatorial property analysis to investigate the underlying mechanisms for the
variations in material properties is illustrated for materials B and H. B is a high Tg
DICY-cured halogen-free material with fillers, whereas H is a mid Tg phenolic-cured
halogenated material with fillers. The illustration is focused on the material properties
listed in Table 12 and the magnitude of variation shown in the table is between the
results of control and 6X reflowed samples. The analysis is aimed at correlating the
variations in material properties to the assumed enhanced-cure structure.
Table 12: Summary of variations in properties for materials B and H
Property Material ID Observed variation
Magnitude of variation
Glass transition temperature (Tg) B Decrease >5oC
Coefficient of thermal expansion (CTE, out-of-plane) B, H Decrease >15%
Water absorption B, H Increase >25%
The reduction of CTE observed in the 6X reflowed samples of materials B and H
could be attributed to the increased cross-linking density of the epoxy resin in the
assumed enhanced-cure structure. Water absorption in the epoxy matrix occurs due to
the availability of free-volume in the laminate and the affinity of water molecules to
the polar sites present in the polymer ([36], [46], [47]). An increase in cross-linking
density of the resin system enhances the free-volume of the polymer structure making
the laminates more hydrophilic, resulting in an increase in water absorption ([36],

53
[48], [49], [50]). This could be the cause of increase in water absorption after
exposures observed in materials B and H.
The Tg of a polymer is dependent on several parameters such as molecular weight,
degree of cross-linking, and entrapped plasticizers [51]. Water typically acts as a
plasticizer in the epoxy systems, resulting in a reversible reduction of Tg ([52], [53],
[54], [55]). As discussed earlier, the laminates exposed to soldering conditions are
more susceptible to moisture absorption. A decrease of Tg observed in material B
could be the result of the plasticizing effect of moisture. The samples might have
retained the moisture even after the preconditioning (2 hours of baking at 105oC)
performed prior to Tg measurement as per the IPC test method. Material B is a DICY-
cured system, and hence has highly polar bonds compared to phenolic-cured material
H. Also, B is a high Tg material having high cross-linking density compared to mid Tg
material H. The combined effect of high polarity and the presence of greater free-
volume in the structure could have resulted in a higher moisture absorption in
material B, leading to a reduction of Tg.
To further verify the hypothesis, Tg of the 6X reflowed samples of material B was
measured after baking at 110oC for 24 hours. It was found that the Tg reduction
between control and 6X reflowed samples decreased from 15oC to 8oC, thus proving
that the increase in hydrophilic nature of the material results in a degradation of Tg.
The Tg of material F (mid Tg DICY-cured halogen-free) was also measured after
baking at 110oC for 24 hours, and a decrease in the reduction of Tg from 9oC to 4oC
between control and 6X reflowed samples was observed. These observations are
represented in Figure 44. The incomplete recovery of the Tg after baking suggest a

54
possibility for a secondary mechanism in the high and mid Tg DICY-cured halogen-
free systems contributing to the reduction of Tg due to lead-free soldering exposures.
130135140145150155160165170175
Gla
ss tr
ansit
ion
tem
pera
ture
(deg
rees
C)
Control6X6X-Baked
Material B Material F130135140145150155160165170175
Gla
ss tr
ansit
ion
tem
pera
ture
(deg
rees
C)
Control6X6X-Baked
Material B Material F
Figure 44: Effect of baking on the Tg of laminates

55
Chapter 7: Summary and Conclusions
Selection of PCB laminates compatible with lead-free processes is primarily based
on their material properties, and is also impacted by factors such as application
environment, cost, reliability, regulatory compliance, material sources, and
availability. The laminate properties are determined by the constituents such as type
of epoxy, curing agents, fillers, and flame retardants present in the material.
In the materials studied:
• High Tg laminates have lower out-of-plane CTE and flammability compared
to low Tg materials. Low Tg laminates, on the other hand, have higher Td, T-
260 and lower water absorption compared to high Tg materials with similar
constituents.
• Although DICY and phenolic-cured laminates can have similar Tg and out-
of-plane CTE; a higher Td, T-260 and lower water absorption, flammability
was observed in the phenolic-cured materials compared to similar DICY-
cured counterparts.
• The presence of fillers lowers the out-of-plane CTE of the laminates,
whereas the Tg, Td, T-260, water absorption, and flammability does not have
a strong dependence on fillers.
• Halogen-free and halogenated materials can have similar Tg, T-260, water
absorption and flammability, whereas lower out-of-plane CTE was observed
in halogen-free materials compared to halogenated materials. Also, halogen-

56
free material that is DICY-cured has higher Td compared to the halogenated
DICY-cured material. On the contrary, halogen-free material that is
phenolic-cured has lower Td compared to its halogenated counterpart.
The high temperature exposures associated with lead-free soldering assembly
conditions result in variations in the material properties of certain FR-4 laminate
material types. The exposures tend to lower the Tg, out-of-plane CTE, and T-260 of
the laminate materials. An increase in water absorption and flammability was
observed in most of the laminates due to exposures. The exposures did not affect the
laminate materials to an extent of changing their decomposition temperatures (Td).
The variation in material properties due to lead-free soldering exposures is attributed
to the degree of cross-linking and to the extent of water absorption in the exposed
laminates.

57
Chapter 8: Contributions
• This is the first published study demonstrating the effects of lead-free
soldering exposures on key thermomechanical, physical, and chemical
properties of FR-4 laminates. The analysis of characterization provides a
guideline for the selection of laminates for appropriate applications.
• The laminate material types that are most affected by lead-free soldering
exposures are illustrated.
• Based on the observations, the following recommendations have been made:
Laminate manufacturers should conduct in-house qualification tests
on the laminates to assess the variations in material properties.
Corrective actions should be taken by tailoring the material
constituents and/or laminate fabrication process conditions for
achieving thermally stable laminates.
Electronic product manufacturers should gather the information
about material constituents from the laminate suppliers, and consider
the extent of variations in material properties due to lead-free
soldering exposures before making a decision on the selection of
appropriate laminates.

58
Appendix I: Datasheet values for the material properties studied
CTE (ppm/oC) [out-of-plane]
CTE (ppm/oC) [in-plane: warp]
CTE (ppm/oC) [in-plane: fill]
Supplier # Tg (oC) Below
Tg Above
Tg Below
Tg Above
Tg Below
Tg Above
Tg I A 165-175 (DSC) 50-70 200-300 N/A N/A N/A N/A I B 165-175 (DSC) 30-50 200-230 N/A N/A N/A N/A I C1 165-175 (DSC) 40-60 270-300 N/A N/A N/A N/A I C2 165-175 (DSC) 40-60 250-270 N/A N/A N/A N/A II D1 173-183 (DSC) 50-60 200-300 12-15 N/A 14-17 N/A II D2 170-175 (DSC) 20-30 130-160 12-14 N/A 12-14 N/A II E 170-180 (TMA) 40-50 280-310 15-18 N/A 15-18 N/A I F 145-155 (DSC) 30-50 200-230 N/A N/A N/A N/A I G1 150-160 (DSC) 40-60 270-300 N/A N/A N/A N/A I G2 145-155 (DSC) 40-60 250-270 N/A N/A N/A N/A II H 135-145 (DSC) 35-45 180-240 12-15 N/A 14-17 N/A II I 140-150 (TMA) 40-55 150-220 13-16 N/A 16-19 N/A I J 135-145 (TMA) 50-70 250-350 N/A N/A N/A N/A I K 175-185 (DMA) 50-70 250-350 N/A N/A N/A N/A
Td (oC) Supplier # 2% weight loss 5% weight loss Water
absorption Flammability
I A N/A 310 0.20-0.30 UL 94 V-0 I B N/A 350 0.20-0.30 UL 94 V-0 I C1 N/A 351 0.20-0.30 UL 94 V-0 I C2 N/A 351 0.05-0.10 UL 94 V-0 II D1 N/A N/A N/A UL 94 V-0 II D2 N/A N/A N/A UL 94 V-0 II E N/A 350-370 N/A UL 94 V-0 I F N/A 350 0.20-0.30 UL 94 V-0 I G1 N/A 350 0.20-0.30 UL 94 V-0 I G2 N/A 350 0.05-0.10 UL 94 V-0 II H N/A 340-360 N/A UL 94 V-0 II I N/A N/A N/A UL 94 V-0 I J N/A 325 0.05-0.10 UL 94 V-0 I K N/A 350 0.15-0.18 UL 94 V-0
* The data sheet values are for a specific construction (type of glass weave style,
number of glass plies, resin content, and nominal thickness) of the laminate material
which is different from that of the laminate materials considered for this study.

59
Appendix II: FTIR spectra of control and 6X reflowed samples of
material B
FTIR spectra of material B (control)
0.10
0.20
0.30
0.40
0.50
0.60
0.70
800 1300 1800 2300 2800 3300 3800Wave number (cm-1)
Abs
orpt
ion
FTIR spectra comparison between control and 6X reflow samples of material B
00.10.20.30.40.50.60.70.80.9
1
800 1300 1800 2300 2800 3300 3800Wave number (cm-1)
Abs
orpt
ion
Control
6X Reflowed
FTIR spectra comparison between control and 6X reflow samples of material B
00.10.20.30.40.50.60.70.80.9
1
800 1300 1800 2300 2800 3300 3800Wave number (cm-1)
Abs
orpt
ion
Control
6X Reflowed

60
Bibliography
[1] The European Parliament and the Council of the European Union, “Directive
2002/95/EC on the restriction of the use of certain hazardous substances (RoHS)
in electrical and electronic equipment”, Official Journal of the European Union,
pp. L. 37/19-37/23, February, 2003.
[2] The European Parliament and the Council of the European Union, “Directive
2002/95/EC on the waste electrical and electronic equipment (WEEE)”, Official
Journal of the European Union, pp. L. 37/24-37/38, February, 2003.
[3] Ganesan S., and Pecht M., “Lead-free electronics”, IEEE Press, Wiley-
Interscience, A. John Wiley and Sons, Inc., New Jersey, USA, 2006.
[4] Coombs C., “Printed circuit handbook”, McGraw Hill, fifth edition, 2001.
[5] Bergum E., “Thermal analysis of base materials through assembly: Can current
analytical techniques predict and characterize difference in laminate
performance prior to exposure to thermal excursions during assembly?”, Printed
Circuit Design & Manufacture, September 2003.
[6] Kelley E., and Bergum E., “Laminate material selection for RoHS assembly,
Part 1”, Printed Circuit Design & Manufacture, pp. 30-34, November 2006.
[7] Kelley E., and Bergum E., “Laminate material selection for RoHS assembly,
Part 2”, Printed Circuit Design & Manufacture, pp. 30-37, December 2006.
[8] Kelley E., “An assessment of the impact of lead-free assembly processes on
base material and PCB reliability,” Proceedings of IPC APEX Conference, pp.
S16-2-1, 2004.
[9] Ehrler S., “The compatibility of epoxy-based printed circuit boards with lead-
free assembly”, Circuit World, vol. 31, no. 4, pp.3-13, 2005.
[10] Christiansen W., Shirrell D., Aguirre B., and Wilkins J., “Thermal stability of
electrical grade laminates based on epoxy resins”, Proceedings of IPC Printed
Circuits EXPO, Anaheim, CA, pp. S03-1-1-S03-1-7, 2001.

61
[11] Valette L., and Wiechmann R., “High-performance substrate from new epoxy
resin and enhanced copper foil”, Circuit World, vol. 30, no. 4, pp. 20-26, 2004.
[12] Pecht M., Ardebili H., Shukla A., Hagge J., and Jennings D., “Moisture ingress
into organic laminates”, IEEE Transactions on Components and Packaging
Technology, vol. 22, no. 1, pp. 104-110, March 1999.
[13] Qi H., Ganesan S., Wu J., and Pecht M., “Effects of printed circuit board
materials on lead-free interconnect durability”, 5th International Conference on
Polymers and Adhesives in Microelectronics and Photonics, Wroclaw, Poland,
pp. 140-144, October 23-26, 2005.
[14] Sottos R., Ockers M., and Swindeman M., “Thermoelastic properties of plain
weave composites for multilayer circuit board applications”, Journal of
Electronic Packaging, Transactions of the ASME, vol. 121, no. 1, pp. 37-44,
1999.
[15] Peng Y., Qi X., and Chrisafides C., “The influence of curing systems on
epoxide-based PCB laminate performance”, Circuit World, vol. 31, no. 4, pp.
14-20, 2005.
[16] Camino G., and Costa L., “Performance and mechanisms of fire retardants in
polymers—A review”, Polymer Degradation Stability, vol. 20, no. 3-4, pp. 271-
294, 1988.
[17] Jain P., Choudhary V., and Varma I., “Flame retarding epoxies with
phosphorous”, Journal of Macromolecular Science-Polymer Reviews, vol. 42,
no. 2, pp. 139-183, 2002.
[18] Chang, J., Sheen Y., Chang R., and Chang F., “The thermal degradation of
phosphorous-containing co polyesters”, Polymer Degradation and Stability, vol.
54, no. 2-3, pp. 365-371, 1996.
[19] Liu W., Varley R., and Simon G., “Understanding the decomposition and fire
performance processes in phosphorus and nanomodified high performance
epoxy resins and composites”, Polymer, vol. 48, no. 8, pp. 2345-2354, 2007.

62
[20] Iji M, and Kiuchi Y., “Flame resistant glass-epoxy printed wiring boards with
no halogen or phosphorous compounds”, Journal of Materials Science:
Materials in Electronics, vol. 15, pp. 175-182, 2004.
[21] IPC-4121, “Guidelines for selecting core constructions for multilayer printed
wiring board applications”, Bonnockburn, IL, January 2000.
[22] IPC/JEDEC J-STD-020D, “Moisture/reflow sensitivity classification for non-
hermetic solid state surface mount devices”, August 2007.
[23] IPC-TM-650 2.4.25, “Glass transition temperature and cure factor by DSC”,
The Institute for Interconnecting and Packaging Electronic Circuits,
Northbrook, IL, December 1994.
[24] IPC-TM-650 2.4.24, “Glass transition temperature and z-axis thermal expansion
by TMA”, The Institute for Interconnecting and Packaging Electronic Circuits,
Northbrook, IL, December 1994.
[25] Reinhart J., “Engineering materials handbook”, vol. 1, Composites, ASM
International, Metals Park, OH, 1987.
[26] Wu T, Guo Y., and Chen W., "Thermal-mechanical strain characterization for
printed wiring boards," IBM Journal of Research and Development, vol. 37, no.
5, pp. 621-634, 1993.
[27] Yuan J., and Falanga L., “The in-plane thermal expansion of glass fabric
reinforced epoxy laminates”, Journal of Reinforced Plastics and Composites,
vol. 12, pp. 489-496, 1993.
[28] IPC-TM-650 2.4.24.6, “Decomposition of laminate material using TGA”, The
Institute for Interconnecting and Packaging Electronic Circuits,, Bannockburn,
IL, April 2006.
[29] IPC-TM-650 2.4.24.1, “Time-to-delamination (by TMA method)”, The Institute
for Interconnecting and Packaging Electronic Circuits, Northbrook, IL,
December 1994.

63
[30] IPC-TM-650 2.6.2.1A, “Water absorption, metal clad plastic laminates”, The
Institute for Interconnecting and Packaging Electronic Circuits, Northbrook,
IL, May 1986.
[31] Lambert, R, “The impact of materials on the flammability of printed wiring
board products”, 43rd Proceedings of Electronic Components and Technology
Conference, pp. 134 - 142, June 1993.
[32] UL 94, “Tests for flammability of plastic materials for parts in devices and
appliances”, Underwriters Laboratories, June 1990.
[33] Paterson-Jones J., Percy V., Giles R., and Stephen A., “The thermal degradation
of model compounds of amine-cured epoxide resins. II. The thermal
degradation of 1,3-diphenoxypropan-2-ol and 1,3-diphenoxypropene”, Journal
of Applied Polymer Science, vol. 17, no. 6, pp. 1877-1887, 1973.
[34] Brito Z., and Sanchez G., “Influence of metallic fillers on the thermal and
mechanical behavior in composites of epoxy matrix”, Composite Structures,
vol. 48, no. 1-3, pp. 79-81, 2000.
[35] Sanchez G., Brito Z., Mujica V., and Perdomo G., “The thermal behavior of
cured epoxy-resins: The influence of metallic fillers”, Polymer Degradation
Stability, vol. 40, no. 1, pp. 109-114, 1993.
[36] Diamant Y., Marom G., and Broutman L., “The effect of network structure on
moisture absorption of epoxy resins”, Journal of Applied Polymer Science, vol.
26, pp. 3015-3025, 1981.
[37] Levchik S., and Weil E., “Thermal decomposition, combustion and flame-
retardancy of epoxy resins-a review of the recent literature”, Polymer
International, vol. 53, pp. 1901-1929, 2004.
[38] http://www.ptli.com/testlopedia/tests/FTIR-E168andE1252-more.asp (accessed
on 03/05/2008)
[39] Luda M., Balabanovic A., and Camino G., “Thermal decomposition of fire
retardant brominated epoxy resins”, Journal of Analytical and Applied
Pyrolysis, vol. 65, pp. 25-40, 2002.

64
[40] Wang X., and Zhang Q., “Synthesis, Characterization, and cure properties of
phosphorus-containing epoxy resins for flame retardance”, European Polymer
Journal, vol. 40, pp. 385-395, 2004.
[41] Ren H., Su J., Wu B., and Zhou Q., “Synthesis and properties of a phosphorus-
containing flame retardant epoxy resin based on bis-phenoxy (3-hydroxy)
phenyl phosphine oxide”, Polymer Degradation and Stability, vol. 92, pp. 956-
961, 2007.
[42] Ogi K., “Influence of thermal history on transverse cracking in a carbon fiber
reinforced epoxy composite”, Advanced Composite Materials, vol. 11, no. 3, pp.
265-275, 2003.
[43] Wang Q., and Shi W., “Kinetics study of thermal decomposition of epoxy resins
containing flame retardant components”, Polymer Degradation and Stability,
vol. 91, pp. 1747-1754, 2006.
[44] Gundjian M., and Cole K., “Effect of copper on the curing and structure of dicy-
containing epoxy composite system”, Journal of Applied Polymer Science, vol.
75, pp. 1458-1473, 2000.
[45] Liu Y., Hsiue G., Lan C., and Chiu Y., “Phosphorus-containing epoxy for flame
retardance: IV. Kinetics and mechanism of thermal degradation”, Polymer
Degradation and Stability, vol. 56, pp. 291-299, 1997.
[46] Marsh L., Lasky R., Seraphim D., and Springer G., “Moisture solubility and
diffusion in epoxy and epoxy-glass composites”, IBM Journal of Research and
Development, vol. 28, no. 6, pp. 655-661, 1984.
[47] Maggana C., and Pissis P., “Water sorption and diffusion studies in an epoxy
resin system”, Journal of Polymer Science: Part B: Polymer Physics, vol. 37,
no. 11, pp. 1165-1182, 1999.
[48] Ko M., and Kim M., “Effect of postmold curing on plastic IC package
reliability”, Journal of Applied Polymer Science, vol. 69, no. 11, pp. 2187-2193,
1998.

65
[49] Gonon P., Sylvestre A., Teysseyre J., and Prior C., “Combined effects of
humidity and thermal stress on the dielectric properties of epoxy-silica
composites”, Materials Science and Engineering B , vol. 83, no. 1-3, pp. 158-
164, June 2001.
[50] Aronhime M., Peng X., and Gillham J., “Effect of time-temperature path of cure
on the water absorption of high Tg epoxy resins,” Journal of Applied Polymer
Science, vol. 32, pp. 3589-3626, 1986.
[51] Wondraczek K., Adams J., and Fuhrmann J., “Effect of thermal degradation on
glass transition temperature of PMMA”, Macromolecular Chemistry and
Physics, vol. 205, no. 14, pp. 1858-1862, 2004.
[52] Sala G., “Composition degradation due to fluid absorption”, Composites Part B:
Engineering, vol. 31, no. 5, pp. 357-373, July 2000.
[53] Smith C., “Water absorption in glass fiber-epoxide resin laminates”, Circuit
World, vol. 14, no. 3, pp. 22 -26, 1988.
[54] Marsh L., Lasky R., Seraphim D., and Springer G., “Moisture solubility and
diffusion in epoxy and epoxy-glass composites”, IBM Journal of Research and
Development, vol. 28, no. 6, pp. 655-661, 1984.
[55] Flor G., Campari-Vigano G., and Feduzi R., “A thermal study on moisture
absorption by epoxy composites”, Journal of Thermal Analysis and
Calorimetry, vol. 35, no. 7, pp. 2255-2264, November, 1989.