ABSTRACT THE PARTIAL ANNEALING OF LCM-CARBON …digitool.library.mcgill.ca/thesisfile46562.pdf ·...
134
M.Sc. ABSTRACT THE PARTIAL ANNEALING OF LCM-CARBON STEEL STRIP by Clifford J. Adams Metallurgy Tinplate stock that had been cold reduced 82% by rolling was partially annealed st various temperatures to produce the full strength spectrum that could be obtained from a continuous annealing line. The mechanical properties of this mat.erial were compared to those of material that had'bèen .cold rolled by various amounts to equivalent strengths. It was found that the ductility of partia11y annealed material was substantially superior to that of cold-rolled material at virtually a11 strength levels. This difference in ductility between the· two materials at equal strengths has been yisually correlated, by a series of photomicrographs, to a difference in microstructure. Microstructural recovery and recrystallization are responsible for the increased duc ti- lit y of partia11y annealed material over that coldl""o11ed.
Transcript of ABSTRACT THE PARTIAL ANNEALING OF LCM-CARBON …digitool.library.mcgill.ca/thesisfile46562.pdf ·...

M.Sc.
ABSTRACT
THE PARTIAL ANNEALING OF
LCM-CARBON STEEL STRIP
by
Clifford J. Adams
Metallurgy
Tinplate stock that had been cold reduced 82% by rolling was
partially annealed st various temperatures to produce the full strength
spectrum that could be obtained from a continuous annealing line. The
mechanical properties of this mat.erial were compared to those of material
that had'bèen .cold rolled by various amounts to equivalent strengths.
It was found that the ductility of partia11y annealed material
was substantially superior to that of cold-rolled material at virtually
a11 strength levels. This difference in ductility between the· two
materials at equal strengths has been yisually correlated, by a series
of photomicrographs, to a difference in microstructure. Microstructural
recovery and recrystallization are responsible for the increased duc ti
lit y of partia11y annealed material over that coldl""o11ed.
THE PARTIAL ANNEALING OF
LOW-CARBott StEEL STP.IP
by
Clifford J. Adams
A thes,is submitted to the Faculty of Graduate Studies and
Research in Partial fulfUment of the requirements for the degree
of Master of Science in Metallurgy.
McGill Uni~ersity
Montreal, Canada June, 1969

~,I
THE PARTIAL ANNEALING OF
LCM-CARBON STEEL STRIP
by
Clifford J. Adams
A thesis submitted to the Faculty of Graduate Studies and
Research in Partial fu1fi1ment of the requirements for the degree
of Master of Science in Meta11urgy.
McGill University
Montreal, Canada June, 1969
(ê) Clifford J. Adams 1970

ACKNOWLEDGEMENTS
The writer wishes to express his gratitude to Professor W.M.
Williams, Director of this Research' for his assistance and adv1ce.
Financial assistance in the form of a Steel Company of Canada Fell~
ship is gratefully acknowledged. Thanks are due to the Stelco Research
Centre for providing material and chemical analyses; to Professor T.
Salman, Dr. S. Adams and fellow graduate students for their friendship
and encouragement; and to Mr. R. Chambers and Mr. M. Knoepfel for theit
technical assistance.

INTRODUCTION
Manufacture of Steel Sheet
Ristorical Prologue
Batch Annealing
Continuous Strip Annealing
Manufacture of Tinplate
Conventional Method
Double-Reduced Tinplate
TABLE OF CONTENTS
Partial Annea1ing - Project Objective
REVIEW OF LITERATURE ON PARTIAL ANNEALING
Non-Ferrous
Low-Carbon Steel Strip
TREORETICAL BACKGROUND
Co1d Working
Annealing
Recovery
Recrysta1lization
Grain Growth
Effects of Composition on ;'-., iealing Rate 1
Plastic Anisotropy - Strain Ratio r
EXPERIMENTAL PROCEDURE
Introduction
Materi81
Chemical Composition, Table l
Test Methods
Preparation of Tensile Specimens
Rardness
Tensile Testing
Strain Ratio r
Metallography
Page
1
1
2
3
8
8
9
11
12
14
18
20
20
23
27
29
34
37
38
39
40
40
42
42
46
46
iH
Preparation of Temper-Rolled Materiels
Rolling Schedule, Ta~le II ,
Preparation of Material for Partial Annealing
Par.tial Annealing'
Tech~ique
Thermocouple Calibration
Partial Annealing
Artificid Aging
Pickling
Skin Passing
RESULTS AND DISCUSSION
Page 48
49
53
54
54
55
55
56
57
57
I~troduction 59
Temper Rolling 59
Partial Annealing 65
Percent Recovery, Table III 70
Comparison of Partially Annealed to Temper-Rolleq Materials 72
Comparison of Ductilities 72
Comparison of Yield~to-Tensile Strength Ratios 83
Comparison of Strain Ratios 84
Comparison.of Microstructures 88
SUMMARY AND CONCLUSIONS
Summary
Industfial Implications. Table IV
SUGGESTIONS FOR FURTHER WORK
APPENDIX A, Tables of Resülts
APPENDIX B
REFERENCES
98
100
102
103
107
114
iv

~ \'J!!iJ
INTRODUCTION
Manufacture of Steel Sheet
(i) Historical Prologue
In 1870 W. Siemens in Wales, began to manufacture steel sheet as the
base plate for tinning instead of the long used wrought irone From that
time to about 1930, the Hot-Pack Process(l) was the major method of pro-
ducing this steel sheèt. It consi~ted of first cutting a long fIat bar
into sections of length equal to that of the desired fini shed plate width.
Then each section was reheated, rolled, and doubled over on itself; the
process was repeated three times until a pack of eight sheets of nearly
finished gauge was produced. The individual sheets were separated, pickled
to remove the scale and then cold rolled between highly poli shed rolls to
obtain the smoothest surface possible. This cold rolling was followed by
"white annealing", Le. low-temperature heating which produced only slight
oxidation. The sheets were stacked in bundles on a bogie, protected with
a cast iron cover and pushed into a large pack furnace. Annealing was fol-
lowed by "white pickling" using dilute sulphuric aeid and then the sheets
were ready to be tinned by hot dipping.
During the early 1930's, steel plants began to introduce high-speed,
high-capacity hot and cold-rolling mills. These mills produced the steel
sheet as coils, often weighing up to 10 tons, a development which rendered
hot-pack, hand-fed mills and sheet-pack annealing methods obsolete. New
methods for handling and annealing coils had to be found.

2
Before proceeding further, it may be of some advantage to define
annealing as the term applies in the manufacturing of low-carbon steel
sheet. Annealing is the process of heating steel sheet to a tempera-
o ture below the lower critical temperature (723 C), holding and then
cooling to room temperature, the main purpose being to restore to the
steel the ductility lost during the cold-rolling process. This is
achieved by ensuring that the annealing temperature is above that at
which recrystallization occurs and that the steel is held at tempera-
ture long enough for complete recrystallization. This is termed sub-
critical or process annealing and is essentially a softening process.
(ii) Batch Annealing
The coils produced by the newly installed high-capacity rolling
mills were too numerous to be handled by the old pack annealing furnaces.
Instead, the coils were stacked four high, with up to eight stacks on
a hearth. An inner steel cover was placed over each stack to hold the
protective gases that a~e introduced to prevent scaling by atmospheric
oxidation. Then a portable furnace cover was placed over the entire as-
sembly. A full description of conventional batch annealing can be found
in the literature (2,3,4,5).
The biggest disadvantage to batch annealing is its complete inflexi-
bility due to the problem of heating and cooling a large mass of steel.
This not "only lea'ds to a process Ume of from 6 to 10 days, but also te
a non-uniformtty of praperties throughaut the cail. This is because the
outside has ta be heated to a higher temperature than the inside in arder
ta reach the required recrystallizatian temperatures at the center.

3
To alleviate largein-process tonnages due to the long annealing
times, open-coil annealing (6,7,8) has been developed since about 1954.
In this process, a.tightly·wound "closed" coU is rewound prior to
annea ling into a loose or "open" coU by placing a twisted wire spacer
between each wrap near the top edge. After annealing, the coil is
again rewound into 8 normal tight coU and is ready for further proces
singe The spacer p'ermits the circulation of the atmosphere gases between
the laminations during the annealing:cycleand thusincreas~the effective
surface area of thecoil for haating or cooling by about 1000 times over
that of a tight coil. Thus, this process permits more rapid heating and
cooling (a 20 hour cycle as opposed to 8 days), more uniform temperature
distribution, and exposure of the whole steel surface to an atmosphere of
known composition to permit utilization of gas-metal reactions such as
decarburizing. However, open-coil annealingis not suitable for the
thinner gauges of steel used for tinplate because coiling with the wire
spacers be·tween the laps tends to distort the material.
(iii) Continuous Strip Annealing
After the introduction of modern strip mills to replace hot-pack mills,
it became apparent that the onlypart of the process in which there was no
continuous flow was that of annealing. The batch annealing process seriously
hampered increased production due to the very long heatingcycle and large
in-process tonnage. In the period 1936-40, a few production continuous
annealing furnaces were installe.d but although successful, they made no

4
great impact on the canmaking trade. The product was considerablyharder
and stiffer than the equivalent batch annealed material andwas generally
looked upon with scepticism by the tinplate industry·since it was not
compatible with existing equipment for formingcan bodies. Development
was seriously delayed and it took almost 15 yearsbefore the canmakers
realized that the high degree of uniformityin.the mechanical properties
of continuously annealed tinplate had a significant beneficial effect
on canmaking speeds, once their automatic forming equipment had been
adjcsted to process the harder plate. Proven advantagesfor both producer
and consumer have led to the very rapid increase since 1955, in the pro-1
duction and use of continuously annealed tinplate. New annealing lines,
recently installed, have strip speeds of 2000 ft/min. to give production
ra~es of 60 tons/hr.
Typical strip annealing lines, as illustrated by Figure l, have been
described in detail elsewhere (9,10,11). Briefly, annealing lines consist
of three sections; an entry section, comprisingstrip handling, welding
and cleaning equipment; a vertical strandfurnace section; and an exit or
delivery section in which the annealed strip is re-coiled. Since the strip
must move through the furnace continuouslyand at a uniform rate, looping
towers for strip storage are placed at each.end of the furnace section.
Theseloopersallow the entry and delivery·sections to be stopped indepen-
àently in order to add or remove coils without affecting the strip moving
through the furnace.

/
c g u 51
.:: c ....
c .Q Û ~ ., u 0
E ~
c g u :! z: QI
2 -;; 0
Sheor
IE~=;!' NO.2 poy off reel Sheor
Welcler
tank
looper
brldle
coollnq
recol!er
5
-0 ~ .. 0\ -QI é
'PI ~
00 é
'PI ~ 1\1 QI é é 1\1
CIl ::s 0 ::s é
'PI
"" é· 0 U
1\1
4-4 0
é 0
'PI
"" U QI CIl
U 'PI
"" ; QI
.t:: U
CIl
~
QI
~ 00
'PI
"'"

6
The furnace section is divided into four main zones; heaUng,
soaking, slow cooling and fast cooling; and throughout these zones the
steel strip ia protected from axidation by an atmosphere gas. Thestrip
enters the furnace and ie rapidly heated to nearly 7000 C in 20 seconds.
It then entera a soaking zone to allow time for completerecrystalliza
tion which ls another 20 seconds at 700oC. After soaking, the strip ie
. 0 slowly cooled in an insulated chamber to about 480 C over a period of .
30 seconds.
The slow cooling is considered necessary because on cooling from
7000 C to room temperature, the solid solubility of carbon and nitrogen
in the ferrite decreases considerably. If the recrystallized strip is
cooled rapidly,the ferrite becomes supersaturated with these elements
leading to precipitation of fine carbide and nitride particles at room
tempereture. This phenomenon, known as quench aging, results in a con-
siderable increase in hardness and decrease in ductility of the steel strip.
Slow cooling allows most of the carbon in solid solution to precipitate
ante existing carbides and allows at least part of the nitrogen.to diffuse
out of the steel, thus avoiding quench-aging effects. After slow cooling
o to below 480 C, the strip is rapidly cooled.
The rapid rates of heating and cooling are made possible by the very
thin sections of the strip (approximately 0.010 in.) and by the very
nature of the process. all parts of each coil are subjected to exactly
the same thermal cycle ensuring a uniform product in respect to
mechanical properties and surface conditions. It has been mentioned
previously that continuous annealing produces a harder grade

7
of material than batch annealing. This, as will be discussed later,
is due to a fine grain size in the continuously annealed product, a
consequence of the very short annealing cycle. For soft, deep-drawing
grades, the open-coil batch annealing process appears to be most success
fui and should in time.replace conventional batch annealing, while for
the harder grades, especially tinplate, continuous annealing has attained
complete acceptance.

8
Manufacture of Tinplate
(i) Conventionat Method
Most of the tinplate now being produced is made from low-
carbon steel strip which has been hot rolled to an intermediate gauge,
pickled, cold rolled almost to fini shed gauge, cleaned, process annealed,
temper rolled to final gauge, and finally electrolytically coated with
tin. It is sold to can manufacturers according to hardness and strength
specifications, normally called tempers.
Temper is principally dependent upon steel composition, annealing
practice (batch or continuous) and degree of temper rolling. The
strengthening of steel strip prior to cold reduction by alloying, e.g.
with chromium or nickel, is undesirable from an economic point of view,
but the addition or retention of nitrogen or phosphorus has successfully
been used to obtain the harder tempers. Continuous annealing, with its
inherent fine grain size, is satisfactory for the intermediate tempers
of tinplate but batch annealing which produces a larger grain size must
be used to obtain the very soft tempers. Temper rolling, or preferably
skin-pass rolling, is used to improve strip shape and sürface but most
important, it imparts to the steel a slight measure of cold working.
Two advantages gained from this cold working are: firstly, the temper
within the intermediate range can be contro11ed by the amount of cold
reduction which is usually 1ess than 5%, and second1y, the yie1d exten
sion, which resu1ts in defécts called stretcher strains, is e1iminated
for reductions greater than 1%.

9
The tempers available in tinplate are conveniently indicated by
a range of Rockwell superficial hardness values (R30T scale) and these
are given with typical applications in the diagram (12) shown in Figure 2.
(ii) Double-Reduced Tinplate
In recent years there has been a strong trend towards tinplate of
thinner gauge to enable more economical canmaking so that steel may compete
effectively with other materials. As the steel base becomes thinner, its
strength must be increased so that it can still serve its intended purpose.
The double-reduction process (13,14) is unique in that thinner as
weil as stronger material is produced in the same operation. This is a
two-stage cold-reduction process with intermediate annealing of the strip.
The strengthening is achieved by strain hardening in the second cold
reduction that replaces the conventional skin-passing operation. The
final hardness and strength are control1ed by the steel grade and by an j
adjustment in the amount of second reduction: in the order of 30% for
Temper 7 and 50% for Temper 8. The extra strength of this thinner
(0.006 in.) double-reduced strip is obtained at the expense of ductility
and thus it can be used only in applications where plastic deformation is
at a minimum. Another major disadvantage to this process is that single
stand temper-rolling mills are not designed to cold reduce more than a
few percent. The installation, at high capital costs, of two-stand or °three
stand mills to handle the final côld reduction, Ois necessa~y.

HARDNESS R 30T
80
70
60
50
40
BA - Batch Annealed
CA - Continuous Annealed DR - Double-Reduced
DR o
D~
10
CA or DR / /OrS(7S-S3)
/
"1 '~uble-ReduCed BA or CAC) /~7(71-78).I'- Tipplate
A /1/OT6(67-73), Beer and pressure can BA or C 0 ends
BA /1 /0 T5(6Z-68) , SUff end atock,.acuum cana
BA/I~OT4(58-64), Stiffer can bodiea and enda
BAO/ 1 ~OT3(54-60), Ca. bodies and enda
~~2(50-56), Screw caps, drawn cans
/
~1(46-52), Deep-drawn components
"f 1
TEMPER NUMBER
Figure 2. Tinplate temper grades and applications (12,31).
11
Partial Annealing, - Project Objective
In the future it is likely that there will be an eve~ increasing
demand for higher-strength ,tinplate. Double-reduced material is finding
very wide application in pressure packs of the type used for soft drinks
and beer. The heavy capital expenditure needed to produce this material
which has, at best, only marginal duc:tility, has led to a search for
alternative' processes. The ability to pro duce high-strength tinplate
ona continuous annealer, without the use of a second cold reduction would
obviously be attractive., One way of achieving, thisobJective, is' ,to' control
times and têmi>ér'atures of the continuous annealing cycle toenable' produc-
tion of ~ than fully recrystallized material. This material is then
sa id to be partially annealed.
In a partial annealing process, the high strength obtained from
strainharden:i.ngthe,material by acold reduction of 80-90%, would be
retained by only partiaÙy annealing this very har'dmaterial b'ack to
the temper or strength specification. An investigation has been under-
taken to compare the mechanical properties of heavily cold-reduced, then
partially annealed strip to those properties obtained from cold rolling
annealed strip by various amounts. This comparison should de termine
what, if any, improvement could be made in the ductility of low-carbon
steel strip by partial annealing as opposed to the standard temper-
rolling or double-reducing processes.

12
REVIEW OF LITERATURE ON PARTIAL ANNEALING
Non-Ferrous
There are only a few references to partial annealing of materials
in published literature, which in itself would indicate that too little
attention has been paid to the process. Investigations (15,16,17) into
partial annealing of aluminum and aluminum alloys all showed that par
tially annealed material had higher elongation values for a given ten
sile strength than material which had been temper rolled. Reduced
directionality (18) has also been reported but the same author warns that
variables such as metal composition, casting methods and intermediate
annealing, affect the rate and extent of recovery during partial annea
ling. This may be true of batch annealing methods but on a continuous
single-strip annealer, another investigator (19) reported that high
heating rates and short annealing times minimize the influence of prior
history of these aluminum alloys. Parsons (2P) has partially annealed
aluminum-magnesium alloys and found significant beneficial effects on
elongation, yield-to-tensile ratio and directionality.
An investigation (21) into t~e self-annealing of copper at room
temperature and a recent paper by Mima et al.(22) on the annealing
spectrum of heavily drawn copper wire, both showed the extent to which
the mechanical properties varied with time and temperature, i.e. with
degree of recrystallization, but the data were not very helpful in

'plal)r:i~œ th~ present series of experiments. A brief mention in a· book
(23) by Herengue1, states that partial annea1ing of copper and its
al10ys has been empirica1ly practiaed for quite some time as an alter
native way in which to produce tempers of 1/2 hard, 1/4 hard, etc.,
but temperature control in annealing and control of mechanical pro
perties hinder its development. Ftitz (24,25) made the first known
attempt to compare partially annea1ed copper with that which had been
temper rol1ed. He showed that partially annealed copper has a greater
elongation and a lower yield-to-tensile ratio than does temper-rolled
materia1, but little difference in direetionality was found between
13
the two. An investigation (26) into using partially annealed 70/30 brass
as an alternative to temper-rolled material showed that "the eombina
tion of mechanieal properties obtained is better at virtually any de
sired strength level and that normal Mill variations in composition
were found to have negligible effects on the annealing behaviour and
on the properties of the finished materiallt.

14
Low-Carbon Steel Strip
Patent rights (27,28) to a partial annealing process were granted
in 1965-66 to Frazier and Toth of the Youngstown Sheet and Tube Company.
This all-encompassing patent covers several different process paths
whereby partially annealed low-carbon steel could be produced. The
authors claim economy in production and superior ductilitywithout signi
ficant loss in strength for their rolled steel products, especially for
their high-strength .tinplate which was used as their example. However,
they. have published no literature·relating directly to the process or
to the mechanical properties of their partially annealed low-carbon steel
strip. A copy of their U.S. patent (27) is presented for perusàl in appen-
dix B.
Several other tinplate manufacturers(29,30,3l) are known to have
investigated partial annealing as an alternative to temper rolling. All
have indicated(except Youngstown ) that the stringent degree of ~emperatu~e
control that would be needed on a continuous annealing line to produce a
uniform product, would make the process impracticable.
Montgomery (29) of the Steel Company of Canada used an internal
resistance heating apparatus to simulate the heating cycle of a continuous
annealing line running at speeds of 400 and 800 ft/min. Strip whichhad
been cold reduced 85,90 and 95% were given partial annealing.treatments
o 0 0 0 in which the peak temperature ranged from.800 F (427 C) to 1200 F (650 Cl.

lS
He conc1uded that in the range of peak temperatures wherein the mechani
cal properties changed Most rapid1y withrespect to temperature, the
scatter of measured properties especia11y ducti1ity, was very large.
He further conc1uded that with this scatter and variations in compo
sition or prior history, it wou1d be difficu1t to produce a uniform
product in ordinary commercial practice.
Bernick and McFar1and (30) of In1and Steel Company reported an
investigation into the direct co1d reduction from hot-ro11ed strip to
double-reduced gauge (0.006 in.), fol1owed by annea1ing to give the
desired strength and ductility. They reported that it became obvious
early in the experimental program that continuous annea1ing was not suit
able for partial annea1ing because even with the best temperature control
possible in commercial continuous annealing, recrystal1ization kinetics
are unfavourable to allow control of the mechanical properties. However,
by batch annealing for 8-24 hours, they claimed it was possible to ob
tain a wide range of mechanical properties with reasonab1y good control.
Wooldridge (31,32) at the Steel Company of Wa1es carried out 1abora
tory studies of the partial annealing of heavi1y cold-reduced stee1s. He
used a salt bath ta' simu1atè both continuous and batch annealing cycles
on stee1s of 16 different compositions. Hardness and tensile values,
elongation, Erichsen cupping and Jenkins bend values were obtained.
Isothermal and isochronal plots of hardness versus annealing time and
temperature respectively, were the bases on which it was concluded that
thedegree of temperature control that is necessary to produce higher-

16
temper tinp1ate was outside the present capabi1ities of batch or continuous
annea1ing processes. He a1so found that the ductility of partia11y
anneeled material was only slightly superior to that of double-reduced
tinplate of equiva1ent hardness.
Wooldridge a1so investigated quench-aging effects, temper-rolling
and strain-aging effects, and rate-of-heating effects on partially annealed
material. After this, double-reduced material (30-50% cold reduction )
was partial1y annealed using combinations of batch and continuous annea
ling cycles. Nine more steel compositions were added to investigate
aluminum-killed steels, niobium-treated steels and finally nitrogenised
double-reduced steels. The investigator concludes, "Some difficulty has
been experienced in the meaningful interpretation of the results of mecha
nical and tensile tests on the material studied for the report". He goes
on to suggest that the range of testingshould be extended to include
flange tests am. springback tests as a way out of these difficulties.
Parts of this investigation were later published by Jenkins et a1.(14).
Richards et al. (33) of John Lysaght (Australia) Ltd. investigated
recovery rates of cold-reduced low-carbon steel strip with a view to im
proving the ductility of light-weight galvanised structural and building
shapes without impairing their strength. The paper describes the
development of a loop fracture test and its correlation with x-ray

17
line broadening during recovery and recrystallization, but nevertheless,
it does show that partial annealing is being considered for materials
other than tinplate.
The tinplate manufacturers seem to be unanimous in.their opinions
that partial annealing.is outside the capabilities of present-day con-
tinuous annealinglines. o A temperature·control of ± 5 Cto maintain
a hardness range of ± 3 R30T has been mentioned (11). The .investiga-
tions concel~trated mainly on the operational difficulties of partial
annealing. Too little attention has been paid to the corop~riac .. of
mechanical properties of partially annealed materialto temper-rolled
material. It isin this respect that this project was expected to be
most helpful.

18
THEORETlCAL BACKGROUND
Cold Working
A metal may be said to be cold worked if its grains are in a
distorted condition when plastic deformationis completed. This will
usually be the case when the deformation occurs at a temperature lower
than one half of the melting point of the metal, on the sbsolute scale
(34). Certainly, when low-carbon steel is cold worked by rolling st
room temperature, its grains are so severely compressed and the normal
ferrite lattice is so distorted that it is said· to be in a highly
strained state or strain hardened.
Cold working increases the number of vacancies and more important,
the number of dislocations in a metal. Fully annealed ferrite will
contain about 107 dislocation lines per sq.cm. while heavily cold-
12 worked ferrite will contain approximate1y 10 • Since each dislocation
represents a crystal defect with an associated lattice strain, increasing
the dislocation density increases the strain energy of the meta1. Under
an app1ied stress, these dislocation 1ines move along different crystal-
10graphic slip systems, interact with one another and become trapped
thereby increasing the resistance to further deformation. A higher applied
stress is then necessary to force the dislocations to resume movement. In
this manner, the metal becomes progressively stronger and harder with
increased deformation, a process known as strain hardening. The f10w
stress is independent of temperature and is proportiona1 to· the square
root of the dislocation density.
19
When po1ycrysta11ine iron iS.deformed at room temperature, the
random moving dislocations become entang1ed with each other and with
grain boundaries or other obstacles. They begin to form, at abou.t 5%
strain, a cellular structure with a ce11 size of about 3 microns. These
cells are a network of entang1ed dislocations separated by areas of iow
dislocation density. The ce1ls decrease in size with increasing de-
formation, up to about 10% strain, then they maintain a constant diameter
of about 1 micron. After the strain has been increased to 70%,the cel1
walls have become quite densely populated with dislocations, while the
interiors of the cells remain at low dislocation density. This process
of forming cells by dislocation interaction is described by Leslie et
al. (35) and Austin (36). An excellent review of 'strain-hardening
theories is given by Weidersich (37).
The perfection of the cell structure depends upon the impurity
content. In zone-refined iron, the cell walls are sharp but in less
pure iron such as ferrite the walls are thicker and ill-defined. Also,
when there are fine precipita tes or solute atoms present in the matrix
there is an appreciable density of dislocations within the cells. The
o lattice misorientation across a cell wall is about 2 , but these cel1
misorientations are additive, which means that the total range of
misorientation within any one grain that had been cold worked is usually
o large and of the order of 20 , depending upon the amount of strain.

Annealing
(i) Recovery
In recovery, the physical and mechanical properties that suffered
changes as a result of cold working tend to recover their original
values and occurs before the appearance of any new strain-free grains
(38,p.37).
20
It is the increase in the free energy as a result of plastic de
formation that is the driving force for the phenomena observed during
annealing. Among the several measures of recovery which have been em
ployed are, the release of stored energy, the decrease in electrical re
sistivity, the decrease in x-ray line broadening, the changes in mecha
nical properties and most recently, the changes in vacancy concentration
by mass density measurements and the changes in the dislocation density
and distribution. Recovery in iron has been reviewed by Leslie et al.
(35) and in metals generally by Li (39). In most instances, recovery
has beenstudied in relatively pure materials and in single crystals
after small strains. Very litt le data are available on recovery in
polycrystalline iron reduced more than 50%.
Hu (40) has outlined three stages of recovery in his investiga
tions on 3% silicon-iron single crystals which had been cold reduced
80%. These are illustrated schematically in Figure 3 by plotting vacancy
21
concentration and dislocation density versus annealing temperature.
In stage l, the crystal density is the first property to recover with
no change in x-ray line broadening, hardness or microstructure, sugges-
ting that this observed density change is largely due to the annealing
o out of vacancies in the temperature range of 150-190 C. In. stage II,
from 200-S00oC, annihilation and rearrangement of dislocations cons ti-
tute the main process responsible for x-ray 1ine sharpening and a de-
crease in microhardness. In stage III, at annea1ing temperatures .above
SOOoC, major structural differences becomes evident, wel1-defined sub-
grains are formed, and recovery of mechanica1 properties is nearly
complete.
It has been found, with the aid of electron transmission microscopy,
that the changes in properties during recovery stages II and III are
associated with, but not who1ly contro11ed by, a decrease in average dis-
location density of the previous1y co1d-worked materia1. Evidence has
been gained to show that dislocations at the recovery temperatures
become mobile; straighten; those of opposite sign begin to annihila te
each other; and those in the cel1 wa11s rearrange themselves. The dislo-
cations move by cross-slip and climb which are thermally activated
processes, so that recovery is temperature dependent. Dislocation c1imb
is a1so dependent on the number of atomic vacancies present in the meta1
and thus the amount of prior cold working, which determines the amount
of vacancies, will a1so affect recovery rates.

t Vacancy
Concentration
t Dislocation
Density
Vacancies
Dislocations
1 ubgrilin Foration and
Growth
STAGE l STAGE II
o 200 400 600 800
Annealing Temperature, ,oC
Figure 3. Schematic representation of the three
stages of recovery. (40).
t Ràte of
Stored Energy
Evolution \ \ \ --Recovery
\/i'\ ,\
\ , , Recrystallization l '-
l " " Annealing time --
Figure 4. Schematic illustration of the overlspping of recovery and recrystallization in the rate of stored energy evolution
,versus annealing Ume. (41).
22
23
The cell waHs, having become· sharper and well-defined, arenow
termed sub-boundaries. The interi6rs of the cells, now subgrains,
have become nearly dislocation-free but are still the same size as the
dislocation cells of the deformed irone
Dislocation-free subgrains bounded by low-angle sub-boundaries
may be defined as the fini shed product. of recovery, wbile the growth
of these subgrains constitutes the incubation period of recrystalli
zation. It must be p'ointed out that stage III recovery and thestarting
of recrystallization mayoverlap each.other within the same specimen
and thus no distinct line of demarcation would exist between the two
processes (41). Figure 4 schematically illustrates ·this point and
thus for simplicity of explanation, each process is described separately.
(ii) Recrystallization
Primary. recrystallization is defined as the nucleation and growth
of new strain-free grains and the gradual consumption of the cold
worked matrix by the growth of these grains. The growth is accompl1shed
by the migration of the high-angle grain boundaries (38,p.60).
Recrystallization has been shown to be a growthcontrolled process.
There is no random nucleation as in solidification, that is, the forma
tion of nuclei by thermal fluctuations does not occur. The theory of

24
nucleation advanced by Cahn (39,42) which involves the growth of sub
grains to the point at which high-angle boundaries are formed, has been
shown to be essentially correct (3S,p.lS3). The growth of these subgrains,
which constitutes the incubation period of recrystallization, can occur
a~ three types of sites; in the interior of a ferrite grain, at a high
angle boundary, and at an inclusion or second-phase particle.
Hu (40) has obtained direct evidence that subgrain growth in the
interior of ferrite grains is by a process of subgrain coalescence,
which he explained as a gradual moving-out of dislocations from a dis
appearing subgrain boundary into connecting or intersectingboundaries.
This process probably requires some dislocation climb along the disappea
ring subgrain boundary and a rotation of the subgrain itself, by lattice
diffusion, to merge into a common orientatio.n. Further coalescence in
creases the angle of misorientationbetween the now largesubgrain and
its neighbours to form a high-angle boundary. Thus the larger subgrain
.has become a recrystallized grain at an early stage of formation. This
is shown schematically in Figure 5, where the subgrains have coàlesced,
but the original subgrain boundaries within the recrystallized grain R,
are still faintly visible. Segments of ·the interface between Rand
the matrix consist of highly mobile high-angle boundaries and further
growth takes place by migration of these boundaries into the subgrained
matrix.
The effectiveness of previoushigh-angle boundaries as nucleation

25
. sites of recrystallized grains is well established. Beck (43), working
with a1uminum, observed that migrating boundaries may,be traced back
to independent nucleation sites at the original grain boundary that
existed before cold working. Leslie et al. (35, pp. 157-160) . have
confirmed this observation using electron transmissionmicroscopy in
,recrystal1ization studies of cold-worked dilute solid solutions of iron.
The nucleation of recrystallized grains by second-phase partic1es,
oxide inclusions and copper precipita tes in iron, has been observed and
(01
SUBGRAIN STRUCTURE BEFORE NUCLEATION.
(cl FURTHER COALESCENCE OF SUBGRAINS BAND C.
, (bl COALESCENCE OF SUBGRAIN A AND B, AND C AND D.
(dl FORMATION OF A NUCLEUS WITH HIGH ANGLE BOUNDARIES.
Figure 5. Schematic representation for the formation of a recrystallized grain by the coalescence of subgrains (40).

26
an investigation (35,p.167) has shown.that by increasing the number
of inclusions present in a specimen,. its·rate of isothermal recrystal
lization is increased. Although.inclusions or precipita te particles
are known to inhibit the movement of grainboundaries, such inhibi
tion.cannot occur when.the inclusions themselves are preferred sites
of grain nucleation. It is thisnucleation at many inclusion, sites
that will produce a uniform fine-grained structure a~ter recrystalli
zation, as compared with that wherenucleation and growth occurred ::
fromonlya few sites.
The inclusions are assumed to provide regions near their surfaces
in which the lat.tice is relatively undeformed during. working. but SUl'
rounded by highly deformed material. It canbe visualized that a
streamlined plastic flow of metal around a hard incompressibleinclu
sion will leave small areas, forward and behind the inclusion, wherein
the metal is relatively undisturbed whencompared to that which flows
around the inclusion. In addition, the inclusions provide free surfaces
to serve as sinks in which dislocations can run out, thus allowing the
perfection of the lattice in cells bordering the inclusion. The embed
ding of undeformed metal in inclusion mhcrooavities proposed by Burke
and Turnbulll (44), which will serve' as recrystallization nuclei, has
been discounted. The effect of second-phase particles in recrystalli
zation is not restricted to oxide or copper inclusionsas the presence
of cementite particles is the most probable reason for the rapid re
crystallization of low-carbon steels.

After the nucleation of new strain-free gr"ains by one or more of
the afore~entioned mechanisms, they grow into the cold-worked matrix
by the outward migration of their high-angle boundaries. Studies of
recrystallization kinetics, comprehensively reviewed by Burke and
Turnbull (44), showed that recrystallization proceeds by nucleation
and growth to yield sigmoidal isothermal reaction" curves. It was
27
also shawn that the increase in size of any one grain can be measured
in terms of a constant linear rate of growth. Howev er, Leslie et al.
(35,45) found that the rate of linear growth in zone-refined iron
decreased withincreasing annealingtime and favour the explanation
that recovery is competing with growth for the available stored energy.
They explain that after small strains, recovery may be substantially
complete before recrystallization begins, thus leaving a constant
driving force to produce a constant rate of growth; but for heavily
cold-worked iron, recovery may not have ceased before the grains have
impinged upon each other. There is a great need for more work to be
done on the recrysta11ization of iron and Us dilute a 110ys •
(iii) Grain Growth
Grain growth m8y be defined as the gradual increase in the average
grain size upon further annealing after all the cold-worked structure
has been consumed by new recrystallized strain~free grains. When re
crystallization is complete, the main driving force, i.e. the retained
28
energy of deformation, is spent, but the grain structure is notyet
stable because the material still contains grain boundaries having
2 interfacial (or surface) energy of about 500 ergs/cm. When the grain
size increases, the total grain boundary area decreases and conse-
quently the energy of the metal decreases. Grain growththen, is
a function of time and temperature and not of strain or cold working.
Reed-Hill (34, p.199) and Byrne(38) describe the kinetics of grain
growth generally, but literature on grain growth during subcritical
annealing of low-carbon steel seems to be lacking, due mainly to the
very long experimental annealing times necessary since the temperature
must remain below the 7230 C transformation temperature. Most investi-
ga.tions were of a practical nature where ASTM grain size of a parti-
cular grade of steel was plotted against the soaking time of a batch
annealing cycle.
Grain growth is very important in the batch annealing process
and enables production of very soft deep-drawing steels and large-
grained electrical steels. ln continuous strip annealing however, the
very short annealing cycle prevents grain growth and results in a
material which has a finer grain size and therefore harder than the
batch annealed product.
The above description of grain growth is very abreviated and only
the main festures are outlined because of the irrelevance of this

;
1 29
phenomenon to the.work.i~ this thesis. It is self-evident that grain
growth will have no part in a par,tial annealing process.
(iv) Effects of Composition on Annealing Rate
" The effects of solute' elements upon :recrystall:Lzation of heavily
deformed high-purity metals can berepresented qua1itatively'by the
curve of Figure 6. The rate of high-~ngle' boundary. migration drops
Rate' of' Growth o:f Re,crystal1ized
Grains
Strong Influence of Solute on BoundaryMigration
1 Stored Energy Reac .... ~~ __ an Upper Limlt 1 ........
l "
~ncre •• a of Storad Energy becau.. of Presence of Solute
Concentration of Solute --..
F:Lgure 6. The effects of a solute element upon
,recrystal1:Lzat:Lon (35).
2nd Phase AppearB

30
verY,rapidly with the first very small additions of one solute element.
Thb is thought to be due'to a solute atmosphere drag upon the migrating
boundaries and theories on this topic are extensively reviewed by
Gordon and Vandermeer (46). At first, the very small additions do
not cause any measurable increase in the driving force for boundary
migration, but as the concentration increases, the extra stored energy
of deformation due to the effect of solute atoms within the matrix on
strain-hardening mechanisms (37), is sufficient to offset the drag
effect of the solute upon boundary migration. With further increasing
solute content, the stored energy for a given deformation may finaliy
reach a nearly constant value and the rate of recrystallization may
change very little. Beyond this concentration, the limit of solubility
may be reached and an already involved situation is further compli-
cated by the appearance of a second phase (35, p.llS ).
Abrahamson and Blakeney (47) have systematically investigated
the effects of small additions of the transition elements on the re-
crystallizatioo. of irone Their results show a linear increase intheir
defined rec~ystallization temperature with increase in solute up ta
a "critical concentration" where the slope of the Une suddenly lessens.
Considerable controversy over theories and experimental techniques
exists in the explanation of the ra le of solute in recrystallization
studies.

31
The effect of carbon on recovery and recrysta11ization kinetics
of iron has been studied by Ventuel10 et al. (48). These investi
gators doped high-purity iron with up to 86 ppm carbon and found
a marked retardation of recovery but little or no effect on re
crysta11ization. lt was exp1ained that the interstitia1 carbon
interacted strongly with dislocations in the subgrain boundaries
and .. bindered th.eir rearrangement during recovery, but after high
angle boundaries began to move, the carbon had litt le effect on
recrysta11ization. This, according to the Detert and Lücke the ory
(49),\ was because the rate of motion of a grain boundary in the pre
sence of i:mpuritles is controlled by the rate of motion of these im
purities, i.e. their diffusivity. Renee carbon, because of its.'veJ'Y
high mobi1ity, has little effect on.recrystallization. Simi1ar
results'were obtained when nitrogen was used as the interstitial
solute e1ement (50).
Les1ie et al.(45) have studied the effect of manganese on the
recrystal1ization of high-purity iron and found that its addition
decreases the growth rate of any one grain. lt was proposedthat
the Mn atoms diffuse very rapidly during annea1ing to occupy
favourab1e sites at the subgrain boundaries and because of this,
recovery and subsequent grain growth are both inhibited by grain
boundary drag. lt was a1so found that with the addition of manganese
in the amount of 0.30 atomic % or more, a change occurs in the

mechanism of recrystallization. Although the rate of grain growth
decreases with~ime, the rate of recrystal1ization increases with
time. The possibility of Mn - 0 or Mn - S interactions to pro
duce second-phase particles to aid nuc1eation was considered.
Mechanisms of recrystal1ization involving second-phase particles
in iron a1loys are very comp1icated and investigations into these
phenomena are few, but one particu1ar case has received a great
deal of interest because of its commercial ~mportance. The forma
bi1ity of aluminum-ki11ed deep-drawing steel is very much superior
to rimmed steel. This benefit was traced to an e1ongated, pancake
shaped grain structure that occurred in A1-ki11ed steel but not in
rimmed steel; Investigations (51,52,53) into the control of this
desirab1e elongated grain structure confirmed the presence of pre
cipitated a1uminum nitr ide partic1es on the recrysta11ized grain"
boundaries. Further investigations by Goodenow (54) and Jo11ey (55)
using e1ectron transmission microscopy have 1ed to an exp1anation
of how the elongated grains are formed.
During batch annea1ing of the ki11ed steel, the slow heating
32
rate a110ws sufficient time for the a1uminum and nitrogen (in solid
solution in the ferrite), to segregate to the as-ro11ed grain boundaries
and subgrain boundaries before the onset of recrysta11ization. Then,
when recrystal1ization nuc1ei begin to grow, the high-ang1e boundaries
"sweep up" the aluminum and nitrogen from the subgrain boundaries
to form atmospheres which exert a drag on the migrating boundaries.
Eventually the recrystallized grains will reach the original as-rolled
grain baundaries,where there is already a high concentration of alumi
num and nitrogen, and the impurity drag becomes strong enough to
stop the boundary movement. The growth then proceeds only in the
longitudinal direction (with respect to the as-rolled grains )
to produce an elongated recrystallized structure. Shortly after re
crystallizationis complete, the aluminum and nitrogen atmospheres
form aluminum nitride precipitates outliningthe original as-rolled
grain boundaries.
Inhibition of recrystallization is not restrictéd to pre-preci~
pitation clusters or atmospheres of aluminum and nitrogen, for Baird
and Arrowsmith (57) have shown that sulphur in solution is precipi
tated as a fine dispersion of manganese sulphide on the dislocation
substructure. Leslie et al. (56) found similar results in theirwork
on iron with additions of manganese and oxygen. Second-phase partic
les have been shown (35,57) to inhibit recrystallization if they are
smal1er than 0.1 micron but if they are l micron or 1arger in size,
they will promote recrysta11ization by acting as nue1ei. No paper
has been found that dea1s specifica11y with the most eommon seeond
phase partie1e, Fe3C.
33

Plastic Anisotropy
Most forming operations using meta1 sheet are of the nature
where the sheet is required to p1astica11y stretch or bend into a
specifie shape. There are many cases where the meta1 sheet will
not plastica11y deform with equal ease in a11 directions and thus
a measure of its plastic anisotropy is of great importance.
Low-carbon steel sheet exhibits plastic anisotropy in two forms.
The first, p1anar anisotropy, refers to variations in properties
(e.g. in the yie1d strength and ducti1ity ) with directions in the
plane of the sheet. Thus, when a dise is drawn into a cy1indrica1
cup, earing of the rim is an undesirab1e resu1t of planar anisotropy
and its e1imination wou1d be advantageous. The second form, normal
anisotropy, refers to variations in properties between directions in
the plane of the sheet and normal to it; its practical importance
lies in the fact that the resistance of the sheet to thinning during
pressing or drawing operations, is a desirab1e result of its normal
anisotropy.
The width restriction of the steel strip rol1ed in the present
project prevented investigation into planar anisotropy of partial1y
annea1ed materia1, but in order to extract as much information as
possible from the tensi1e tests, a parameter of normal anisotropy in
34

35
the ro11ing direction was obtained. The parameter most commonly used
is the strain ratio "r" or Lankford coefficient (58), which 18 defined
as the ratio of the natura1 strains in the width.and thickness direc-
tions.for a specimen extended in tension:
w .en ~
€ wf
r = ...!. = €t
.t .en ....2
tf
Here Wo and to are the initial width.and thickness whi1e wf and
tf are the final width and thic~~ess of the specimen. It can be
seen that if the width and thickness strains are equa1 the material
is isotropie, but if the width strsin is morethan the thickness strain,
, as it is in a1uminum-ki11ed deep-drawing.stee1s, the material is ani-
sotropic, the r-va1ue being about 1.5.
Mathematica1 treatments (59,60,61) of plastic anisotropy and papers
(62,63,64,65) re1ating. r-va1ues to forming operations are explicite
There areseveral excellent papers (66,67,68,69) re1ating plastic
anisotropy to preferred crysta1lographic orientations of co1d-ro11ed
and annealed steel sheet. Cold-rolling and annealing textures (39,67,
70) were beyond tœ scope of this project.
Instru.::.:ions (63,65,71) on determining the plastic strain ratio
recommend that 1ength strains replace thickness strains (with.the

formula suitab1y rearranged) to enab1e a more accurate determina
tion of the ratio, but the design of the tensi1e specimen used
36
in this project prevented this replacement and thickness measure
ments were used. AU of the previous work has been done on fully
recrystal1ized material andtherefore the strain ratio was usua1ly
determined after 15-20% e1ongation, Again, it was. c1early impos
sible ta comp1y with earlier "standard" methods to obtain the
ratio because partially annea1ed or cold-rolled material have elon
gations as 1aw as 1 or 2%.
For this project, the final width and thickness measurements
were ta ken after fracture on cross-sections sufficiently removed
from the necked region. This implies that the strain ratio is
obtained after maximum uniform strain which varies from 1% to 25%
depending upon the degree of co1d rolling or partial annealing
that the materia1 had received. The usefulness of such a test will
depend upon the comparative resu1ts between the two types of materia1s,
i.e. partially annealed versus cold-rolled.

37
EXPERIMENTAL. PROCEDURE
Introduction
In order to compare partially anJlealed tinplate stockto that
produced conventionally by temper rolling (or by double reducing),
the variation in properties must be found as a function of annealing
temperature and cold reduction, respectively.
~ Cold-rolled low-carbon steel strip of 0.016 in. thickness was
prepared so that portions had received cold reductions ranging from
1 to 80%. The mechanical properties of interest; hardness, yield and
tensile strengths, r-value, and ductility as measured by percent elonga
tion,were obtained so that they could be plotted against percent cold
reduction in order to exhibit the varia.tion in properties of temper
rolled material.
Material to be partially annealed was cold rolled to 0.016 in.,
i.e. a reduction of 82%, then cut into tensile specimens and annealed
o in a salt bath at temperatures ranging from 460 to 620 C. The· same
mechanical properties, outlined above, were obtained so that they could
be plotted against annealing.temperature to exhibit the variation in
properties of partially annealed material. Comparison of say, ductility
at equal strength or hardness of the two differently treated materials,
was then possible.

38
Material
The starting material used for the· experiments was MRU grade low
carbon steel strip supplied in two lots fromthe normal production lines
of the Steel Company of canada Limited.
Lot l, was in the form oÎ hot-rolled strip, 10 ft long, 5 in. wide
and 0.085 in. thick. lt represented material which would normally·be
fed to the cold-rolling mille
Lot 2, the product of the cold-rolling mill, was supplied in the
form of strip 36 in. long, 20 in. wide, and 0.016 in. thick. lt had
been cold reduced 82% from 0.090 in.
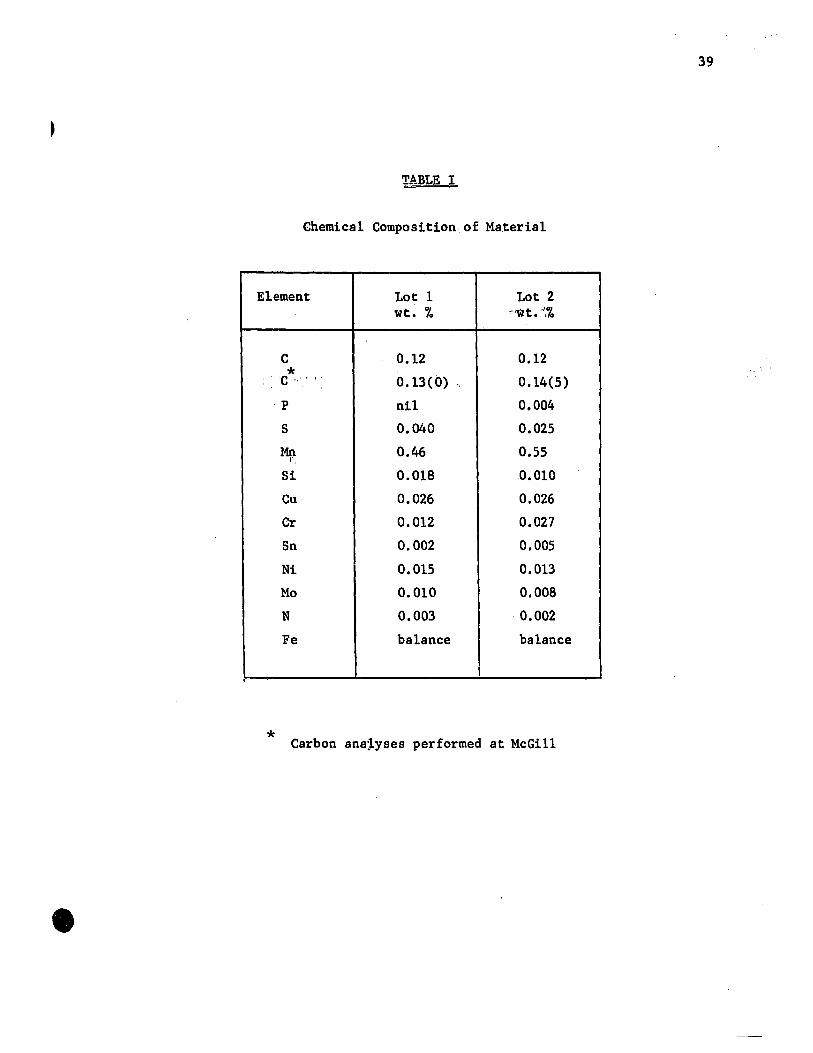
The chemical analyses of the two lots, determined by the Steel
Company of Canada, are given in Table 1. Carbon analyses performed
at McGill, using a Leco analyser coupled to a digital readout system,
are also included in the table.
39
~BLE l
Chemica1 Composition of Materia1
Element Lot 1 Lot 2 wt. % --wt.'d.%
C 0.12 0.12
* 1
'C ,,'" 0.13( 0) " 0.14(5)
p nil 0.004
S 0.040 0.025
Mn 0.46 0.55 r
Si 0.018 0.010
Cu 0.026 0.026
Cr 0.012 0.027
Sn 0.002 0.005
Ni 0.015 0.013
Mo 0.010 0.008
N 0.003 0.002
Fe balance balance
1
* Carbon ana~yses performed at McGi11

40
Test Methods.
This section precedés what might be considered normal chronological
order, so as to aid coherencyin later sections on"temper rolling, partial
annealing and results thereof. Each of these sections willrefer to Test
Methods for procedural details.
(i) Preparation of Tensile Specimens.
Tensile testing specimens were cut from therolling direction of
prepared strip and shaped on a "TENSILKUT" shaping mill to ASTME8 spe
cifications (72). During milling, when the specimens became warm to touch,
tl:ie~ complet"e'templàtè-vice ass;embtyr was cooled in a freezer to avoid any
possibility of artificial aging. The specimens cut from temper-rolled
material were then ready for measurement and testing, while those cut from
the highly cold-reduced material were set aside for partial annealing.
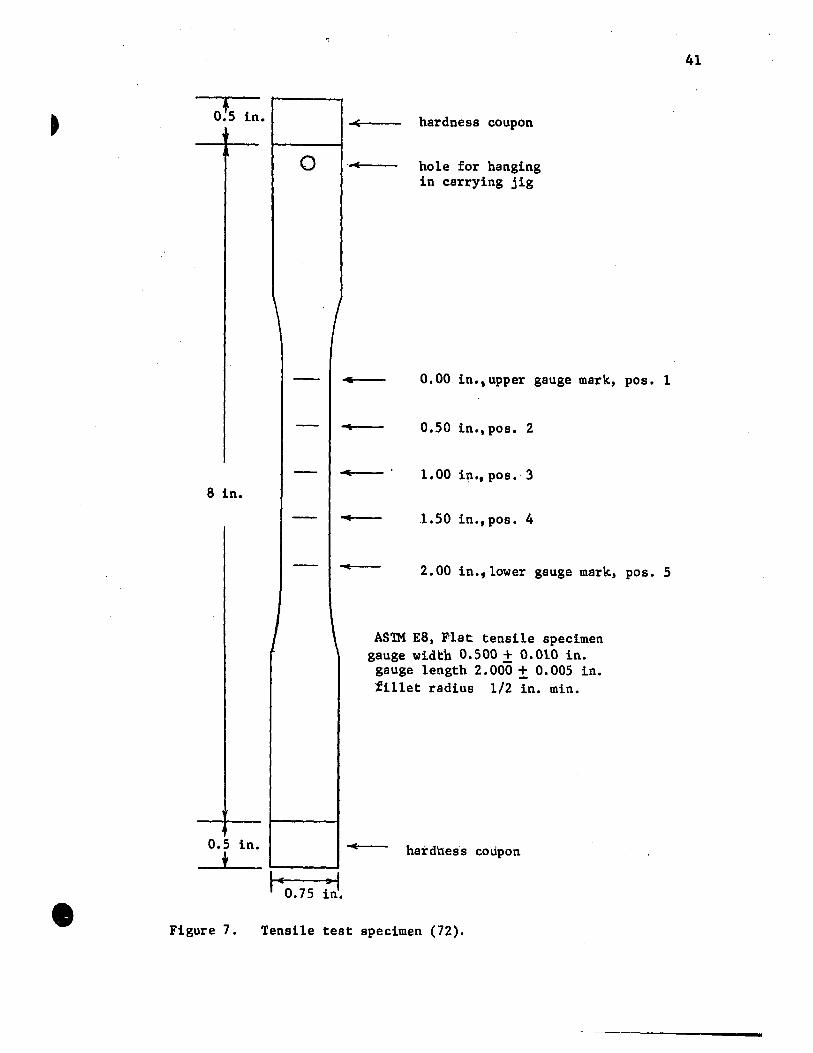
The specimens were very lightly scribed with a vernier height gauge
at the five positions shown in Figure 7. The template of the "TENSILKUT"
shaping mill was designed with a blènded taper of 0.003 in. to insure a
minimum cross-sectional area at the center of the specimen gauge length,
position 3. Width and thickness measurements a"t position. 2,3 and 4 were
made wi th an. "ETALON" micrometer. This precise instrument has anvils of
2.0 mm. diameter and a jewelled dial gauge that can measure toi 0.00002 in.
This allows fourth decimal place accuracy" in measurements while the fifth
e
Of5 in. <
o
8 in.
0.5 in.
* ,,, ~ 1 0.75 in.
. hardness coupon
hole for hanging in carrying jig
0.00 in.,upper gauge mark, pOSe 1
0.50 in., pOSe 2
1.00 in., pos. 3
1.50 in., pos. 4
2.00 in.tlower gauge mark, pOSe 5
ASTM E8, F'lat. tensile specimen gauge width 0.500 ± 0.010 in.
gauge length 2.000 ± 0.005 in. fi11et radius 1/2 in. min.
hardness coUpon
Figure 7. Tensile test specimen (72).
41
42
decimal, place should be enclosed inbrackets to indicate possible error.
Eachwidth measurement .was an average of tbree readings.while each thick
ness measurement was an average of fivereadings taken across·the width
_ of the specimen. Measurements at position 3, the center, were used to
calculate the cross-sectional area of the specimen, while measurements
at position 2 and 4 were used later to calculate the r-values of the
material.
(11) Hardness
Small test coupons were cut from each.end of the tensile specimens.
The hardness of these coupons was measured with a Rockwell Superficial
Hardness Machine, fitted with a hardened steel anvil, on the R 30T scale.
An average of at least five readings per specimen was recorded as speci
men hardness. The hardnesses of the four tensilespecimens from each
rolling.or annea1ing experiment were agâin averaged for an over-all hard
ness value for each experiment.
(i1i) Tensile Testing
Al1 tensile tests were carried out in an Instron TT-D Universal
Testing Machine at room temperature using wedge-action grips. and a cross
head speed of 0.1 in./min. The loads were measured with the standard GR
Instron load-cell whi1e the extensions were measured with a strain gauge
extensometer designed for a 2 in. gauge length. The Instron.cross-head
43
movement, which was equipped with a control dial, and which could be
adjusted and read to ± 0.002 in., was used to calibrate the extenso
meter. This gave an extensometer error of ± O.l~ to ail calculations
of percent elongation,. i.e. elongations quoted as 1.0% or 10.0% should
be read as (1.0 + 0.1)% or (10.0+ 0.1)% respectively, in order to
include the extensometer error. This error was considered well within
the accuracyrange for tensile testing.
An autographic chart ~ecording of load versus extension was ob
tained for each test using an X-Y chart drive system at the greatest
sensitivity consistent with chart size limitations. The extensometer
recorded the entire test up to and includingfracture.
The yield load, taken at 0.2% offset, and the maximum load, were
each divided by the original cross-sectional area of the specimen to
obtain yield strength and tensile strength.
The total and uniform extensions were read directly from the chart
record of each specimen and were defined in the following way. In
Figure 8a, the flat-topped load-extension curve is typical of the higher-
. strength material and its line of proportionality defines the magnitude'
of elastic strain of this material under load. The total extension was
defined as the horizontal distance Et' from the point of fracture to the
line of proportionality. To exclude all localized deformation in the
necked zone, the uniform extension was defined as the horizontal distance Eu'

Load lbs
1000
ML YL
500
o
of proportionality
E u
.... --.----- Et --~ F
E - Uniform extension u
Et - Total extension
F - Fracture
ML - Maximum load YL - Yield load at 0.2% offset
0.040 0.080 0.160
Extension in.
44
Figure. 8a. Load';;extension: curve typical of high-strength material.
500 X
ML ,.~
Load lbs
YL H--+r'f---L_-
250
o
0.040
Change to lower magnification of extension axis
line of proportionality corrected to lower magnification
Extension in.
Figure 8b. Load-extension curve typical of the softer materia1.
from the point where the first perceptible drop from maximum load
was observed, to the line of proportionality. These extensions were
then converted to percent elongations.
45
The load-extension curve of Figure 8b. is typical of the softer
materials. In these more ductilematetials-with, rela.tively . large
elongations--it was necessary to switch to a lower magnificationof
the extension axis over the plastic range of the curve in order to re": .
tain the whole curve on the recording. chart~ To maintain, consistent
and accurate calculations of the yield loads, the magnifica.tion was
.not lowered until well after the yield. Because of this change in mag- '.'
nification, the line of proportionality' had to be corrected to the
slope it would have had at the lower magnification and then the exten
sions Et and Eu were calculated from 'the .char.t.
Observation of the first perceptible drop from maximum load,espe
cially on the long flat-topped curves, was helped by a particular load
following characteristic of the recording. system. Thiaresulted in a
slight dip in the ink-line record at the very start of the load descente
The extensions read fram the charts were compared to those obtained
frommeasuring the specimens in order to assess the accuracies of the
direct and indirect methods. A cathetometer, accurate to ± 0.005 cm.,
was used to measure the five scribe marks on each of thirty specimens,
before and after testing to fracture. The results indicated that the

46
total extensions to fracture, when measured by the cathetometer, were ;
usually a few thou's'andths, ':of an. inchgrel:l.t:er· ,t.han.' tho.se· <;:alcul.ated· from
the charts. This small discrepancy was considered to be dueto errors
made in fitting the broken specimens together. Since the specimens
necked and broke in the centers of the 2 in. gauge lengths, measurement
of uniform extensions proved to be impossible because of the small amount
of specimen length unaffected by necking. The extensions Et and Eu
were therefore obtained from the autographic charts.
The yield strengths, tensile strengths, total and uniformelongations
of the four tensile specimens from each rolling o~ annealing experiment
were averaged.
(iv) Strain Ratio r
Each tensile specimen was designed to break at the center of its
gauge length, position 3, Figure 7. This left positions 2 and 4 suifi
ciently re~oved from the necked region to allow accurate measurements
of width and thickness after fracture in order to calculate r-values.
The twor-values from each specimen were averaged, then the four spe-
cimen values were averaged to obtain an overall r-value for each experiment.
(v) Metallogrpphy
Representative tensile specimens were chosen from both the temper
rolling and partial annealing experiments in order to correlate mechanical

properties with metallurgical microstructures. Longitudinal cross
sections of each of the specimens were mounted in Lucite, then succes
sively ground on 320,400 and 600 grit silicon carbide papers. This
was followed by a poUsh with a slurry of S micron. alumina, on a nylon
covered wheel;. then a final polish on a low-speed "Microcloth"-covered
wheel'with a slurry of 0.3 micron alumina. The microstructure was
revealed by a light etch in 2% nitric acid in alcohol.
Photomicrographs were taken witha Vickers MSS metallogràph on
Kodak Metallographie plates. Plate development was w1th Kodak D-19,
diluted l:l,for 3 min., while Velox contact prints were developed for
1 min. in Dektol diluted 1:2.
47
Preparation of Temper-Rolled Materials
To compare partially annealed stock to that produced by temper
rolling, the mechanical properties of the material must first be found
as a function of percent cold reduction. To eliminatespecimen thick-
48
ness as an experimental parameter, it was necessary. to produce material
of varying thicknesses so that upon.cold rolling to 0.016 in., a range'
of cold reductions could be obtained. The rolling schedule to produce
this material from Lot 1 is shown in Table II.
The 0.085 in. hot-rolled material was first cut into 2.5 x 7. in.
strips and cold rolled in the longitudinal direction to the thicknesses
shown in column 2 of Table II. All cold rollingwas performed on a
STANAT 2-high rolling mill, with.4 in. diameter rolls.
After cold rolling,the material was cut into 9 in. segments and
packed tightly, with the thickest pieces on, the outside, into a stain-
less steel annealing envelope. This envelope of trade name SEN-PAK, allows
scale-free heat treatment of steels in furnaces that are not equipped with
a protective atmosphere generation system. The·rolled steel, within the
envelope, was placed in a Leeds and Northrup Hump furnace and given an
o intermediate anneal for 50 min. at 670 C. Upon cooling from·the annealing
temperature there was a possibility.of ox1dation of the steel from air
that could be sucked into the sealed envelope. To avoid th1s, the' envelope

49
TABLE II
Rolling Schedule to Produce Temper-Rolled Material
Starting Material - Lot l, hot-ro11ed strip, ·0.085 in.
- hardness R 30T 59-61 .. Column 1 2 3 4 5 6
Desirèd Cold Cold Rolled Annea1 Hardness Cold Rolled Final Cold Reduction to ~fter Annea1 to Reduction.
% inches R 30T . inches %
. 0.0157 80.5 80 0.0805 c: 61 ....
70 0.0538 a
55 0.0157 71.0 0
60 0.0400 Ln
58 0.0152 62.0 1 t.)
50 0.0320 0
58 0.0155 . 51.5 0 .... 40 0.0266
\0 59 0.015J ·42.5
~ 1 cu 58 0.0156 32.0 30 0.0229
.-1
20 0.0198 cu
57 0.0150 .24.0 CIl c: 15 0.0177
c: < 57 0.0148 16.5 CIl
57 0.0158 10.5 10 0.0177 ~ cu
' ... 58 0.0158 6.0 5 0.0168 '\j
CIl
1 0.0158(5) ~ 57 0.0157(2) 1.0 CIl ~ c: H
was transferred direetly from the furnaee into a bath.of unstirred
quenehing oil and left for 30 min. When the steel was removed from
the envelope, it was free of oXidation, save for some bluing on. the
edges. The eooling rate was eonsidered mueh too slow to have any
quenehing effeet upon the materi~l.
50
Roekwell superfieial hardness measurements using the ~ 30T seale
were made on eaeh of theannealed segments. As shown in eolumn,4 of
Table II, the hardnesses were within the range of 55-61 R 30!. ·The
lowest value of 55 R 30T was of the segment destined for 70% reduetion.
Mier6seopieal examinationrevealed that all segments were fully sub
eritieally annealed and that the pieee with the lowest hardness had the
largest grain size. This was in aeeordanee with the longestablished
inverse relationship between hardness and grain size of the same
annealed material. The larger grain size of that partieular segment
was due to the effect of a critieal amount of prior eold reduetionon
grain growth during annealing.
The annealed material was th en cold rolled to the finishing thieknes
ses' given in eolumn 5 of Table II. All of the material thicknesses
were measured. with the ETALON micrometer. The final percent cold reduc
tions whieh ranged from 1 to 80 percent are tahulated in,column 6. This
temper-rolled material was then eut and shaped into tensile test specimens.
The mechanical properties were obtained (see Test Methods) and plotted
. against percent cold reduction.

51
Table II is the culmination of a great deal of trial and error to
obtain material that could be tested properly and would be comparable
to that manufactured in a plant. The remainder of this section will
describe some of the difficulties encountered in producing this material.
To produce thin material, it was at first considered necessary to
use a 4-high rolling mill with 0.75 in. diameter workrolls. Rolling
of the steel strip under these conditions proved to be extremely dif
ficult: hand feeding of the material to the mill provided no strip
tension and thus the resulting cold-rolled strip was rippled. When
this material was later tested in a tensile machine, it yielded and
necked prematurely in several different spots which were clearlyre
lated to the ripples. No reliable testing data could be obtained and
the 4-high mill arrangement had to be abandoned. To obtain anyquantity
of thin ripple-free material, 3 coiling" apparatus should be used with
the 4-high mille Switching to a 2-high mill with 4 in. diameter rolls
produced ripple-free material that tested properly.
Difficult~ was also encountered in the choice of a temperature
for the intermediate anneal. It was desirable--in order to be comparable
to industrial practice---to have starting material of the same hardncss
and grain size as that produced commercially in a continuous annealing
line. The hardness range of such material is 58-64 R 3OT. This material,
in conventional temper-rolling practice, would be reduced in thickness

52
by amounts ranging from 1% to'as mu ch as 50%, depending upon the strength
and thickness required in the final product.
However, in order to eliminate grain size variations due to
different prior rolling histories within a batch of material, consi-
deration was given to a heat treatment in the austenitic range, i.e.
at temperatures above 9000 C where the a ~y ~a transformation cycle
would swamp the prior rolling histories. Batches of material heat
o 0 treated between 950 Cand 900 C produced a hardness range of 47-51 R30T.
o This was too soft and it became obvious that no treatment above 900 C
would produce a grain size fine enough to enable the required hardness
range to be met.
o 0 Annealing trials from 720 C to 670 C were however, more successful
in producing a finer grain size, thereby increasing the hardness. Thus
a final batch of cold=rolled material was intermediately annealed at
o 670 C to produce what was considered to be an acceptable 55-61 R 30T
hardness range, after which, the material was cold rolled to the finishing
thicknesses described previously in Table II. The small variation in
grain size, within the batch, due to prior rolling histories was tolerated
and fortunately its effect on.testing results was minimal.

Preparation of Material for Partial Annealing.
Lot 1: To prepare material for partial annealing,the 0.085 in. hot-
rol1ed strip was eut into 2.5 x 7 in. strips and cold rolled, 10ngi
tudinally, to thicknesses of 0.0155 in. and 0.0073 in. to give reduc
tions of 82% and 92% respectively. Most of the partial annealing work
was carried out on 0.0155 in. material. Only five annealing tests on
0.0073 in. material were needed to indicate that the thickness had no
bearing upon the response of the material to partial annealing.
Lot 2: This material had been cold rolled in large-scale plant pro-
53
duetion by the Steel Company of Canada Ltd. It had been cold redueed
82% from 0.090 in. to 0.016 in. and no additional preparation was needed.
In order to compare the properties obtained from partial annealing
with those obtained from temper rolling, variables such as chemical
composition and rolling procedure should be kept constant. This has
been achieved by using Lot 1 for both sets of experiments. Howev er,
Lot 2 represented material cold rolled in plant production and its response
to partial annealing treatments was also of great interest. Th€refore,
the temper-rolling experiments used Lot 1 only, while partial annealing
was performed on both Lots 1 and 2. The highly cold-reduced material
from both lots was eut and shaped into tensile test specimens which were
then used for the partial annealing experiments.
54
Partial Annealing
(i) Technique
To partially anneal tinplate stock, a manufacturer would have to
lower the temperature of his continuous strip anneale~ ~hile main-
taining the stripspeed as high as possible to ensure maximum production.
Since the strip annealer would run at a nearly constant speed, it was
thought best to keep the experimental annealing time constant and of a
convenient 10 min. duration. This was, of necessity, longer than.the
conventional annealing time of 60-90 sec. so as to avoid trânsfer and
measurement errors. A reduction of annealing temperature compensated
for the increased annealingtime and should in no way affect the results
of mechanical testing.
The specimens were'artificially aged for 10 min. at 2000 C after
partial annealing in order to precipitate any excess carbon and nitrogen
left in the alpha solid solution from the annealing treatment. Aging
may not be necessary for specimens annealed below 5400 C but to eliminate
any chance of an aging factor, all annealed specimens were aged.
A preliminary working curve of hardness versus annealing tempera-
ture was first obtained. This entailed taking small test squares of the
material and annealing for 10 min. in a salt bath at temperatures ranging
o 0 from 440 C to 630 C. Using this curve as a guide, five to seven tensile

55
specimens were hung vertically in a jig and totally immersed in a
salt bath. After 10 min. annealing, the jig and specimens were trans-
ferred directly to the aging salt bath.
(ii) Thermocouple Calibration
All temperature measurements were made with a portable chromel-
alumel thermocouple combined with a Leeds and Northrup potentiometer.
The thermocouple was calibrated against the thermal arrest plateaus
on the cooling curves of the pure metals tin, zinc and aluminum. A
thermos flask of ice and water maintained the cold junction st OOC.
(iii) Partial Annealing.
A 5 in. diameter steel cylinder, 14 in. in height, containing the
annealing salt, was placed into a Leeds and Northrup Hump furnace that
had been fitted with a Honeywell "Brown Electronik" controller. The
salt, Houghton Draw Temp 430, was a eutectic mixture of 54% potassium
nitrate and 46% sodium nitrate. A controlling thermoco~ple was placed
between the salt container and the furnace wall to ensure maximum sensi-
tivity to temperature changes. Bath temperature measurements were made
through a hole in the refractory cover with the portable thermocouple. At
the lower temperatures used for partial annealing, there was a difference
o of 1 C between top and bottom of the bath, while at the higher temperatures,
thermal convection eliminated this gradient.

56
A lightly constructed steel jigto carry the ·tensile·specimens,
was made to slide down into the salt container. The specimens were
hung vertically and spaced so that free circulation of salt around~.them
ensured a maximum heat transfer rate. When the jig and specimens
were plunged into the salt bath there was an. initial temperature drop
o of approximately 5 C within the first 30 sec. due to the mass of metal
to beheated. However, after this initial drop there was always less
o than 1 C variation over the lOmin •. annealing.time. Temperature measure-
ments at the center of the bath were made each minute and with practised
manipulation of the controller vàriac, nearlysteady bath temperatures
of ± 0.50 C were achieved. After 10 min. annealing at various tempera
tures within the range 460°C to 6200 C, the jig and specimens were
transferred to the aging bath.
(iv) Artificial Aging.
This second, somewhat larger salt bath, 12 in. in diameter, was
heated by an electric coil within the bath, making continuo us stirring
necessary. A Bristol proportional controller maintained the bath tem-
o perature at 200 ± 1 C. The salt, Houghton Draw Temp 275, was a mixture
of 55% potassium nitrate and 45% sodium nitrite. After a 10 min. aging
.treatment, the jig and specimens were transferred into a bucket of hot
water so that the adherent salt would be dissolved from the specimens.

57
(v) Pickling.
A very thin oxide layer formed on the specimens during annealing
and was removed by pickling in 10% sulphuric acid at 450 c for 1 to 2 min.
A 600 grit water-proof polishing paper was used to remove the black
residue. The specimens were then thoroughly dried to prevent rusting
of the newly polished surfaces.
(vi) Skin Passing.
Ali specimens that were partially annealed ....... even those annealed
at the lower temperatures where only recovery had taken place- had their
upper yield point restored. During subsequent tensile testing, plastic
yielding in the form of Luder's bands, so thinned the specimens that
their cross-sectional areas could not sustain the applied loads and the
specimens broke prematurely. lt was thus necessary to eliminate the
upper yield point and lessen the severity of the Luder's bands by skin
passing* the specimens.
Each annealed specimen was measured for thickness in three positions
along the gauge length with the ETALON micrometer. The specimen was then
carefully passed through the rolls of the 2-high mill several times and
remeasured. Lateral curving and excessive reduction, especially in the
softer material, frequently led to a 108s of one or more specimens in
each annealed set. lt was· found that 1.5% cold reduction W8S needed to
* Skin passing may be· defined as a light cold reductionto eliminate the upper yield point with its associated testing problems, while the term temper rolling is reserved for cold reductions designed to increase the hardness and strength of the steel strip.

58
e1iminate the testing,prob1ems on the 0.016 in. material, whi1e 2.5%
was needed on the 0.007 in. materia1. After skin passing, a11 specimens
o were stored until testing" in a freezer at , -12 C to avoid strain aging.
The mechan1ca1 properties of the partia11y annea1ed materia1
were obtained (see Test Methods) and p10tted against annea1ing temperature.

. RESULTS AND DISCUSSION
Introduction
In this section, the results of the temper-rolling and partial
annealing experiments are presented, mainly in the form of graphs.
59
A comparison of the results of partial annealing to temper rolling,
especially the ductilities at equal strengths or hardnesses, then.':follows
and lastly, the rel'atirinship. between. the mechanical properties and
microstructures of the material is shown by a series of pho.tomicrographs.
Temper Rolling.
The mechanical properties obtained from cold rolling law-carbon
steel strip by various amounts up to 80% reduction are shown in Figures
9 and 10. As expected, there was an increasè in strength and hardness
and a decrease in ductility as the percentage cold reduction was raised.
These variations are due to strain hardening which has been diacussed
previously in the theoretical section. The main purpose of the temper
rolling curves was to serve as standards with which the properties of
partially annealed material could be compared.
Each plotted point of Figures 9 and 10, is the average of four
tensile test results. The spread of the values that were averaged was
very small and of the order of the triangle or square that surrounds the
point. The largest spread of either yield or tens~le strength was 2100 psi

-
.... CD Cl.
120
~
100~
1 , l ,
i ~tà------c ~~ ~ /e~
o g ~ 801-
1-
CIl /~ ./
5 /{;:j 0'
el 0/ >-t:; 40 /
ei 1-1
i E-I
20
~
, • 1 -.- 1 1 , •
-ô
_____ e ----- 0
tà __ c;t----g ----
ô- Tensile Strength
0- Yield Strength (0.2% offset) --
-
--
o 1 1 f -'-._...!.._~_--1._......lI--"""':'
o 10 20 30 40 50 60 70 80 90
PERCENT COLD REDUCTION
Figure 9. The Effect of Cold Rolling on the Tensile and Yield Strengths of Material from Lot 1.
......
o
0\ o

1)
. d ....
N
d ..... t-e
16 .. :z; a ~ :z; 3 12 rz:I
8
4
---"'----'" ~'" ---- "'----'"
o 0 /",/'"
\ Y'" Figure 10.
10 v
o
o o~
The Effect of Cold Rolling on the HardneS8 and Elongation values of Material from Lot 1.
0- Total Elongation
0- Uniform Elongation .
'V- Hardness
~ ~o 0 0 0
o 1 1 0, 0 1 0 ,0 0 ,0---
o 10 20 30 40 50 60 70 80 90
PERCENT COLD REDUCTION
.,.
80
76
72
68 ~ C")
ca
en 64 en
1 60
56
0-1-'
62
and the spreads .in the total and ùniform percent elongations were 1% at
the high values and 0.2% at the low values. Thus, limit bars on the
graphs to indicate the spread of testingresults are not necessary.
The results for temper rolling are tabulated and shown in Tabl'è l of
appendix A.
From Figure 9, it may be seen that the yield strength approaches
the tensile strength as the percent reduction increased and that tbey
became nearly equal after 24% coldreduction. The yield strength in
the range of 60 to 80% reduction can be seen to drop slightly from the
tensile strength; this behaviour appears ta be a testing anomaly where
the radius of the yielding knee of the load-extension curve, Figure 8a,
p.44, becomes slightly larger for materials cold rolled to thebigher
reductions.
Figure 10~ shows that the ductUity drops very rapidly with cold
reduction and that the uniform elongation.reached its minimum value
after only 24% reduction, i.e. at the same reduction as where the
yield strength approached the tensile strength. By way of explanation,
consider a tensile test on a soft material (it may be helpful to refer
to Figure 8b, p.&4), where two opposing factors operate to de termine the
load required for a given plastic extension. The first is the strain
hardening.rate, which is dominant at the smaller extensions and leads
to an increase in load, while the second is the decrease in cross-sectional
area of the specimen as it elongates and leads to a decrease in the

63
required load. At larger extensions, the strain-hardening,rate decreases
and can no longer compensate for the decrease in cross-sectional area so
that the load reaches a maximum and the specimen.becomes plastically un
stab le (73). At this maximum load, any portion of the specimen tha t is
slightly weaker will elongate slightlymore than the reet of the speci
men. This will tend to decrease the cross-sectional area and.increase
the local stress so that further local elongation willoccur,quickly
forming a ,thinned section or neck.
Consider now, rather than a tensile test, a cold-rolling operation
which strain hardens the material and increases its yield strength at a
higbË!r' rate'~t:han l'ts tensile strength. Eventually, with increased percent
reduction, the load needed to cause yielding in a subsequent tensile
test becomes'llearly equal to that which causes necking, 1. e. to the maximum
load from which the tensile strength, is calculated. Remembering that '
uniform elongation is defined as the plastic elongation up to the onset
of necking, it is evident that when the yield strength becomes nearly
equal to the tensile strength, the specimen has very little capacity left
for uniform elongation.
The positions of the curves in Figures 9 and 10, mostly depend upon
the grain size of the startingmaterial. A larger grain size would shift
the strength and hardness curves downwards with respect to their present
positions, while the elongations at the lower cold reductions, would increase
(74). As discussed previously in the temper-rolling procedure, much experi-

e
64
mentation was needed in order to obtain tbe correct grain size (about
0.008 mm. average diameter) ta give tbe desired bardness range of tbe
starting material. Tbis was nece·ssary if the temper-rolling curves were
to serve as comparative standards for partially annealed material.
,

Partial Annealing
The mechanical properties obtained fromthe partial annealing of
82% cold-reduced law-carbon steel strip, st various temperatures for
10 minutes, are shown in':Figures 11 and 12 for Lot l, and in Figures
13 and 14 'for Lot 2. The strengths, both'yield and tensile, and hard-
65
nesses fell as the annealing temperature was raised while the correspon-
ding elongations increased.
As in the case of the temper-rolling curves, each plotted point
on the partial annealing curves, Figures 11 ,to 14, was the average of'
four tensile testresults. The spread of these averaged results was
again very small and thus al1eviated the need for limit bars on the
graphs. o In the range from 545 to 570, .C, where the properties change
most rapidly,and are moat difficult to control, the spread was 'always
less than 3100 psi for the strengths, and 2% for the elongations, i.e.
(20 ± 1)%. The partial annealing,results for Lots 1 and 2 cre tabulated
and shown in Tables II and III respectively, of appendix A.
Inspection of the partial annealing curves shows that with in-
creasing temperature, the material was recovering from its as-rolled
condition up to about 5200 C and then recrystallization began'-'as" ia
evident from the ste~per des cent of the strength curves. One aspect
that may be of commercial importance is that there is a significant
measure of recovery before recrystallization,begins. This may be seen
o from the slopes of the recovery portions of the curves up to 520 C.
Estimatés ,of percent recovery of the mechanical properties up to the onset
of recrystallization are listed in Table III.

ct
.... CD
110
Ilo 100 o o o pof
.. ~ ~ 90
~ en
s ~ 80 ~
... o
~ H fg 70 ~ e-c
60
50
as-co1dD. r011ed
o tL~ ~6
O~D. D~6
O~Ô O~g
\~ Figure 11. The Effect of Annealing 0\
Temperature on the Tensile. \\ and Yield Strengths of Material \~ from Lot 1. 0
6- Tensile Strength
0- . Yield Strength (0.2% offset)
\\ Ô
\'6 O\."-
\~6_ 6
ANNEALING TEMPERATURE, Oc
0, . ~O
~
0\ 0\
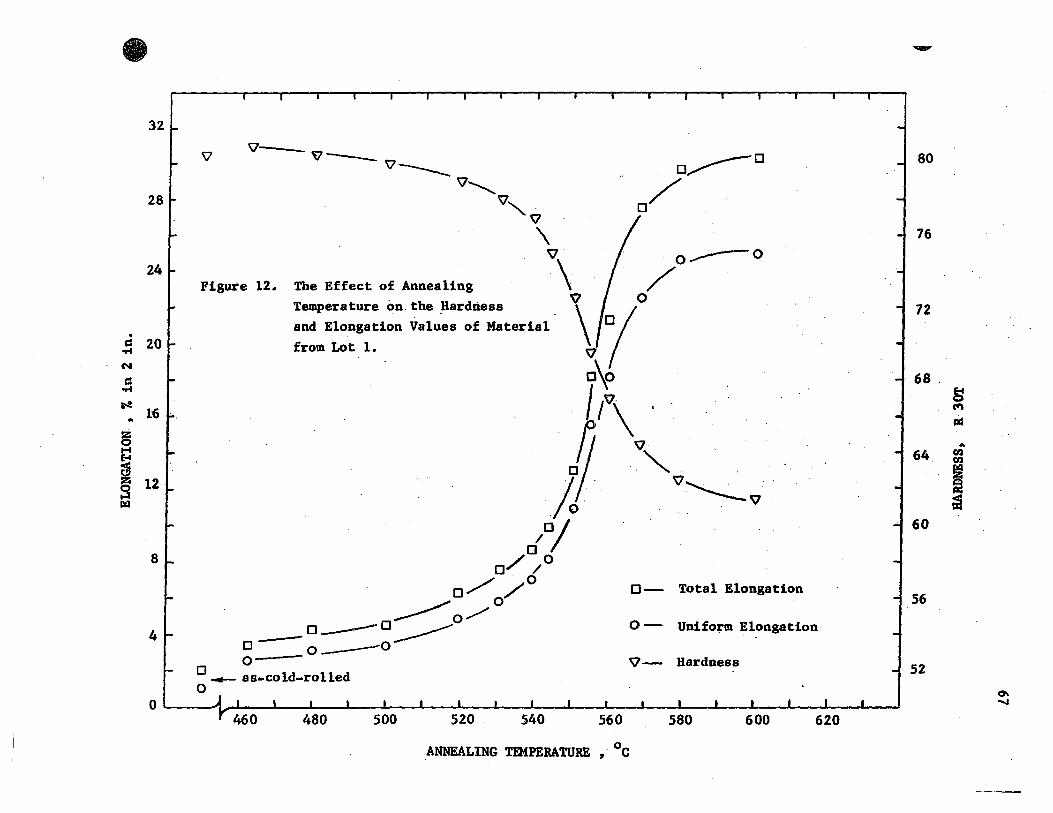
e -32
1 '\l
\7 ~V--\7 ~o J 80 _____ O~
\7............. /' 28 f- '\7"",- . 0
\1 \ -J 76
'V 0""----0
~~ \ / Figure 12. The Effect of Annealing . 'V 0
Temperature on. the ~ardness \ 1 1 72 • and Elongation Values of Materia1 0
~ 20 from Lot 1. 'V
~ 0\0 168 .
:1~ . /l\ l ~ ~ fj. 'V, 64 gf ~ C ., ~ S 12 1 .'. 'V ,-. .' gj ~ /.0' . ----'" iâ
d O/ 60
8L / 0 o / 0/ /0 0- Total Elongation -f
~ 0 56
---- 0/ 4 r _ 0 ____ 0 ______ 0 - Uniform Elongation 0- 0 ___ 0
o 0 'V- Hardness ~ 52 _ as-co1d-rolled
o 0\
0 1 i' 1 ..... 460 480 500 520 540 560
ANNEALING TEMPERATURE,' Oc
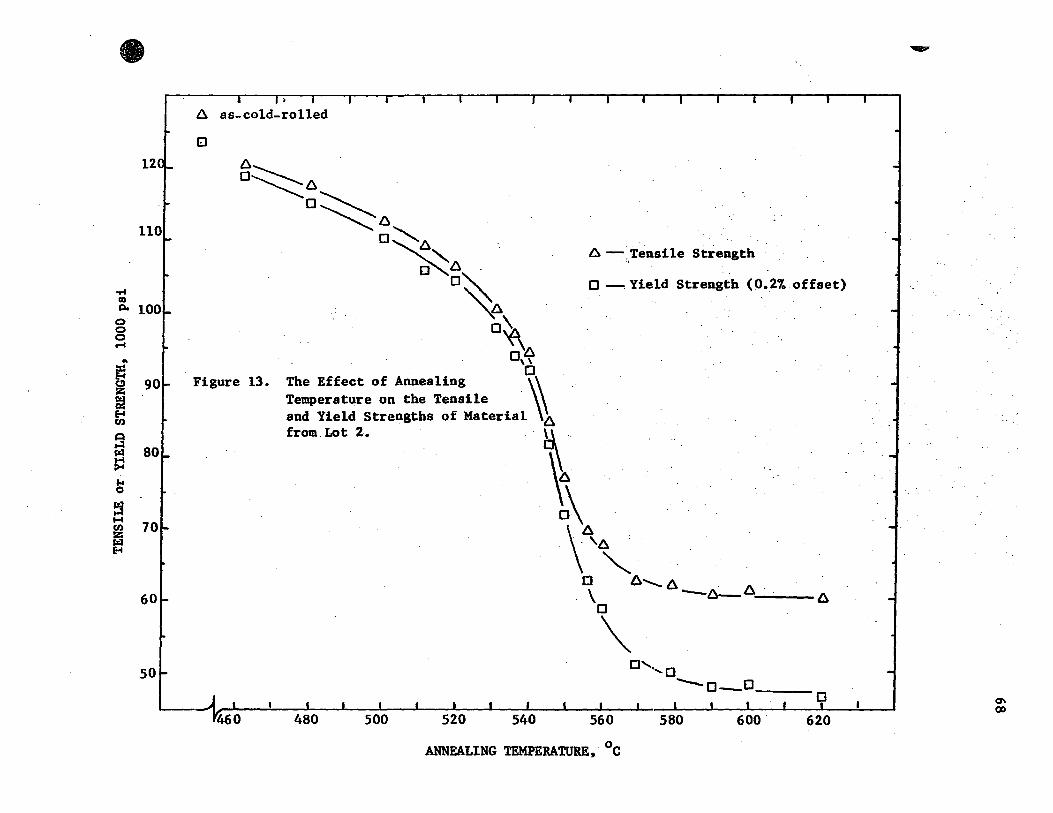
e
12
uo
.... al C.
0 0 0 ~ .. ~ ~ E-4 fi)
~ 80 f:01
!>! ... 0
e3 t-I fi) :z; f:01 E-4
so
Ô as-co1d-ro11ed
o ô .
O~ô .
O~ô ". Ô - ..• Tensi1e Strength o~~ô
OÔ.
o~ 0 -. Yie1d Strength (0.2%ofhet)
o~ O\~
o Figure 13. The Effect of Annealing .~
Temperature on the Tensile \\ and Yield Strengths of Materia1 6 from.Lot2. ï.
~ 0\ \
ô .
"" o 6~ô . \ -ô_ô A o
" 0-.... ...... 0 --0_0 __ _
~460 4~0 sdo S~O S4~ S~O S80 600 620
ANNEALING TEMPERATURE, Oc
-
0\ 00

- .,
32 L" '\7- -" ___ 0 "--("'7 __ 0-v--....... 0 0 ,,-.............. 0/ -1 80
"'-" 28 J- '\. "\ .
Q 1 ....;..-.-0- 0 0 -1 76
\ 1..... 0 /0
24 ~ Figure· 14. The Effect of Annea1ing Temperature on the Hardness and 'V Elongation Va1ùes of Material \,0.
• fram Lot 2. .~ 1 i .72
~ 0 ~
; 16 A "\ : o • ~ 0 . ~
~. y "". ; z 0 .Q :3 12 le . '-.' . . . ~ ~ . ~~ ~
$ 0 -V /aï -f 60
~8~ ° 0/ ,0
/oP 0 - Total Elo~g8t1on 156 ,.,..0/ '
4 1- 0 _ 0 --~ 0 0 - Uniform Elongation o 0 _0---0
o 0- " - Hardtl.ess o - •• -CO~d-rolled J 52
0' ...f,. 1 " '" 580 600 620 ~
ANNEALING TEMPERATURE, Oc

70
TABLE III
Percent Recovery Up To> 5200 C
Property, average After At Fu11y Percent of Lots 1 and 2 Co1d Rolling 5200 C Anneà1eëi .. Recove;r:y
Tensi1e Strength, psi 121,000 104,000 60,000 30
Yie1d Strength, psi 118,000 102,000 48,000 23
Hardness, R 30T 82.5 80 61 12
Total Elongation, % 2 6 31 14
Uniform Elongation, % 1 5 26 15
The percent recover~es of both the total and the uniform elonga-
tions up to the onset of recrystal1ization do not convey two important
facts: firstly, thè total elongation rose from.2 to 6%, a 3 to 1 increase,
and secondly, the uniform elongation increased from 1 to 5%. It thus
appears possible to produce recovered, high-strength material with a
greatly increased ductility over double-reduced material. The range of
cold-fabricated products using recovered (partially annealed) high-strength
material cou1d be expanded because the increased ductility would enable. .
more severe cold forming.
o Recrysta11ization occur~ed above 520 C where new strain-free grains
were nucleated and grew into the recovered matrix. This was accompanied
by major changes in mcchanical properties as shown by the steepness of
..

71
the curve~, but when recrysta11ization was virtua11y complete, by about
o 580 C, the curves become near1y horizontal. These curves are typica1
of the shapes expected from isochrona1 recovery and recrysta11ization
of meta1s.
When the strength curves of Lot 1 are compared to those of Lot 2,
Figures 11 and 13, it may be seen that Lot 2 had a higher initial co1d-
rol1ed strength than Lot l, although each had been cold reduced 82%.
The spread in strengths narrowed with increased annea1ing tamperature
up to 540cC, beyond which temperature the curves superimposed.
The difference in cold-rolled strength between the two lots could
be due to a difference in chemical composition, in grain si~e prior to
rolling, or in the rolling procedure itself. Table l, page 39, shows
that the carbon, manganese and chromium may have caused a minor increase
in the cold-rolled strength of the material by an incressed particle
and solid solution hardening effect. There is no reason to suspect that
there was a significant difference between the two lots of material in
grain size (or hardness) of the hot-rolled strip prior to cold rolling.
Thus, the extra strength of Lot 2 was not considered to be due to a
difference in hot-rolled grain size. However, a major difference between
the two lots was in the cold-rolling procedure where Lot l was rolled
. with a laboratory mill using 4 in. diameter rolls, while Lot 2 was
rolled in large-scale plant production using say, 20 in. diameter rolls.
The effect of roll diameter, strain rate, and reduction per pass during
cold rolling on the strength of the ensuing steel strip is considered
the major reason for the strength difference between the two lots.

Comparison of Partia11y Annea1ed to Temper-Rol1ed Materials.
(i) Comparison of Ductilities
The main objective of the present work was to compare mechanical
properties, especially the ducti1ity, of partia1ly annea1ed to temper
ro1led tinplate stock. The uniform and total elongations have been
compared on the bases of equa1 tensi1e strengths. Figures 15 and 16,
equa1 yie1d strengths, Figures 17 and 18, and equa1 hardnesses, Figures
19 and 20. It is evident from each of these comparisons that partially
annea1ed materia1 has elongations substantially higher than the equi
valent temper-ro1led materia1. Particular attention shou1d be paid to
72
the extraordinary improvement in the uniform e1ongation. Included in
Figures 15 and 17 are the results of partia11y annea1ed 0.007 in. material
(as opposed to 0.016 in.) which show that thickness had no bearing upon
the response of the materia1 to partial annea1ing.
Most succes8ful forming operations using metal sheet depend upon
the ductility of ~he metal before the onset of necking. This ductility,
the uniform elongation, i8 frequent1y not determined even though it may
be more sigpificant than the total elongation to fracture in a8se8sing
the ductility of a particu1ar material. On1y in applications, say in
f1anging or in the forming of lock seams, where the e1ongations are very
local, wou1d there be a use for ducti1ity beyond the onset of necking.
This present work emphasizes uniform e1ongation as a more important measure

32
28
24
• 20 c ....
C'I
Cl .... s-l! 16
.. S ~
. ~ 12 r::I
o
o
60 70
0-
6-
.-0-
80 90
73
Partially Annealed"Lot 2
Partia11y Annealed, Lot 1
Partia11y Annealed, 0.007· in., Lot 1
Temper·Rolled, Lot 1
100 110 120 TENSILE STRENGTH,lOOO psi
Figure 15. Comparison of Uniform Elongations. of Partia11y Annealed to
Temper-Rolled Tinplate Stock at Equal Terisile Strengths.

36
32
28
24
. c
or4 20
~
C or4
r;.l! .. 16 li!'< e E-t
~ 8 12 ~
..:1
ëS 0 E-t
8
4
o
o
0- PartiallyAnnealed, Lot 2
6- Partially Annealed, Lot 1
0- Temper-Rolled, Lot 1
0
0
~ 0
~ {). 0 '-Ô'O '
"~ O~ , 6~ 0 ........ 0
'6 ...... o ........... 0
----0-0--0--0 0
50 60 70 80 90 100 110 120
TENSlLE'STRENGTH, 1000 psi
Figure 16. Comparison of Total Elongations of Partial1y Annea1ed to
Temper-Rol1ed Tinplate Stock st Equsl Tensile Strengths.
74
,1

ci 'ri
N
é
32
28
24
20
'ri 16
4
75
0- Par.tially Annea1ed, Lot 2
6-- Partia11y Annea1ed, Lot 1
.- Partially Annea1ed, 0.007. i~., Lot 1
0- .Temper-Rolled, L~t 1
50 60 70 80 90 100 110
YIELD STRENGTH, 1000 psi
Figure 17. Comparison of Uniform Elongations of Par.tially Annealed to
Temper-Rolled Tinplate Stock at Equal Yield Strengths.
120

76
:32
0- Par·tially Annealed, Lot 2
28 ~--- Partia11y Annealed, Lot l
0--- Temper-Rolled, Lot l
24
. 20 CI ....
N
CI .... o
~ ~o
~O~O
~ 16 .. ~ 1-1
~ 8 12 0 ~ \ g E-t
8
,,~
~, 0, ts.O~ 0"-0 '" ,~ --o ............. 0
""----0·-0-0-0--0
4
YIELD STRENGTH, 1000 psi
Figure 18. Comparisonof Total Elongations of Partially Annealed to ~ Temper-Rolled Tinplate Stock at Equal Yield Strengths.

77
HARDNESS, R 30T
56 60 64 68 72 76 80 84 36~-'--~--~---r--~~'---T---r-~~~~~---r--~~
32
6 0- Par,tia lly Annea led, Lot 2
o~~ 6- 'pa:rtially Annealed, Lot 1
.24 0- Temper-Rolled. Lot 1
6 .
~ è .... 0
IN
è .... 0 c;-.e
\' .. Z ~ 16
~ 0 6 :3 \ ~
~ 12 0 r:r. 6 0 ~
~\ 8
"6 0 ~O '6~ ,0
0 ~OO
'" Ô ~O
\ -0----, 00-0-0 ~
0 56 60 64 68 72 76 80 84
HARDNESS, R 30T
Figure 19. Comparison of UniformElongations of Partially Annealed to Temper-Ro11ed Tinp1ate Stock at Equal Hardness Values.

78
HARDNESS, R 30T
56 60 64 68 72 76 80 84 36 r-~~~~~~-'--~--~---T--~'~-r---r--~--~--~~~
O~T4 ~I 1 1 U lJ J 1" T5f=i 32 . ~ ~- T
6 1--- T7 1-0 Ta
0°'0 ~\ 0 0 - Partially Annealed, Lot 2
'\ 6 - Partially Annealed, Lot 1 OA
28
0- Temper-Rolled, Lot 1
24
. c: ....
C'ol 20 d .... ~ .. ~ 16 t-I E-I ëj Z
S fz;1
t.J 12 ë5
6
\0\ 6 0
o 0 E-I
8
\~ 0, t::hOOo
'" b '0 o ' '--00-0-0-0-
4
HARDNESS, R 30T
Figure 20. Compsrison of Total Elongations of Partially Annealed
to Temper-Rolled Tinplate Stock at Equal Hardness Values.

79
of ductility. but since total elongations aretraditiànally quoted, tbey
have also bean used to compare the ductilities.
In comparing the elongations of eachtype of material, tbree bases
were usedi tensile strength, yield strength.and hardness. The validity
and usefulness of these criteria dependuponthe needs·of the tinplate
producer and of the canmakar. Eq9al tensile·strength wasconsidered an
important criterion for comparison of ductility, since uniform.elongation
and tensile strength are depend~nt upon the strain-hardening ability of
the material. Clearly, in cold-forming operationsusing metal sheet,
the uniform elongation ceases at the point of maximum load from which
the tensile strength is calculated, and thus a comparison at equal tensile
strengths could indicate relative cold-forming ability. Howev er, it is
the yield strengtbof the mate~ial that is the major consideration in
applications such as pressure pack cans, where yielding or expansion of
the can during use is undesirable. A canmaker then, would be interested
inboth equal tensile and equal yield strengths as comparative bases for
ductility.
Hardness messurements (R'30T), form the basis of production control
and temper classification of continuously annealed strip. It was primarily
for these ressons that equal hardness was also used as a comparative
basis for the ductility of temper-rolled and partially annealed material.
The hardness ranges for tempers 4 to 8 are indicated on. the elongation

80
versus hardness graphs of Figures 19 and 20 mainly to serve as a guide to
the comparative ductilities for each temper. There are serious doubts
however, about the usefulness of the equal hardness basis as an experi
mental method for research. Superficial hardness tests (R 30T) do not
appear particularly sensitive and if there was any amount of scatter in
either the hardness or' elongation results, Figure 20, one might be led
to an erroneous conclusion about the comparative ductilities. Uniform
elongations at equal tensile or equa1 yield strengths appear to be the
hest ways to compare partia11y annealed te temper-rolled material.
The curves in Figure 15, form an almost closed loop and would have
done so exactly if the grain size of the starting material for temper
ro1ling had been equa1 to that which resu1ted from the annealing ex
periments. Starting material grain sizes larger than that resulting
from the annealing experiments, open the top end of the loop by changing
the slope of the temper-rolling curve in the manner shown in Figure 21.
A material with a large grain size strain hardens more uniformly over
its plastic range and so loses its ductility during cold rolling at a
lower rate than material with a fine grain size (69,74). There is also
the Hall-Petch equation (74) which shows that the strength of the material
will decrease with increasing grain size. Thus, from a combination of
the above two facts, the shape of the temper-rol1ing curve, Figures 15 and
21, is related to the grain size of the starting material. It was later
realized after an examination of all of the results, that a completely

\ Increasing Initial ,"-Grain Size \ . \ \ \"-. \ \ \ ~
\ \
\
Temper-Rollin Curve
Partial Annealing.Curve
TENSlLE STRENGTH
81
Figure 21. Effect of Grain Size on Temper-Rolled Material.
closed loop would have been ensured if the intermediate anneal given
to the starting material for temper rolling (Table II, p.49) had been
o at a somewhat lower temperature than 670 C.
Comparison of the ductilities of the very soft materials resulting
from either temper rolling or partial annealing is sensitive to a difference
in grain size between the starting and fini shed materials of the two pro-
cesses. An error resulting from non-closure of the loop i8 a distinct possi-
bility but it would be significant only if the gap was wide and if the very
soft materials were being compared. However, no error due to a grain size
difference is encounted when comparing the stronger materials above a tensile
strength of 70,000 psi which are of more practical int'erest.
The increased ductility of partially annealed material may be
theoretically explained in terms of dislocation interactions during cold
working, recovery and recrystallization. Consider for example, (a) temper-
rolled material cold reduced 50% to obtain a tensile strength of 96,000
psi and a yi~ld strength of 95,000 psi in comparison with (b), partially "
annealed material which had been initially cold reduced 82% to a tensile
strength of 116,000 psi, then annealed for la min. at 5300 C to produce
the equivalent material.
(a) During temper rolling, the material developed a cold-worked cellular
structure with a high density of dislocations in the cell walls and in
the cell interiors. This high dislocation density, especially in the
interiors of the cells, impeded further dislocation motion end as a
result, during tensile testing or any other type of cold forming, the
material could not strain harden rapidly enough to offset the start of
necking.· 'Ibis material had less than 1% uniform elongation.
(b) After an initial cold reduction of 82%, this second material was
stronger, had a higher dislocation density and also had less than 1%
uniform elongation. During partial annealing, recovery mechanisms re-
duced the dislocation density of the cells and formed subgrains with
nearly dislocation-free interiors. The tensile strength of the material
was reduced by recovery to the desired 96,000 psi and the yield strength,
while reduced accordingly, remained near the tensile strength at 95,000
psL When this material was tested in tension (or cold fabricated), the sub-
83
grains had the capacity to strain harden at a rate which prevented necking
for a considerable amount of strain. Thus, this materia1 of equa1 tensi1e
strength and equa1 yie1d strength had a uniform e1ongation of 6% as op
posed to 1ess than 1% for temper-ro11ed materia1.
If the partial annealing process had been continued past recovery
to enable new strâin-free recrystallized grains to nuc1eate and grow
into the recovered matrix, the dislocation density wou1d decrease even
further. Also, since growing strain-free grains :·.increase in size and
volume, the.yjé1d strength would fall from the tensi1e strength in pro
portion to the percent recrystallization. This lower dislocation den
sity and increased strain-free volume wou1d a1low the materia1 to flow
plastica11y at a lower stress leve1; to strain harden at a more uniform
rate;· and to elongate uniform1y over a greater stress range than temper
ro11ed material of equa1 tensi1e strength.
(ii) Comparison of Yie1d-to-Tensi1e Strength Ratios
The yield-to-tensile strength ratio can be associated with the
amount of plastic f10w that can occur in a metal sheet before fracture.
In forming operations which require considerable plastic f10w of the
meta1, a low value of the ratio is desirab1e in order that the material
may yie1d at a relative1y low stress leve1, then work harden duringelonga
tion (forming) up to its tensile strength. Conversely, a high value of
the ratio indicates that the material yie1ds near the tensile strength
and has very litt le capacity for uniform e1ongation.
84
When the yield-to~tensile strength ratios of partially annealed
and temper-rolled materials are plotted against tensile 'strength, as
in Figure 22, it may be seen that the ratio for partially annealed
material is always less than that for temper-rolled material at equal
tensile strengths. This lower ratio supports the theoretical explana
tion for increased ductility put forward in the previous section. The
ratio for the temper-rolled material msy be se en to decrease from
nearly unit y st the higher strength levels, but this is due to the
testing anomsly discussed previously in the section on the results of
temper rolling. Also, the fact that the elongation values at these
high strength levelsremain at their minimum, indicates that the curve
should have continued horizontally at a value near uni~y.
Thus, with a lower yield-to-tensile strength.ratio at equal tensile
strength, it could be expected that partially annealed material would
have an improved capacity for cold fabricationover temper-rolled material
of any strength level.
(iii) Compsrison of Strain Ratios
The strain ratio r, a parameter of normal plastie anisot~opy, defined
previously in the theoretical section as the ratio of natural strains
in the width and thickness directions for a specimen extended in tension,
is a direct measurement of the resistance of the sheet to thinning during
a forming operation. The r-values for the temper-rolled and partiâlly

1:.00
0.92
~. 0.84 1-1
~ E-4 1
~ è 0.80 t:o:I
~
0.76
0.72
85
o
o 0- Partially Annealed, Lot 2
.6- Partially Annea1ed, Lot 1
t::C::l ()
,1/ 0- Temper-Ro11ed, Lot 1
/SJ)
1 o
o
50 60 70 .80 90 100 110 120 130
TENSlLE STRENGTH, 1000 psi
Figure 22.Comparison of Yield-to-Tensile Strength Ratios of Partially
Annealed to Temper-Rol1ed Tinplate Stock at Equal Tensile Strellgth

86
annealed materials are listed in Tables l,II and III of appendix A.
A comparison of the strain ratios of partially annealed to temper-
rolled material at equal tensile strengths ia shawn in Figure 23. It
maybe seen.that only the very soft, fully annealed materials behave
in a nearly. isotropic manner (r~l);both partially annealed and
temper-rolled materials have r-values between 0.4 and 0.7, i.e. they
thin more·readily in the thickness direction than in the width direction.
From.these results, it must be concluded that partial annealing holds
no advantage over temper rolling so far as the ~esiBtance to thinning
is concerned*.
The two points designated CR in Figure 23, represent the cold-
rolled starting material from each lot and it may be seen that the
r-value decreased after a small amount of recovery. This may be ex-
plained by the fact that all of the heat-treated specimens had their upper
yield point restored and that even after skin'passing, several small
Lûder's bands travelled along the specimen during.tensile testing.
These Luder's bands decreased the cross-sectional area of the specimen
homogeneously, i.e. they thinned the specimen in the width and thickness
* Blickwede (69) indicates that an,r-value below 1.0 should be expected for the fine-grained material produced in this work. Burns and Heyer (66) found an r-value of 0.50 for 60% cold-reduced rimmed steel recovered at 4550 C. Since the r-values of this present work agree with values obtained by others, the unconventional method used in this project to obtain these values may be said to present a fair and just assessment of the matetials.

87
1.2
0- Temper-Ro11ed, Lot 1
1.0 A- Partia11y Annea1ed, Lot 1
'*- 0- Partially Annealed, Lot 2
~ CR - As-Cold-Rolled, Starting Material
0.8 for Partial Annealing
~ \: 0 0 CR I-t
0 CI
~ •
0.6 CI 1 , :zoo A'A 1 C~ I-t
:! ~ A A t 0 /
E-t " en 0 O_A ~ 0.4 0 0 0
oL-~--~--~--~~~~--~--~--~~--~--~--~~--~---' 50 60 70 80 90 100 110 120
TENSlLE STRENGTH, 1000 psi
. Figure 23. Comparison of .Strain Ratios of Partia11y Annealed to Temper-
Rolled Tinplate Stock at Equal Tensile Strengths.

directions bythe same amount. Since the specimen. thick~ess was very
smaU when compared to its width, an exaggerated thickness strain
resulted and thus a lower· .. r-value wasrecorded •. The temper-rolled
material, on the other hand, did not exhibit Luder'sbands and thus
the r-values for this material could be considered more cor~ect.
(iv) Comparison of Microstructures
88
Representative tensile specimens fromLot 1 were chosen to correlate·
mechanical properties with microstructures and to compare the micro-
structures of partially annealed to temper-rolled material at similar
tensile strengths. The specimens were chosen in the msnner shown in
Figure 2&, where pairs nearly equal instrengths, have been matched and
identified by the letters s to g. Figures 25 (a-g), upper photomicro-
graphs, illustrate the partially annealed microstructures of materials
decreasing in strength. Figures 26 (a-g), lower photomicrographs, are
of the equivalent temper-rolled materials.
The partially annealed specimens show the various stages of recovery
and recrystallization. Attention is drawn to the facts that the re-
covered material etches faster and darker than cold-worked material and
that the inclusion shown in Figure 25b, nucleated the first strain-free
grain which had begun to grow into the recovered matr~x. The temper-
rolled specimens are seen to consist of grains that become increasingly 1
distorted in the rolling direction as the amount of cold reduction is
increased.

89
Figures 25g and 26g· illustrate the difference in grain .. size between
. the finished .. material from· the annea·ling. experiments and the starting
:material for temper ro11tng. T~e average grain.diameterswere estimated
by the intercept method and are given.with each pbotomicrograp,l1. These
microstructures are typical of subcritically annealed low-carbon steel
strip in,w.l1ich the grain size iD very fine and the cementite par.ticles
.appear as str~ngersparallel.to the cold-rolling.direction.

90
0 g
\ \ \ 6- PaTtia1ly Annealed, Lot 1 \
\ 0- Temper-Rol1ed, Lot 1 24 t\ 20
j 6\ .
d .... (:) N t\ d .... 16 1 (:) tJ! 1
~6 .. 0 1 ~ 1 1-1 1 E-4 1 ~ 12 1
1 S le f:I:l 1
t~ ~ 1 1 1
rr.. 8 1 § 1 : 6 1 ,
l "6 J 1
1 ~'6 4 t Id 1 r' .. ,
o \ 1 1 t'6 ~' :e lb ...... t;
1 t r \ . 0-6 0-6~o-b 0
0 50 60 70 80 90 100 110 120
TENSlLE STRENGTH, 1000 psi
Figure 24 •. Selection of Specimens for Metallographie Examination •. 1
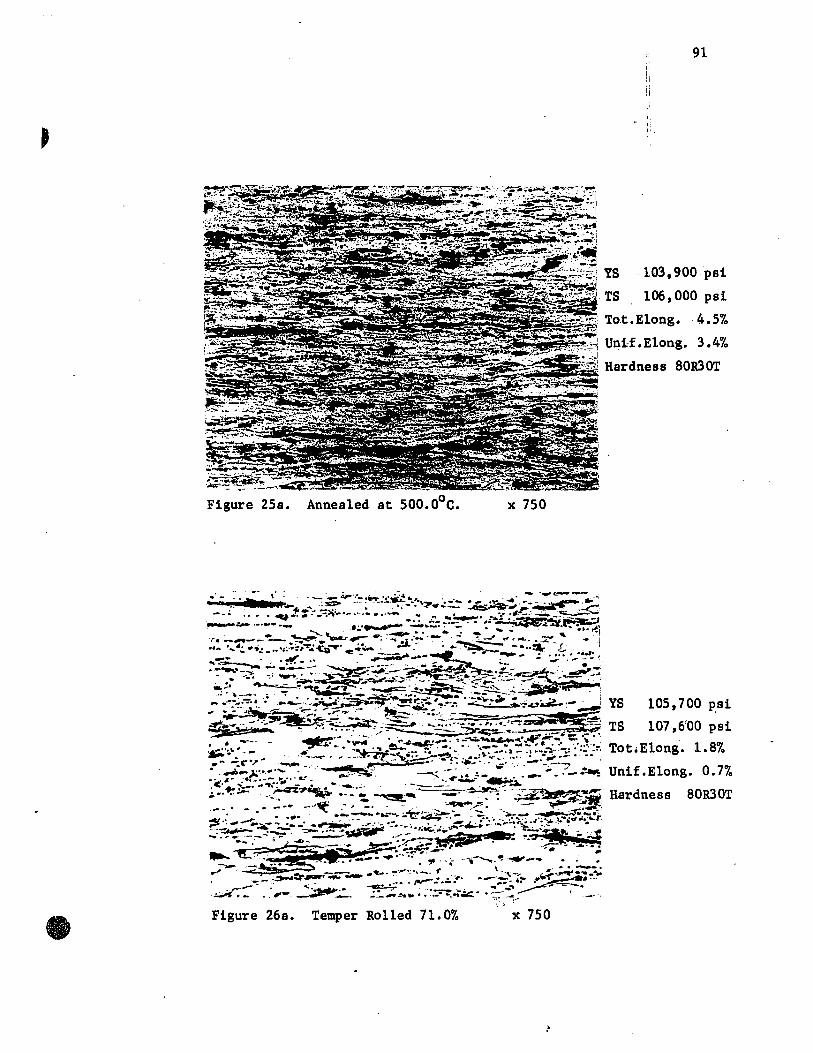
Figure 25a. Annea1ed at 500.0oC.
Figure 26a. Temper Ro11ed 71.0%
91
YS 103,900 psi
TS 106,000 psi
Tot.E1ong.
Unif.E1ong.
4.5%
3.4%
, Hardness 80RJOT ~~;.;
x 750
x 750
YS 105,700 p.si
TS 107,6'00 psi
1.8% Tot.E1ang.
Unif.E1ong. 0.7%
Hardness 80RJOT

Figure 25a. Annealed at 500.0oC. x 750
(-) Figure 26a. Temper Rol1ed 71.0% x 750
91
YS 103,900 psi
TS 106,000 psi
Tot.Elong.
Unif.Elong.
4.5%
3.4%
Hardness BORJOT
YS 105 , 7 00 ps i
TS 107,600 psi
Tot.E1ong. 1.B%
Unif.Elong. 0.7%
Hardness BOR30T

Figure 25b.
Figure 26b.
Annes1ed st o 519.5 c.
Temper Ro11ed 62.0%
x 750
x 750
YS
TS
92
98,500 psi
,101,000 psi
Tot.Elong.
Unif .Elong.
6.3%
4.9%
Hardness 79R3OT
YS 99,200 psi
TS 101,800 psi
Tot.E1ong. 2.0%
Unif.E1ong. 0.8%
Hardness 78R30T

~",,~ .. " '.:.: .. _.-:-.-~~. '~".-
-..
. ~~ . ..;. --\.
", .. ~ -~ - - ~ .. ,- .. ~~~-~ ~
~~i;.~:.·_ ;~~~T~~J:§.;~;,h ooi- ..... :....._ -<~~- .=.,. Ir."~ ' •. '-' .;..-~. '.:~--;..,... '/ .:;"_-."~;ew"."":"" ...... ~~: .... .-.;,;. :" '. . .. ~::.. .~ ... ~~7..~_~_~;:-: ... ..::...;~~ .. !:'!-.:;.. ~_., .... :._!!..~ "~~"_ ....... -'_·ïl -I~'" lA. ~ .-:--; .
:~';7:'';:;;,5'';;'';;;;;''~;:;' . }~~(~;:'~'~'::!~:!: ~.~~~:,?-. __ '~_" _. __ .. -"'" ~"Io ." --... • '-• .--
~ ..... '~ -.: ""-·':::"':"':.--::"'_~I:~_·<-~~-- - - ~': .. _-:~~. _.,:..;..~
c Figure 26b. Temper Ro11ed 62.0% x 750
92
YS 98,500 psi
TS 101,000 psi
Tot.E1ong. 6.3%
Unif .E1ong. 4.9%
Hardness 79R30T
YS 99,200 psi
TS 101,800 psi
Tot.E1ang. 2.0%
Unif.E1ong. 0.8%
Hardness 78R30T
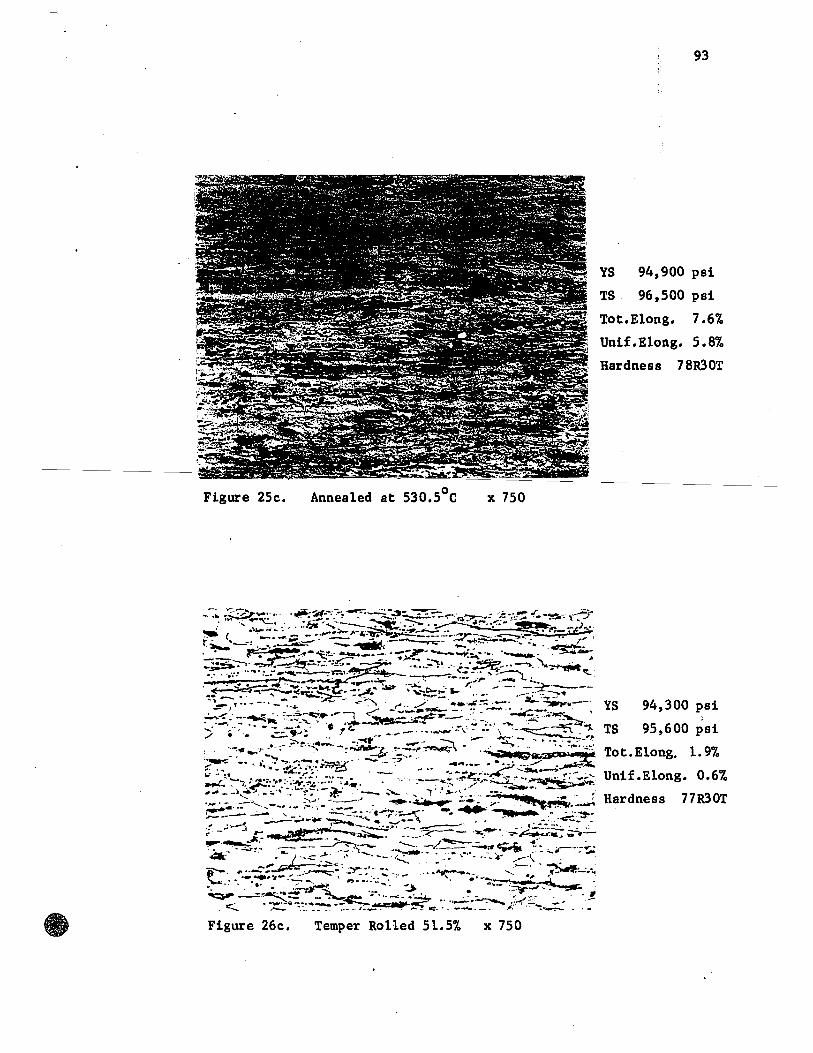
Figure 25c. o Annea1ed at 530.5 C
Temper Ro11ed 51.5%
x 750
x 750
93
YS 94,900 psi
TS 96,500 psi
7.6% Tot.E1ong.
Unif.E1ong. 5.8%
Hardness 78R30T
YS 94,300 psi
TS 95,600 psi
Tot.E1ong. 1. 9%
Unif.Elong. 0.6%
Hardness 77R3OT

Figure 25c. Annealed at 530.5 0 C x 750
Figure 26c. Temper Rol1ed 51.5% x 750
93
YS 94,900 psi
TS 96,500 psi
Tot.E1ong. 7.6%
Unif.Elong. 5.8%
Hardness 78R30T
YS 94,300 psi
TS 95,600 psi
Tot. Elong. 1.9%
Unif.Elong. 0.6%
Hardness 77R30T

Figure 25d.
Figure 26d.
Annealed at o 550.5 C.
Temper Rolled 32.0%.
x 750
x 750
1J!It'.G~
94
·YS 79,000 psi
TS 81,900 psi
Tr.>t. Elong, 13.0%
Unif.E1ong. 10.9%
Hardness 73R3OT

Figure 25d.
Figure 26d.
Annea1ed at o 550.5 c.
Temper Ro11ed 32.0%.
x 750
x 750
94
YS 79,000 psi
TS 81,900 psi
Tot.E1ong,
Unif.E1ong.
13.0%
10.9%
Hardness 73R30T
YS 81,800 psi
TS 82,700 psi
Tot. Elong. 2.8%
Unif.E1ong. 0.7%
Hardness 74R30T

Figure 25e.
Figure 26e.
o Annealed at 560.0 c. x 750
temper"Rolled 16.5% x 750
95
YS 63,700 psi
TS 69,700 psi
Tot.Elong. 21.3%
Unif.Elong. 18.1%
Hardness 67R30T
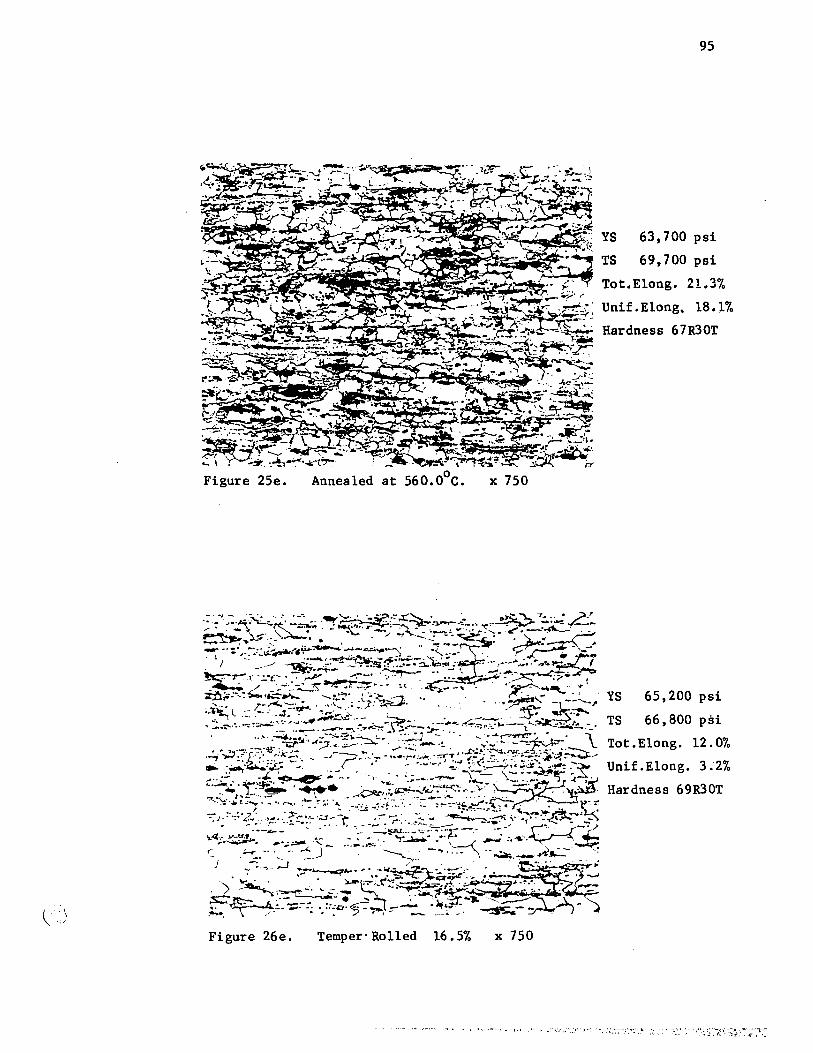
( : \
\..)
Figure 26e. TemperoRo11ed 16.5%
x 750
x 750
95
YS 63,700 psi
TS 69,700 psi
Tot.E1ong. 21.3%
Unif.E1ong, 18.1%
Hardness 67R30T
YS 65,200 psi
TS 66,800 psi
Tot.E1ong. 12.0%
Unif.E1ong. 3:2%
Hardness 69R30T

Figure 25f.
Figure 26f.
o Annealed at 579.0 C.
Temper Rolled 6.0%.
96
49,500 psi
x 750

Figure 25f.
Figure 26f.
o Annealed at 579.0 C.
Temper Rolled 6.0%.
x 750
x 750
96
YS 49,500 psi
TS 60,600 psi
Tot.Elong. 29.7%
Unif.Elong. 24.6%
Rardness 63R30T
YS 50,500 psi
TS 58,800 psi
Tot~Elong. 27.8%
Unif.Elong. 20.9%
Rardness 63R30T

Figure 26g. Temper Rolled 1%. x 750
97
YS 4l,800'psi TS 55,600 psi Tot.Elong. 35.2% Unif.Elong. 29.1% Hardness 57R30T Average Grain
Diameter 0.008 mm. AS'IM No. 11
LilUÜ'éGI

c···.···:· ,',' \
~..:. ',;1
Figure 26g. Teoper Ro11ed 1%. x 750
97
YS 47,600 psi
TS 60,100 psi Tot.E1ang. 30.3'70 Unif.Elong. 24.9% Hardness 61R30T Average Grain
Diameter 0.006 mm ASTM No.12
YS 41,800 psi TS 55,600 psi Tot.Elong. 35.2% Unif.E1ong. 29.1% Hardness 57R30T Average Grain
Diameter 0.008 mm.
AS'lM No. 11
1

SUMMARY AND CONCLUSIONS
Summary
Materia1 that had been co1d reduced 82% by rolling was annealed
at various temperatures to produce the full strength spectrum that
cou1d be obtained from a continuous annealing line. The mechanical
properties of this partia11y annealed material were compared to those
of materia1 that had been temper ro11edby various amounts to equi
valent strengths.
It was found that:
1. As the percentage co1d reduction of the temper-ro1led materia1
was raised, there was an increase in strength and hardness but a very
rapid decrease in ductility. After 24% reduction, the ducti1ity
remained at its minimum of 1ess than 1%.
98
2. The strength and hardness of partia1ly annea1ed materia1 fel1 from
the as-ro11ed values as the annea1ing temperature waB raised, whi1e the
corresponding ductility increased. Microstructural recovery before
the onset of recrystallization accounted for a 30% recovery of strength
and a three to five times increase in ducti1ity, over the as-rolled
value~.
3. There~anextraordinary improvement in ducti1ity, eapecially uniform
elongation, of partially annea1ed material over that temper rolled to an
equivalent tensile strength. Simi1ar resu1ts were obtained when yield
strength and hardness were bases of comparison.

~99
4. The yield-to-tensi1e strength ratio for partially annealed material
was always less than that for temper-rolledmaterial of. equal tensi1e
strength. This would indicate animproved capa city for cold fabrication.
5. Partial annealing. holds no advantage over temper rolling so. far as
the resistance to thinningduring.forming is concerned. T~e strain
. ratio values for each. process were about 0.6.
6. The difference in ductility between the two materials at equal strengths
can be visually correlated te) a difference in microstructure.

100
Industria1 Implications.
Thin high-strength tinp1ate is being produced by the doub1e-re-
duction process. The capital cost of say, a three-stand mi11 to hand1e
the second co1d reduction, may prove for many producers to be prohibitive.
The most important practica1 resu1t of this investigation is that superior
materia1 can be produced using the existing ro11ing equipment without the
need of a heavy second co1d reduction. In fact, it is the e1imination
of this second reduction in favour of partial annesting that is responsib1e
for the 8uperiority of the materia1.
Temper-ro11ed materia1, simi1ar to that doub1e-reduced, i8 compared
to partia11y annea1ed materia1 at strength 1eveis of 90,000 and 100,000 psi,
in Table IV.
TABLE IV
Comparison of Mechanica1 Properties: - Lot 1
Temper-Rolled Partia11y Annea1ed
TS psi 101,800 101,000
YS psi 99,200 98,500
Tot. Elong. % 2.0 6.3
Unif. Elong. fil 0.8 4.9 f.
Hardness R 30T 78 79
TS psi 92,100 93,700 YS psi 91,500 91,900
Tot~ Elông. % 1.9 8.7
UnU. E1ong, % 0.6 7.0
Hardnes8 R 30T 76.5 77
Tinplate stock has been used as an appropriate and timely example
to illustrate the advantages gained from partial annealing. However,
an expanded range of cold-fabricated products using partially annealed
high-strength ma~erial is possible because the greatly increased duc ti-
lit y would enable more severe cold forming. Corru$ated sheet, large
bulk containers, light structural or curtain-type steel walls are but
just a few future applications.
101
Production of partially annealed material on present-day conti,nuQus
annealing lines appears possible. Referring to Figure 14, page 69, it
can be seen that at a hardness of 73 R30T, the mechanical properties of
Lot 2 change most rapidly with annealing temperature. If a very stringent
hardness control of ± 1 R30T at this point was to be applied, then the
o 'lO annealing temperature would have to be controlled to ± 2 C ~'4 F).
However, material of this hardness has yield and tensile strengths of
72,000 and 77,000 psi respectively, whereas it is the htgher-strength
material with strengths above 90,000 psi which are of more practical
interest. With the same hardness restriction of ± 1 R30T at 79 R3OT,
annealing temperatures would have to be contral1ed to ±SoC( ± 140 F), a
range more likely to be met.
Just as continuous strand annealing eventually replaced ba,tch, annealing
for tinplate stock, new innovations, such as partial annealing, will
continue to refine the process of tinplate manufacturing.

102
, ..
. . SUGGESTIONS FOR FURTHER WORK
" ~ '~", .-. "
This investigation indicates several aress for further work.
1. Planar anisotropy or directionaU·ty., of : partially annealéd low-
carbon steel sheet should be investigated to obtain a clearer indication
of formability.
2. Recrystallization kinetics are influenced by variations in chemical
composition. It should be established whether normal mill variations
in C, Mn, etc. will affect the mechanical properties of partially
annealed materia1. Further work may also iiulica:te whether certain chemical
combinations will pro duce a superior product by influencingthe recrystal-
lization behaviour.
3. It is the author's opinion that a reduction of the annealing time from
10 min. to l min. would not change the shapes of the reaponse curves but
would only shift the temperature axis. The effects of higher temperatures,
shorter annealing times and a time error of say, ± 5 sec. in l min. on the
mechanical properties of partially annealed material should be established.
4. The carrying out of well-prepared, well-documented plant trials will
show the feasibility of the partial annealing process. There is no doubt
that continuous annea ling: tines are advancing towards a feedback control
which will allow very stringent operating conditions.

103
. APPENDIX A

104
TABLE 1
Mechantcal Properties of Temper-Ro11ed Materia1
Lot - 0.016 iri. Temper-Rol1ed Materia1
1 Co1d Hard- Yie1d S Te,nsile Y~ strain Total i Uniform
Reduc"" ness 0.2% ,Strength , S ratio r E1ong. E1ong. tion offset
% % % R30T 1000: psi 1000 psi in 2" in 2"
1.0 57.0 41.8 55.6 0.75 - 35.2 29.1
6.0 63.5 50.5 58.8 0.86 0.91 27.8 20.9
10.5 67.0 59.3 61.2 0.97 0.82 21.3 14.3
16.S 69.5 65.2 66.8 0.98 0.73 12.0 3.2
24.0 72.0 75.6 75.7 1.00 0.71 4.7 0.6
32.0 74.0 81.8 82.7 0.99 - 2.8 0.7
42.5 76.5 91.5 92.1 0.99 0.63 1.9 0.6
51.5 77 .0 94.3 95.6 0.99 - 1.9 0.6
62.0 78,0 99.2 101.8 0.98 0.67 2.0 0.8 ,
71.0 79.5 105.7 107.6 0.98 0.60 1.8 0.7
80.5 80.5 113.5 116.5 0.98 0.65 2.0 1.0

105
TABLE II
Mechaniea1 Properties of Partia11y AnnealedMatetia1
i 0.0155 in. - 82% co1d reduced Lot 1 -
0.0073 in. - 92% co1d reduced' ......
Annea1- Hard- Yield·. Str. Tensile ~
Strain Total Uni-III ing Temll . 0.2'X. III ness . Str. ratio r Elong. form QI
d 10 min. offset E1ong • .:/. u ....
.c: % % E-I Oc R3O'r 1000 psi 1000 psi in 2' in 2" -
as-rolled 80.5 113.5 116.5 0.98 0.65 2.0 1.0 462.5 81.0 111.4 112.6 0.99 0.43 3.4 2.5 480.0 80.5 107.1 109.4 0.98 4.2 3.1 500.0 80.0 103.9 106.0 0.98 4.5 3.4 519.5 79.0 98.5 101.0
d 0.98 0.48 6.3 4.9
.... 530.5 78.0 94.9 96.5 0.98 7.6 5.8 11"1 11"1 539.5 77 .0 91.9 93.7 0.98 0.50 8.7 7.0 .... 0 · 544.0 75.0 86.0 87.5 0.98 9.9 Q 1 0 u ••
550.5 72.5 79.0 81.9 0.97 0.49 13.0 10.9 555.0 69.5 68.1 72.5 0.94 0.52 18.1 15.5 560.0 67.0 63.7 69.7 0.92 0.55 21.3 18.1 568.5 64.5 51.8 63.0 0.82 0.75 27.5 22.5 579.0 62.5 49.5 60.6 0.82 0.87 29.7 24.6 600.0 61.5 47.6 60.1 0.79 0.91 30.3 24.9
-499.0 80.0 l09.0 '111.0 0.98 2.5 1.1 · d 544.0 .... 75.0 85.4 87.3 0.98 9.4 8.0
C""I 555.0 70.5 69.0 74.4 0.93 17.0 14.8 " 0
0 568.5 56.9 66.3 0.86 21.8 19.5 · * 0
1 590.5 * 52.1 63.9 0.82 22.2 20.7
1
* unreliable
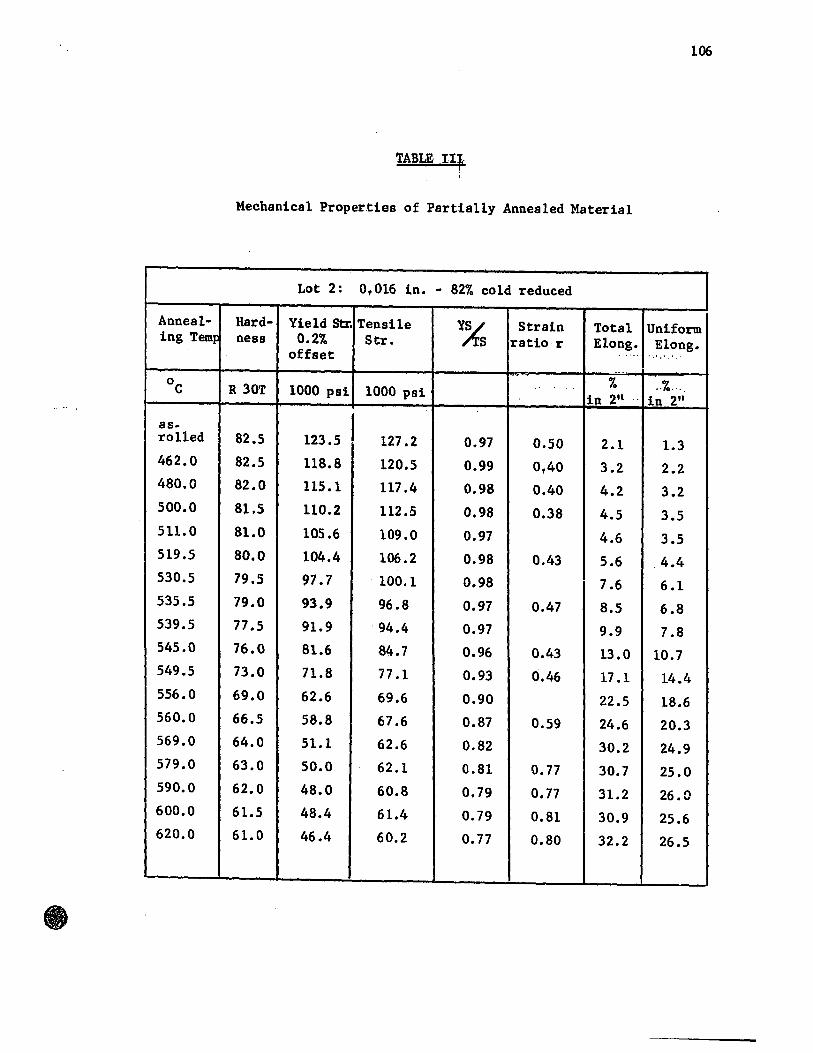
Annea1-ing Temp
as~
rolled
462.0
480.0
500.0
511.0
519.5
530.5
535.5
539.5
545.0
549.5
556.0
560.0
569.0
579.0
590.0
600.0
620.0
106
Mechanical Properties of ParUally Annealed Materia1
Lot 2: 0,016 in. - 82% co1d reduced
Hard- Yie1d Str. Tensile ness 0.2% Str.
offset
R 30T 1000 psi 1000 psi
82.5
82.5
82.0
81.5
8l.0
80.0
79.5
79.0
77.5
76.0
73.0
69.0
66.5
64.0
63.0
62.0
61.5
61.0
123.5
118.8
115.1
110.2
105.6
104.4
97.7
93.9
91.9
8l.6
7l.8
62.6
58.8
51.1
50.0
48.0
48.4
46.4
127.2
120.5
117.4
112.5
109.0
106.2
100.1
96.8
94.4
84.7
77 .1
69.6
67.6
62.6
62.1
60.8
61.4
60.2
%
0.97
0.99
0.98
0.98
0.97
0.98
0.98
0.97
0.97
0.96
0.93
0.90
0.87
0.82
0.81
0.79
0.79
0.77
Strain ratio r
0.50
0,40
0.40
0.38
0.43
0.47
0.43
0.46
0.59
0.77
0.77
0.81
0.80
Total Uniform Elong. E1ong.
% "%'" in 2n '. in 2"
2.1
3.2
4.2
4.5
4.6
5.6
7.6
8.5
9.9
13.0
17 .1
22.5
24.6
30.2
30.7
31.2
30.9
32.2
1.3
2.2
3.2
3.5
3.5
4.4
6.1
6.8
7.8
10.7
14.4
18.6
20.3
24.9
25.0
26.0
25.6
26.5

107
APPENDIX B

'1 .. .. ;
, '.:-
& ~~ ~.
.. ...
..
<, .. ~ .•.
• ,.
•
" : -.: . ~
'.:::
:, :
United· States Patent ·Office l08
3,264,144 Patent~d August 2, 1966
1
3.26-tt4-1 METIIOD OF PRonUCI:'\G A ROLLED STEEL
PRODUCT Robert II. Fr:llier :md Hobert G. Toth, l'ol:md, Ollio, as
siJ:Tlors 10 The YOUlll!sto"·n Shecl :nul Tube Company, Boardman. Ohio, a corporr.tion of Ohio
Filed AllI!. 21, 1963, Ser. No. 303,540 6 Claims. (CI. 148-12)
This application is in part a continuation of our co· pcnding -application Seriai No. 223,400, fil cd Scptcmher 13, 1962, now abandon cd .
This invention relates to a mcthod of producing a ro11OO steel product. The invention has advantages both in economy of production and quality of product and also in developing sclectcd properties in ·th..:: product. Our method produces with improved economy a rolled steel product having properties similar to the properties of rollOO steel products heretofore produced only by relatively complex multistep operations a~ relatively great co st. Certain of the properties of our product, notably ductility, are improved. By our method the properties of the product produced may he controlled to produce optimum products for particular uses.
White our invention is not so limited in all of its aspects, . it has especial application to the produ-::tion of tin plate, and for purposes of e:<planation and illustration the invention will be described in connection with the production of tin plate.
As is weil known, there is severe economic competition betwcen packaging mate rials in the container field. One of the lar)!e tonnage items in that field is so-called thin tin plate. Thin tin plate has prior to our invention been typically produce in thieknesses ranging from .005" to .007" (most commonly .0066") with an ultimale strength of 65,000 to 100,000 pounds per square ineh by cold reducing hot rol1ed strip approximately 90% to a thick· ness of .009". subjecting the cold redueed strip to a full anneal, further cold redueing the annealed strip by ap· proximately 25-35% to final gauge and el~trotinning; the product of such a process is known as double-reduced thin tin plate. The second cold reductipn strengthens the strip white preservin:; some duetility in the end product. Convention al (as distinguished from double-reduced thin) tin plate is produced by eold Teduction of hot. rolled strip to final gauge, subjectin:; the cold reduced stop to a full anneal in a continuous anncaling 1ine, temper rolling the annealed strip to improve its shape and surface fini~h and electrotinning the strip.
2 Wc bot rolllow carbon steel to form hot rolled strip,
conti wously coltl roll the hot rolled strip to reduce its thickllCSS at least 75% to a thickncss not grcater than .025" Md continuously beat trcat the cold rolled strip at
5 a tcmpcrature and for a time, not exceeding four minutes, such that the steel is not fully rccrystallizcd. The product of our process may exhibit varyin:; degrces of recrystallization or may not exhibit any recrystallization. Generally il does exhibit some rccrystallization in the form
10 of small ferrite grains in a striatcd matrix. Recrystallization in the product of our process may vary from 0 to 95%. The amount of I~rysta11ization may he controlled by control of the time and temperature of heat treatment to produce rolled steel products especially adapted for
15 particu lar uses. We may temper ·roll the heat treated strip, depending
upon the use to which the strip is heing adapted. The heat treated strip, temper rolled if desired, is plated with tin when· the ultimatc prcduct is to b" tin plate. Tin
20 plate thus produced has superior ductility and strength equal to or better than that of thin tin plate produced by the double reduction mcthod herctofore employed as above described, yet due to complete elimination of the second cold ·reducing step heretofore deemed necessary
25 in the production of thin tin plate our p.roduct is much less costly than thin tin plate heretofore produced. Also, as above indicated, by varying the heat treatment and henee the degree of Tecrystallization we can produce specifie products "tailored" to particular needs, as, for
30 example, Can body stock and can end stock. . Other details, objects and advantases of the. invention
will become apparent as the following description of a present preferred method of practicing the Slme procecds.
In the accompanying drawings we have i1Iustrated 35 diagrammatically a present preferred method of practicing
our invention and have shown by photomicrographs examples of products produeed by our invention and cornparison with the prior art. In the drawings,
FIGURE 1 is a diagrammatic illustration of our in-40 vention; •
FIGURE 2 is a photomicrograph of a rolled steel product produced by our invention evidencing no substantial recrystallization; .
FIGURE 3 is a photomicrosraph of another rolled 45 steel product produced by our invention, the product of
FIGURE 3 evidcncing a sman amount of, but substan- . tial. reerystallization; .
FIGURE 4 is a photomierograph of still another roI-50 led steel product produced by our invention, the prQduct
of FIGURE 4 evidencing a somewhat increased amount of recrystallization as comparcd with the produet of FIGURE 3 (recrystallization of the order of 40-50%);
The advantage of thin tin plate over conventional tin plate lies in the lower weight per unit area, cou pIed with hiSh strength, of the thin tin plaIe. However, the double cold reduction beretofore considered necessary to develop sufficient strength in tbe end product for certain uses, such as can making, together with the rcduction in production tonnage occasioned by the sm aller weight per unit area factor. adversely affects production cost. The increased cost of producing double-reduced thin tin plate tends to destroy the competitive advantage of thin tin plate· 60 over certain other packaging mate rials.
FIGURE 5 is a photomierograph of yet another rolled 55 steel product produced by our invention, the product of
FIGURE 5 evidencing a further increased amount of recrystallization -as comparcd with the product of ~IGURE 4 (recrystallization of the order of 90-95%):
FIGURE 6 is a photomicrograph of a full hard(unannealed) rolled steel product of compositon similar to that of the products of FIGURES 2, 3. 4 and 5;
FIGURE 7 is a photomicrosraph of a fully annealed (100% recrystallized) rol1ed steel product of composition similar to that of the products of FIGURES 2, 3, 4,
Wc have discovered how to produce thin tin plate at greatly redu-::ed co st without ·sacrificing the properties required for tin plate, especially in container manufacture. lndced we produce at reduced cost a product superior in quality to products produccd tJy the double reduction metbod heretofore employcd in the production of th in tin plate. Our product exhibits superior ductility without signifieant loss in strcngth. Our product may be used otherwise than for the production of tin plate; for example, the product in unplated form m3y be used for making containers such as oil drums.
65 Sand 6; . FIGURE 8 is a photomicrograph of a rolled steel prod
uct of compo~ition similar to that of the products of FIGURES 2, 3. 4, 5, 6 and 7 produced by cold r~dllcing hot rolled strip approximately 90% to a thi-::kness of. .009", subjecting the cold rcduced strip to a full annea1
70 in. a continuous annealing line and furthcr cold reducing the annealed strip by approximately 25%; and
..,1' ... 3( .• ' ...... ' ... ;.:.;" •• I. ..... ~., , ........... ;J:.~ ...
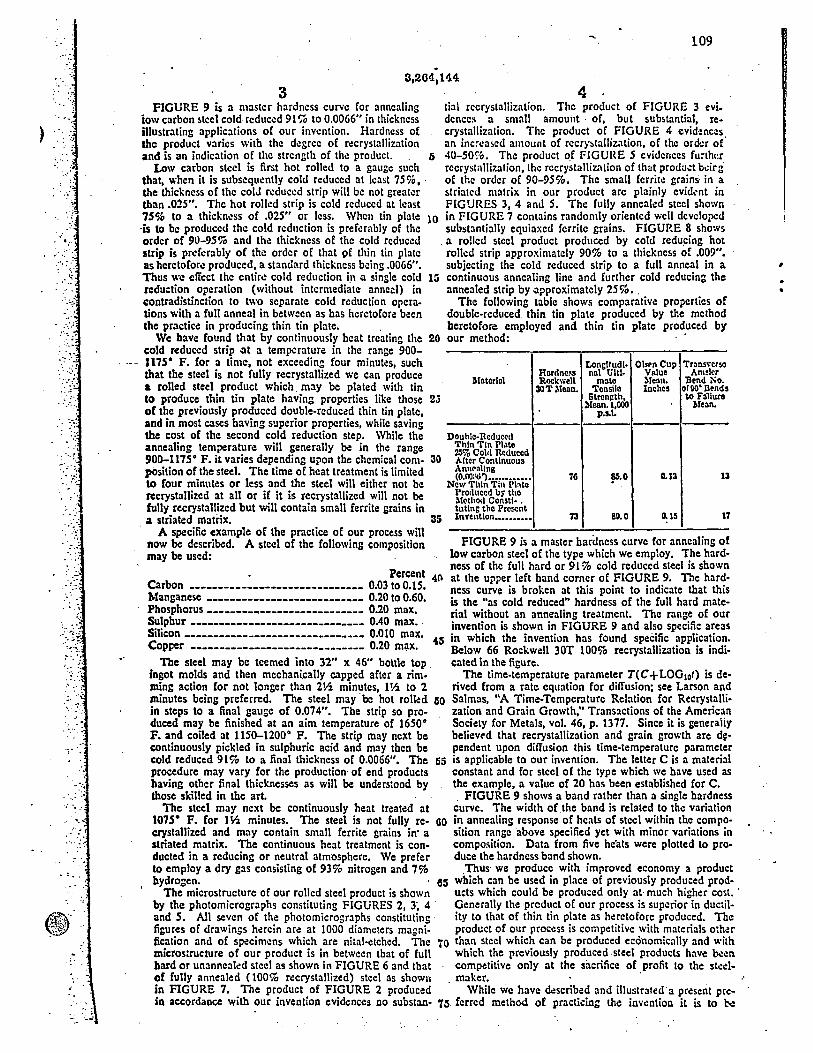
.. "~ '. ':',
:: .. ...... ;
" '. ,'.
:'~ : ..
. :~'.:' ........ -
': .:.! "' .. '
.. ..;
'.' ;.
.. ····r. ~ .. ":., ... ,:: ....
'.': ....... .. \
: .-.....
.: "; ...•
~ ."
:'-'.'; i" ~:
\:::- .
',.> :'.,
.; " .'
. ~.- .
109
3 4 FIGURE 9 is a master hardncss curye Cor annealing
iow carbon steel cold reduccd 91 % to 0.0066" in thiekness illustrating applications oC our invention. Hardness of the product varies \Vith the dcgree of recrystallization and is an indication of the strength of the pro\luct. , 5
Low carbon steel is first hot rolled to a gallo': su ch that, when it is subscqucntly cold redueed at least 75%, . the thickness oC the colJ rcduced strip wiII bc not greatcr than .025". The hot rolled strip is co Id reduced at Icast 75% 10 a thickncss oC .025" or less. Whell tin plate 10 'is 10 be produced the co!d rcduction is preCerably oC the order of 90-9S% and the thickness of the cold reduccd strip is prcCcrably of the order of that of thin tin plate
tial rccrystal\ization. The product of FIGURE 3 cvi. dences a 501:111 amouilt· of, but substantial, re· crystaIlization. The product of FIGURE 4 evidenc.:s. an inc~cased amount of recr}'~tallization, oC the order of 40-50%. The product ~f FIGURE 5 evidcnces fu:thl~r recrysta1li7.ation, the recrystalliz.ation of that produ.:t bdr:;' of the order of 90-95%. The sm ail ferrite grains· in a striatcd matrix in our product are plainly evid~nt in FIGURES 3, 4 and S. The fully annealed steel shown in FIGURE 7 con tains randomly oriented w.:1t devclopcd substantially equiaxed ferrite grains. FIGURE 8 shows
as heretoCorc produced, a standard thickncss bcing .0066". Thus wc effcct the entir.: cold reduction i)\ .a single eold la reduction operation (without intcrmediate anne;:\) in contradistinction to two separate cold rcduction opera. tions with a full anneal in betwccn as has herctofore been
. a rolled steel product prodllced by cold reducing hot rolled strip approximatcly 90% to a thickness of .009", subjecting the cold reduced strip to a full annea! in a continuous annealing line and further cold reducin:; the annealed strip by .approximatcly 25% •.
the practice in prodllcing thin .tin plate. . Wc have found that by continuously heat treating the 20
cold reduccd strip .at a tempcrature in the range 900-1175· F. for a time, not exceeding four minutes, such that the steel is not fully recrystallized we can produce a roUed steel product which. may be plated with tin to produce thin tin plate having properties like those 25 of the previous!y produced double·reduced thin tin plate, and in most cases having superior propcrties, while saving the cost of the second cold reduction step. While the annealing temperature will generally he in the range 900-1175· F. it varies depending upon the chemical com. 30 pOsition oC the steel. The lime of heat treatment is limited to four minutes or less and the steel will either not be rccrystallized at aU or if it is recrystallized will not he fully recrystat1ized but will contain small ferrite grains in a striated matÏ'ix. 35
A specific example of the practice of our process will now ~ described. A steel of the followins composition May be used:
• Percent 41\ Carbon ______________________________ 0.03 to 0.15, Manganese ___________________________ 0.20 to 0.60. Phosphorus ________ .., __________________ 0.20 max. Sulphur ______________________________ 0.40 max, .
The following table shows comparative properties of double·redllced. thin tin plate produced by the method hcretoCore employed and thin tin plate produced by our method: .
LonS\ludt. OI ... nCup TranS\"crso Rnrc1ncM nal Olt!. Villue Amslcr
I\ltltcrlnl Rockwel\ mate Me~lI. Bend Ne. 30'1' )Ielln • 'l'ensile Inchcs olW' Bends
Stren~th, \0 Fallure )!ean. 1,000 llo3n.
p.s.I.
Doulllc·Rcducc(1 Thin Tin PI~te 2S% Col.1 Reduced Altcr Contlnuous Anl1~n1ing
0.13 n (O.OOW) •••••••••••• 76 ~.O New' Thin Till 1'1:\te
l'ro<llIced br the Ml'thoil Constl· . tutlng the Present Invelltlon •••••••••• 73 80.0 0.15 17
FIGURE 9 is a master bardness curve for annealins of 10w carbon steel of the type which we employ. The hard· ncss of the full ha rd or 91 % cold reduced steel is shown at the upper leCt hand corner of FIGURE 9. The hard· ncss curve is broken at this point to indicate that this is the "as cold reduced" hardness of the full hard mate· rial without an annealing treatment. The range of our invention is shown in FIGURE 9 and also specifie areas Silicon _______________________________ 0.010 max.
Copper ______________________________ 0.20 m~x. 45 in which the invention has found specific application.
The steel may be teemed into 32" x 46" bottle top. ingot molds and then mechanicatly capped aCter a rim. ming action for not longer than 21A minutes, lIA to 2 minutes beins preferred. The steel may 'be hot rolted GO in steps 10 a final gause of 0.074". The strip 50 pro· duced may be finished at an aim temperature of 16500
Bclow 66 Rockwell 30T 100% recrystatlization is indi· cated in the fisurc.
The time.temperature par:lmeter T( C + LOG lot) is de· rived from a rate equation for diffusion; sec Larson and S:llmas, "A Time·Tcmperature Relation for Recrystalli· z.ation and Grain Growth," Transactions of the American Society for Metals, vol. 46, p. 1377. Sincc it is generaiiy bclievrd that recrystallization and grain growth are d~· pendent upon diffusion this time.temperature parameter
F. and coiled 'at 1150-12000 F. The strip may next be continuously pickled in sulphuric acid and may then be cold reduced 91 % to a final thickness of 0.0066". The procedure may vary for the production of end products havins other final thicknesses as will he unders:ood by Ibose skilled in the art.
55 is applicable to our invention. The letter C is a materia! constant and for steel of the type which we have used as the example, a value of 20 has been established for C.
The steel may next he continuously heat treated at 1075· F. for 1 Vol minutes. The steel is not fully re· 60 crystallized and may contain sma11 ferrite grains in' a striated matrix. The continuous heat treatment is con· ducted in a reducing or neutral atmosphere. We prefer
. FIGURE 9 shows a band rather than a single hardness curve. The width of the band is related to the variation in annealing responseof heats of steel within the compo· sition ranscabove specified yet with minor variations in composition. Data from five he'ats were plotted to pro· duce the hardness band shown.
10 empl"oy a dry gas consisting of 93% nitrogen and 7% hydrosen.
The microstructure of our rolled steel product is shown by the photomicrographs constituting FIGURES 2, 3~ 4 . and S. AIl seven of the photomicrosraphs constitutins . figures oC drawings h.:rein are at 1000 diamcters magni· fication :md of specimens which are nital·etched. The micros:ructure of our product is in between tbat of full hard or unanneal.:d steel as shown in FIGURE 6 and tbat of fully annealed (100% recrystallized) steel as showli in FIGURE 7. The product of FIGURE 2 produced in accordaoce with our invention evid.:nces no subst3l1-
,Thus' we produce with improvcd economy a product 65 wbich can be used in place of previously produced prod.
ucts which could be produ~ed only at· much higher co st. ' Generally the -prcduct of our proccss is superior in ductil· ity to that of th in tin plate as herctoCore produced. The product of our process is competitive with mate rials other
TO than steel which can be produced e::onomically and with which the llreviously produccd . steel products have b.:~n competitive only at the sacrifice of profit to the st~.:I
. maker. Whitc we have described and iIIustrateda present pr.:
'j6 ferred method of practicing the invention it is to b.:

' ... . '.' "
, " ' ... ~
" ... :
','.:.
, . ~ ." .'
'0:
;~'.~~
...... ~:
" .' .. ':~'
.....
.... i:
.' '~ ... .' .' '.
...... , : ,
.' . ;.
,. ~
. ~. '::: ... .. ' .
: : ~.
" -0 ':
-.
• ,
',--
110
3,264,144 5 6
distinctly undcrs:ood 'that the invention is not Iimited for a time, not exceeding four minutes, su ch that the thereto but may he otherwise variously practiccd within steel is recrystallized at 0-95% and plating the heat tre:.t-lhe scope of the foHawins daims. cd strip with tin.
Wc daim: ' S. A melhod of producing a rolled steel product corn-1. A method of pi"oducÏng a roUed steel product corn- 6 prising hot rollin:; 10IY carbon steel to Iorm hot rol\ed
prising hot rollin:; low carbon steel to Corm hot rolled strip, continuously cold rolling the hot roUed slrip with-strip, continuously coM rolling the hot rollcd strip without out intcrmediate anneal to reduce its thickness at least intermediate anr.cal to reduce its thickness at lenst 75% 75% ta a thickness not greater th an .025", continuously 10 a thickncss not grenter than .025" .md continuollsly , heat trcatins the cold roUed strip at a tempcrature ;md heat treatins the colù ~olled strip at a temilerature and 10 ,for a time, not exceeding four minutes, such that the for a time, not exceedins four minutes, su ch that the steel steel is recrystallized 0-95 %, temper ro1\in:; the heat is recrystallized 0-95%. , treated strip and plating the temper roUed strip with tin.
2. A method of producing a roUed steel product corn- ' 6. A method of producing a ro\1ed steel product corn-prising hot roUins 10IY carbon steel to form hot rolled prising hot rolling' low carbon steel to form hot roll cd strip, conlinuously cold rolling the hot ro\1cd strip with- IS strip, conlinuously cold rolling the hot rolled strip with- , out intermediate annealto reduce its thickness at Icast75% out intermediate anneal to reduce its thickness at least to a thickness not grcater than .025" and continuously 75% to a thickness "I1ot greater than .025", continuously heat treating the cold roUed strip at a temperature and heat, treating the cold roUed strip at a tempcr;iture and for a time, not excecding four minutes, such that the for a time, not exceeding four minutes, such that tbe stccl is recrystallized 0-95% and contains small ferrite 20 steel is recrystallized 0-95% and contains small ferrite grains in a striated matrix. , grains in a striated matrix, temper rolling the heat treated'
3. A rnethod of producing a rolled steel product cam- strip and plating the temper rolled strip with tin. prising hot rolling 10IY carbon steel ta form hot rollcd strip, continuously cold rolling the hot rolled strip without intermediate anncal ta reduce its thickness at least 25 75% to a thickness not greater than .025", continuously heat treating the cold rolled strip at a tempcrature and for a time, not exceeding four minutes, su ch that, the steel is recrystallized 0-95% and temper rolling the heat treated strip. 30
4. A rncthod of producing a roUed steel product cornprising hot rolling low carbon steel ta form bot roUed $lrip, continuously cold rolling the hot rolled strip without intermediate anneal to reduce its thickness at least 75% to a thickness not greater tban .025", continuously heal trcating the !:oId roUed strip at a temperature and
3S
"
'"
2,497,164 2,597,979 3,058,856 3,095,361
References Cited by the Examiner
UNITED STATES PATENTS 2/1950 George et al. ________ 148-12 5/1952 Darmara ____________ 148-12
10/1962 Miller ______________ 204-29 6/1963 Stone _______________ 204--29
HYLAND BIZOT, Primary Examin.er.
DAVID L. RECK, Examiner.
H. F. SArrO, Assistant Examiner •
\.
."

.;,
, :.'
f •
. ~.
00' . ~.~.
0,
0,
'=:
.0 00
~
.-','
" .... ",
, "
'tt.oO
... :
"'o'i ,>,',1
: p ~ • . .1 i f
...
Aug.2,1966
fI[~~r-12sT-1 ---------J
R, H, FRAZIER ET AL 3,264,144 METHOD OF PRODUCING A ROLLED STEEL PRODUCT
Fl1ed Aug, 21. 1963 ~ Sheets-Sheot l
Fig.1. Hal Roll
Law Corbon
St cel
Cold Reduce
AI Leo$t 75%
To .025R or less
Temper Roll
(Optionall
Fig.9.
Contjnuously Heal Treal
for 'nol exceedinCjj 4 minutes
Sleel nol fully recryslollized
Plate With Tin
(Optionol)
84 ~---------------------------------------~
80 ~. f Application of Invention
l for Con End Stock
t
1
Full Hard Malarlal AI Cald Raduced
76 _ t
Range of th. Invention
0-:95°'.
~ ;;:; .., 72
• • .-u
~ 68 . • • • c 'V a :z: 64
60
0010 from five diff.,enl heotl of l"'"
T. Temperature -kelvin' , • Time. ..condl
Recrystollization
S6~--~-r----~'-----'------r-----~----; o 17 18 19
INVENTORS
in
21 22 Robert H. Frozier a
:~~ ' .

.... . :.
"'!'.'
, ,
" "
" ....
.....
'.:,.
'.=;
:'
- , '~' ....
"
. -'
.".r:-.
•
,
•
H2
Aug. 2, 1966 R. H. FRAZIER ET AL 3,264,144 METHOD OF PRODUCING A ROLL,ED STEEL PRODUCT
Filed Aug. 21, 1963 ~ Sheets-Sheet 2
Inventors Robert H. Frazier a
~ Robert G. Toth
~CJ'~J,(f4! ~-~~ , ,

'. "
',:'
"
'.:-
,,~
:~~ . .. ,r
'./ , "
, .....
" ":'
: .... ~- -, ,
" ' ','
...... L:: .
, . . ~'.
. ... '; "
";";
113
Aug.2, 1966 R. H. FRAZIER ET AL 3,264,144 METHOD OF PRODUCING A ROLLED STEEL PRODUCT
Filed Au~. 21. 1963 . ,
.. •
Inventor5
, Robert H. Frozier a
, . '~'~~ÎqJ
, ·~4~~·;
'".
'.

114
REFERENCES
(1) W.E. Hoare; E.S. Hedges and B.T.K., Barry; The Techno1ogy of
Tinplate, Arnold, London, 1965, 14-15.
(2) W.E. Hoare et al.; ~., 139-144.
(3) G.A. Hawdon; IIConventional methods of batch annealing",
Recent Deve10pments in Annealing,'Iron and Steel Inst.
Spec. Report No. 79, 1963, 13-21.
(4) C.F. Olmstead; IITheory and evo1ution of coil heating practice
in steel mi 11 Sil , AIME. Met. Soc. Conf., Vol. 1, Jan. 1959.
Interseience, New York, 105-122.
(5) H.H. Ascough; IIAnnealing of co1d reduced sheet and coU in Europ~lI,
The Annealing of Low Carbon Steel, Proc. International
Symposium, Case Inst. of Techno1ogy, Oct. 1957, 95-124.
(6) J.A. Bauseher and J.K. Magor; IIOpen-coil annealing: commercial
applications and eurrent deve1opments", Recent Developments
in Armealing, Iron and Steel Inst. Spec. Report No. 79,
1963, 34-42.
(7) D.J. 8lickwede; IIprineip1es and practices for ma king very low
carbon steel by open-coil annealing", Yearbook of Amer.
Iron and Steel Inst., 1961.. 167-194.
(8) "Open-coU annealing", Iron Age, Apr. 20, 1967, 55.
(9) W .O.W. Priee and E. H. Vaughan; "Conventional strand annealingll,
Recent Developments in Annealing, Iron and Steel Inst.
Spec. Report No. 79, 1963, 71-80.
(10) W.E. Hoare et al., The Technology of Tinp1ate, Arnold, London,
1965, 144-151.

115
(11) M.A. Adams and J.R. Bevan; "Continuous Annealing of Mild Steel",
J. Iron and Steel Inst., 1966, !Q!t (6), 586-593.
(12) M.D. Stone; Iron and Steel Engineer, June 1961, 67-77.
(13) United States Patent No. 3,095,361, 1963, M.D. Stone, United
Engineering and Foundty Cotnpany •.
(14) G.A. Jenkins, G. Jefford and G.R. Woo1d:ddge; "Two-stage Co1d
Reduction in the Production of Conventiona1 and Righer
StrEmgth Tinp1ate", Sheet Metal Industries, Oct. 1967 z
651-666.
(15) P.W. Boone and D. Lewis; "Controlled Annealing of Strain Rardened
A1uminum Alloys", ,A1uminum and Magnesium, 1947, §" 20.
(16) F. King and A.N. Turner; "The Control of Qua lit y in the Rot and
Co1d Rolling of A1uminum and A1uminum Alloys", J. Inst.
Meta1s, 1953-54, ~, 291.
(17) A.J. Field and J. Sa1ter;"The Control of Qua lit y in Reat Treatment
and Final Operations in the Production of Ro11ed, Extruded
and Drawn A1uminum and A1uminum Alloys", J. Inst. Meta1s,
1954-55, ~, 199.
(18) C.P. Paton; "Batch Thermal Treatment of Light Alloys", J. Inst.
Meta1s,1951-52, §.Q, 311.
(19) R.T. Stap1es; "Flash Annealing of Light Alloys", J. Inst. Metals,
1951-52, §.Q, 323.
(20) D.V. Parsons; "The Partial Annealing of A1uminum-Magnesium Alloys",
M. Eng. Thesis, 1967, McGi11 Univ.
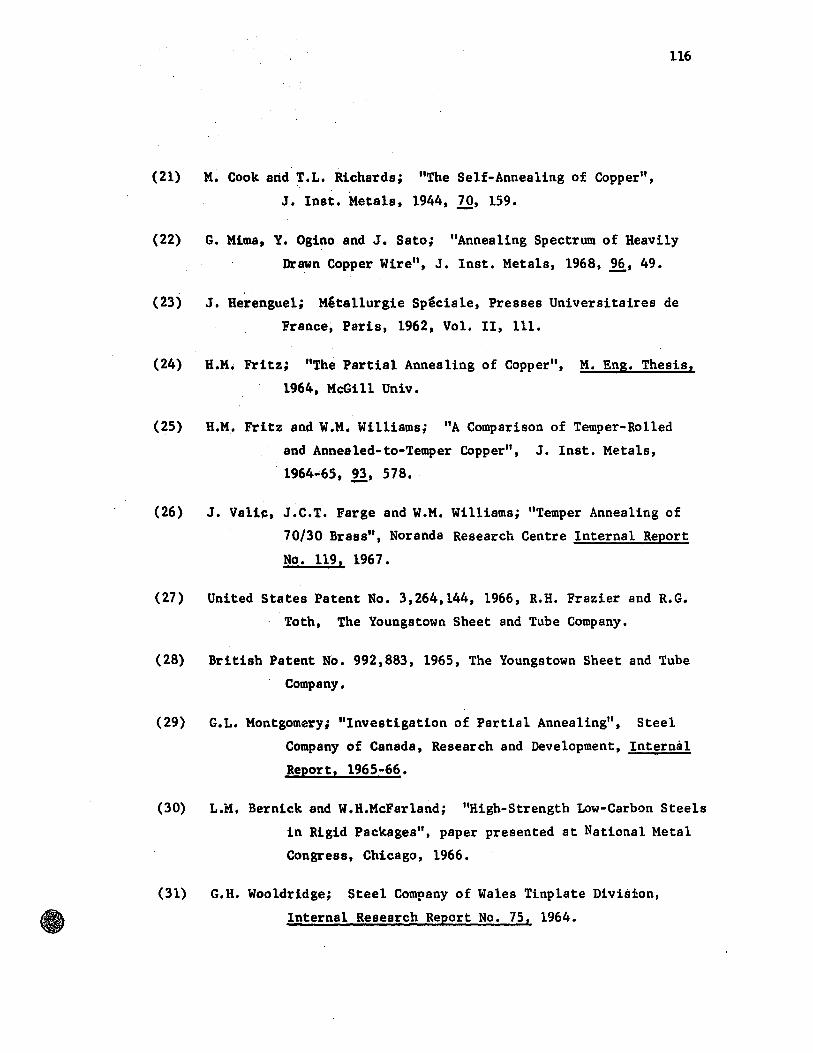
116
(21) M. Cook and T.L. Richards; "The Self-Annealing of Copper",
J. Inst. Metals, 1944, LQ, 159.
(22) G. Mima, Y. Ogino and J. Sato; "Annea ling Spectrum of Heavily
Drawn Copper Wire", J. Inst. Metals, 1968, .22., 49.
(23) J. Herenguel; Métallurgie Sp'ciale, Presses Universitaires de
France, Paris, 1962, Vol. II, 111.
(24) H.M. Fritz; "The Partial Annealing of Copper", M. Eng. Thesis,
1964, McGill Univ.
(25) H.M. Fritz and W.M. Williams; "A Comparison of Temper-Rolled
and Annealed-to-Temper Copper", J. Inst. Metals,
1964-65, ~, 578.
(26) J. Va1i~, J.C.T. Farge and W.M. Williams; "Temper Annealing of
70/30 Brass", Noranda Research Centre Internat Report
No. 119. 1967.
(27) United States Patent No. 3,264,144, 1966, R.H. Frazier and R.G.
Toth, The Youngstown Sbeet and Tube Company.
(28) British Patent No. 992,883, 1965, The Youngstown Sheet and Tube
Company.
(29) G.L. Montgomery; "Investigation of Partial Annealing", Steel
Company of Canada, Research and Deve1opment, Internâl
Report, 1965-66.
(30) L.M. Bernick and W.R.McFar1and; "Righ-Strength Low-Carbon Steels
in Rigid Packagesll, paper presented at National Metal
Congress, Chicago, 1966.
(31) G.R. Woo1dridge; Steel Company of Wales Tinp1ate Division,
Interna1 Research Report No. 75, 1964.

(32) G.R. Wooldridge;. ibid., Report No. 89, 1965.
(33) P.N. Richards, J.D. Russel and A.P. Tomlinsonj "Determining
Recovery in Cold Reduced Low-Carbon Steel Strip",
Trans. ASM, 61, 1968, 528-533.
(34) R.E. Reed-Ri11; Physical Metallurgy Principles, Van Nostrand,
Princeton, 1964, 175.
117
(35) w.c. LesUe, J.T. Michalak and F.W. Aul; "The AnneaUng of Cold
Worked Iron", !!,on and its Dilute SoUd Solutions,
Spencer and Werner, editors, Interscience, New York,
1963, 119.
(36) J .B. Austin; "New Thoughts on Crystallization", Metal Progress,
May 1963, 67-71.
(37) R. Wiedersich; ''Hardening Mechanisms and the Theory of Deformation",
Journal of Meta1s, May 1964, 425.
(38) J.G. Byrne; RecoverY, Recrystal1ization and Grain Growth,
MaCMillan, New York, 1965.
(39) Recrystallization, Grain Growth and Textures, Seminar 1965,
American Society for Meta 18, Meta ls Park, Ohio ~ 1966.
(40) R. Ru; "Annealing of Silicon-Iron Single Crystals", Recovery
and Recrystallization of Meta1s, L. Rimmel, ed., Gordon
and Breach, New York, 1963, 311.
(41) R.A. Vandermeer anà P. Gordon; "The Influence of Recovery on Re-
crystallization in A1uminlim", ibid., 211.
(42) R.W. Cahn; "A New Theory of Recrystallization Nuc1ei", Proc. Phys.
Soc. (London), 1950, ~, 323.
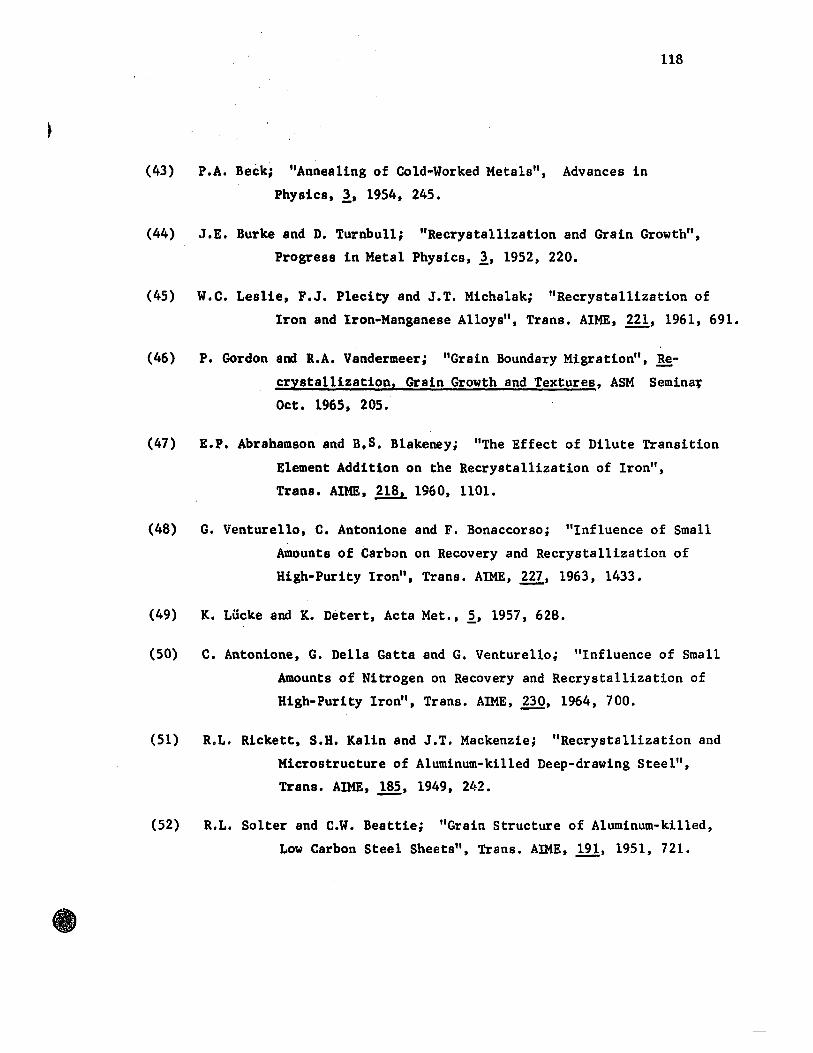
118
(43) P.A. Beèk; "AnneaUng of Cold-Worked Metals", Advances in
Physics, 1. 1954, 245.
(44) J.E. Burke and D. Turnbu11; "Recrystallization and Grain Growth",
progress in Metal Physics, 1, 1952, 220.
(45) W.C. LesUe, F.J. Plecity and J.T. Michalak; "Recrysta11ization of
Iron and Iron-Manganese Alloys", Trans. AIME, m, 1961, 691.
(46) P. Gordon and R.A. Vandermeer; "Grain Boundary Migration", !!-crystallization, Grain Growth and Textures, ASM Seminaf
Oct. 1965, 205.
(47) E.P. Abrahamson and B.S. Blakeney; "The Effect of Dilute Transition
Element Addition on the Recrysta11ization of Iron",
Trans. AIME, 218. 1960, 1101.
(48) G. Venturello, C. Antonione and F. Bonaccorso; "Influence of Small
Amounts of Carbon on Recovery and Recrysta11ization of
High-Purity Iron", Trans. AIME, m, 1963, 1433.
(49) K. Lücke and K. Detert, Acta Met., 1, 1957, 628.
(50) C. Antonione, G. Della Gatta and G. Venturello; "Influence of Sma11
Amounts of Nitrogen on Recovery and Recrysta11ization of
High-Purity Iron", Trans. AIME, ~, 1964, 700.
(51) R.L. Rickett, S.H. Kalin and J.T. Mackenzie; "Recrysta11ization and
Microstructure of A1uminum-ki11ed Deep-drawing Steel",
Trans. AIME, ]!2, 1949, 242.
(52) R.L. Solter and C.W. Beattie; "Grain Structure of A1uminum-kil1ed,
Low Carbon Steel Sheets", Trans. AIME, 19l, 1951, 721.

(53) w.c. Leslie, R.L. Rickett, C.L. Dotson and C.S. Walton; "The
Sol~tion and Precipitation of Aluminum Nitride in
Relation to the Structure of Aluminum-killed Low
Carbon Steels", Trans. ASM, 46, 1954, 1470.
119
(54) R.H. Goodenow; "Recrystallization and Grain Structure in Rimmed
and Aluminum-killed Low-Carbon Steel", Trans. ASM, 59,
1966, 804.
(55) W. Jo11ey; "Effect of Heating Rate on Recrystallization and Ani
sotropy in Aluminum-killed and Rimmed Sheet Steels",
J. Iron and Steel Inst., 205, (3), 1967, 321.
(56) W.C. Leslie, J.T. Michalak, A.S. Keh and R.J. Sober; "The Effects
of a Manganese-Oxygen Interaction on the Recrystalliza
tion of Iron", Trans. ASM, 58, 1965, 672.
(57) J.D. Baird and J.M. Arrowsmith; "Recrystallization Behaviour of
some High-Purity Irons", J. Iron and Steel Inst., ~,
!lL 1966, 240.
(58) W.T. Lankford, S.C. Snyder and J.A. Bauscher; "New Criteria for
Predicting the Press Performance of Deep-drawing Steels",
Trans. ASM, 1950, 42, 1197.
(59) R. Hill; The Mathematical Theory of P1asticity, Oxford University
Press, 1950, 317.
(60) G. G. Moore and J.F. Wallace; "The Effect of Anisotropy on Instability
in Sheet-Metal Forming", J. Inst. Metals, 1964-65, 93, 33.
(61) I.L. Dillamore; "The Prediction of Sheet Forming Properties from
Uniaxial Tension Test Data", Trans. ASM, 1965, 58, 150.

120
(62) R.L. Whitel~y, D.E. Wise and D.J. Blickwede; "Anisotropy ·as an
Asset for Good Drawability", Sheet Metal Industries,
May 1961, 349.
(63) M. Atkinson and I.M. Maclean; "Normal Plastic Ani-sotropy in Sl)eet
Steel" ~ ibid., April 1965, 290.
(64) D.V. Wilson; "Plastic Anisotropy in Sheet Metal", J. Inst. Metals,
1966, ,2!t, 84.
(65) M. Atkinson; "Assessing Normal Anisotropie P1asticity o.f Sheet Metals",
Sheet Metal Industries, March 1967.
(66):. R.S. Burns and ·R.H. Heyer; "Orientation and Anisotropy in Low-Carbon
Steel Sheets", The Annealins of Low-Carbon. Steel, Proc.
International Symposium, Case Inst. of Technol0.gy, Oct. 1957,29.
(67) J.A. Elias, R.H. Heyer and J.H. Smith; "Plastic Anisotropy of Cold
Rolled-Anne.aled Low-Carbon Steel related to Crysta1l6graphic
Grien·taUon'.', Trans. AIME, 1962, ,lli, 678.
(68) P.N. Richards; "Low-Temperature Recovery Prior to Recrystallization
of Al-kil1ed Deep Drawing Steels", J. Australian Inst.
Metais, 1967, 12(1) , 2.
(69) D.J. Blickwede; "Sheet Steel-Micrometallurgy by the Millions", Trans.
(70)
(71)
ASM, 1968, 61,653 •
C.Barrett and T. B. Massalski; Structure of Metals, 3rd ed., McGraw-Hill, 1
New York, 1966, 541-583.
M. Grumbach and G. pomey; '~ethod of Measuring the Coefficients of
Anisotropy and Work Hardening", Sheet Metal Industries, July 1966,
515.

121
(72) AStM Standards~ 1968, Part 31, General Testing Methods, Tension Testtng of Metallic Materials, E 8, 202.
(73) W.J.McGregor Tegart; Elements of Mechanical Metall~8Y' MaCMillan,
New York, 1966, 14.
(74) W.B. Morrison; "The Effect of Grain Size on the Stress-Strain
Relationship of Law-Carbon Steel", Trans. ASM, 1966, i!, 824.