Abstract.-Modern The assumption ofconstant selectivity and ...The assumption ofconstant selectivity...
14
David B. Sampson Coastal Oregon Marine Experiment Station Hatfield Marine Science Center. Oregon State University Newport. OR 97365 The assumption of constant selectivity and the stock assessment for widow rockfish, Sebastes entomelas Abstract.-Modern methods for fish stock assessment are often based on age-structured models that sepa- rate each coefficient of fishing mor- tality at age into a time-specific fac- tor (the rate of fishing mortality on the fully exploited age-classes) and an age-specific factor la selectivity coefficient that measures the rela- tive vulnerability of the particular age-class l. The assumption that the selectivity coefficients are constant through time greatly simplifies the assessment process because it allows for a reduction in the number of un- known parameters. However, if the assumption is incorrect. it can lead to incorrect estimates of stock status. The most recent stock assessment for Pacific widow rockfish (Sebastes entomelasl was based on the un- tested assumption that the selectiv- ity coefficients have not changed over the years. This assessment was de- rived from an analysis of catch-at- age data by using an assessment method known as the Stock Synthe- sis program. The work described here examined the sensitivity of the assessment results to the assump- tion of constant selectivity. Simula- tion experiments with the Stock Syn- thesis program showed that the stock size estimates for widow rock- fish can be highly sensitive to mod- est changes in selectivity. Experi- ments with two other assessment techniques. which also assume con- stant selectivity (the CAGEAN pro- gram of Deriso, Quinn, and Neal and the multiplicative catch-at-age model of Shepherd and Nicholson), showed that these methods are similarly sensitive to changes in selectivity. Manuscript accepted 21 May 1993. Fishery Bulletin 91:676--68911993l. 676 In general. individual fish in a stock are not equally likely to be caught and different age-classes of fish do not ex- perience identical rates offishing mor- tality. In the fisheries literature this phenomenon is usually described as "selectivity" or "availability" or "par- tial recruitment" IMegrey, 1989). In some instances selectivity results from the physical properties of the fishing gear. For example, younger and smaller fish may pass unharmed through the meshes of a trawl, whereas older and larger individuals may sense and avoid an approaching net. Alternatively. selectivity can re- sult when different age-classes of fish occupy geographic regions that are not fished with the same intensity. If younger fish are offshore and older ones are inshore. for example, then the age distribution offish in the catch will depend not just on the stock's age distribution but also on the fishing locations. Selectivity coefficients, which measure the relative influence of fishing on the age structure of the stock, are fundamental parameters in the analysis of catch-at-age data. Many stock assessment procedures attempt to reconcile observations of catch-at-age with an underlying age- structured population model and thereby reconstruct the demographic history of the stock (Megrey, 1989l. If different age-classes experience the same relative susceptibility to fishing each year. then one can model each annual age-specific rate of fishing mortality as the simple prod- uct (Sa·F,,) of an age effect (the selec- tivity coefficient, Sa) and a year ef- fect (the fishing mortality coefficient, F,.l. Because there are an infinite number of (Sa' F,,) pairs that corre- spond to a given "age-specific rate of fishing mortality, the selectivity co- efficient for at least one age class must be assumed constant. If the largest Sa is set equal to one, then the F" values correspond to the rate of fishing mortality on the fully ex- ploited age classes. Formulating the fishing mortality coefficient as the product of a year- effect and an age-effect greatly sim- plifies an analysis of catch-at-age data because it reduces the number ofessential parameters. For example, if the catch-at-age matrix contains data for A ages and Y years, and if the selectivity coefficients are con- stant for all years, then there are only (A+Y) unknown parameters. How- ever, if the selectivity coefficients change every then there are (A· Y) unknown parameters. Constant selectivity, and the con- sequent separability of fishing mor- tality into age and year effects, is a fundamental assumption for numer- ous stock assessment procedures, in- cluding separable Virtual Population Analysis (Pope and Shepherd, 1982), the CAGEAN program lDeriso et aI., 1985, 1989), the multiplicative model of Shepherd and Nicholson (1986, 1991), and the Stock Synthesis pro- gram (Methot 1989, 1990). Fish stocks that have recently been as-
Transcript of Abstract.-Modern The assumption ofconstant selectivity and ...The assumption ofconstant selectivity...
David B. SampsonCoastal Oregon Marine Experiment StationHatfield Marine Science Center. Oregon State UniversityNewport. OR 97365
The assumption of constantselectivity and the stock assessmentfor widow rockfish, Sebastes entomelas
Abstract.-Modern methods forfish stock assessment are often basedon age-structured models that separate each coefficient of fishing mortality at age into a time-specific factor (the rate of fishing mortality onthe fully exploited age-classes) andan age-specific factor la selectivitycoefficient that measures the relative vulnerability of the particularage-class l. The assumption that theselectivity coefficients are constantthrough time greatly simplifies theassessment process because it allowsfor a reduction in the number of unknown parameters. However, if theassumption is incorrect. it can leadto incorrect estimates of stock status.
The most recent stock assessmentfor Pacific widow rockfish (Sebastesentomelasl was based on the untested assumption that the selectivity coefficients have not changed overthe years. This assessment was derived from an analysis of catch-atage data by using an assessmentmethod known as the Stock Synthesis program. The work describedhere examined the sensitivity of theassessment results to the assumption of constant selectivity. Simulation experiments with the Stock Synthesis program showed that thestock size estimates for widow rockfish can be highly sensitive to modest changes in selectivity. Experiments with two other assessmenttechniques. which also assume constant selectivity (the CAGEAN program of Deriso, Quinn, and Neal andthe multiplicative catch-at-age modelof Shepherd and Nicholson), showedthat these methods are similarlysensitive to changes in selectivity.
Manuscript accepted 21 May 1993.Fishery Bulletin 91:676--68911993l.
676
In general. individual fish in a stockare not equally likely to be caught anddifferent age-classes of fish do not experience identical rates offishing mortality. In the fisheries literature thisphenomenon is usually described as"selectivity" or "availability" or "partial recruitment" IMegrey, 1989). Insome instances selectivity resultsfrom the physical properties of thefishing gear. For example, youngerand smaller fish may pass unharmedthrough the meshes of a trawl,whereas older and larger individualsmay sense and avoid an approachingnet. Alternatively. selectivity can result when different age-classes of fishoccupy geographic regions that are notfished with the same intensity. Ifyounger fish are offshore and olderones are inshore. for example, thenthe age distribution of fish in the catchwill depend not just on the stock's agedistribution but also on the fishinglocations. Selectivity coefficients,which measure the relative influenceof fishing on the age structure of thestock, are fundamental parameters inthe analysis of catch-at-age data.
Many stock assessment proceduresattempt to reconcile observations ofcatch-at-age with an underlying agestructured population model andthereby reconstruct the demographichistory of the stock (Megrey, 1989l.If different age-classes experiencethe same relative susceptibility tofishing each year. then one can modeleach annual age-specific rate offishing mortality as the simple prod-
uct (Sa·F,,) of an age effect (the selectivity coefficient, Sa) and a year effect (the fishing mortality coefficient,F,.l. Because there are an infinitenumber of (Sa' F,,) pairs that correspond to a given "age-specific rate offishing mortality, the selectivity coefficient for at least one age classmust be assumed constant. If thelargest Sa is set equal to one, thenthe F" values correspond to the rateof fishing mortality on the fully exploited age classes.
Formulating the fishing mortalitycoefficient as the product of a yeareffect and an age-effect greatly simplifies an analysis of catch-at-agedata because it reduces the numberof essential parameters. For example,if the catch-at-age matrix containsdata for A ages and Y years, and ifthe selectivity coefficients are constant for all years, then there are only(A+Y) unknown parameters. However, if the selectivity coefficientschange every yea~ then there are(A·Y) unknown parameters.
Constant selectivity, and the consequent separability of fishing mortality into age and year effects, is afundamental assumption for numerous stock assessment procedures, including separable Virtual PopulationAnalysis (Pope and Shepherd, 1982),the CAGEAN program lDeriso et aI.,1985, 1989), the multiplicative modelof Shepherd and Nicholson (1986,1991), and the Stock Synthesis program (Methot 1989, 1990). Fishstocks that have recently been as-

Sampson: Constant selectiviry and stock assessment for Sebastes entomelas 677
sessed by using one or more of these procedures include Pacific halibut (Hippoglossus stenolepis I in thenortheast Pacific <IPHC, 1991), walleye pollock(Theragra. chalcogranuna) in the Gulf of Alaska(Megrey, 1991), Dover sole <Microstomus paci{i.cuslalong the U.S. west coast (Thrnock and Methot, 19911,and scad (Trachurus trachurus) from Atlantic watersoff Spain and Portugal <Borges, 199m.
Despite the widespread application of assessmentmethods that are based on the notion that selectivityis time-invariant, I know of no published studies thatexamine the sensitivity of these assessment proceduresto violations of the constant selectivity assumption. Itappears that often these assessment methods are applied without first verifying that selectivity was constant for the stock being assessed. Gudmundsson (1986)recommended extensive analysis to avoid mis-specifying the catch-at-age model (for example, incorrectlyassuming that selectivity was constant I, and he developed a least-squares technique for testing the separability assumption. However, his methodology does notseem to be used widely.
Several published papers document variations in selectivity through time. Houghton and Flatman (1981lexamined selectivity coefficients for cod lGadusmorhual in the west-central North Sea and found significant changes in the "exploitation pattern," whichthey attributed to shifts in the fishing pressure exerted by different segments of the fleet. Gudmundsson(19861 speculated that changes in fish size-at-agecoupled with variations in the composition of the fishinggear caused changes in selectivity for the Icelandicstock of cod (Gadus morhual. Gordoa and Hightower(1991) analyzed data from the fishery for Cape hake(Merlucc:ius capensis) off southwestern Africa and ascribed significant shifts in selectivity to the fishermen'stargeting on strong year classes.
The work described here has a different focus. Inthis paper I do not examine how selectivity in a fisheryhas varied. Instead, I investigate whether the stockassessment program used to evaluate a particularstock's status is robust to changes in selectivity. Forthis exercise I analyzed the stock assessment for widowrockfish (Seba.stes entomelasl. an economically important component of the complex of Sebastes speciesfound along the Pacific coast of North America.Gunderson (19841 described the history and characteristics of the U.S. fishery for widow rockfish off thecoasts of Washington. Oregon, and California.
In this paper, I demonstrate that the stock size estimates for widow rockfish, which are based on the untested assumption that selectivity has been constantfrom year to year. can be seriously biased if the assumption is violated. Furthermore, I test two other
assessment methods that also use the constant selectivity assumption and show that they produce similarly biased results. Finally. I establish that comparable problems with bias can arise in the assessmentresults for other fish stocks. whose biological characteristics differ significantly from widow rockfish.
MethodsOne technique for testing the reliability of an estimation procedure is to produce artificial data sets withknown characteristics and then to estimate the parameter values from which the data were derived. Iused this approach to determine whether certain stockassessment methods were sensitive to violatiorrs of theconstant selectivity assumption. First, I simulatedcatch-at-age data for a fish stock in which the selectivity coefficients were changing slowly from year to year.Next, I used the assessment programs to analyze thecatch-at-age data and to estimate stock biomass andabundance-at-age. Finally, I measured the bias of theestimates by calculating the relative errors of the estimates. The relative error of an estimate is the difference between the estimate and its true value; all divided by the true value.
Sensitivity of the Stock Synthesis programwhen applied to data for widow rockfish
To investigate the sensitivity of the stock assessmentresults for widow rockfish to the assumption of constant selectivity, I developed a spreadsheet model togenerate artificial catch-at-age data. which I then analyzed using the Stock Synthesis program. The StockSynthesis program has been used by the Pacific Fisheries Management Council (PFMCI since 1990 to appraise the status of many of the Pacific groundfishstocks (PFMC, 1990). Methot (1989, 1990> documentedthe principles and equations underlying the Stock Synthesis program.
The spreadsheet model simulates the characteristics of an age-structured population and employs thesame equations as the Stock Synthesis program fordescribing the temporal progressions in abundanceat-age, biomass, catch-at-age, and total catch. Themodel uses parameters for mortality and growth thatare similar to those observed in the U.S. stock of widowrockfish (Table 11. I generated values for abundanceat-age and catch-at-age for 10 years and 20 age classes,ages 4 through 22, as well as age 23 and older (Table2 I. In 1989, almost 95% of the U.S. coast-wide landings of widow rockfish were fish between the ages of5-10 years; about 3% of the landings were fish olderthan 15 years lHightower and Lenarz, 1990).

678
Table 1Parameters for simulating a stock of widowrockfish: annual recruitment was 1()6 fish peryear; natural mortality' was 0.15 per year.Selectivity parameters2 (Curve B (Fig. 1),100% selection at age 8): lower inflection agewas 6.0 years; lower slope was 2.5 per year;upper inflection age was 12.0 years; and theupper slope was 0.3 per year.
Age Selectivity Weight3(years) coefficients (%) <kg)
4 0.8 0.5495 8.9 0.6626 56.2 0.7807 99.0 0.9368 100.0 1.0259 93.1 1.150
10 84.6 1.25511 75.2 1.40012 65.5 1.42713 55.7 1.59614 46.4 1.79815 37.9 1.89916 30.3 1.96517 23.9 1.96518 18.6 2.00819 14.3 2.09920 10.9 2.03121 8.2 2.70422 6.2 2.29923+ 4.7 2.388
'From Hightower and Lenarz (990)."The equation for the double-logistic selection curve and the meaning of these parameters are described in Methot (1990).3From Barss and Echeverria (987).
In the first set of experiments, I examined combinations of three factors to determine how they affect bias in the estimates from the Stock Synthesis program.They were 1) the age of full selection waseither gradually increasing or decreasingfrom year to year, or it varied randomly;2) the annual fishing mortality coefficientswere either increasing, decreasing. or constant; and 3) the program was eithergiven the true values of annual recruitment or it was required to estimate thesevalues. For simplicity. I limited my experiments to these three factors, althoughundoubtedly there are others that canalso have significant effects. Examples aretrends in annual recruitment, the levelof natural mortality. or the shape of theselectivity curve.
True values for the selectivity coefficients were generated from a double logistic function (Methot, 1990) and were
Fishery Bulletin 91 (4). 1993
similar to those reported for widow rockfish in Hightower and Lenarz(1990). The strongly domed shape of the selectivity curve (Fig. 1),which may be due to the movement of older individuals into deeper.less heavily fished waters, seems to be a common feature for manyof the groundfish stocks in the U.S. Pacific Northwest.
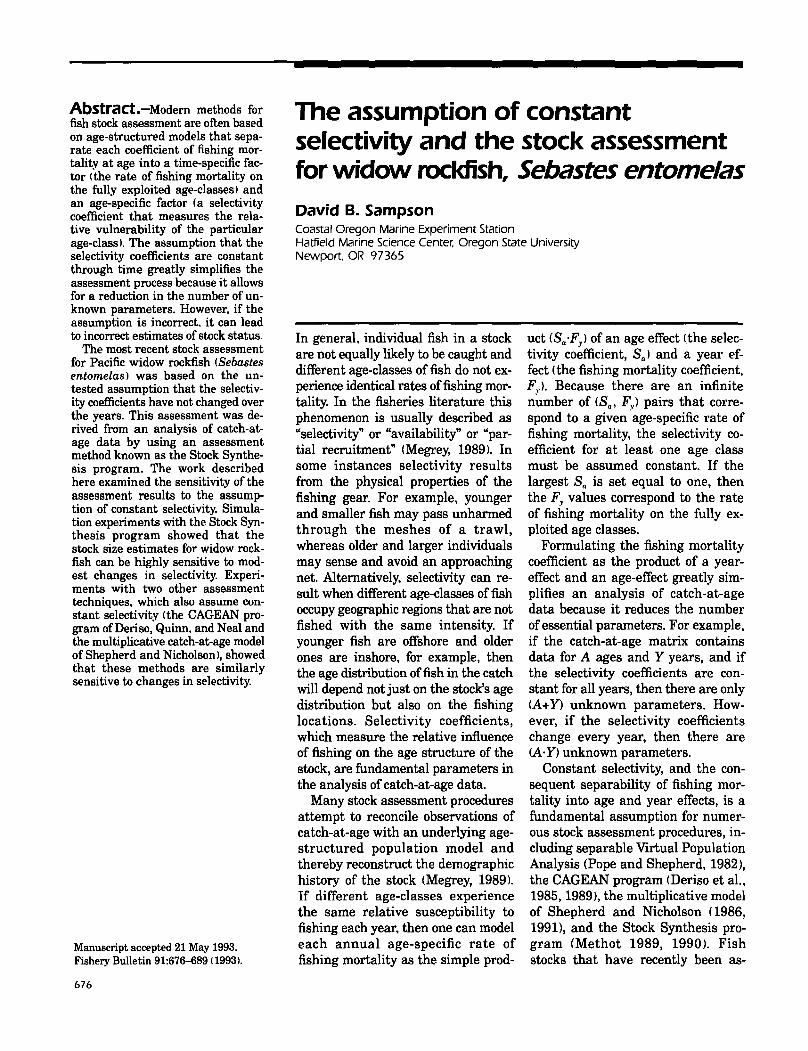
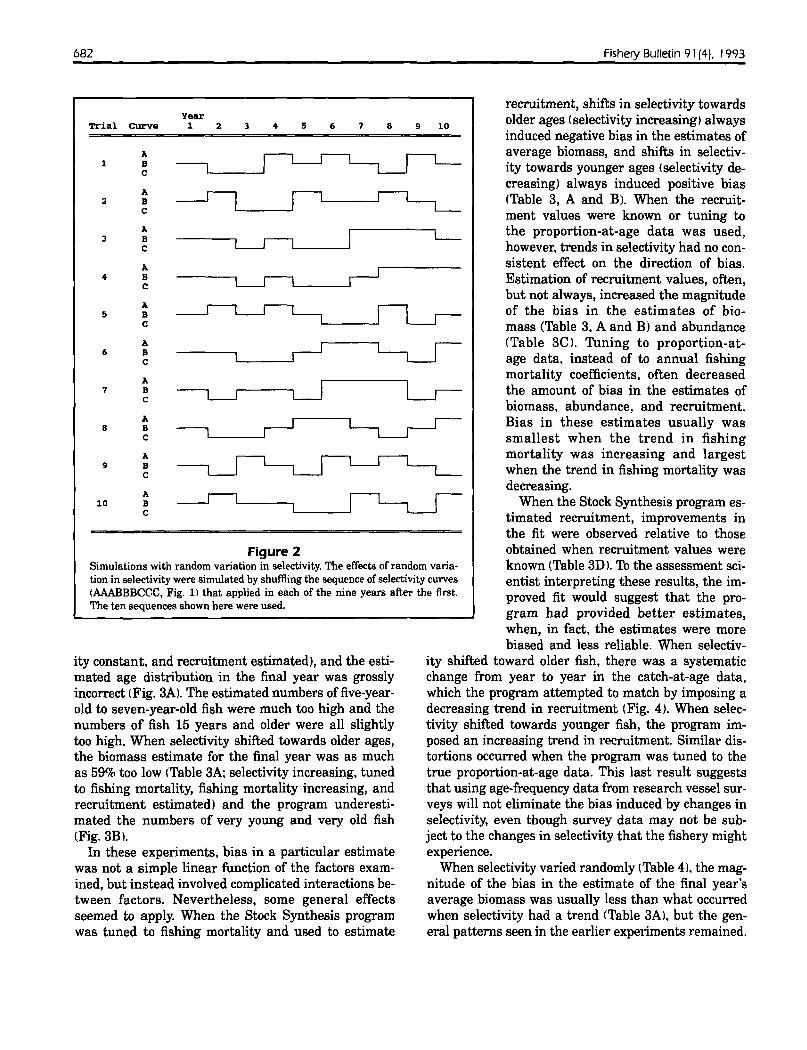
To simulate temporal changes in selectivity, I shifted the selectivity coefficients forward or backward by one age class (Fig. 1). Whenselectivity increased, 100% selection occurred at age 7 for the firstthree years (Curve A), at age 8 for the next four years (Curve B),and at age 9 for the last three years (Curve C). When selectivitydecreased, full selection occurred at age 9 for the first three years,at age 8 for the next four years. and at age 7 for the last threeyears. To measure the effects of "random" changes in selectivity, Igenerated data sets for 10 trials. Selectivity in the first year of eachtrial always followed selection curve B, but the sequence of curvesthat applied in the subsequent years came from a random shufflingof the sequence AAABBBCCC (Fig. 2). Curve A applied in threerandomly chosen years. curve B applied in three other randomlyselected years, and curve C applied in the remaining three years. Idid not examine other forms of change in selectivity. such as variation in the basic shape of the curve.
When simulating an increasing trend in fishing mortality, thefishing mortality coefficients changed linearly from 0.10 to 0.28 peryear, at increments of 0.02 per year. When the trend was decreasing, the fishing mortality coefficients varied from 0.28 to 0.10 peryear, at increments of -0.02 per year. When there was no trend infishing mortality, the fishing mortality was 0.20 per year, which isapproximately the rate of fishing that reduces the reproductive output from this simulated stock to 35% of its unexploited level whenfull selection is at age 8 years (Fig. 1, Curve B).
All methods for analyzing catch-at-age data require additionalinfonnation with which to tune the analysis and thereby resolve abasic indetenninacy in the model for catch l (Shepherd and Nicholson,1986). In the most recent assessment for widow rockfish, Hightowerand Lenarz (1990) tuned the Stock Synthesis analysis to a singlefishing mortality coefficient, but in many contemporary assessmentsof other Pacific groundfish stocks the Stock Synthesis runs havebeen tuned to estimates of abundance-at-age or biomass from research vessel surveys. In the sensitivity analysis, I gave the StockSynthesis program auxiliary data for tuning either in the form ofthe true annual fishing mortality coefficients or the true proportions-at-age.
Sensitivity of other stock assessment programs thatassume constant selectivity
To confirm that the assumption of constant selectivity, rather thansome unique feature of the Stock Synthesis program, was responsible for any bias in the results. I experimented with two other
lCatch-at-age is approximately equal to the product of stock abundance-at-age andfishing mortality-at-age. If only catch data are available, one cannot distinguishbetween a case of large abundance and low fishing mortality versus one of smallabundance and high fishing mortality.

Sampson: Constant selectivity and stoc" assessment for Sebastes entomelas
Table 2Simulated widow rockfish abundance and catch data. (AI Selectivity increasing. fishing mortality constant (0.20yearl. (Bl Selectivity decreasing. fishing mortality constant (O.20/yearl. Selection curves are indicted in parentheses.
A Year
1981 1982 1983 1984 1985 1986 1987 1988 1989 1990Age IAI (Al (AI (Bl (Bl (B) lBl ICI IC) Ie)
Initial population size 11000\1 of fish>
4 1000.0 1000.0 1000.0 1000.0 1000.0 1000.0 1000.0 1000.0 1000.0 1000.05 845.6 845.6 845.6 845.6 859.3 859.3 859.3 859.3 860.6 860.66 650.4 650.4 650.4 650.4 715.0 726.6 726.6 726.6 738.4 739.57 459.3 459.3 459.3 459.3 500.3 550.0 558.9 558.9 614.5 624.48 323.7 323.7 323.7 323.7 324.3 353.3 388.4 394.7 429.9 472.69 231.3 231.3 231.3 231.3 228.1 228.5 249.0 273.7 278.7 303.6
10 168.1 168.1 168.1 168.1 165.2 163.0 163.3 177.9 192.9 196.411 124.4 124.4 124.4 124.4 122.1 120.1 118.4 118.7 127.1 137.812 94.0 94.0 94.0 94.0 92.1 90.4 88.9 87.7 86.3 92.413 72.3 72.3 72.3 72.3 70.9 69.6 68.3 67.1 64.9 63.914 56.7 56.7 56.7 56.7 55.7 54.6 53.6 52.6 50.7 49.015 45.3 45.3 45.3 45.3 44.5 43.7 42.8 42.0 40.5 39.016 36.7 36.7 36.7 36.7 36.1 35.5 34.9 34.2 33.0 31.817 30.1 30.1 30.1 30.1 29.7 29.3 28.8 28.2 27.3 26.318 25.0 25.0 25.0 25.0 24.7 24.4 24.0 23.6 22.9 22.119 20.9 20.9 20.9 20.9 20.7 20.5 20.2 19.9 19.4 18.820 17.6 17.6 17.6 17.6 17.5 17.3 17.1 16.9 16.5 16.121 14.9 14.9 14.9 14.9 14.8 14.7 14.6 14.4 14.1 13.822 12.7 12.7 12.7 12.7 12.6 12.5 12.5 12.3 12.1 11.923+ 74.3 74.3 74.3 74.3 74.1 73.9 73.7 73.4 72.8 72.2
Catch (1000\1 of fish)
4 16.30 16.30 16.30 1.49 1.49 1.49 1.49 0.13 0.13 0.135 83.61 83.61 83.61 13.78 14.01 14.01 14.01 1.28 1.28 1.28
6 108.74 108.74 108.74 64.31 70.70 71.85 71.85 11.85 12.04 12.067 77.51 77.51 77.51 76.78 83.64 91.95 93.44 55.26 60.75 61.748 51.17 51.17 51.17 54.62 54.73 59.62 65.54 65.98 71.88 79.029 33.49 33.49 33.49 36.56 36.06 36.13 39.36 46.18 47.03 51.23
10 21.85 21.85 21.85 24.34 23.93 23.60 23.65 28.12 30.49 31.05
11 14.21 14.21 14.21 16.18 15.88 15.61 15.40 17.19 18.41 19.9612 9.22 9.22 9.22 10.73 10.52 10.33 10.15 11.40 11.21 12.0113 5.96 5.96 5.96 7.10 6.96 6.83 6.70 7.67 7.42 7.2914 3.85 3.85 3.85 4.68 4.59 4.50 4.41 5.16 4.97 4.8115 2.48 2.48 2.48 3.07 3.02 2.96 2.90 3.46 3.34 3.2216 1.59 1.59 1.59 2.01 1.98 1.94 1.91 2.32 2.23 2.15
17 1.02 1.02 1.02 1.31 1.29 1.27 1.25 1.54 1.49 1.4418 0.65 0.65 0.65 0.85 0.84 0.83 0.81 1.02 0.99 0.9619 0.42 0.42 0.42 0.55 0.54 0.54 0.53 0.67 0.66 0.6420 0.27 0.27 0.27 0.35 0.35 0.35 0.34 0.44 0.43 0.4221 0.17 0.17 0.17 0.23 0.23 0.22 0.22 0.29 0.28 0.2822 0.11 0.11 0.11 0.15 0.14 0.14 0.14 0.19 0.18 0.1823+ 0.48 0.48 0.48 0.64 0.64 0.64 0.63 0.84 0.84 0.83
679

680 Fishery Bulletin 91 (4). 1993
Table 2 (Continued)
B Year
1981 1982 1983 1984 1985 1986 1987 1988 1989 1990Age IC) ICI (e) IBI IBI IBI !HI (AI (AI (A)
Initial population size (10001;; offish)
4 1000.0 1000.0 1000.0 1000.0 1000.0 1000.0 1000.0 1000.0 1000.0 1000.05 860.6 860.6 860.6 860.6 859.3 859.3 859.3 859.3 845.6 845.66 739.5 739.5 739.5 739.5 727.7 726.6 726.6 726.6 661.0 650.47 625.3 625.3 625.3 625.3 568.8 559.8 558.9 558.9 513.1 466.78 481.0 481.0 481.0 481.0 441.6 401.7 395.3 394.7 393.9 361.69 339.7 339.7 339.7 339.7 339.0 311.2 283.1 278.5 282.0 281.4
10 239.4 239.4 239.4 239.4 242.7 242.2 222.3 202.2 202.4 205.011 171.0 171.0 171.0 171.0 174.0 176.4 176.0 161.6 149.8 149.912 124.3 124.3 124.3 124.3 126.6 128.8 130.6 130.3 122.0 113.113 92.0 92.0 92.0 92.0 93.8 95.6 97.3 98.6 100.3 93.914 69.5 69.5 69.5 69.5 70.9 72.3 73.6 74.9 77.3 78.715 53.5 53.5 53.5 53.5 54.5 55.6 56.7 57.7 59.7 61.716 42.0 42.0 42.0 42.0 42.7 43.5 44.3 45.2 46.8 48.417 33.5 33.5 33.5 33.5 34.0 34.6 35.2 35.9 37.1 38.418 27.1 27.1 27.1 27.1 27.5 27.9 28.4 28.9 29.8 30.819 22.3 22.3 22.3 22.3 22.5 22.8 23.1 23.5 24.2 24.920 18.5 18.5 18.5 18.5 18.6 18.8 19.1 19.3 19.8 20.421 15.4 15.4 15.4 15.4 15.5 15.7 15.8 16.1 16.4 16.822 13.0 13.0 13.0 13.0 13.1 13.2 13.3 13.4 13.6 13.923+ 73.4 73.4 73.4 73.4 73.7 73.9 74.2 74.6 75.2 75.9
Catch (10001;; offish)
4 0.13 0.13 0.13 1.49 1.49 1.49 1.49 16.30 16.30 16.305 1.28 1.28 1.28 14.03 14.01 14.01 14.01 84.97 83.61 83.616 12.06 12.06 12.06 73.12 71.95 71.85 71.85 121.48 110.50 108.747 61.83 61.83 61.83 104.55 95.10 93.58 93.44 94.32 86.59 78.768 80.42 80.42 8Q.42 81.17 74.52 67.78 66.70 62.40 62.27 57.179 57.32 57.32 57.32 53.70 53.59 49.20 44.75 40.34 40.84 40.75
10 37.84 37.84 37.84 34.66 35.14 35.07 32.20 26.29 26.31 26.6411 24.77 24.77 24.77 22.23 22.61 22.93 22.88 18.45 17.10 17.1212 16.16 16.16 16.16 14.19 14.46 14.71 14.91 12.79 11.97 11.0913 10.51 10.51 10.51 9.03 9.21 9.38 9.54 8.13 8.27 7.7414 6.82 6.82 6.82 5.73 5.84 5.96 6.07 5.08 5.24 5.3415 4.41 4.41 4.41 3.63 3.69 3.77 3.84 3.16 3.27 3.3716 2.84 2.84 2.84 2.29 2.33 2.38 2.43 1.96 2.03 2.1017 1.83 1.83 1.83 1.45 1.47 1.50 1.53 1.22 1.26 1.3018 1.18 1.18 1.18 0.92 0.93 0.95 0.96 0.76 0.78 0.8119 0.75 0.75 0.75 0.58 0.59 0.60 0.61 0.47 0.48 0.5020 0.48 0.48 0.48 0.37 0.37 0.38 0.38 0.29 0.30 0.3121 0.31 0.31 0.31 0.23 0.24 0.24 0.24 0.18 0.19 0.1922 0.20 0.20 0.20 0.15 0.15 0.15 0.15 0.12 0.12 0.1223+ 0.84 0.84 0.84 0.63 0.63 0.64 0.64 0.48 0.48 0.49
assessment methods that also use the assumption ofconstant selectivity. I analyzed the simulated catch-atage data with the CAGEAN program (CAGEAN-PC,version 4, release 2) of Deriso et al. 11985. 1989) andwith the multiplicative catch-at-age model of Shepherd and Nicholson (1986, 1991).
The Stock Synthesis program and the CAGEAN program use similar approaches for modeling catch-atage, but they differ in their assumptions about variability in the observed data. Stock Synthesis assumes
a multinomial error structure for the catch-at-age data.If Pa is the predicted proportion of age class (a) captured, then the variance associated with a random observation of Pa is proportional to Po' (l-Pa)' CAGEAN,however, assumes a lognormal error structure. If ca isthe predicted number of fish caught of age class (aI,then log.(ca / C'-I is normally distributed with a zero meanand a constant variance.
The multiplicative catch-at-age model is essentiallyan approximation to the catch model that underlies

Sampson: Constant selectivity and stock assessment for Sebastes entomelas 681
Figure 1Selectivity curves used in the simulations. To simulate theeffects of changing selectivity, the selectivity curve was eithershifted towards older fish through time (increasing selectivity) or towards younger fish (decreasing selectivityl.
SELECTION YEARTREND CURVE 1 2 3 4 5 6 7 8 9 10
A
~INCREASING BC
A
~DECREASING BC
both the Stock Synthesis and CAGEAN programs. Unlike the other two assessment procedures, the multiplicative model estimates relative. rather than absolute, abundance. To conduct the multiplicativecatch-at-age analyses, I used the GUM statistical program (Baker and NeIder, 1985) and assumed a lognormal error structure.
In the experiments with CAGEAN and the multiplicative catch-at-age model, I used a subset of the datafrom the earlier experiments with the Stock Synthesisprogram. Two sets of catch-at-age data were analyzed.one from a population with selectivity shifting to olderages (selectivity increasing) and fishing mortality constant (Table 2A), the other from a population withselectivity shifting to younger ages (selectivity decreasing) and fishing mortality constant (Table 2B). I tunedthe CAGEAN program to the true fishing mortalitycoefficients. and constrained the multiplicative catchat-age analysis to have a trend of zero in the annualfishing mortality coefficients. The experiments here correspond to the cases examined earlier in which theStock Synthesis program was tuned to fishing mortality and recruitment was estimated.
Results
:lThe annual catch quota is derived from an estimate of the biomassat the end of the previous year, plus an appropriate amount for thenew recruitment. In practiee this differs little from the estimate ofaverage biomass in the final year.
Selectivity of the Stock Synthesis programwhen applied to data for widow rockfish
The results of the experiments with the Stock Synthesis program and the data for the simulated stock ofwidow rockfish suggest that some of the assessmentresults can be highly sensitive to slight trends in selectivity. For example, when selectivity shifted towardsyounger ages, the biomass estimate for the final yearof the series was 74% too high (Table 3A; selectivitydecreasing, tuned to fishing mortality, fishing mortal-
The assessment programs that I investigated all produce a wide variety of estimates, including selectivitycoefficients and matrices of abundance and catch byage and year. Rather than evaluating bias for all estimates, my analysis focussed on estimates of annualstock biomass, numerical abundance, and recruitment.Of special importance to a stock assessment scientistor fishery manager is the bias in the estimate of average biomass for the final year of a data series. Thisestimate is approximately the biomass estimate onwhich the catch quota for the next year is based2• Ifthe estimate of average biomass in the final year is.say. 20% too high, then the quota will be roughly 20%too high; if the estimate is 10% too low, the quota willalso be about 10% too low.
Sensitivity of the Stock Synthesis programwhen applied to data from a heavilyexploited stock
1b determine whether the results from the experimentswith a simulated stock of widow rockfish would applyto fish stocks with different biological characteristics•I generated two additional data sets, one from a population with selectivity shifting to older ages (selectivity increasing), the other from a population with selectivity shifting to younger ages (selectivity decreasing!.Both simulated populations, which suffered an instantaneous natural mortality rate of 0.30 per year and aninstantaneous fishing mortality rate of 0.60 per year,had significantly fewer old animals compared to thepopulations in the previous simulations. I analyzedthe two data sets with the Stock Synthesis program,with tuning to the true fishing mortality coefficients,and with recruitment estimated.
20
CURVEC,/'
CURVEB
10 15AGE (YEARS)
,../
CURVE A
100
80z0
!d 60....IWenI-
ifi40Ua:wII.
20
05
682 Fishery Bulletin 91 (4), 1993
10
recruitment, shifts in selectivity towardsolder ages (selectivity increasingI alwaysinduced negative bias in the estimates ofaverage biomass, and shifts in selectivity towards younger ages (selectivity decreasing) always induced positive bias(Table 3, A and B). When the recruitment values were known or tuning tothe proportion-at-age data was used,however, trends in selectivity had no consistent effect on the direction of bias.Estimation of recruitment values, often,but not always, increased the magnitudeof the bias in the estimates of biomass (Table 3. A and B) and abundance(Table 3C I. Tuning to proportion-atage data, instead of to annual fishingmortality coefficients. often decreasedthe amount of bias in the estimates ofbiomass, abundance, and recruitment.Bias in these estimates usually wassmallest when the trend in fishingmortality was increasing and largestwhen the trend in fishing mortality wasdecreasing.
When the Stock Synthesis program estimated recruitment, improvements inthe fit were observed relative to thoseobtained when recruitment values wereknown (Table 3Dl. To the assessment scientist interpreting these results, the improved fit would suggest that the pro-gram had provided better estimates,when, in fact. the estimates were morebiased and less reliable. When selectiv-
ity shifted toward older fish, there was a systematicchange from year to year in the catch-at-age data,which the program attempted to match by imposing adecreasing trend in recruitment (Fig. 4). When selectivity shifted towards younger fish, the program imposed an increasing trend in recruitment. Similar distortions occurred when the program was tuned to thetrue proportion-at-age data. This last result suggeststhat using age-frequency data from research vessel surveys will not eliminate the bias induced by changes inselectivity, even though survey data may not be subject to the changes in selectivity that the fishery mightexperience.
When selectivity varied randomly (Table 4), the magnitude of the bias in the estimate of the final year'saverage biomass was usually less than what occurredwhen selectivity had a trend (Table 3AI. but the general patterns seen in the earlier experiments remained.
Figure 2Simulations with random variation in selectivity. The effects of random variation in selectivity were simulated by shuffling the sequence of selectivity curves(AAABBBCCC, Fig. 1) that applied in each of the nine years after the first.The ten sequences shown here were used.
YearTrial Curve 1 2 3 4 5 6 7 8 9
A1 B
C
A2 B
C
A
I3 B l-.JlC
A
~4 B l-.JlC
A5 B
C
A6 B
C
A7 B
C
A8 B
C
A9 B
C
A10 B
C
ity constant. and recruitment estimated), and the estimated age distribution in the final year was grosslyincorrect (Fig. 3AI. The estimated numbers offive-yearold to seven-year-old fish were much too high and thenumbers of fish 15 years and older were all slightlytoo high. When selectivity shifted towards older ages,the biomass estimate for the final year was as muchas 59% too low (Table 3A; selectivity increasing, tunedto fishing mortality, fishing mortality increasing, andrecruitment estimated) and the program underestimated the numbers of very young and very old fish(Fig.3Bl.
In these experiments, bias in a particular estimatewas not a simple linear function of the factors examined, but instead involved complicated interactions between factors. Nevertheless, some general effectsseemed to apply. When the Stock Synthesis programwas tuned to fishing mortality and used to estimate

Sampson: Constant selectivity and stock assessment for Sebastes entomelas 683
Table 3Sensitivity analysis of the Stock Synthesis program. (AI Biasi in the estimated average biomass in the final year. (B) Average andstandard deviation" of the bias in thp estimates of annual average biomass. IC) Averagp and standard deviation of the bias in theestimates of annual numerical abundance. lDl Averagp and standard dpviation of the bias in the estimates of annual recruitment3 andthe improvement in fit' when recruitment was estimated.
A Increasing selectivity Decreasing selectivity
Tuned to fishing mortalityF incrpasingF decreasingFconstant
Tuned to proportion-at-ageF increasingF decreasingFconstant
Known recruitment%
-1.016.912.1
3.423.317.3
Estimated recruitment%
-58.8-54.4-54.0
-26.1-24.6-14.0
Known recruitment%
-1.213.610.4
-2.911.77.4
Estimated rpcruitment%
49.872.074.3
1.05.75.2
B Increasing selectivity Decreasing selectivity
Known recruitment Estimated recruitment Known recruitment Estimated recruitment
Mean(%)
Tuned to fishing mortalityF increasing 3.9F decreasing 46.0F constant 29.5
Tuned to proportion-at-ageF increasing 4.5F decreasing 51.7F constant 32.0
SD(%I
2.121.611.5
0.520.210.0
Mean(%)
-32.5-20.8-20.5
-12.17.6
10.8
8D(%1
12.718.217.0
8.420.515.2
Mean (%1 8D(%) Mean (%1 8DI%1
-4.5 1.3 24.6 16.221.4 8.0 63.3 18.811.8 4.0 53.2 18.2
-3.8 0.4 -6.3 6.924.9 9.6 9.1 11.013.7 4.9 4.3 7.9
C Increasing selectivity Decreasing selectivity
Mean(%l 8D(%1 Mean(%) 8D(%)
-2.1 3.4 23.6 27.78.4 3.5 40.9 27.74.7 2.3 38.5 29.9
-2.5 1.6 -3.8 14.010.2 4.5 -1.3 13.65.6 2.1 -1.2 13.2
Known recruitment Estimated recruitment
Meanl%l SDl%) Mean 1%1 8Dl%)
Tuned to fishing mortalityF increasing 2.9 3.0 -27.3 2Q.4F decreasing 23.1 14.0 -24.1 24.2Fconstant 15.8 8.9 -21.5 24.3
Tuned to proportion-at-ageF incrpasing 3.5 1.6 -10.8 14.8F decreasing 26.8 13.3 -4.4 22.8Fconstant 17.7 7.9 1.6 19.7
Known recruitment Estimated recruitment

684 Fishery Bulletin 91 (4). 1993
D
Tuned to fishing mortalityF increasingF decreasingFconstant
Tuned to proportion-at-ageF increasingF decreasingFconstant
Table 3 (Continued)
Increasing selectivity Decreasing selectivity
Improvement ImprovementMean(%) SD(%) in fit 1%1 Mean(%) SDl%1 in fit (%1
-30.0 45.3 45.7 24.3 89.8 29.5-38.0 42.1 56.7 29.8 95.7 32.2-32.8 45.2 51.9 30.7 96.0 31.6
-13.5 40.0 25.6 0.5 60.0 18.5-21.9 39.2 37.7 -4.6 61.7 23.8-13.3 41.1 30.9 -2.5 59.6 21.4
IBias is measured here as the relative error of the estimated value, (estimate - true) I true.2The Stock Synthesis program estimates average biomass for each year of the input data series. The values here are the averages andstandard deviations of the ten annual estimates.
"The Stock Synthesis program can estimate recruitment for each year of the input data series. The values here are the averages andstandard deviations of the ten annual estimates.
'The "improvement in fit" is measured here by the relative increase in the value of the log-likelihood when the Stock Synthesis programestimates the annual recruitment rather than being given the true values. This is defined as
lL'-Ll!L
where L is the value of the log-likelihood when the program was given the true annual recruitment values. and L' is the value of the loglikelihood when the program estimated the annual recruitment values. The log-likelihood is given by
~.. J.. . I. p"" log/A.);
where J. is the number of fish in the (ylth catch-at-age sample, P•.• is the observed proportion of fish in the (y)th sample that are fromthe (a)th age class. and P•.• is the predicted proportion offish in the (y)th sample from the ialth age class (Methot. 1990.1.
5 10 15 20AGE (YEARS)
Figure 3True versus estimated age distributions. For the age distribution shown in the upper panel (A) the Stock Synthesis programproduced an estimate of average biomass in the final year thatwas 74% too large. For the distribution in the lower panel (B)the program produced an estimate that was 59% too small.
• SELECTIVITY INCREASING• FISHING MORTALITY INCREASING• TUNED TO FISHING MORTALITY• RECRUITMENT ESTIMATED
Sensitivity of the Stock Synthesis programwhen applied to data from a heavilyexploited stock
When the Stock Synthesis program was applied to datafor a simulated population suffering heavy exploitation, the program produced estimates of biomass andrecruitment that were even more biased than in the
Sensitivity of other stock assessmentprograms that assume constant selectivity
The results of the experiments with CAGEAN and themultiplicative catch-at-age model indicate that theseassessment methods, like the Stock Synthesis program,are also sensitive to violations of the constant selectivity assumption, When selectivity increased, both theStock Synthesis and CAGEAN programs incon"ectlyproduced a large decrease in the biomass of the simulated population during the last few years, and largedeclines in recruitment (Fig. 5). The multiplicativecatch-at-age model does not provide estimates of biomass, but its estimates of relative recruitment werealmost identical to those from the CAGEAN program.When selectivity decreased, the Stock Synthesis program and the CAGEAN program both overestimatedthe biomass in the last few years, but the estimatesfrom the CAGEAN program were grossly incorrect (Fig.6). Both the CAGEAN program and the multiplicativecatch-at-age model estimated very large increases inrecruitment.
.-
2015
------------_ .. -
• SELECTIVITY DECREASING• FISHING MORTALITY CONSTANT• TUNED TO FISHING MORTALITY• RECRUITMENT ESTIMATED
10
B
5
;i\ A, ,, ., ., .. '. ', ', ', ', '· ': '. ESTIMATED· '· ~· ,· ".,,,,,
,,,,
1.0
0.0
3
o
:I:enu:...oen~ 0.5
3:E
:I:enu: 2...oen
~ 1

Sampson: Constant selectivity and stock assessment for Sebastes entome/as 685
Discussion
'89
'89
TRUE
Estimatedrecruitment
TRUE
'87
'87'85
Knownrecruitment
'83
'83
:u.__....~_ _
i ;,.::..::..:--· MULTIPLICATIVE
CAGEAN .......~~~.. I .:-''.\0 :
..,:'-. :,..,~ ,,..,,,,, ,'. ...,..,...··""..1""'-, .', .'. I'
STOCK SYNTHESIS ..:',,'
CAGEAN
- -. _..-. --- ------. -- -..~~~~~~.~ ...........................
..................STOCK SYNTHESIS '.
•••••••••••••••••••••••••••••••••••••••••••••••••••••• "0
7-,-------------------,
'85YEAR
Figure 5Estimated biomass and recruitment from different assessment programs with selel:tivity incrl:!asing. Three assessmentprograms. all of which assume constant selectivity, were applied to the simulated widow rockfish data in which selectivity shifted to older ages and fishing mortality was constant(Table 2Ai. All three programs were sensitive to the shifts inselectivity.
Mean(%) SDI%) Mean (%1 SDI%)
Tuned to fishing mortalityF increasing -1.4 0.8 -19.7 21.9F decreasing 11.3 4.4 -17.0 24.0Fconstant 7.8 3.5 -18.6 23.2
Tuned to proportion-at-ageF increasing -0.1 0.8 --4.2 3.5F decreasing 13.3 4.6 -8.5 5.7Fconstant 8.9 3.8 -6.0 4.9
Table 4Sensitivity analysis of the Stock Synthesis program. Bias inthe estimated average biomass in the final year when selectivity varied randomly.
l/l
~ 3:::E
~z0 2
~:::JD-oD-
'81
I-z 0w:::E5 -1a:fa -2a:
3" -3c~ -4is~ -5cz~ -6
-7'81
and the biomass and abundance estimates were biased as a consequence. In any real application, notonly would the assessment program be ignorant of thetrue model structure, but the program would also haveto contend with "noise" in the data due to measure-
'89'87
TUNED TOPROPORTION-AT-AGE
"/
'85YEAR
20
'83
/..... "'0
"', '0,
' ....... '....<./ ,..,••........:....TUN~~~:~~ING • .•................... i /
", ...... ~··.. f,,'
10 15AGE (YEARS)
TRUE VALUES
5
'81
:I:~100LLo~
~50j!: 0
1.5
0.0
~15~ 1.0,g!!zw~ 0.5:::Ja:~a:
In the experiments described in this paper, the assessment programs were unable to fit exactly the simulated catch-at-age data because the catch model wasmis-specified. Selectivity was falsely assumed constant,
Figure 4Trends in selectivity induce trends in recruitment. Truecatches-at-age I upper panel) shift through time towards olderfish because of the changes in selectivity. Fishing mortalitywas constant for the entire period. The Stock Synthesis program attempted to mimic the changes in catch-at-age by generating estimates of recruitment that had a decreasing trend1I0wer panel!.
earlier experiments with the simulated stock of widowrockfish. With increasing selectivity. the bias in theestimated average biomass in the final year was -86%tFig. 7) as opposed to the bias of -54% found earlier(Table 3A; selectivity increasing, tuned to fishing mortality. fishing mortality constant, and recruitment estimated). With decreasing selectivity, the estimated average biomass in the final year was 213% too high(Fig. 8); in the earlier experiment the correspondingestimate was only 74% too high (Table 3A; selectivitydecreasing, tuned to fishing mortality, fishing mortality constant. and recruitment estimated).

686 Fishery Bulletin 91 (4), 1993
100 .-------------------..., 2.0
....................................... TRUE
'89
'89
TRUE
'87
'87
ESTIMATED
'85
'85YEAR
\,\
,,,,
ESTIMATED \.
,-.......... ...----
'83
'83
..----- ....--"- ....... ' ......,. .. .. """ -""',-
,,,
,,
,
........... -.
.-,.' ...
-----'-" TRUE
'81
'810.0
1.5
0.0
:2'.!!lu..'0~ 1.0
~~w~ 0.5:::l
~a:
f
11.5
~o 1.0iiizoi=:s 0.5~~
'89
'89'87
'87
'85
'85
YEAR
'83
'83
TRUE ,,,,,STOCK SYNTHESIS ...
CA.::>///----- -----_.
--------------~~~p~~:--------
STOCK SYNTHESIS
0;;-'';;''';;:'';;::;;
0;;-'
CAGEAN 4'/ \\ .,.,/MULTIPLICATIVE
yJ1>4" tIi' ... _
--------- . \,~- ..----
-~ \
----
3'81
5
~ 4w:::E!:: 3:::la:~ 2a:Z 1...JC~ ais~ -1CZ~ -2
-3'81
Figure 6Estimated biomass and recruitment from different assessment programs with selectivity decreasing. The three assessment programs were also applied to the simulated widowrockfish data in which selectivity shifted to younger ages andfishing mortality was constant (Table 2Bl. Again, all threeprograms were sensitive to the shifts in selectivity.
Figure 7Stock synthesis estimates of biomass and recruitment for aheavily fished stock with selectivity increasing. The Stock Synthesis program was applied to simulated widow rockfish data inwhich the fishing mortality rate was constant at 0.60 per year,the natural mortality rate was 0.30 per year, and selectivityshifted to older ages. The estimates were even more biased thanthe ones from the corresponding earlier experiment.
ment errors and to randomness in the catch process. Acomplete analysis of the problem would measure howthe assessment program transforms variability in thecatch-at-age data into variability in the resulting estimates (e.g., Kimura, 1989l.
Because the catch model with constant selectivityhas fewer unknown parameters, when applied to noisycatch-at-age data, the assessment program's estimatescould obtain greater precision (but not accuracy) byassuming constant selectivity, even though the assumption was incorrect3• However. it seems unlikely thatnoise in the data could ever reduce the bias resultingfrom a structural deficiency in the underlying catchat-age model.
3John Shepherd, Ministry of Agriculture, Fisheries, and Food, Fisheries Laboratory. Lowestoft, Suffolk, NR33 OHT, U.K., pers. commun.April 1992.
In the experiments with the simulated catch-at-agedata, the year-to-year changes in selectivity were notparticularly drastic, but I know of no studies to support my conjecture that they are realistic for the stockof widow rockfish. The simulated changes in selectivity were comparable to those observed by Houghtonand Flatman (1981) for North Sea cod and by Gordoaand Hightower (1991) for Cape hake. The fact thatexperiments with "random" changes in selectivityproduced results similar to those from experimentswith trends in selectivity confirm that the biased estimates were not just artifacts of having a simple trendin selectivity, rather than a more complex type ofvariation.
One surprising result of the experiments with different assessment methods was the large discrepancybetween the estimates from Stock Synthesis andCAGEAN when selectivity decreased (Fig. 6l. The twoprograms differ primarily in how they account for vari-

Sampson: Constant selectivity and stock assessment for Sebastes entomelas 687
Figure 8Stock svnthesis's estimates of biomass and recruitment for aheavily' fished stock with selectivity decreasing. The StockSynthesis program was applied to simulated widow rockfishdat.a in which the fishing mortality rate was constant at 0.60per year, the natural mortality rate was 0.30 per year. andselectivity shifted to younger ages. Again. the estimates weremore biased than the ones from the corresponding earlierexperiment.
ability in catch-at-age. Stock Synthesis assumes multinomial error, but CAGEAN assumes lognormal error. Using simulation techniques, Kimura (1990) directly compared estimates derived by using thesealternative assumptions and found little difference between the estimates obtained.
Another difference between Stock Synthesis andCAGEAN is in their method for modeling selectivity.The Stock Synthesis program uses a double-logisticcurve to model selectivity as a smooth function of age,but the CAGEAN-PC pl=ogram estimates the selectivity coefficients independently for each age. Becausethe true selectivity coefficients were based on doublelogistic curves, this difference between the two programs should be only a minor factor. Kimura 11990)found that the assumption of a functional form forselectivity had little effect on his analyses of simulated catch-at-age data, provided the true selectivity
......I'··....
ESTIMATED ./
....c ........~ ,
·--'••__c- •• _______________
TRUE
--_ .... -----_ ....... ----_...... --_ ..... --
~ [ log,le) -log)") F
'CAGEAN defines the residual sum of squares as
where e and" are the observed and predicted catch-at-age.
coefficients conformed to the general shape of the selectivity function.
The dilemma for the assessment scientist is to develop a framework for analyzing fisheries data that issimple to use and yet is adequate to describe the complex dynamics of a living and constantly changing fishstock. The assessment scientist has the difficult taskof interpreting diverse and possibly conflicting information. He needs tools with which to weigh these dataobjectively and to draw from them reliable conclusionsabout the status of a stock. Stock Synthesis, CAGEAN.and the multiplicative catch-at-age analysis were designed to be such tools.
In principle, one can use the Stock Synthesis andCAGEAN programs to test for shifts in selectivity. Bothprograms support a limited form of variable selectivityin which abrupt changes can occur at pre-specifiedtimes with constant selectivity during the interveningperiods. With either program it is a relatively simple.but tedious, matter to re-analyze the data by usingdifferent times for the selectivity changes. For example.I applied the CAGEAN program to the simulated widowrockfish data set given in Table 2A. with the datapartitioned into two periods of constant selectivity, andI allowed the timing of the selectivity change to occurbetween all possible adjacent years. The resulting pattern in the residual sums of squares4 (Fig. 9, upperpane}) clearly indicates the true change in selectivitythat occurred between the third and fourth years. Irepeated the process with the data series partitionedinto three periods of constant selectivity. one for thefirst three years, and the other periods for the remaining years. The CAGEAN program was able to fit thedata exactly when selectivity changed between the seventh and eighth years (Fig. 9, lower pane}).
Although the current versions of the Stock Synthesis and CAGEAN programs can be applied in the abovefashion to explore systematically for changes in selection. such a brute force approach to model building isextremely repetitious and time-consuming. I hope thatthe next generation of stock assessment programs willautomate this process in a manner similar to existingstepwise regression programs, and thereby allow theuser to test rigorously for variations in selectivity.
The model used for stock assessment should not forcethe data to fit a particular structure unless there isevidence that the structure is real or that it does notappreciably distort the results of the assessment. The
'89
'89
'87
'87
....... .ESTIMATED / \. .. .. .. .
/// \
•••• TRUE
'85YEAR
'85'83
'83
--------- --
'81
'81
0.0
0.0
4.0
f:g8 3.0
~ 4.0
'6~ 3.0
!!z 2.0w
~=>5 1.0wa:
i0 2.0iiizoF:5 1.0=>n.12

688 Fishery Bulletin 91 (4), 1993
situation is analogous to an application of two-wayanalysis of variance (ANOVAl. In fitting a two-wayANOVA model. one should test for a significant interaction term before drawing inferences about the maineffects. By the same logic, in fitting a catch-at-agemodel, one should test for changes in selectivity beforeconcluding that stock size has been increasing ordecreasing.
I have no real evidence of changes from year to yearin the selectivity for widow rockfish off the coasts ofWashington. Oregon, and Califomia. However, the workdescribed in this paper demonstrates that an incorrect
Figure 9Residual sum of squares resulting from applications ofCAGEAN with changes in selectivity. The CAGEAN programwas applied to the simulated widow rockfish data in whichselectivity shifted to older ages and fishing mortality wasconstant (Table 2AI. In the upper panel the selectivity coefficients were allowed to vary abruptly between adjacent years.thereby dividing the data into two periods of constant selectivity. The minimum in the residual sum of squares corresponds to the true change in selectivity that occurred between1983 and 1984. In the lower panel. selectivity was constantfor the first three years but was allowed to vary betweenadjacent years in the remaining period. The zero in the residual sum of squares corresponds to the true change in selectivity that ocrurred between 1983 and 1984. In theseanalyses the age at 100% selection was fixed at age 7 for thefirst selertivity period, at age 8 for the serond period. and atage 9 for the third.
Acknowledgments
Baker, R. J., and J. A. NeIder.1985. The GLlM System Release 3.77. Numerical
Algorithms Group Ltd, Oxford, 305 p.
Literature cited
assumption of constant selectivity can seriously distort an assessment of widow rockfish stock size. Furthermore, there is at least one reason to suspect thatselectivity for widow rockfish has varied through time.During the early years of the directed fishery for widowrockfish, vessels targeted schools of fish using midwatertrawls. With the rapid expansion of the fishery, thePacific Fishery Management Council began imposingincreasingly restrictive limits on the amounts of widowrockfish that could legally be landed from any singlefishing trip (Gunderson, 1984). One result ofthese "triplimits" was a reduction in the landings by midwatertrawlers relative to the landings by bottom trawlers.Midwater trawlers accounted for roughly 75% of thewidow rockfish landings in Oregon during 1984 through1988, but they accounted for only 60% in 1990, and forless than 50% in 1991. It seems quite probable thatthe midwater trawls have different selection characteristics than do bottom trawls, and that the shift froma midwater fishery to a bottom fishery would causechanges in selectivity.
Any stock assessment model will have to make simplifying assumptions to summarize succinctly the major features of the data. However, in my view the assumption of constant selectivity is an unnecessaryand misleading oversimplification, use of which canresult in catch quotas that are either needlessly conservative, resulting in immediate losses to the fishingindustry, or that are excessively liberal, producinglosses in recruitment and catches at a more distanttime.
I am grateful to staff at the Oregon Department ofFish and Wildlife facility at Newport. Oregon, for answering numerous questions about the fishery forwidow rockfish and the Stock Synthesis program. Also,this paper benefited greatly from helpful suggestionsby Ronald Hardy. Linda Jones, John Shepherd, andtwo anonymous referees. Funds for this research wereprovided by the Oregon Trawl Commission, theFishermen's Marketing Association, the Oregon Department of Fish and Wildlife, and the AgriculturalExperiment Station of Oregon State University. I appreciate the support and encouragement of theseinstitutions.
'S9/90
'S9/90'S7/SS'S5/86'S3/S4
'S5/S6 'S7/SSSELECTIVllY TRANSITION
lWO SELECTION PERIODS
THREE SELECTION PERIODS
'Sl/82
o
o
S
25
~20
§15 15
:::;
iil 10
~g13 5a:
13~ 6
gu.o:::; 4:::Jen
~Q 213a:

Sampson: Constant selectivity and stock assessment for Sebastes entomelas 689
Barss, W. H., and T. W. Echeverria.1987. Maturity of widow rockfish Sebastes entomelas
from the Northeastern Pacific, 1977-82. In W. H.Lenarz and D. R. Gunderson (eds.), Widow rockfish,p.13-18. NOAA Tech. Rep. NMFS 48.
Borges, M. F.1990. Multiplicative catch-at-age analysis of scad
(Trachurus trachurlls L.) from western Iberianwaters. Fish. Res. 9:333-353.
Deriso, R. B., T. J. Quinn II, and P. R. Neal.1985. Catch-age analysis with auxiliary information.
Can. J. Fish. Aquat. Sci. 42:815-824.Deriso, R. B., P. R. Neal, and T. J. Quinn II.
1989. Further aspects of catch-age analysis with auxiliary information. Can. Spec. Publ. Fish. Aquat. Sci.108:127-135.
Gordoa, A., and J. E. Hightower.1991. Changes in catchability in a bottom-trawl fishery
for Cape hake (Merluccius capensisl. Can. J. Fish.Aquat. Sci. 48:1887-1895.
Gudmundsson, G.1986. Statistical considerations in the analysis of
catch-at-age observations. J. Cons. into Explor. Mer43:83-90.
Gunderson, D. R.1984. The great widow rockfish hunt of 1980--1982. N.
Am. J. Fish. Manage. 4:465-468.Hightower, J. E., and W. H. Lenarz.
1990. Status of the widow rockfish fishery in 1990. InPacific Fishery Management Council, Status of thePacific coast groundfish fishery through 1990 andrecommended acceptable biological catches for 1991:stock assessment and fishery evaluation, AppendixF. Pacific Fishery Management Council. Metro Center. Portland, OR 97201.
Houghton, R. G., and S. Flatman.1981. The exploitation pattern, density-dependent
catchability, and growth of cod (Gadus morhua) inthe west-central North Sea. J. Cons. into Explor. Mer39:271-287.
IPHC (International Pacific Halibut Commission).1991. Annual Report 1990. Int. Pacific Halibut
Comm., Seattle, WA, 52 p.Kimura, D. K.
1989. Variability, tuning, and simulation for the
Doubleday-Deriso catch-at-age model. Can. J. Fish.Aquat. Sci. 46:941-949.
1990. Approaches to age-structured separable sequential population analysis. Can. J. Fish. Aquat. Sci.47:2364-2374.
Megrey, B. A.1989. Review and comparison of age-structured stock
assessment models from theoretical and applied pointsof view. Am. Fish. Soc. Symp. 6:8-48.
1991. Population dynamics and management of walleye pollock (Theragra. chalcogrammal in the Gulf ofAlaska, 1976-1986. Fish. Res. 11:321-354.
Methot, R. D.1989. Synthetic estimates of historical abundance and
mortality for northern anchovy. Am. Fish. Soc. Symp.6:66-82.
1990. Synthesis model: an adaptable framework foranalysis of diverse stock assessment data. Int. N.Pac. Fish. Comm. Bull. 50:259-277.
PFMC (Pacific Fishery Management Council).1990. Status of the Pacific coast groundfish fishery
through 1990 and recommended acceptable biologicalcatches for 1991: stock assessment and fisheryevaluation. Pacific Fishery Management Council,Metro Center. Portland, OR 97201, 58 p.
Pope, J. G., and J. G. Shepherd.1982. A simple method for the consistent interpreta
tion of catch-at-age data. J. Cons. into Explor. Mer40:176-184.
Shepherd, J. G., and M. D. Nicholson.1986. Use and abuse of multiplicative models in the
analysis of fish catch-at-age data. The Statistician35:221-227.
1991. Multiplicative modelling of catch-at-age data, andits application to catch forecasts. J. Cons. into Explor.Mer 47:284-294.
Turnock, J., and R. Methot.1991. Status of west coast Dover sole in 1991. In Pa
cific Fishery Management Council, 1991, Status ofthe Pacific coast groundfish fishery through 1991 andrecommended acceptable biological catches for 1992:stock assessment and fishery evaluation, AppendixB. Pacific Fishery Management Council, Metro Center, Portland, OR 97201.