Absorption of sound by materials : a method of measurement ...
40
I LLINOI UNIVERSITY OF ILLINOIS AT URBANA-CHAMPAIGN PRODUCTION NOTE University of Illinois at Urbana-Champaign Library Large-scale Digitization Project, 2007. S
Transcript of Absorption of sound by materials : a method of measurement ...

I LLINOIUNIVERSITY OF ILLINOIS AT URBANA-CHAMPAIGN
PRODUCTION NOTE
University of Illinois atUrbana-Champaign Library
Large-scale Digitization Project, 2007.
S

UNIVERSITY OF ILLINOIS BULLETINISSUED WEEKLY
Vol. XXV November 29, 1927 No. 13
[Entered as second-class matter December 11, 1912, at the post office at Urbana, Illinois, underthe Act of August 24, 1912. Acceptance for mailing at the special rate of postage provided
for in section 1103, Act of October 3, 1917, authorized July 31, 1918.]
THE ABSORPTION OF SOUNDBY MATERIALS
BY
FLOYD R. WATSON
PROFESSOR OF EXPERIMENTAL PHYSICS
BULLETIN No. 172
ENGINEERING EXPERIMENT STATIONP•UISHIB BY TB UNIVmrft bw ILLIOIS, UWANA
PnicE: TwMrTY 'GNTa

,yT HE Engineering Experiment Station was established byact of the Board of Trustees of the University of Illinoison December 8, 1903. It is the purpose of the Station to
conduct investigations and make studies of importance to theengineering, manufacturing, railway, mining, and other industrialinterests of the State.
The management of the Engineering Experiment Station isvested in an Executive Staff composed of the Director and hisAssistant, the Heads of the several Departments in the Collegeof Engineering, and the Professor 6f Industrial Chemistry. ThisStaff is responsible for the establishment of general policies gov-erning the work of the Station, including the approval of materialfor publication. All members of the teaching staff of the Collegeare encouraged to engage in scientific research, either directly orin eo5peration with the Research Corps composed of full-timeresearch assistants, research graduate assistants, and specialinvestigators&
To render the desults of its scientific investigations availableto the public, the Engineering Experiment Station publishes anddistributes a series of bulletins. Occasionally it publishes circu-lars of timely interest, presenting information of importance,compiled from Various sources which may not readily be acces-sible to the clientele of the Station.
The volume and number at the top of the front cover pageare merely arbitrary numbers and refer to the general publica-tions of the University. Either above the title or below the sealis given the number of the Engineering Experiment Station bul-letin or circular which should be used in referring to these pub-lications.
For copies of bulletins or circulars or for other informationaddress
THE ENGINEERING EXBERIMENT STATION,)
UNIVERSITY OF ILLINOIS,
URBANA, ILLINOIS
^ ** *.

UNIVERSITY OF ILLINOISENGINEERING EXPERIMENT STATION
BULLETIN No. 172 NOVEMBER, 1927
THE ABSORPTION OF SOUND BY MATERIALS
A METHOD OF MEASUREMENT, WITH RESULTS
FOR SOME MATERIALS
BY
FLOYD R. WATSON
PROFESSOR OF EXPERIMENTAL PHYSICS
ENGINEERING EXPERIMENT STATION
PUBLISHED BY THE UNIVERSITY OF ILLINOIS, URBANA

CONTENTSPAGE
I. INTRODUCTION ... . . . . . . . . . . 5
1. Object of Investigation .. . . . . . . . 52. Acknowledgments . . . .. . . . . . . 5
II. THEORY . . . . . . . . . . . . . . . 5
3. Definition of Acoustic Absorption . . . . . . 54. Action of Sound in a Room . . . . . . . . 55. Equation for Decay of Sound in a Room . . . . 66. Application of Equation to Experimental Conditions . 77. Measurement of Sound Absorption by Instruments With-
out Aid of the Ear . . . . . . . . . . 108. Measurement of Sound Absorption by Means of Stand-
ing Waves in a Tube . . . . . . . . . 139. Measurement of Intensity of Sound with Rayleigh Disc . 13
III. APPARATUS AND METHODS . . . . . . . . . . 1410. Outline of Method of Measurement . . . . . . 1411. Sources of Sound . . . . . . . . . . . 1712. Reverberation Room .. . . . . . . 1813. Rayleigh Disc and Its Use . . . . . . . . . 1814. Sources of Error . . . . . . . .... . . . 19
IV. EXPERIMENTAL RESULTS BY REVERBERATION METHOD . . 2015. Sound Absorption of Bare Room . . . . . . . 2016. Sound Absorption of Open Windows . . . . . . 2117. Sound Absorption of Various Materials . . . . . 2318. Table of Coefficients of Various Materials . . . . 24
V. CONCLUSIONS ... . . . . . . . . . . 2419. Conclusions . . . .. . . . . . . . 24

LIST OF FIGURESNO. PAGE
1. Reflection, Absorption, and Transmission of Sound . . . . . . . 6
2. Curve Showing Decay of Sound in a Room . . . . . . . . . 8
3. Curve Showing Effect of Sound Absorbing Material in a Room . . . . 9
4. View of Reverberation Room . . . . . . . . . . . . . 10
5. View of Tone Variators . . . . . . . . . . . . . . . 116. View of Audio Oscillator and Auxiliary Apparatus . . . . . . . 12
7. Diagram of Conne'ctions for Audible Frequency Oscillator . . . . . 13
8. View of Box Enclosing the Rayleigh Disc . . . . . . . . . . 14
9. Diagram of Rayleigh Disc and Protecting Box . . . . . . . . 15
10. Graph for Calculating Sound Absorption of Room . . .. . . . 16
LIST OF TABLES
1. Results for Reverberation in Bare Room . . . . . . . . . . 20
2. Results for Sound Absorbing Units of Bare Room . . . . . . . 21
3. Sound Absorbing Coefficients for Open Windows . . . . . . . . 23
4. Sound Absorbing Coefficients of Various Materials . . . . . . . 23
5. Sound Absorbing Coefficients for Range of Pitch . . . . . . . . 25
6. Sound Absorbing Coefficients for Pitch 512. . . . . . . . . . 26

THE ABSORPTION OF SOUND BY MATERIALS
I. INTRODUCTION
1. Object of Investigation.-The increasing demand for quiet inbuildings and auditoriums has stimulated the use and development ofmaterials with sound-absorbing qualities. This movement has been at-tended with persistent inquiries about the sound-absorbing efficienciesof various products because the numerical coefficient of a material mustbe known to calculate the amount of it needed to adjust the acousticsof any room. The object of the investigation described in this bulletinwas to determine experimentally the absorption coefficients for a num-ber of materials for the information of architects and others interested.The theory and method of measurement are described at some length.
2. Acknowledgments.-Acknowledgment is cheerfully given tomembers of the staff of the Physics Department for suggestions, andparticularly to Prof. A. P. Carman for his encouragement. Prof. JamesM. White, the Supervising Architect, has given generous assistance inaiding the work.
The investigation has been a part of the work of the EngineeringExperiment Station of which Dean M. S. Ketchum is the director, andof the Department of Physics of which Prof. A. P. Carman is the head.
II. THEORY
3. Definition of Acoustic Absorption.-Sound incident on a ma-terial is reflected, absorbed, and transmitted, as indicated in Fig. 1.When such a material is installed on the walls of a room, its absorbingeffect includes the transmitted sound as well as the pure absorptionin the material. In this sense an open window is considered a "perfect"absorber, but is really a perfect transmitter. The coefficients deter-mined are based on this conception; that is, that what is not reflected is"absorbed." The open window is taken as the standard absorber witha coefficient of 1.00, or 100 per cent absorption. A material in the roomwith a coefficient of absorption of 0.50, means that it absorbs 50 percent as much sound as an open window of equal area.
4. Action of Sound in a Room.-Since the purpose of this investi-gation is to determine the absorption by materials installed on thewalls of rooms, it is desirable to consider the action of sound underthese conditions. Thus, if a sound is generated in a room it proceedsoutwards in spherical waves from the source to the walls where it is

ILLINOIS ENGINEERING EXPERIMENT STATION
FIG. 1. REFLECTION, ABSORPTION, AND
TRANSMISSION OF SOUND
reflected, absorbed, and transmitted as shown in Fig. 1. The reflectedsound then proceeds to a second wall where it is again reflected, ab-sorbed, and transmitted, and so on, experiencing from 200 to 300 re-flections for an average sound before its energy is all absorbed ortransmitted. This means that with a steady sound, such as a sustainedtone of an organ, each area of wall or a material on a wall, is sub-jected simultaneously to the combined action of a large number ofsounds-the one striking it directly, the one striking it after one reflec-tion, the one after two reflections, and similarly for all the othersounds down to the one which is just dying out. In calculating the ab-sorption, it is necessary to develop an equation that takes account ofthis complex action.
5. Equation for Decay of Sound in a Room.-Thus, in accordancewith the action of sound as described in Section 4, W. C. Sabine* de-veloped a reverberation equation which may be writtent
-avt
Ap _
avV
where E = energy of sound per unit volume in a room at the time tA = rate of emission of energy from the source of soundp = mean free path of sound between reflectionsa = average coefficient of absorptionv = velocity of soundV = volume of roomt = time at any instant after the source of sound is stopped
*Wallace C. Sabine. "Collected Papers on Acoustics," Harvard University Press, Cambridge,1922.
tF. Aigner. "Experimentelle Studie uiber den Nachhall," Sitz. Ber. der Wiener Akad., 2aVol. 123, pp. 1489-1523, 1914.

THE ABSORPTION OF SOUND BY MATERIALS
Sabine conducted an extended series of fundamental experiments thatjustified his theory. Other forms of the equation have been developedby Franklin,* Jdger,t Buckingham,f and Eckhardt.I Jdger's equation,which is convenient for use, is
4 -avst
E = Ee- k t 4A ' 4avs
where the quantities are the same as noted in Sabine's equation, ex-cept that s - total area of surfaces exposed to the sound waves, so that
4Vp - -, and p is replaced by the more easily accessible quantities, V
S
and s. Solving equation (1) for t gives4V2.3 4A V 4A
t - log10 o 4 - constant - log10 4Aavs avsE as avsE
or, in words,reverberation volume X loudness
time of reverberation c.absorption
since the loudness is proportional to the logarithm of the intensity
log - . Experimentally, the problem is to determine the absorp-avsE/
tion a. For convenience, the factors as are abbreviated to a, and E isgiven the arbitrary value of unity ("threshold intensity," see Fig. 2),so that
t 4V2.3 l 4At -- go --
av av
The value of A is thus fixed in the same units as those for which E = 1.
6. Application of Equation to Experimental Conditions.-Createa sound in a room, by blowing an organ pipe, for instance, until a
steady state is reached where as much energy is absorbed per secondas is generated. Then discontinue the generation of sound and meas-ure the time of reverberation taken for the residual sound to becomeinaudible. Repeat the experiment with sound-absorbing material in
the room. The equations which apply, as special cases of equation (1),are
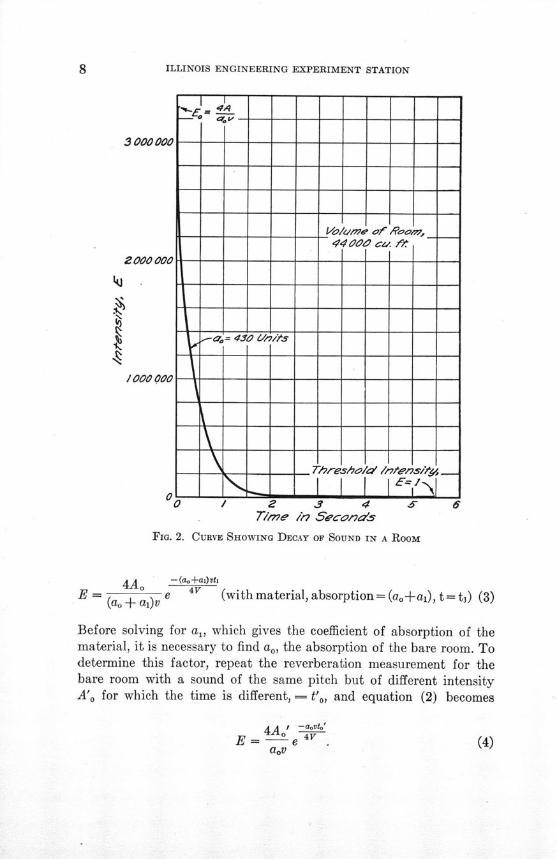
4A -oaotoE = -oe 4 (bare room, absorption = ao, t = to) (2)
aoV
*W. S. Franklin. "Derivation of Equation of Decaying Sound in a Room and Definition ofOpen Window Equivalent of Absorbing Power." Phys. Rev., Vol. 16, pp. 372-374, 1903.
tG. Jager. "Ziir Theorie des Nachhalls." Akad. Wiss. Wien, Sitz. Ber., Vol. CXX, 2a, p. 613,1911.
tE. Buckingham. "Theory and Interpretation of Experiments on the Transmission of SoundThrough Partition Walls." Bureau of Standards Sci. Paper No. 506, 1925.
f¶E. A. Eckhardt. "The Acoustics of Rooms." Jour. Franklin Inst., Vol. 195, pp. 799-814,1923.
ILLINOIS ENGINEERING EXPERIMENT STATION
Ti.me In Second-IA5
FIGo. 2. CURVE SHOWING DECAY OF SOUND IN A ROOM
4Ao -(a.+ai)vtiE = (ao + a)v e 4 (with material, absorption = (ao+ax), t= tj) (3)
Before solving for a,, which gives the coefficient of absorption of thematerial, it is necessary to find ao, the absorption of the bare room. Todetermine this factor, repeat the reverberation measurement for thebare room with a sound of the same pitch but of different intensityA'o for which the time is different, = t'o, and equation (2) becomes
4Ao -''E = _-e 4 .it 41Ee
THE ABSORPTION OF SOUND BY MATERIALS
2000 000
000000
I'S
is
/ 2 3 4T/r7?e /?7 Secoi/S
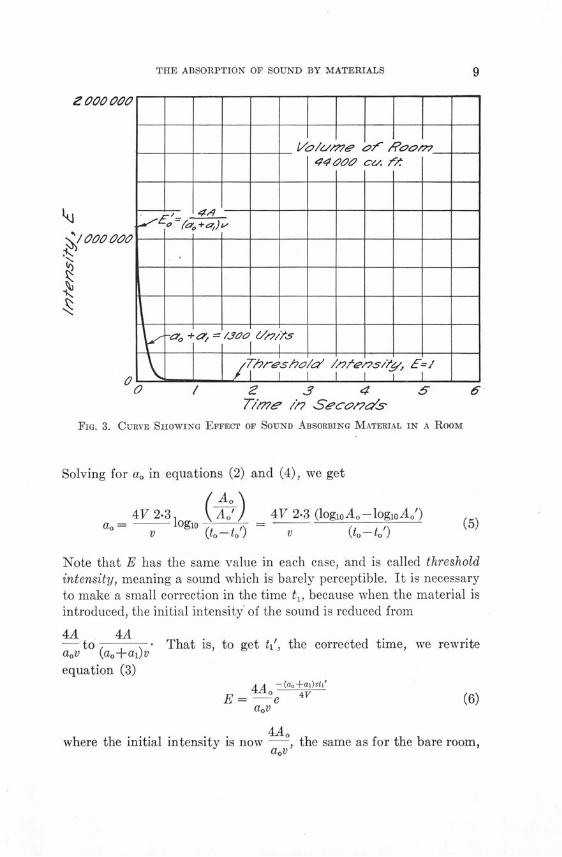
FIG. 3. CURVE SHOWING EFFECT OF SOUND ABSORBING MATERIAL IN A ROOM
Solving for ao in equations (2) and (4), we get
4V 2.3 ( Ao' 4V 2.3 (logloAo-logloAo')v (to-to') v (to-to')
Note that E has the same value in each case, and is called thresholdintensity, meaning a sound which is barely perceptible. It is necessaryto make a small correction in the time t,, because when the material isintroduced, the initial intensity of the sound is reduced from
4A 4Ato • That is, to get tl', the corrected time, we rewrite
aov (ao+ai)vequation (3)
4A (ao+a,)vt'
E =A -e 4V
aov
where the initial intensity is now 4A, the same as for the bare room,aoV
-I_
o -~ +ah-
I I I I
-a, +eT, /Je7O L<?7/A jr'rest'aia'
4,4-
4'/e/,77' I/ I? 77__f4we90 c&. i5*
0? a

ILLINOIS ENGINEERING EXPERIMENT STATION
FIG. 4. VIEW OF REVERBERATION ROOM
but the time t1 has the correspondingly larger value t'1 . Comparingequations (2) and (6) we get
aoo= (ao+ai) ti' (7)
and ao(to-t') (8)a1 = t, (8)
If a, is divided by the area of the sound-absorbing material introduced,the coefficient of absorption is obtained.
The value of the corrected time is obtained from equations (3)and (6), whereby
4V 2.3 ao+aat = 2.3 log a a + t (9)(ao+al)v ao
a sufficiently exact value for (ao + a,) being obtained from a0 o(ao+a,)t, (equation 7) where t,, the actual time obtained in the ex-periment, is used approximately for t',. Application of the equations toactual measurements is given in Chapter IV.
7. Measurement of Sound Absorption by Instruments Without Aidof the Ear.-Inspection of equation (1) shows that the absorption fac-
4Ator a appears in the intensity expression, E o - 4A that is,
av

THE ABSORPTION OF SOUND BY MATERIALS
Fio. 5. VIEW OF TONE VARIATORS
4Aa = E-- (10)
If A, the energy of the source, and Eo, the average intensity of the re-sulting sound in the room, can be measured, then a can be calculated.This method looks simple, but the successful measurement of Eo musttake account of the interference pattern of sound in the room whichgives maxima and minima in various positions depending on the com-binations of the reflected waves.
This difficulty may be practically overcome if the sound patterncan be mixed so as to give an average effect in all parts of the room.Such a mixing is approximated by periodically varying the pitch of thesound within narrow limits and, in addition, by moving the source ofsound. The measuring instrument must respond slowly so as to give

ILLINOIS ENGINEERING EXPERIMENT STATION
FIG. 6. VIEW OF AUDIO OSCILLATOR AND AUXILIARY APPARATUS
an average response to the variations.* Preliminary measurements bythe author have been made, using a Rayleigh Disc Resonator as themeasuring instrument.
Additional tests have been made using equation (10) with the earas the detector. The method employed was to listen to the sound ofhead telephones operated by a branch from the current that activatedthe source of sound in the room. A "tone match" was then made be-tween the sound heard in the head telephones and the sound that camethrough the air from the source of sound, using an adjustable resist-ance to vary the sound of the head telephones and interrupting thisbranch current so as to estimate the matching of the two sounds. Thisgave a measurement of E o (equation 10). A similar measurement wastaken in close proximity to the source, which gave a measurement of Ain the same units, and allowed the ratio A/E o to be calculated. It ispossible also to measure A and Eo by means of the Rayleigh Discshown in Fig. 9.
*E. A. Eckhardt and V. L. Chrisler. "Transmission and Absorption of Sound by Some Build-ing Materials." Bureau of Standards Sci. Paper No. 526, 1926.
V. 0. Knudsen. "The Measurement of Sound Absorption in a Room." Phys. Rev., Vol. 29,p. 753, 1927. See also: "Measurement of Reverberation Using the Thermionic Tube Oscillator asa Source." Jour. Opt. Soc. Amer., Vol. 13, pp. 609-12, 1926.
THE ABSORPTION OF SOUND BY MATERIALS
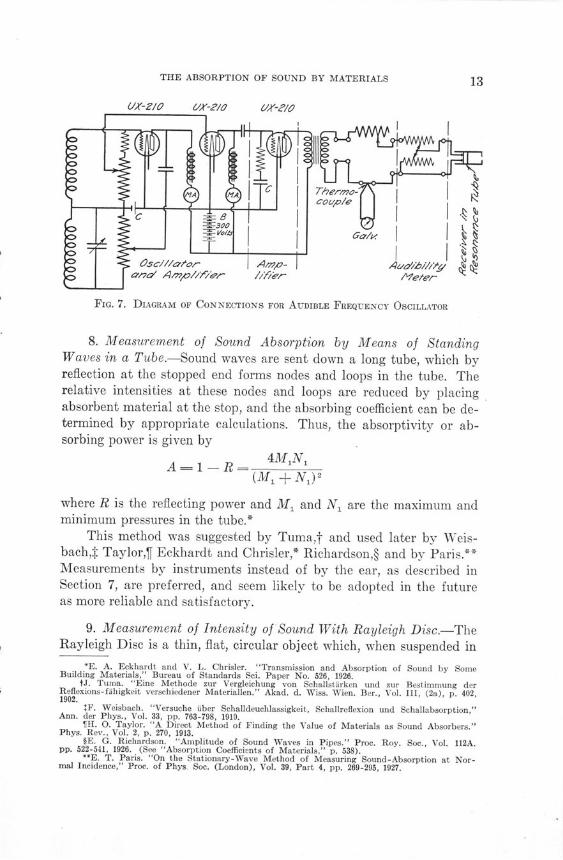
FIG. 7. DIAGRAM OF CONNECTIONS FOR AUDIBLE FREQUENCY OSCILLATOR
8. Measurement of Sound Absorption by Means of StandingWaves in a Tube.-Sound waves are sent down a long tube, which byreflection at the stopped end forms nodes and loops in the tube. Therelative intensities at these nodes and loops are reduced by placingabsorbent material at the stop, and the absorbing coefficient can be de-termined by appropriate calculations. Thus, the absorptivity or ab-sorbing power is given by
A= 1 R- 4MN(M1 + N,) 2
where R is the reflecting power and M1 and N, are the maximum andminimum pressures in the tube.*
This method was suggested by Tuma,t and used later by Weis-bach,t Taylor,f Eckhardt and Chrisler,* Richardson,§ and by Paris.**Measurements by instruments instead of by the ear, as described inSection 7, are preferred, and seem likely to be adopted in the futureas more reliable and satisfactory.
9. Measurement of Intensity of Sound With Rayleigh Disc.-TheRayleigh Disc is a thin, flat, circular object which, when suspended in
*E. A. Eckhardt and V. L. Chrisler. "Transmission and Absorption of Sound by SomeBuilding Materials," Bureau of Standards Sci. Paper No. 526, 1926.
tJ. Tuma. "Eine Methode zur Vergleichung von Schallstlrken und zur Bestimmung derReflexions-fihigkeit verschiedener Materiallen." Akad. d. Wiss. Wien. Ber., Vol. III, (2a), p. 402,1902.
IF. Weisbach. "Versuche fiber Schalldeuchlassigkeit, Schallreflexion und Schallabsorption,"Ann. der Phys., Vol. 33, pp. 763-798, 1910.
TH. 0. Taylor. "A Direct Method of Finding the Value of Materials as Sound Absorbers."Phys. Rev., Vol. 2, p. 270, 1913.
§E. G. Richardson. "Amplitude of Sound Waves in Pipes." Proc. Roy. Soc., Vol. 112A.pp. 522-541, 1926. (See "Absorption Coefficients of Materials," p. 538).
**E. T. Paris. "On the Stationary-Wave Method of Measuring Sound-Absorption at Nor-mal Incidence," Proc. of Phys Soc. (London), Vol. 39, Part 4, pp. 269-295, 1927.
UX-0io 61A-210 III-211
ILLINOIS ENGINEERING EXPERIMENT STATION
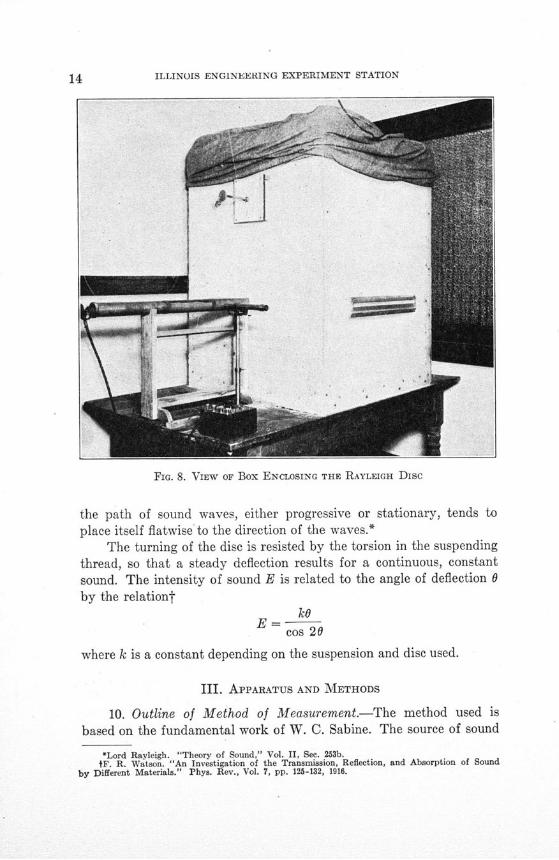
FIG. 8. VIEW OF Box ENCLOSING THE RAYLEIGH DISC
the path of sound waves, either progressive or stationary, tends toplace itself flatwise to the direction of the waves.*
The turning of the disc is resisted by the torsion in the suspendingthread, so that a steady deflection results for a continuous, constantsound. The intensity of sound E is related to the angle of deflection 0by the relationt
kOE=- cos 20
where k is a constant depending on the suspension and disc used.
III. APPARATUS AND METHODS
10. Outline of Method of Measurement.-The method used is
based on the fundamental work of W. C. Sabine. The source of sound
*Lord Rayleigh. "Theory of Sound," Vol. II, Sec. 253b.tP. R. Watson. "An Investigation of the Transmission, Reflection, and Absorption of Sound
by Different Materials." Phys. Rev., Vol. 7, pp. 125-132, 1916.
THE ABSORPTION OF SOUND BY MATERIALS
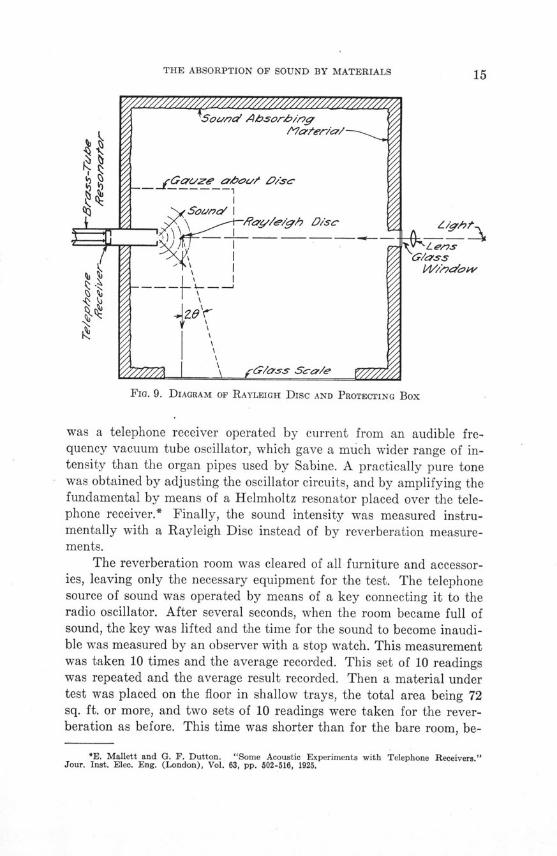
Fla. 9. DIAGRAM OF RAYLEIGH DISC AND PROTECTING BOX
was a telephone receiver operated by current from an audible fre-quency vacuum tube oscillator, which gave a much wider range of in-tensity than the organ pipes used by Sabine. A practically pure tonewas obtained by adjusting the oscillator circuits, and by amplifying thefundamental by means of a Helmholtz resonator placed over the tele-phone receiver.* Finally, the sound intensity was measured instru-mentally with a Rayleigh Disc instead of by reverberation measure-ments.
The reverberation room was cleared of all furniture and accessor-ies, leaving only the necessary equipment for the test. The telephonesource of sound was operated by means of a key connecting it to theradio oscillator. After several seconds, when the room became full ofsound, the key was lifted and the time for the sound to become inaudi-ble was measured by an observer with a stop watch. This measurementwas taken 10 times and the average recorded. This set of 10 readingswas repeated and the average result recorded. Then a material undertest was placed on the floor in shallow trays, the total area being 72sq. ft. or more, and two sets of 10 readings were taken for the rever-beration as before. This time was shorter than for the bare room, be-
*E. Mallett and G. F. Dutton. "Some Acoustic Experiments with Telephone Receivers."Jour. Inst. Elec. Eng. (London), Vol. 63, pp. 502-516, 1925.

ILLINOIS ENGINEERING EXPERIMENT STATION
FIG. 10. GRAPH FOR CALCULATING SOUND ABSORPTION OF ROOM
cause of the absorbing power of the material. Similar readings weretaken for four different sounds, the frequencies being 256, 512, 1024,and 2048.
Several necessary features were checked during each set of meas-urements. The current operating the telephone was kept constant bysuitable adjustment of the electric circuit and batteries. To mix thepattern of sound in the room, the telephone source was swung backand forth by mounting it on the top arm of a compound pendulum,thus causing the sound to emerge from a moving source. This pendu-lum was mounted with ball bearings so that it was noiseless in actionand oscillated a long time before coming to rest. Each measurementwas recorded on a roll of paper and moved out of sight, so that theobserver was not influenced by results of measurements already taken.After a test was completed, all the measurements pertaining to it wererecorded and averaged. This independence of each measurement provedvery helpful in securing consistent results.
To secure the absorbing value ao of the bare room, measurementswere taken in sets of 10 for three or four very different intensities of

THE ABSORPTION OF SOUND BY MATERIALS
the sound, but the pitch was kept constant. This variation in intensitywas easily arranged by means of an audibility meter which allowedan adjustment of the current operating the telephone (see Fig. 7). Thetelephone with its resonating tube was then removed to a box contain-ing a Rayleigh Disc to determine the intensities of the sounds used.By repeating the settings of the audibility meter and the telephonecurrent, measurements were thus taken for the actual sound intensitiesused in the reverberation room. Calculations to determine the sound-absorbing coefficient were then made as explained in Chapter II, acomplete set of calculations being given in Chapter IV.
11. Sources of Sound.-Several sources of sound were tried in theinvestigation. A special set of wooden organ pipes, closed at one end,were used, but they gave overtones when blown vigorously, andchanged pitch when the blowing pressure changed. These were replacedby a set of tone variators-that is, adjustable Helmholtz resonatorswhich had the advantage that they were practically free from over-tones and were easily tuned by means of a piston.
A much more flexible and satisfactory source was obtained byusing a telephone receiver operated by current from an audible fre-quency audion oscillator (General Radio Company, Low FrequencyOscillator, Type 377). By simple adjustment of capacities and induc-tances, a practically pure alternating current could be obtained for anyfrequency from 60 to 80 000 per second, with a variation of intensityof 2000 fold or more without change in frequency. The current wasamplified through a two-stage impedance coupled amplifier, and theoutput of the last stage was led to a tapped "audibility meter" throughan output transformer. This arrangement allowed the alternating cur-rent input to the audibility meter to be measured by means of a ther-mocouple and galvanometer and controlled to a constant value bymeans of a series resistance. The audibility meter is a tapped potentiom-eter device allowing various portions of this constant input current tobe passed through the telephone receiver (see Fig. 7).
The alternating current furnished by this instrument when ex-amined by a G. E. oscillograph showed good sine wave form withrelatively unimportant overtone components. The General RadioCompany furnishing the oscillator states: "The largest single har-monic component in the voltage wave is of the order of two percent." The current was led to a telephone which emitted the soundused in the investigation. Several telephones were tried, but finallya Brandes receiver was selected for the test. This was mounted

ILLINOIS ENGINEERING EXPERIMENT STATION
in an adjustable piston of a cylindrical Helmholtz resonator 4inches in diameter, with a circular opening % inch in diameter,so that by a suitable setting of the piston the fundamental tonewas amplified decidedly and any overtones became correspondinglytoo faint to affect the measurements appreciably. The tone for the fre-quency 2048 was obtained by a separate Baldwin "unit" telephonewhich had a natural resonance at this pitch. Faint overtones in thesound in the room were detected by listening with adjustable Helm-holtz resonators but the fundamental showed a very marked intensity.The audio-oscillator apparatus was much more satisfactory than thewind instruments, because of its quiet action, its flexible pitch, its widerange of intensity, and the ease of moving the telephone source quietlyso as to mix the sound in the room.
12. Reverberation Room.-The room used for the reverberationtests had a volume of 12 180 cu. ft., with concrete floor and ceiling,walls of hard plaster on brick or tile, and seven heavy double windows.Sounds used in the tests persisted from 3 to 8 seconds in this room be-fore dying out (see Fig. 4).
13. Rayleigh Disc and Its Use.-Several discs were tried, but theone finally used was a thin, flat circular glass circle platinized on oneside so as to act as a mirror. It was 1.2 cm. in diameter, weighed 34mg. and was suspended by a quartz thread about 15 in. long. Its periodof vibration was 15 seconds. To protect it from air drafts, it wasmounted in a specially prepared box 4 ft. high with a cross-section of3 ft. by 3 ft. The inside of the box was lined with cotton about 3 in.thick and with other absorbing materials arranged in haphazard fash-ion to minimize reflections. The brass tube containing the telephonesource of sound was inserted through a hole in one side of the box. Abeam of ligh.t entered through a glass plate directly opposite the tele-phone tube with the suspended Rayleigh disc in a line between the two(see Fig. 9). A thin cheesecloth gauze was mounted on a skeletonframe about the disc to minimize convection currents. It was foundnecessary to ground the brass tube to eliminate electrostatic chargesthat caused the disc to deflect. A glass scale at the front of the boxallowed inspection of the spot of light reflected from the disc, the de-flections of which divided by the perpendicular distance of the discfrom the scale gave tan 20, where 0 was the angle turned by the discThis led to a calculation of the intensity
kOcos 20"

THE ABSORPTION OF SOUND BY MATERIALS
By means of a worm gear, the quartz thread supporting the disc couldbe twisted so as to bring the disc back to its initial position. The angle
of twist 0 is proportional to the intensity, 0 .cos 20
14. Sources of Error.-The reverberation method has one import-ant source of error-the measurement of the time of decay of sound ina room by means of the ear. The human factor of concentration var-ies with one's physical condition, so that it is necessary for satisfactoryresults to take reverberation measurements only when the observer isnot fatigued. Also, it is desirable to secure a considerable number ofmeasurements of the time of reverberation to obtain a suitable aver-age. An error in the time is made because the hand operating the stopwatch acts after the ear decides that the sound is inaudible.* Any vari-ation in this time t affects the calculation of the absorbing coefficientin a very sensitive manner. For instance, in Fig. 10, a variation of-± 0.1 second in the extreme measurements would change the value ofao 6 per cent.
A fortunate feature of the decay of sound in a room is that itdies out in "waves." If it gradually sunk to inaudibility, as indicatedin the smooth curve of Fig. 2, it would be practically impossible to notethe last vestige of sound. But there are small irregularities as thesound dies out that aid the observer in estimating the final "threshold"sound.
An advantageous feature is the movement of the telephone source.This serves to mix the sound in the room so that a material is subjectedto an average sound instead of concentrations of intensities on certainareas such as would result with a stationary source. The moving sourcealso gives a better average of sound for the observer who, with a sta-tionary source, might be located at a "silent" spot or a "loud" spotwhen measuring one material, but with a different condition for an-other material, so that the results for the two materials would not bestrictly comparable. Operating the source near the center of the vol-ume of the room minimizes the reinforcement of a nearby reflectingsurface.t Its motion would also average any such effect, if any surfacehappened to be in a favorable position for reinforcement. The top ofthe resonance tube was 9 feet high in its upright position, thus placingthe source of sound at a considerable distance from the reflecting floor.
*Ernst Petzold. "Elementar Raum Akustik." Bauwelt-Verlag, Berlin, 1927. (See page 16for personal error in measuring time of reverberation.)
tA. H. Davis. "The Basis of Acoustic Measurements by Reverberation Methods." Phil.Mag., Vol. 2, pp. 543-556, 1926. See also: "The Loud-Speaker as a Source of Sound for Reverber-ation Work." Phil. Mag., Vol. 2, pp. 51-64, 1926.
ILLINOIS ENGINEERING EXPERIMENT STATION
TABLE 1
RESULTS FOR REVERBERATION IN BABE ROOM
ocos 20
Time of reverberation,seconds
31.8 2.8 0.184
1.49 0.41
7.10 5.91
0.0174
-1.76
3.46
See Section 13 for method of obtainingcos 29I
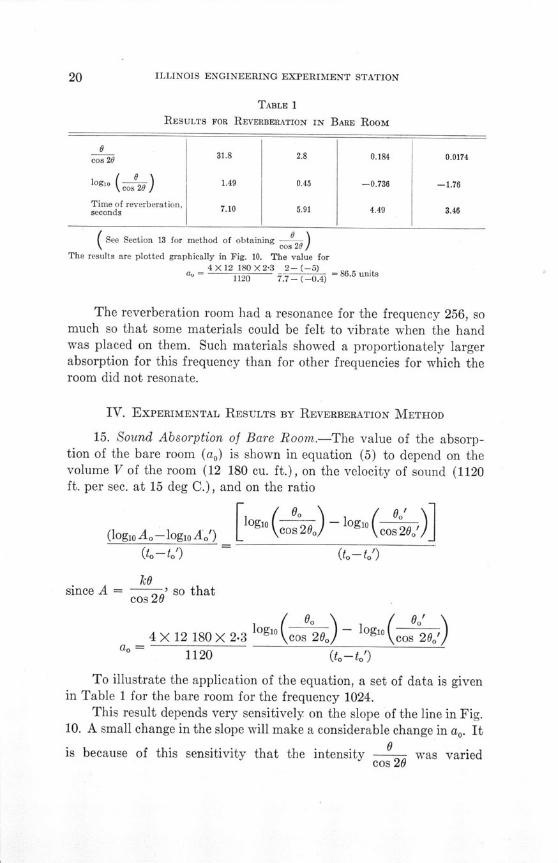
The results are plotted graphically in Fig. 10. The value for4X12 180X2-3 2- (-5)
ao = 1120 7.7- -0.4) = 86.5 units
The reverberation room had a resonance for the frequency 256, somuch so that some materials could be felt to vibrate when the handwas placed on them. Such materials showed a proportionately largerabsorption for this frequency than for other frequencies for which theroom did not resonate.
IV. EXPERIMENTAL RESULTS BY REVERBERATION METHOD
15. Sound Absorption of Bare Room.-The value of the absorp-tion of the bare room (ao) is shown in equation (5) to depend on thevolume V of the room (12 180 cu. ft.), on the velocity of sound (1120ft. per sec. at 15 deg C.), and on the ratio
loglo logo 0(logio A-log1 io A') cs200) - l cos 20.'
(to-to') (to-to')
kOsince A = - so that
cos 20 logo 0 log"o ,4 X 12 180 X 2.3 log10 o - logl (cos 20o)
ao = 1120 (to-to')
To illustrate the application of the equation, a set of data is givenin Table 1 for the bare room for the frequency 1024.
This result depends very sensitively on the slope of the line in Fig.10. A small change in the slope will make a considerable change in ao. It
is because of this sensitivity that the intensity was variedcos 20
THE ABSORPTION OF SOUND BY MATERIALS
TABLE 2RESULTS FOR SOUND ABSORBING UNITS OF BARE ROOM
o Observer No. of observationso Observerfor each value
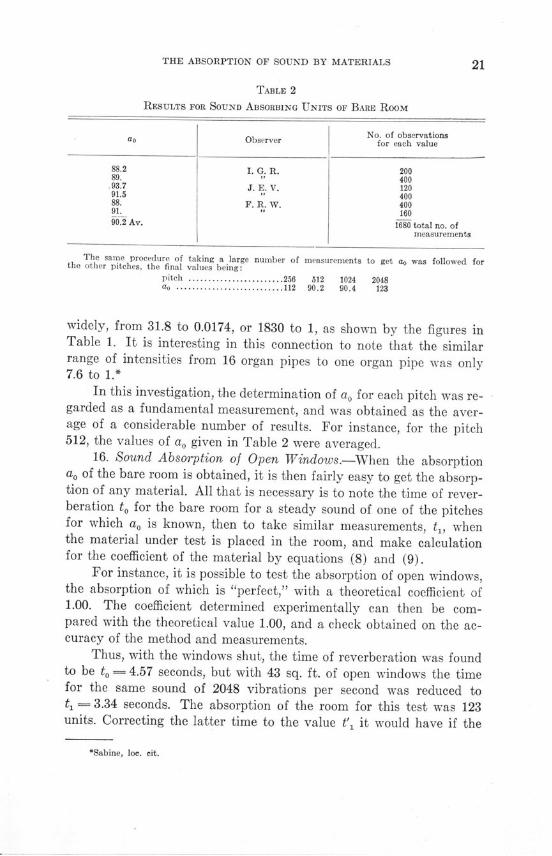
88.2 I. G. R. 20089. " 400093.7 J. E. V. 12091.5 40088. F. R. W. 40091. " 16000.2 Av. 1680 total no. of
measurements
The same procedure of taking a large number of measurements to get ao was followed forthe other pitches, the final values being:
pitch ........................ 256 512 1024 2048. o ........................... 112 90.2 90.4 123
widely, from 31.8 to 0.0174, or 1830 to 1, as shown by the figures inTable 1. It is interesting in this connection to note that the similarrange of intensities from 16 organ pipes to one organ pipe was only7.6 to 1.*
In this investigation, the determination of ao for each pitch was re-garded as a fundamental measurement, and was obtained as the aver-age of a considerable number of results. For instance, for the pitch512, the values of ao given in Table 2 were averaged.
16. Sound Absorption of Open Windows.-When the absorptionao of the bare room is obtained, it is then fairly easy to get the absorp-tion of any material. All that is necessary is to note the time of rever-beration to for the bare room for a steady sound of one of the pitchesfor which ao is known, then to take similar measurements, t,, whenthe material under test is placed in the room, and make calculationfor the coefficient of the material by equations (8) and (9).
For instance, it is possible to test the absorption of open windows,the absorption of which is "perfect," with a theoretical coefficient of1.00. The coefficient determined experimentally can then be com-pared with the theoretical value 1.00, and a check obtained on the ac-curacy of the method and measurements.
Thus, with the windows shut, the time of reverberation was foundto be to = 4.57 seconds, but with 43 sq. ft. of open windows the timefor the same sound of 2048 vibrations per second was reduced tot, = 3.34 seconds. The absorption of the room for this test was 123units. Correcting the latter time to the value t'1 it would have if the
*Sabine, loc. cit.

ILLINOIS ENGINEERING EXPERIMENT STATION
initial intensity were the same for windows open and shut, equation(9),
4V2.3 ao+al 4X 12 180 X 2.3 168(t+- logio a•- i= log10 +3.34(ao+ai)v ao 168 X 1120 log0123 + 334
= 0.08 + 3.34 = 3.42 sec.
where the value (ao + a) = ao = 123 X 43 5 7 = 168 units1i 3.34
(see explanation after equation 9).
Then, from equation (7),
ao(to- t') 1.15al = - t' = 123 X 3-4 = 41.3 units
Now a, equals the absorption of 43 sq. ft. of open windows, w, minusthe absorption of the glass, g, which it replaced when the window wasopened, so that the coefficient for the open window is found by theequation
41.3a,= 43= w-g = w-0.025 and w=0.96+0.025=0.985
That is, the experimental coefficient for the open window space is 0.985where the theoretical value is 1.00. The close agreement here is some-what accidental and is not to be taken as indicative of the accuracy ofall the experimental results. However, this confirmation of the theo-retical coefficient was very gratifying and gave confidence in the coeffi-cients determined for the other materials. Similar experiments per-formed for other pitches gave the results shown in Table 3.
Measuring the time of reverberation with the windows open wasmuch more difficult than with the windows closed. Many measurementswere discarded because of the disturbing effect of sounds of distanttrains, automobiles, and other causes. Some idea of the variation inmeasurements with the windows closed is given by the following re-sults, each value being the average of 80 measurements of the time ofreverberation for the bare room. The second set of data was taken amonth after the first set, as follows:
Pitch ................... 256 512 1024 2048May 30.....................5.29 sec 5.01 5.45 4.59June 30...................5.38 sec 4.88 5.31 4.55Difference, per cent........ 1.7 2.6 2.6 0.9
THE ABSORPTION OF SOUND BY MATERIALS
TABLE 3SOUND ABSORBING COEFFICIENTS FOR OPEN WINDOWS
Pitch.......................Coefficient..................
2560.945
10241.08
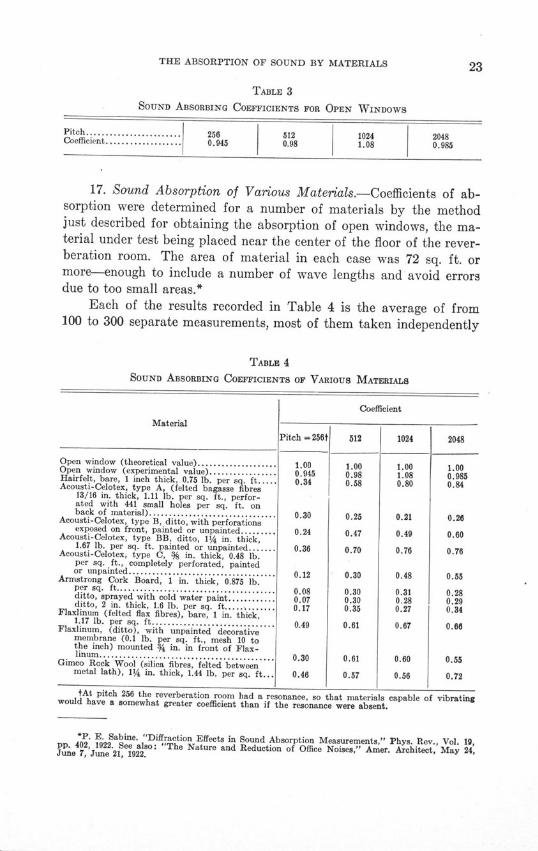
17. Sound Absorption of Various Materials.-Coefficients of ab-sorption were determined for a number of materials by the methodjust described for obtaining the absorption of open windows, the ma-terial under test being placed near the center of the floor of the rever-beration room. The area of material in each case was 72 sq. ft. ormore-enough to include a number of wave lengths and avoid errorsdue to too small areas.*
Each of the results recorded in Table 4 is the average of from100 to 300 separate measurements, most of them taken independently
TABLE 4SOUND ABSORBING COEFFICIENTS OF VARIOUS MATERIALS
Coef
Material
Open window (theoretical value) ....................Open window (experimental value) ...........Hairfelt, bare, 1 inch thick, 0.75 lb. per sq. ft.Acousti-Celotex, type A, (felted bagasse fibres
13/16 in. thick, 1.11 lb. per sq. ft., perfor-ated with 441 small holes per sq. ft. onback of material)...... ..................
Acousti-Celotex, type B, ditto, with perforationsexposed on front, painted or unpainted........
Acousti-Celotex, type BB, ditto, 114 in. thick,1.67 lb. per sq. ft. painted or unpainted ......
Acousti-Celotex, type C, % in. thick, 0.48 lb.per sq. ft., completely perforated, paintedor unpainted........ ...................
Armstrong Cork Board, 1 in. thick, 0.875 lb.per sq. ft.......... ........ ....................ditto, sprayed with cold water paint............ditto, 2 in. thick, 1.6 lb. per sq. ft............
Flaxlinum (felted flax fibres), bare, 1 in. thick,1.17 lb. per sq. ft...........................
Flaxlinum, (ditto), with unpainted decorativemembrane (0.1 lb. per sq. ft., mesh 10 tothe inch) mounted % in. in front of Flax-linum ...................... .... ..................
Gimco Rock Wool (silica fibres, felted betweenmetal lath), 11/4 in. thick, 1.44 lb. per sq. ft...
Pitch = 256t 512
1.000.9450.34
1.000.980.58
TAt pitch 250 the reverberation room had a resonance, so that materials capable of vibratingwould have a somewhat greater coefficient than if the resonance were absent.
*P. E. Sabine. "Diffraction Effects in Sound Absorption Measurements," Phys. Rev., Vol. 19,pp. 402, 1922. See also: "The Nature and Reduction of Office Noises," Amer. Architect, May 24,June 7, June 21, 1922.
ficient
1024
1.001.080.80
0.21
0.49
0.76
0.48
0.310.280.27
0.67
2048
1.000.9850.84
0.26
0.60
0.76
0.55
0.280.290.34
0.66
I
I

ILLINOIS ENGINEERING EXPERIMENT STATION
by three observers. Theoretically, the coefficient should take accountof the surface covered by the material under test. For instance, in theopen window coefficient, the absorption of the glass (0.025) was sub-tracted (see Section 16). In these tests the material was laid on apainted concrete floor, for which the coefficient was estimated to be0.01; but the correction to the coefficient was not made as illustratedin the calculation of the open window coefficient, because the accuracyof the experimental work did not warrant this refinement.
18. Table of Coefficients of Various Materials.-In accordancewith the purpose of this bulletin, additional data from various sourcesare recorded in Table 5, which gives values for a range of pitches.
Table 6 gives coefficients for the materials usually found in audi-toriums. Some of the coefficients are necessarily average, or approxi-mate. For instance, the absorption of a carpet depends on the thick-ness and weight and lining. Curtains vary widely, and the coefficientsare thus only approximate. But, in view of the dearth of information,an approximate coefficient is helpful in estimating the absorption ofrooms.
V. CONCLUSIONS
19. Conclusions.-Absorption of sound by materials is due to theporosity, compressibility, and elasticity. The materials listed in Table6 are all more or less porous, and absorb sound when the sound wavesare dissipated into heat by friction in the narrow pores. Some of thematerials are compressible, such as hairfelt, carpets, etc. Some absorbsound by vibrating, as is probably the case with thin glass, wood, andsuspended plaster ceilings.
Materials that are finished in the factory, such as Akoustolith andRumford Tile, Acousti-Celotex blocks, cork tile, etc., are more likelyto have laboratory coefficients than materials that are installed on thejob, where the skill of the workman determines the efficiency.
A very important consideration is the painting or decoration ofmaterials. If such painting closes the pores of the material, or if paint-ing a membrane stiffens it, the absorbing efficiency is reduced. The
effect of spraying paint is not as serious as that of applying it with a
brush. For instance, cork boards with rather large openings in the sur-
face may be sprayed without appreciable effect. Acoustic plasters maybe sprayed with special paints without serious effect.* Acousti-Celotexappears unique in this regard, because it may be painted in any way,
*Paris, loc. cit., page 283. Application of "distemper" reduced absorption.

THE ABSORPTION OF SOUND BY MATERIALS
eq,~ -. eqC) eqe, eqeq eq eqC) C) C) C) C) C) C) C) C) C) C) C) C) C)
r0 0
) ei 00 d0 P P0 it;
0o 0000
k-.t~ *eqeq CC)e~ C)
0 eO-C t- 0i C)OC C)CS TO 0 C) C)1=) 0HC ) COCOr-l eq < C)*) CO C) tf) C) 0)i- 00 0000^ 00 00 0 5 o o
o eqe c-t0^-t. o-^ oeo t-. eq '^ C)o 0^ fb rofl.-«T- CC)o ift ,» t so eq- 00O 0000 00 00 0 o) 0 0
o OC 0
C"C C)i~co ooo t.- 0 ) co o
- 00 00 00 00 00 0) 00l CVe 0CC1 q 0 C 0 C ) C
- 0 005 O 5 5 0 6C
e~C) 00)0)0)
CC) eqoo.-
Ce 0000
CC) CC)
00 CC
<0
0.00
CE.
z
O
op-q
o
EC0W
02C)C)s
zSo

ILLINOIS ENGINEERING EXPERIMENT STATTflM
TABLE 6
SOUND ABSORBING COEFFICIENTS FOR PITCH 512
Material Coefficientper sq. ft.
Open window......................................................... . ........ 1.00Akoustolith (artificial stone).................................................. 0.36Ambler Sound Absorbing Plaster ............................................. 0.14Balsam Wool, bare, 1 in. thick, 0.26 lb. per sq. ft........................... 0.61Brick wall.................................................................... 0.032Brick wall, painted ........................................................... 0.017B rick, set in cem ent ........................................................... 0.025Calacoustic Plaster............................................................ 0.16Carpet, unlined ............................................................... 0.15Carpet, lined....................... .......................................... 0.20Carpet, with 1 in. Ozite hairfelt ............................................. 0.25Carpet rugs .............................. ...................................... 0.20Acousti-Celotex, type A, unpainted.......................................... 0.25Acousti-Celotex, type B, painted or unpainted ............................... 0.47Acousti-Celotex, type BB, painted or unpainted .............................. 0.70Acousti-Celotex, type C, painted or unpainted .............................. 0.30Armstrong Cork Board, 1 in. thick, 0.875 lb. per sq. ft ...................... 0.30Armstrong Cork Board, sprayed with cold water paint ..................... 0.30Armstrong Cork Board, 2 in. thick, 1.6 lb. per sq. ft ........................ 0.35Cork tile ....................................................................... 0.03Curtains in heavy folds ...................................... .............. 0.40-0.75Fibroblock, unpainted ......................................................... 0.42Flaxlinum , bare, 1 in. thick ................................................... 0.61Flaxlinum, 1 in. thick, with unpainted membrane ............................ 0.61Gimco Rock W ool, bare ..................................................... 0.57Glass, (single thickness) ................... .................................. 0.027Hairfelt, bare, 1 in. thick, 0.75 lb. per sq. ft ................................. 0.58Linoleum ...................................................................... 0.03Marble ......................................................................... 0.01N ashkote A , 1/2 in. thick ...................................... ................. 0.31Nashkote A, % in. thick ........................................ .. ..... .... 0.41N ashkote B, 1/2 in. thick ................................. ..................... 0.37Plaster on wood lath .................................... ...................... 0.034Plaster on m etal lath ......................................................... 0.033Plaster on tile.................................... ........................... 0.025Sabinite Acoustical Plaster ................................................... 0.21Stage opening, depending on stage furnishings ................................ 0.25-0.40Ventilators................ ................................. .................. 0.75W ood, plain.................................. ................................. 0.06W ood, varnished ........................................................ ........ 0.03Acoustic Zenitherm (cork granules cemented with plaster).................. 0.033
Individual ObjectsAdult person .................... . ........... .... ....... ............ .. ........ . 4.7Plain wood seats .................................. ............. ....... 0.15Church pews, per seat.................. .................... .... .......... 0.2-0.5Seats, upholstered seat and back............................................ 0.75-2.00Seat cushions, per seat . ...................................................... 1.00-2.00
even with oil paint with a brush without appreciable effect on the ab-sorption; this is due to the perforations, which allow sound to pene-trate to the interior, even if painted, where absorption takes place.
Porous membranes over materials do not have a marked effect,because sound passes through the open work in the mesh. Such mem-branes can be painted only with caution, because closing the openmesh will prevent sound from getting to the material underneath foreffective absorption. Flexible membranes vibrate under the action ofsound and thus transmit the energy to the material underneath. Hereagain the flexibility must be maintained to preserve the sound-ab-sorbing efficiency.


TABLE 6 ERRATACoef. persq. ft.
Line 4 should read:Balsam Wool, bare, 1 in. thick, 0.26 lb. per sq. ft.................................... . 0.44
Line 41 should read:Acoustic Zenitherm (cork granules cemented with plaster 1.14 in. thick, 2.07 lb. per sq. ft.) 0.33
THE ABSORPTION OF SOUND BY MATERIALS
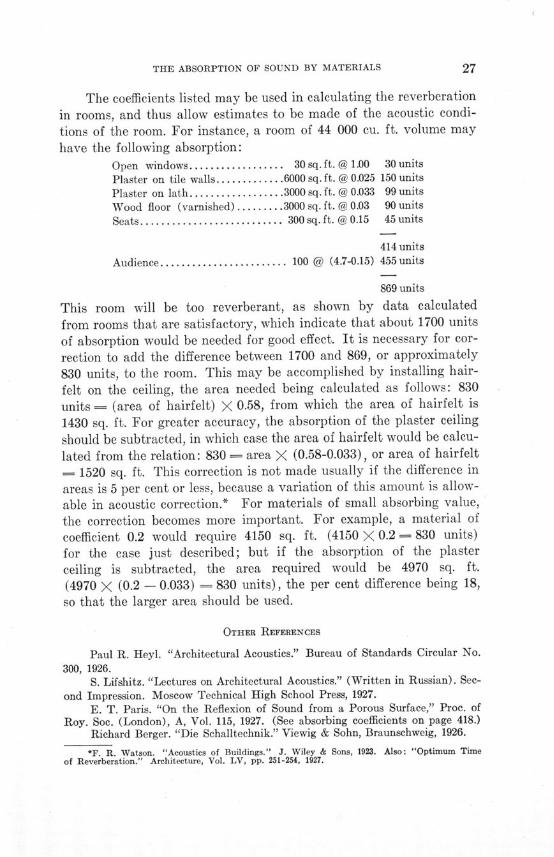
The coefficients listed may be used in calculating the reverberation
in rooms, and thus allow estimates to be made of the acoustic condi-
tions of the room. For instance, a room of 44 000 cu. ft. volume may
have the following absorption:Open windows ................ 30sq.ft. @ 1.00 30 units
Plaster on tile walls............. 6000 sq. ft. @ 0.025 150 units
Plaster on lath.................3000 sq. ft. @ 0.033 99 units
Wood floor (varnished) ......... 3000 sq. ft. @ 0.03 90 units
Seats......................... 300 sq. ft. @ 0.15 45 units
414 units
Audience...................... 100 @ (4.7-0.15) 455 units
869 units
This room will be too reverberant, as shown by data calculated
from rooms that are satisfactory, which indicate that about 1700 units
of absorption would be needed for good effect. It is necessary for cor-
rection to add the difference between 1700 and 869, or approximately
830 units, to the room. This may be accomplished by installing hair-
felt on the ceiling, the area needed being calculated as follows: 830
units = (area of hairfelt) X 0.58, from which the area of hairfelt is
1430 sq. ft. For greater accuracy, the absorption of the plaster ceiling
should be subtracted, in which case the area of hairfelt would be calcu-
lated from the relation: 830 = area X (0.58-0.033), or area of hairfelt
= 1520 sq. ft. This correction is not made usually if the difference in
areas is 5 per cent or less, because a variation of this amount is allow-
able in acoustic correction.* For materials of small absorbing value,
the correction becomes more important. For example, a material of
coefficient 0.2 would require 4150 sq. ft. (4150 X 0.2 = 830 units)
for the case just described; but if the absorption of the plaster
ceiling is subtracted, the area required would be 4970 sq. ft.
(4970 X (0.2 - 0.033) = 830 units), the per cent difference being 18,
so that the larger area should be used.
OTHER REFERENCES
Paul R. Heyl. "Architectural Acoustics." Bureau of Standards Circular No.
300, 1926.S. Lifshitz. "Lectures on Architectural Acoustics." (Written in Russian). Sec-
ond Impression. Moscow Technical High School Press, 1927.
E. T. Paris. "On the Reflexion of Sound from a Porous Surface," Proc. of
Roy. Soc. (London), A, Vol. 115, 1927. (See absorbing coefficients on page 418.)Richard Berger. "Die Schalltechnik." Viewig & Sohn, Braunschweig, 1926.
*F. R. Watson. "Acoustics of Buildings." J. Wiley & Sons, 1923. Also: "Optimum Timeof Reverberation." Architecture, Vol. LV, pp. 251-254, 1927.

RECENT PUBLICATIONS OFTHE ENGINEERING EXPERIMENT STATIONt
Bulletin No. 131. A Study of Air-Steam Mixtures, by L. A. Wilson withC. R. Richards. 1922. Seventy-five cents.
Bulletin No. 132. A Study of Coal Mine Haulage in Illinois, by H. H. Stoek,J. R. Fleming, and A. J. Hoskin. 1922. Seventy cents.
Bulletin No. 183. A Study of Explosions of Gaseous Mixtures, by A. P.Kratz and C. Z. Rosecrans. 1922. Fifty-five cents.
Bulletin No. 134. An Investigation of the Properties of Chilled Iron CarWheels. Part II. Wheel Fit, Static Load, and Flange Pressure Strains. UltimateStrength of Flange, by J. M. Snodgrass and F. H. Guldner. 1922. Forty cents.
Circular No. 10. The Grading of Earth Roads, by Wilbur M. Wilson. 1923.Fifteen cents.
Bulletin No. 135. An Investigation of the Properties of Chilled Iron CarWheels. Part III. Strains Due to Brake Application. Coefficient of Friction andBrake-Shoe Wear, by J. M. Snodgrass and F. H. Guldner. 1923. Fifty cents.
Bulletin No.136. An Investigation of the Fatigue of Metals. Series of1922, by H. F. Moore and T. M. Jasper. 1923. Fifty cents.
Bulletin No. 137. The Strength of Concrete; its Relation to the Cement,Aggregates, and Water, by A. N. Talbot and F. E. Richart. 1923. Sixty cents.
Bulletin No.138. Alkali-Vapor Detector Tubes, by Hugh A. Brown andChas. T. Knipp. 1923. Twenty cents.
Bulletin No. 139. An Investigation of the Maximum Temperatures and Pres-sures Attainable in the Combustion of Gaseous and Liquid Fuels, by G. A. Good-enough and G. T. Felbeck. 1923. Eighty cents.
Bulletin No.140. Viscosities and Surface Tensions of the Soda-Lime-SilicaGlasses at High Temperatures, by E. W. Washburn, G. R. Shelton, and E. E.Libman. 1924. Forty-five cents.
Bulletin No. 141. Investigation of Warm-Air Furnaces and Heating Sys-tems. Part II, by A. C. Willard, A. P. Kratz, and V. S. Day. 1924. Eighty-fivecents.
Bulletin No. 142. Investigation of the Fatigue of Metals; Series of 1923, byH. F. Moore and T. M. Jasper. 1924. Forty-five cents.
Circular No. 11. The Oiling of Earth Roads, by Wilbur M. Wilson. 1924.Fifteen cents.
Bulletin No. 148. Tests on the Hydraulics and Pneumatics of House Plumb-ing, by H. E. Babbitt. 1924. Forty cents.
Bulletin No. 144. Power Studies in Illinois Coal Mining, by A. J. Hoskinand Thomas Fraser. 1924. Forty-five cents.
Circular No. 12. The Analysis of Fuel Gas, by S. W. Parr and F. E. Vanda-veer. 1925. Twenty cents.
Bulletin No. 145. Non-Carrier Radio Telephone Transmission, by H. A.Brown and C. A. Keener. 1925. Fifteen cents.
Bulletin No. 146. Total and Partial Vapor Pressures of Aqueous AmmoniaSolutions, by T. A. Wilson. 1925. Twenty-five cents.
Bulletin No. 147. Investigation of Antennae by Means of Models, by J. T.Tykociner. 1925. Thirty-five cents.
Bulletin No. 148. Radio Telephone Modulation, by H. A. Brown and C. A.Keener. 1925. Thirty cents.
tOnly a partial list of the publications of the Engineering Experiment Station is publishedin this bulletin. For a complete list of the publications as far as Bulletin No. 134, see thatbulletin or the publications previous to it. Copies of the complete list of publications can be ob-tained without charge by addressing the Engineering Experiment Station, Urbana, Ill.
ILLINOIS ENGINEERING EXPERIMENT STATION
Bulletin No. 149. An Investigation of the Efficiency and Durability of SpurGears, by C. W. Ham and J. W. Huckert. 1925. Fifty cents.
Bulletin No. 150. A Thermodynamic Analysis of Gas Engine Tests, by C. Z.Rosecrans and G. T. Felbeck. 1925. Fifty cents.
Bulletin No. 151. A Study of Skip Hoisting at Illinois Coal Mines, by ArthurJ. Hoskin. 1925. Thirty-five cents.
Bulletin No. 152. Investigation of the Fatigue of Metals; Series of 1925, byH. F. Moore and T. M. Jasper. 1925. Fifty cents.
*Bulletin No. 153. The Effect of Temperature on the Registration of SinglePhase Induction Watthour Meters, by A. R. Knight and M. A. Faucett. 1926.Fifteen cents.
*Bulletin No. 154. An Investigation of the Translucency of Porcelains, byC. W. Parmelee and P. W. Ketchum. 1926. Fifteen cents.
Bulletin No. 155. The Cause and Prevention of Embrittlement of BoilerPlate, by S. W. Parr and F. G. Straub. 1926. Thirty-five cents.
Bulletin No. 156. Tests of the Fatigue Strength of Cast Steel, by H. F.Moore. 1926. Ten cents.
*Bulletin No. 157. An Investigation of the Mechanism of Explosive Reac-tions, by C. Z. Rosecrans. 1926. Thirty-five cents.
*Circular No. 18. The Density of Carbon Dioxide with a Table of Recalcu-lated Values, by S. W. Parr and W. R. King, Jr. 1926. Fifteen cents.
*Circular No. 14. The Measurement of the Permeability of Ceramic Bodies,by P. W. Ketchum, A. E. R. Westman, and R. K. Hursh. 1926. Fifteen cents.
*Bulletin No. 158. The Measurement of Air Quantities and Energy Losses inMine Entries, by A. C. Callen and C. M. Smith. 1926. Forty-five cents.
*Bulletin No. 159. An Investigation of Twist Drills. Part II, by B. W. Bene-dict and A. E. Hershey. 1926. Forty cents.
*Bulletin No. 160. A Thermodynamic Analysis of Internal Combustion EngineCycles, by G. A. Goodenough and J. B. Baker. 1927. Forty cents.
*Bulletin No.161. Short Wave Transmitters and Methods of Tuning, byJ. T. Tykociner. 1927. Thirty-five cents.
Bulletin No. 162. Tests on the Bearing Value of Large Rollers, by W. M.Wilson. 1927. Forty cents.
*Bulletin No. 163. A Study of Hard Finish Gypsum Plasters, by Thomas N.McVay. 1927. Twenty-five cents.
Bulletin No. 164. Tests of the Fatigue Strength of Cast Iron, by H. F.Moore, S. W. Lyon, and N. P. Inglis. 1927. Thirty cents.
Bulletin No. 165. A Study of Fatigue Cracks in Car Axles, by H. F. Moore.1927. Fifteen cents.
Bulletin No.166. Investigation of Web Stresses in Reinforced ConcreteBeams, by F. E. Richart. 1927. Sixty cents.
*Bulletin No. 167. Freight Train Curve-Resistance on a One-Degree Curveand a Three-Degree Curve, by Edward C. Schmidt. 1927. Twenty-five cents.
*Bulletin No. 168. Heat Transmission Through Boiler Tubes, by Huber 0.Croft. 1927. Thirty cents.
*Bulletin No. 169. Effect of Enclosures on Direct Steam Radiator Perform-ance, by Maurice K. Fahnestock. 1927. Twenty cents.
*Bulletin No.170. The Measurement of Air Quantities and Energy Losses inMine Entries. Part II, by Alfred C. Callen and Cloyde M. Smith. 1927 Forty-five cents.
*Bulletin No. 171. Heat Transfer in Ammonia Condensers, by Alonzo P.Kratz, Horace J. Macintire, and Richard E. Gould. 1927. Thirty-five cents.
*Bulletin No. 172. The Absorption of Sound by Materials, by Floyd R. Wat-son. 1927. Twenty cents.
*A limited number of copies of bulletins starred are available for free distribution.


THE UNIVERSITY OF ILLINOIS'THE STATE UNIVERSITY
UrbanaDAVID KINLEY, Ph.D., LL.D., President
THE UNIVERSITY INCLUDES THE FOLLOWING DEPARTMENTS:
The Graduate SchoolThe College of Liberal Arts and Sciences (Curricula: General with majors, in
the Humanities and the Sciences; Chemistry and Chemical Engineering;Pre-legal, Pre-medical and Pre-dental; Pre-journalism, Home Economics, Eco-nomic Entomology and Applied Optics)
The College of Commerce and Business Administration (Curricula: General'Business, Banking and Finance, Insurance, Accountancy, Railway Adminis-tration, Railway Transportation, Industrial Administration, Foreign Com-merce, Commercial Teachers, Trade and Civic Secretarial Service, PublicUtilities, Commerce and Law)
The College of Engineering (Curricula: Architecture, Ceramics; Architectural,Ceramic, Civil, Electrical, Gas, General, Mechanical, Mining, and RailwayEngineering; Engineering Physics)
The College of Agriculture (Curricula: General Agriculture; Floriculture; HomeEconomics; Landscape Architecture; Smith-Hughes--in conjunction with theCollege of Education)
The College of Education (Curricula: Two year, prescribing junior standing foradmission-General Education, Smith-Hughes Agriculture, Smith-HughesHome Economics, Public School Music; Four year, admitting from the highschool-Industrial Education, Athletic Coaching, Physical Education
The University High School is the practice school of the College ofEducation)
The School of Music (four-year curriculum)The College of Law (three-year curriculum based on two years of college work.
For requirements after January 1, 1929, address the Registrar)The Library School (two-year curriculum for college graduates)School of Journalism (two-year curriculum based on two years of college work)The College of Medicine (in Chicago)The College of Dentistry (in Chicago)The School of Pharmacy (in Chicago)The Summer Session (eight weeks)Experiment Stations and Scientific Bureaus: U. 8. Agricultural Experiment
Station; Engineering Experiment-Station; State Natural History Survey;State Water Survey; State Geological Sutvey; Bureau of EducationalResearch.
The Library collections contain (June 1, P126) 711,75a volumes and 155,831pamphlets.
For catalogs and information addressTHE REGISTRAR
Urbania, Illinois
*r.^'.'^ 1 1
"- "<
> ^ ~ y i'
;'
/'
e i i :^ *' '-. -
1/
<