Absorbance of Electromagnetic Radiation In absorption spectroscopy a beam of electromagnetic...
49
Absorbance of Electromagnetic Radiation • In absorption spectroscopy a beam of electromagnetic radiation passes through a sample. • Much of the radiation is transmitted without a loss in intensity. • At selected wavelengths the radiation's intensity is attenuated. • The process of attenuation is called absorption. • Two general requirements must be met if an analyte is to absorb electromagnetic radiation. – The first requirement is that there must be a mechanism by which the radiation's electric field or magnetic field interacts with the analyte. – For ultraviolet and visible radiation, this interaction involves the electronic energy of valence electrons. – A chemical bond's vibrational energy is altered by the absorbance of infrared radiation.
-
date post
22-Dec-2015 -
Category
Documents
-
view
222 -
download
0
Transcript of Absorbance of Electromagnetic Radiation In absorption spectroscopy a beam of electromagnetic...

Absorbance of Electromagnetic Radiation
• In absorption spectroscopy a beam of electromagnetic radiation passes through a sample.
• Much of the radiation is transmitted without a loss in intensity. • At selected wavelengths the radiation's intensity is attenuated. • The process of attenuation is called absorption. • Two general requirements must be met if an analyte is to
absorb electromagnetic radiation. – The first requirement is that there must be a mechanism by
which the radiation's electric field or magnetic field interacts with the analyte.
– For ultraviolet and visible radiation, this interaction involves the electronic energy of valence electrons.
– A chemical bond's vibrational energy is altered by the absorbance of infrared radiation.

• The second requirement is that the energy of the electromagnetic radiation must exactly equal the difference in energy, AE, between two of the
analytes quantized energy states.

Molecular Orbital (MO)Theory Review
MO Theory: Electrons in atoms exist in atomic orbitals whileelectrons in molecules exist in molecular orbitals.
Bonding MO: A MO where electrons have a lower energy thanthey would in isolated atomic orbitals
Anitbonding MO: A MO in which electrons have a higher energythan they would in isolated atomic orbitals.
Ground State: Refers to the state of lowest energy. Electrons canbe promoted from a ground state to a higher excited state by input Of energy.
Excited State: Any electronic state other than the ground state.

(a)
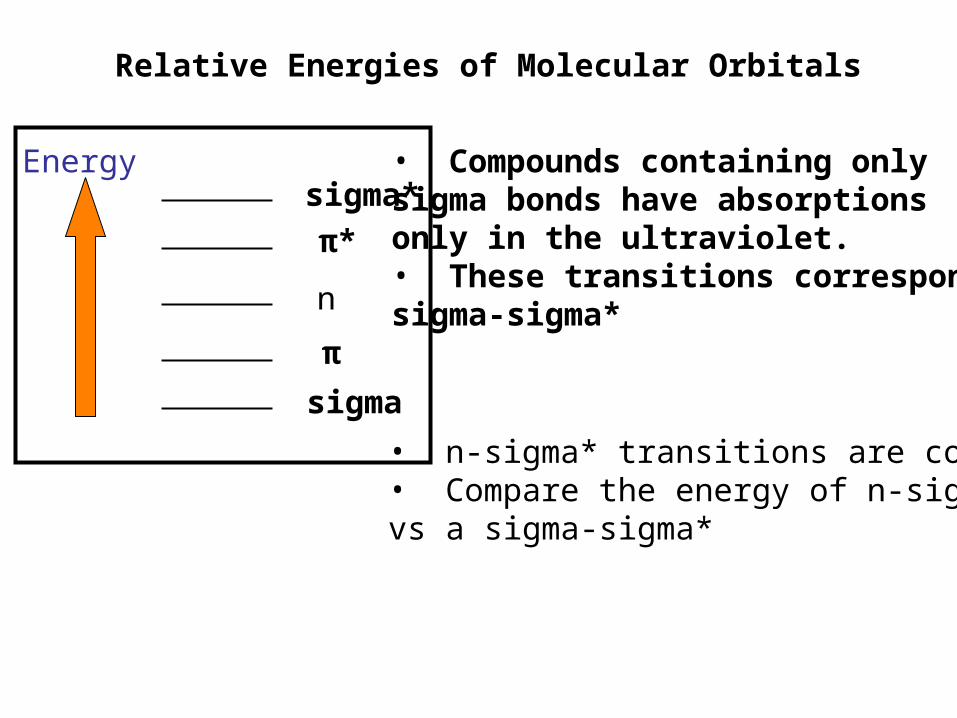
Relative Energies of Molecular Orbitals
Energy
sigma
π
n
π*
sigma*• Compounds containing onlysigma bonds have absorptionsonly in the ultraviolet. • These transitions correspond tosigma-sigma*
• n-sigma* transitions are common• Compare the energy of n-sigma*vs a sigma-sigma*

Molecular Absorption
• Molecules undergo three types of quantized transitions when excited by ultraviolet, visible, and infrared radiation.
1. electronic transition • The transition of an electron between two
orbitals )the energy by the photon must be exactly the same as the energy difference between the two orbital energies( and the absorption process is called electronic absorption

Molecular orbital diagram for formaldehyde
• In electronic transition, an electron from one molecular orbital moves to another orbital with an increase or decrease in the energy of the molecule• The lowest energy electronic transition in formaldehyde involves the promotion of a non-bonding (n) electron to the anti- bonding * orbital

Singlet state and triplet stat
Singlet state: the state in Singlet state: the state in
which the spins are opposed which the spins are paired
**
n n
S1, 355, UVT1, 397, visible
In general T1 is of lower energy than S1

2 .vibrational and rotational transitions
• Vibration of the atoms of the molecule with respect to one another;
• Atoms and groups of atoms within molecules can undergo various types of vibrations and each requires a discrete amount of energy to initiate or maintain.
• Also molecules can rotate around their axes a matter that requires discrete amount of energy.

Various Types of Vibrations

Vibrations of formaldehyde
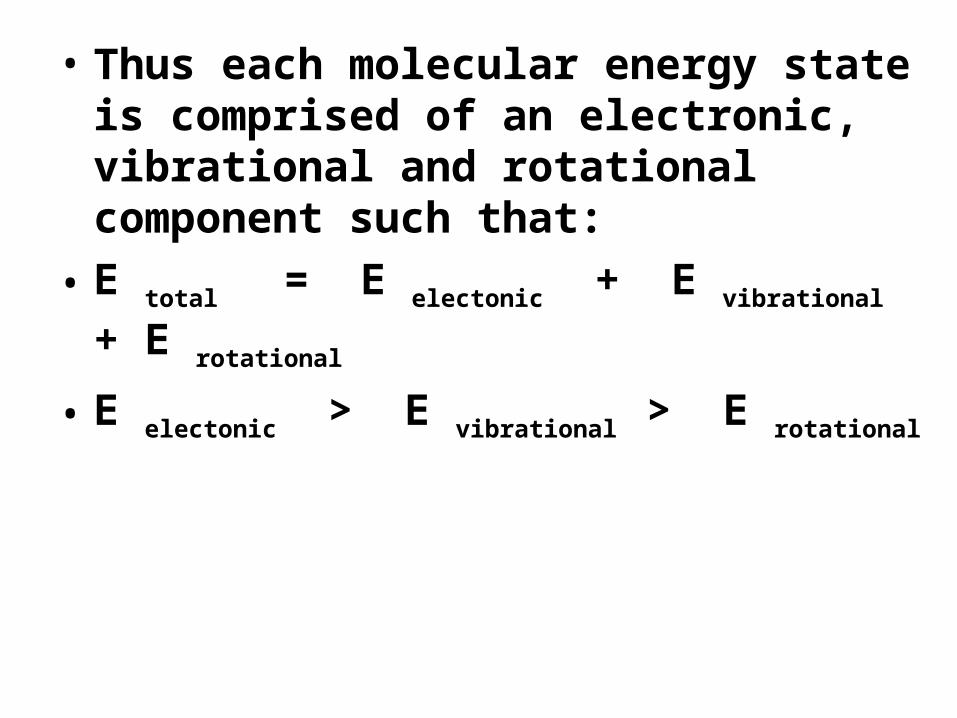
• Thus each molecular energy state is comprised of an electronic, vibrational and rotational component such that:
• E total = E electonic + E vibrational + E rotational
• E electonic > E vibrational > E rotational
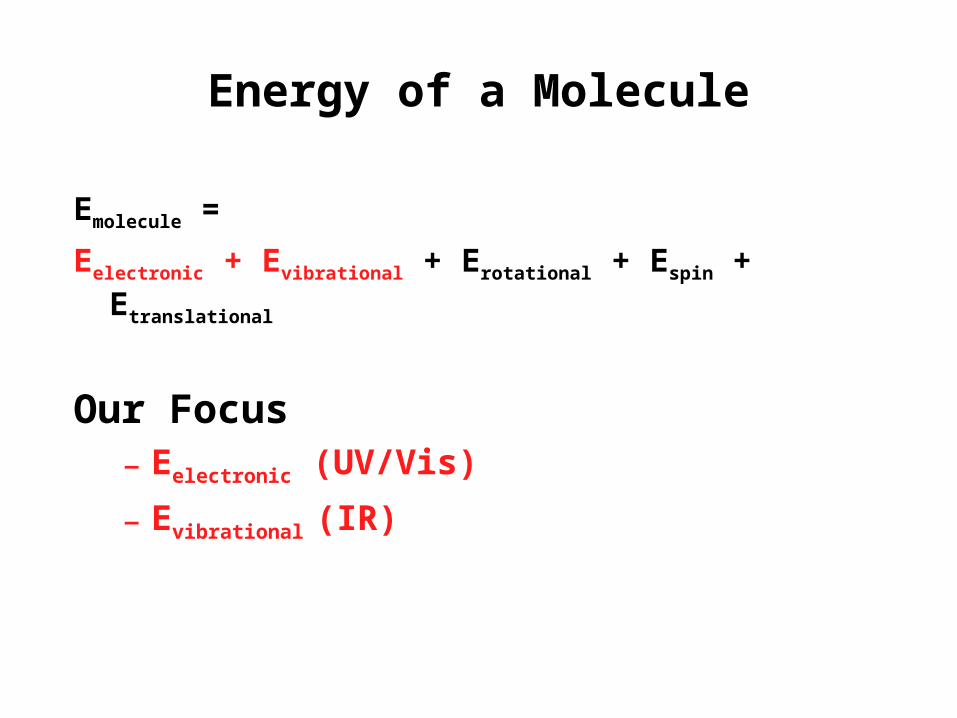
Energy of a Molecule
Emolecule =
Eelectronic + Evibrational + Erotational + Espin + Etranslational
Our Focus– Eelectronic )UV/Vis(
– Evibrational )IR(

Energy of a Molecule
Eelectronic --> 105-106 kJ/mole --> UV-Vis
UV-Vis range: 200 - 700 nm
Evibrational --> 10 - 40 kJ/mole --> IR
Near IR: 800 - 2500 nm )5000 nm(
Mid-IR : 5000 nm - 25,000 nm )5 microns - 25 microns(
Erotational --> 10 kJ/mole --> microwaves
Espin --> 10-3 J/mole --> Radiofrequency
Etranslational --> continuous

Electronic transitions

What happens to the absorbed energy?

• Internal Conversion )IC(:
Radiationless transition between states with same spin quantum numbers ) S1 S0(
• Intersystem Crossing )ISC(:
Radiationless transition between states with different spin quantum numbers ) S1 T1(
• Fluorescence:
Radiation transition between states with the same spin quantum number ) S1 S0(
• Phosphorescence:
Radiation transition between states with different spin quantum number ) T1 S0(

Combined electronic, vibrational, and rotational transitions
• When a molecule absorbs light having sufficient energy to cause an electronic transition, vibrational and rotational transitions‑that is, changes in the vibrational and rotational states‑can occur as well.
• The reason why electronic absorption bands are usually very broad is that many different vibrational and rotational levels are available at slightly different energies. Therefore, a molecule could absorb photons with a fairly wide range of energies and still be promoted from the ground electronic state to one particular excited electronic state.


Absorption of Light Beer’s Law-1
P0 P
0P
PT

Beer’s Law-2
P0 = 10,000 P = 5,000
5.010000
5000
0
P
PT
-b-

Beer’s Law- 3
P0 = 10,000 P = 2,500
25.010000
2500
0
P
PT
--2b--

Beer’s Law-4
P0 = 10,000 P = 1,250
125.010000
1250
0
P
PT
----3b----

Beer’s Law-5
P0 = 10,000 P = 625
0625.010000
625
0
P
PT
------4b------

Relationship between transmittance and cell thickness
Thickness, b Transmittance, T0 11 0.52 0.253 0.1254 0.06255 0.031256 0.0156257 0.00781258 0.003906259 0.001953125
10 0.000976563
0
0.2
0.4
0.6
0.8
1
1.2
0 1 2 3 4 5 6 7 8 9 10
Thickness, multiples of b
Tra
nsm
itta
nce
0P
PT

Relationship between absorbance and cell thickness
abcA
P
PTA
0
loglog
Thickness, b Transmittance, T A = -log T0 1 0.0001 0.5 0.3012 0.25 0.6023 0.125 0.9034 0.0625 1.2045 0.03125 1.5056 0.015625 1.8067 0.0078125 2.1078 0.00390625 2.4089 0.001953125 2.709
10 0.000976563 3.010
0.0
0.5
1.0
1.5
2.0
2.5
3.0
3.5
0 1 2 3 4 5 6 7 8 9 10
Thickness, multiples of b
Ab
sorb
an
ce
ionconcentrat
thickness
tyabsorptivi
absorbance
c
b
a
A


Relation between Absorbance and Transmittance
abcTA log
Calculation of absorbance from transmittance T %T A
1 100 0.0000.9 90 0.0460.8 80 0.0970.7 70 0.1550.6 60 0.2220.5 50 0.3010.4 40 0.3980.3 30 0.5230.2 20 0.6990.1 10 1.000
0.075 7.5 1.1250.05 5 1.3010.01 1 2.000
0.001 0.1 3.000
Cell B3=100*A3Cell C3=-log(A3)
20
40
60
80
100
200 250 300 350 400 450 500
20
40
60
80
100
200 250 300 350 400 450 500
Transmittance / Nanometers Paged Z-Zoom CURSOR
File # 1 : UVSIN204 Res=None
%T A
0
12

Absorbance and Transmittance Spectra
abcTA log
20
40
60
80
100
200 250 300 350 400 450 500
20
40
60
80
100
200 250 300 350 400 450 500
Transmittance / Nanometers Paged Z-Zoom CURSOR
File # 1 : UVSIN204 Res=None
%T A
0
12
0
.2
.4
.6
.8
200 250 300 350 400 450 500
Absorbance / Nanometers Paged Z-Zoom CURSOR
File # 1 : UVSIN204 Res=None
% Transmission Spectrum Absorbance Spectrum

Absorbance Spectra and Concentration
abcTA log
Absorbance Spectra
0
.2
.4
.6
.8
1
200 250 300 350 400 450 500
0
.2
.4
.6
.8
1
200 250 300 350 400 450 500
A concB
concA

Absorbance and Concentration: Beer's Law
• When monochromatic EMR passes through an infinitesimally thin layer of sample, of thickness dx, it experiences a decrease in power of dP.
• The fractional decrease in power is proportional to the
sample's thickness and the analyte's concentration, C
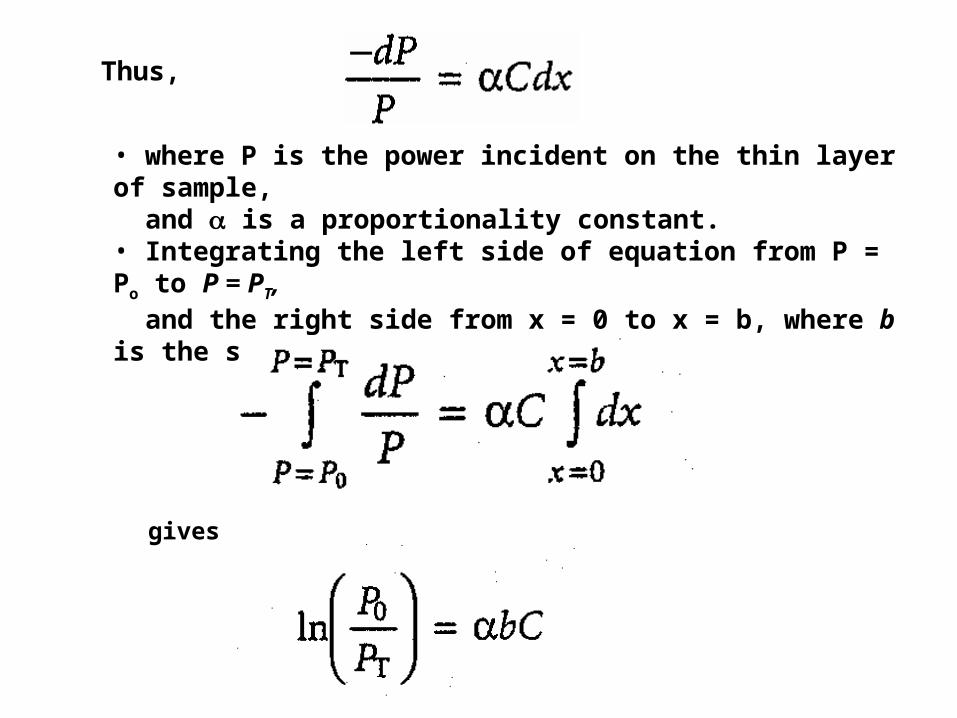
• where P is the power incident on the thin layer of sample, and is a proportionality constant. • Integrating the left side of equation from P = Po to P = PT, and the right side from x = 0 to x = b, where b is the sample's overall thickness,
Thus,
gives

• Converting from ln to log and substituting log po/pT by A )absorbance( gives
• A = abC
Where a is tha anlayte absorptivity with units of
cm-1conc-1.• When concentration is expressed using molarity the
absorptivity is replaced by molar absorptivity • The absorptivity and molar absorptivity give, in
effect, the probability that the analyte will absorb a photon of given energy.
• As a result, values for both a and depend on the wavelength of electromagnetic radiation.

Predicting Concentrations from Absorbance
Spectra 30.00 0.16260.00 0.33090.00 0.499
120.00 0.660150.00 0.840
unknown 0.539Regression equationslope 0.00562Intercept -0.0076Conc of unknown 97.25978648
0.00
0.20
0.40
0.60
0.80
1.00
Conc, Micro-M
Ab
sorb
ance

Absorption Spectra of MixturesContaining n components
n
n
n
bcabcabcabcaA
bcabcabcabcaA
bcabcabcabcaA
nnnnn
321
321
321
22222
11111

Absorption Spectra of MixturesContaining n components
Constant pathlength
n
n
n
ckckckckA
ckckckckA
ckckckckA
nnnnn
321
321
321
22222
11111

Limitations to Beer’s Law
• Ideally, according to Beer's law, a calibration curve of absorbance versus the concentration of analyte in a series of standard solutions should be a straight line with an intercept of 0 and a slope of ab or b.
• In many cases, calibration curves are found to be nonlinear.• Deviations from linearity are divided into three categories:
fundamental, chemical, and instrumental.
Fundamental Limitations to Beers Law Beer's law
• Beer’s law is a limiting law that is valid only for low concentrations of analyte.
1. At higher concentrations the individual particles of analyte no longer behave independently of one another.– The resulting interaction between particles of analyte may
change the value of a or . 2. The absorptivity, a, and molar absorptivity, ,
depend on the sample's refractive index. – Since the refractive index varies with the analyte's
concentration, the values of a and will change. – For sufficiently low concentrations of analyte, the
refractive index remains essentially constant, and the calibration curve is linear.

Chemical Limitations to Beer's Law
• Chemical deviations from Beer's law can occur when the absorbing species is involved in an equilibrium reaction.
• Consider, as an example, the weak acid, HA. • To construct a Beer's law calibration curve, several
standards containing known total concentrations of HA, Ctot, are prepared and the absorbance of each is measured at the same wavelength.
• Since HA is a weak acid, it exists in equilibrium with its conjugate weak base, A‑
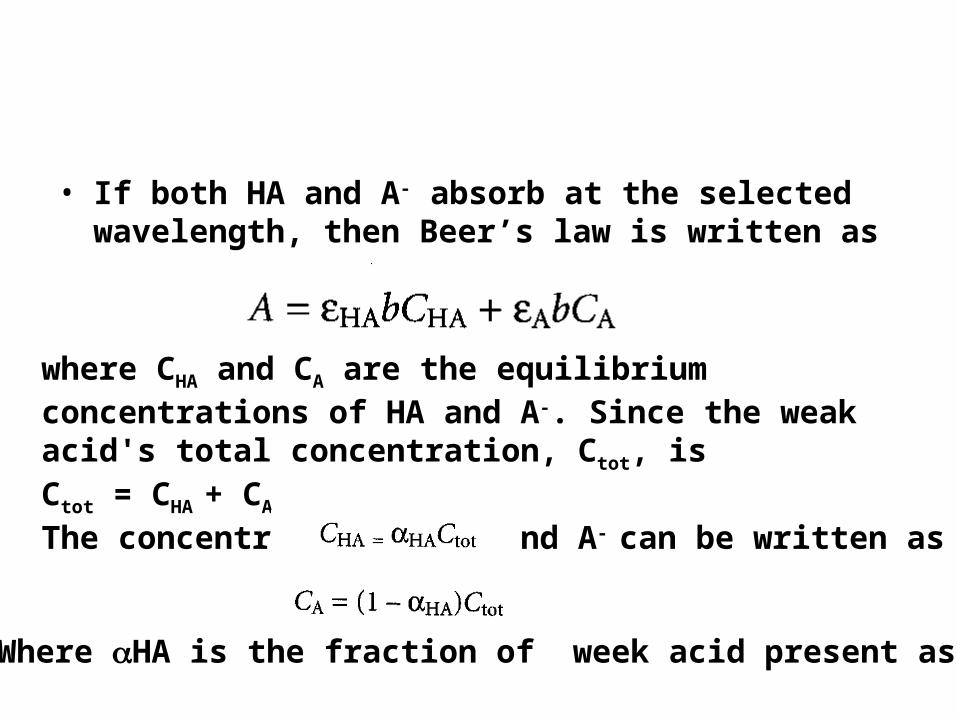
• If both HA and A- absorb at the selected wavelength, then Beer’s law is written as
where CHA and CA are the equilibrium concentrations of HA and A‑. Since the weak acid's total concentration, Ctot, isCtot = CHA + CA
The concentration of HA and A- can be written as
Where HA is the fraction of week acid present as HA

• Thus,
• Because values of HA may depend on the concentration of HA, equation may not be linear. • A Beer's law calibration curve of A versus Ctot will be linear if one of two conditions is met. 1. If the wavelength is chosen such that HA and A are equal, then equation simplifies to A = b Ctot
and a linear curve is realized

2. Alternatively, if HA is held constant for all standards, then equation will be a straight line at all wavelengths.
• Because HA is a weak acid, values of HA change with pH.
• To maintain a constant value for HA , therefore, we need to buffer each standard solution to the same pH.
• Depending on the relative values of HA and A, the calibration curve will show a positive or negative deviation from Beer's law if the standards are not buffered to the same pH.

Instrumental Limitations to Beer's Law
• There are two principal instrumental limitations to Beer's law.
1. Beer’s law is strictly valid for purely monochromatic
radiation; that is, for radiation consisting of only one wavelength.
– even the best wavelength selector passes radiation with a small, but finite effective bandwidth.
– Using polychromatic radiation always gives a negative deviation from Beer's law, but is minimized if the value of is essentially constant over the wavelength range passed by the wavelength selector.
– For this reason, it is preferable to make absorbance measurements at a broad absorption peak.

Effect of wavelength on the linearity of a Beer’s law calibration curve

2. Stray Radiation
• Stray radiation arises from imperfections within the wavelength selector that allows extraneous light to "leak" into the instrument.
• Stray radiation adds an additional contribution, Pstray, to the radiant power reaching the detector; thus
• For small concentrations of analyte, Pstray is significantly smaller than Poand PT, and the absorbance is unaffected by the stray radiation. • At higher concentrations of analyte, Pstray is no longer significantly smaller than PT and the absorbance is smaller than expected. The result is a negative deviation from Beer's law.