Absolute versus Comparative Advantage: Consequences for … · Web viewWe examine the impact of...
64
January 2017 Absolute versus Comparative Advantage: Consequences for Gender Gaps in STEM and College Access Prashant Loyalka, May Maani, Yue Qu, Sean Sylvia Abstract We examine the impact of the competitive “STEM track choice”—a defining institutional feature of a number of national education systems—on gender gaps in STEM majors and college access. Many national education systems require high school students to make a largely irreversible, competitive choice between STEM and non- STEM tracks. This choice determines whether students will compete with STEM or non-STEM track students for college entrance. Using two datasets from China, we show that differences in how girls and boys make this choice are important reasons that girls select out of STEM, independent of gender differences in preference or ability. Specifically, we find that girls are more likely to choose their track by comparing their own STEM and non-STEM Working Paper 311 January 2017 reap.fsi.stanford.edu
Transcript of Absolute versus Comparative Advantage: Consequences for … · Web viewWe examine the impact of...
January 2017
Absolute versus Comparative Advantage: Consequences for Gender Gaps in STEM and College Access
Prashant Loyalka, May Maani, Yue Qu, Sean Sylvia
Abstract
We examine the impact of the competitive “STEM track choice”—a defining institutional feature
of a number of national education systems—on gender gaps in STEM majors and college access.
Many national education systems require high school students to make a largely irreversible,
competitive choice between STEM and non-STEM tracks. This choice determines whether
students will compete with STEM or non-STEM track students for college entrance. Using two
datasets from China, we show that differences in how girls and boys make this choice are
important reasons that girls select out of STEM, independent of gender differences in preference
or ability. Specifically, we find that girls are more likely to choose their track by comparing their
own STEM and non-STEM abilities (their “comparative advantage”) whereas boys are more
likely to base their decision on how their STEM ability compares to others (their “absolute
advantage”). Because girls often score higher in non-STEM subjects, looking at comparative
advantage leads girls who would be competitive in the STEM track to nevertheless choose the
non-STEM track. We further show that choosing the non-STEM track decreases the chance that
these girls access college and elite colleges. Thus, the STEM track choice not only leads to
gender imbalance in the number of STEM graduates but also to gender inequality in college
access.
Working Paper 311
January 2017
reap.fsi.stanford.edu
Absolute versus Comparative Advantage: Consequences for Gender Gaps in STEM and College Access
Prashant Loyalka, Freeman Spogli Institute for International Studies, Stanford University, Fifth Floor Encina Hall, Stanford, CA 94305 USA; [email protected]; Phone: 1.650.724.5302;
Fax: 650.725.1992
May Maani, China Institute for Educational Finance Research, Peking University, Haidian District, Beijing, China 100871; [email protected]; Phone: 86.15910594104; Fax:
86.10.62756183
Yue Qu, Institute of Population and Labor Economics, Chinese Academy of Social Sciences, 5 Jianguomennei Dajie, Beijing, China 100732; [email protected]; Phone: 86.10.85196067; Fax:
86.10.85195427
Sean Sylvia, School of Economics, Renmin University of China, 59 Zhongguancun Avenue, Beijing, 100872 China; [email protected]; Phone: 1.650.862.0466; Fax: 650.725.1992
January 2017
Corresponding Author:Sean Sylvia59 Zhongguancun AvenueRenmin University of China Haidian Qu, Beijing 100872 ChinaEmail: [email protected]
1
ABSTRACT
We examine the impact of the competitive “STEM track choice”—a defining institutional
feature of a number of national education systems—on gender gaps in STEM majors and college
access. Many national education systems require high school students to make a largely
irreversible, competitive choice between STEM and non-STEM tracks. This choice determines
whether students will compete with STEM or non-STEM track students for college entrance.
Using two datasets from China, we show that differences in how girls and boys make this choice
are important reasons that girls select out of STEM, independent of gender differences in
preference or ability. Specifically, we find that girls are more likely to choose their track by
comparing their own STEM and non-STEM abilities (their “comparative advantage”) whereas
boys are more likely to base their decision on how their STEM ability compares to others (their
“absolute advantage”). Because girls often score higher in non-STEM subjects, looking at
comparative advantage leads girls who would be competitive in the STEM track to nevertheless
choose the non-STEM track. We further show that choosing the non-STEM track decreases the
chance that these girls access college and elite colleges. Thus, the STEM track choice not only
leads to gender imbalance in the number of STEM graduates but also to gender inequality in
college access.
Working Paper 311
January 2017
reap.fsi.stanford.edu
JEL: I20, I24, I25, J16, J24
Keywords: gender, STEM, choices, instrumental variables, competition, comparative advantage
Absolute versus Comparative Advantage: Consequences for Gender Gaps in STEM and College Access
In countries around the world, girls enter key science, technology, engineering and math
(STEM) majors at much lower rates than boys. For example, only about 18% of engineering
students in the United States, 19% of engineering students in Europe and 14% of engineering and
science students in Japan are female (National Science Board, 2012; Eurostat, 2012; MEXT,
2009). In Brazil, boys outnumber girls by almost 8 to 1 in electrical engineering and computer
science majors, while in Russia, boys outnumber girls by almost 4 to 1 in engineering and
technology majors (INEP, 2013; Gerber and Schaefer, 2004). The substantial gender gap in
STEM majors—which translates into a substantial gender gap in higher-paying science and
engineering occupations after students graduate from college—has significant implications for
social inequality (Barres, 2006, Xie and Shauman, 2003). This gender gap is also a source of
economic inefficiency if girls who would be more economically productive in STEM
occupations (as opposed to non-STEM occupations) systematically fail to enter STEM majors
(Kingdon, 2002).
Because gender gaps in STEM majors have implications for social inequality and
economic inefficiency, researchers have spent decades examining the determinants of these gaps.
Studies have shown that gender differences in STEM ability, as measured by math and science
achievement scores, only explain a small part of the gender gap (Turner and Bowen, 1999).
1
Instead, studies point to other factors including the social conditioning of girls to be less
confident about their STEM ability (Valian, 1999); girls of the same ability level as boys
expecting lower labor market wages if they enter STEM fields (Turner and Bowen, 1999); and
girls and boys having different preferences (e.g. interest in the subject matter) for STEM versus
non-STEM majors (Ceci and Williams, 2011; Zafar, 2009).
While much research has been done on the above factors, substantially less research has
examined how institutional features of national education systems may lead to gender gaps in
STEM. An important feature of many national education systems is that the context in which
female and male students must choose whether to enter STEM majors is highly competitive. In
particular, in countries as diverse as Russia, India, and China students must make a crucial and
costly-to-reverse "STEM track choice" in academic high school. The STEM track choice
requires students to choose whether to enter a STEM or non-STEM track during high school that
will prepare them for a STEM or non-STEM versions of the college entrance exam (CEE).
Performance on the STEM or non-STEM CEE, in turn, almost fully determines whether students
can gain admission into a limited number of STEM or non-STEM major spots (or places) in
college and elite colleges. The STEM track choice may thus be considered a highly competitive
choice, because it is closely related to the competition to enter college or elite colleges. In other
words, while students in countries like the United States can choose to enter STEM majors once
they get to college, the choice to enter STEM majors in the world’s largest education systems
must be made in high school and is closely tied with competitive pressures to get into college
and elite colleges.
There is some indirect evidence from the economics literature that supports the notion
that institutional features such as the competitive STEM track choice may impact gender gaps in
2
STEM. Several experimental studies, for example, have shown that girls choose to shy away
from competitive environments compared to boys (Niederle and Vesterlund, 2010; Niederle and
Vesterlund, 2007; Gneezy and Rustichini, 2004). There is also evidence that girls may be more
likely to shy away from competitive environments in which they think boys have an advantage
(Gunther et al., 2010).
In addition to how students approach competition generally, another factor that could
influence students’ STEM choice is how they perceive or “frame” their own ability. If girls and
boys frame their STEM ability in different ways, this could also contribute to the gender gap in
STEM (see e.g. Croson and Gneezy 2010). Research in psychology suggests that students frame
their ability in two main ways (see Marsh, 1986; Marsh, 1990; Eccles, 1994; Möller and Köller,
2001; Barone, 2011). First, students may compare their STEM ability (i.e. achievement scores)
with the STEM ability of others in their peer group (i.e. students can look at their “absolute
advantage” in STEM). In a practical manner, students rank themselves versus their peers by
comparing their own scores (on math and science tests) with the scores of others. Second,
students may make intrapersonal comparisons of their own STEM ability versus their own non-
STEM ability (i.e. students can look at their “comparative advantage” in STEM). This happens
when students look at their own STEM achievement scores versus their own non-STEM
achievement scores.
How girls and boys frame their ability in different ways as they chose whether or not to
enter competitive STEM or non-STEM tracks could influence the gender gap—independent of
gender differences in preferences or ability. One hypothesis, for instance, is that girls may deal
with the competitive nature of the STEM track choice by reasoning in terms of their comparative
advantage rather than their absolute advantage. In other words, they may respond to competition
3
by turning to an internal frame of reference (comparative advantage) rather than an external
frame of reference (absolute advantage). If it is also the case that girls are more likely than boys
to frame their ability in terms of comparative advantage in a competitive environment, this factor
alone may skew girls’ track choices away from STEM. Despite the fact that the majority of the
world’s engineers are now produced in competitive educational systems like those of China,
India, Russia, and of various countries in Europe, there is no evidence on gender differences in
how students sort into STEM and non-STEM tracks in this environment. Nor is there evidence
on the causal consequences of STEM track choices on the outcome that students are competing
for: access to colleges and elite colleges.
In this paper, we have two objectives. First, we seek to examine how girls and boys frame
their abilities when making STEM choices in a competitive environment. Second, we seek to
examine the causal consequences of the STEM track choice for gender inequality in access to
colleges and elite colleges. To meet these objectives, we draw on two datasets from China—a
country with a highly competitive education system that produces more scientists and engineers
than any other nation (Carnoy et al., 2013; Gereffi, Wadhwa, Rissing and Ong, 2008). We use
multivariate regression analysis to estimate how comparative and absolute advantage
differentially determines STEM track choices between girls and boys. We also use an
instrumental variables strategy to estimate a local average treatment effect (LATE) of the STEM
track choice on access to colleges and elite colleges (for all students and for girls and boys
separately). The LATE estimators reflect the average impacts of choosing the STEM track on
admissions to college for individuals who are induced to take a treatment by assignment to the
treatment (Angrist, Imbens and Rubin, 1996).
4
The rest of this paper is organized as follows. In the next section we provide background
on the environment in which students make the STEM track choice in China, discuss the data we
use, and lay out our empirical strategy. In Section 3 we present results. The final section
concludes.
2. Research Design
2.1 Background
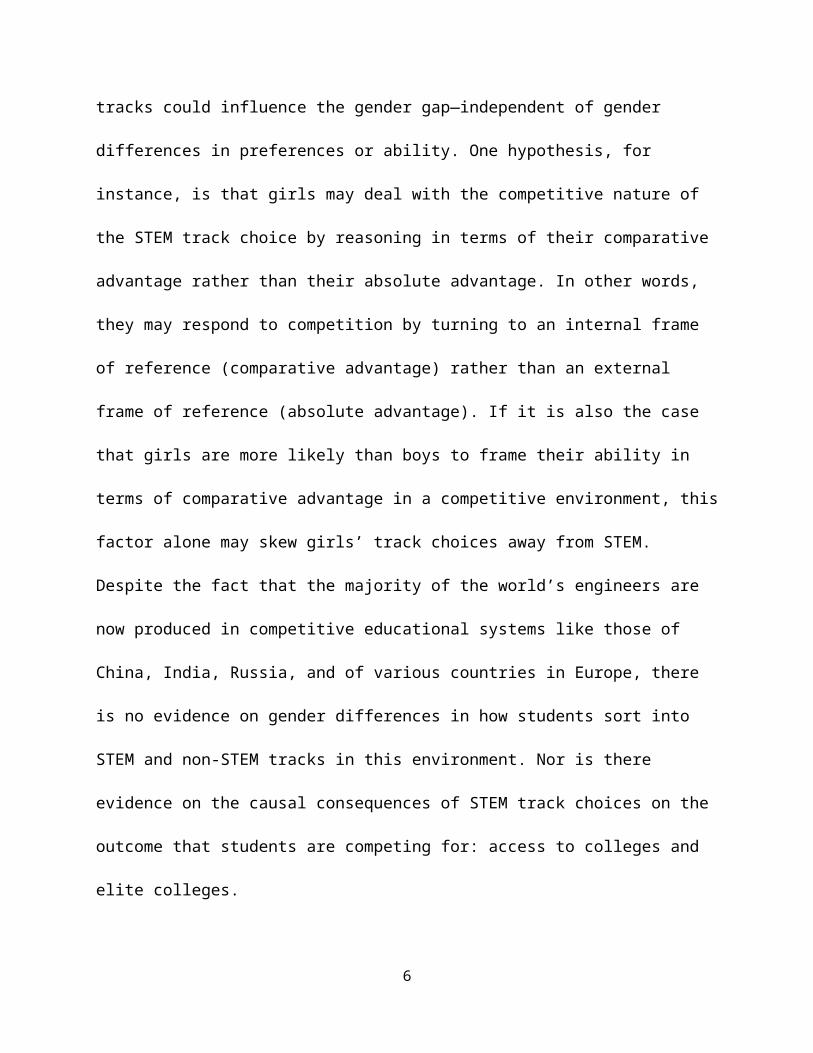
In this section we describe the key stages of the educational pathway (from the end of
junior high school to college) when STEM choices have to be made in China. As illustrated in
Figure 1 (Step “A”), junior high school graduates must first take a high school entrance exam
(HSEE). The HSEE is one of two high-stakes, standardized exams in China’s pre-tertiary
education system. The other one is the college entrance exam (CEE). If students score (rank)
high enough on the HSEE, they can gain admission to academic high school (which is essentially
mandatory to enter college).
Once students enter academic high school, they must choose whether to enter the STEM
track or the non-STEM track (Figure 1, Step “B”). The STEM track choice is made at the
beginning of the second year of academic high school. The track choice is competitive because
each track prepares students for either the (competitive) STEM or the (competitive) non-STEM
CEE. In facing this competitive track choice, students may or may not be aware of the fact that
the college admissions rate is generally higher for students in the STEM track as opposed to
students in the non-STEM track (Zhou, 2007).1 Regardless, since each track prepares students for
a content-specific (STEM or non-STEM) CEE, it is difficult for students to switch tracks after
they make their initial track choice.
5
Two years after students make their STEM track choice, they take the STEM or non-
STEM track CEE (Figure 1, Step “C”). The content of the STEM track CEE is heavily focused
on math and science subjects. It is composed of a high-level (of difficulty) math test, a high-level
science composite test, a low-level (of difficulty) Chinese test and an English test. The content of
the non-STEM track CEE, by contrast, is focused on humanities subjects. It is composed of a
high-level Chinese test, a high-level humanities composite test, a low-level math test and an
English test. Student rankings on either the STEM or non-STEM CEE determine whether they
can gain admission to a limited number of STEM or non-STEM spots in college and elite
colleges. A student who takes the non-STEM CEE cannot qualify for STEM spots in college and
elite colleges (and vice versa).
After students take the CEE and receive their scores, they can apply to colleges and
majors (Figure 1, Step “D”). If students apply within the STEM track, they must compete with
other STEM track students for the limited number of STEM spots per college. If students apply
within the non-STEM track, likewise, they must compete with other non-STEM track students
for the (also) limited number of non-STEM major spots per college. After each student submits
his or her college-major application choices, he or she is admitted by a complex admission
matching process into only one college and one major. Students typically cannot transfer
between colleges and majors after they enroll in college.
In summary, China’s education system forces students to make a highly competitive
STEM track choice years before students even enter college. The STEM track choice (at the start
of the second year of high school) determines whether students can eventually apply to STEM or
non-STEM majors at the time of college applications. Because each track is associated with its
own competitive CEE and college spots, the STEM track choice also has implications for access
6
to college and elite colleges. Finally, the STEM track choice is especially high-stakes because it
is difficult to reverse. Students cannot easily switch tracks after they make the STEM track
choice and they cannot transfer between colleges and majors after they enter college. 1
2.2 Data
In this paper we rely on two datasets collected from two provinces in Northwest China.
The first is a cross-sectional survey covering a representative sample of final-year (year 3 or
grade 12) academic high school students from 41 counties in Shaanxi province (these data are
hereafter called “the Shaanxi data”). The average GDP per capita of the 41 counties is $3,127,
somewhat less than the GDP per capita in Shaanxi as a whole ($4,284—NBS, 2011). The second
dataset is a panel of administrative data (provided by the Department of Education in Ningxia)
on all academic high school students who applied to college for the first time in 2010 in three of
the five prefectures of Ningxia province (hereafter called “the Ningxia data”). Longitudinal data
1 A few studies have explored the size and correlates of the gender gap in STEM majors in China. Among the most notable of these studies, Guo et al. (2010), and Wen (2005) use data from large samples of university students to show that female students are overrepresented in non-STEM majors (e.g., literature, law and economics) and underrepresented in STEM majors (e.g., engineering and science/technology). In identifying the gender gap in STEM majors, Guo et al. (2010) also show how part of the gender gap in STEM majors is attributable to rural-urban differences (with girls from rural areas being somewhat less likely to choose STEM majors). To the best of our knowledge, however, only one large-scale study from China has examined gender differences in STEM choices among high school students. Using data on over 10,000 senior-year high school students, Lu et al. (2009) examine the relationship between expected major choices and family background. They also examine the relationship between expected major choices and student perceptions. Lu et al. (2009) find that gender stereotypes, family income, and parent educational expectations are correlated with expected STEM versus non-STEM major choices. Lu et al. (2009) do not, however, directly test how such associations differ between male and female students. More specifically, while the authors do examine the association for subsamples of female and male students, they do not test for differences between subsamples of female and male students. Lu et al. (2009) also do not directly examine the determinants of the STEM track choice (the choice of whether to enter the STEM or non-STEM track during high school). As far as we know, no large-scale, quantitative study in China focuses on the way in which girls and boys frame their ability when making STEM track choices (or STEM choices in general). Furthermore, no study that we know of (in China or elsewhere) uses a plausible identification strategy to estimate the causal impacts of the STEM track choice on college and elite college access.
7
were only available from the capital city (one of the prefectures) and two other economically
less-developed prefectures in the province. The average GDP per capita in these three prefectures
is $3975 (in 2010), slightly lower than the average GDP in the province as a whole ($4310 in
2010—NBS, 2011). In 2010, Shaanxi and Ningxia were ranked 15 and 14 (out of 31 provinces)
in terms of GDP per capita (NBS, 2011).
The Shaanxi data were collected (by survey teams from the China Institute for
Educational Finance Research at Peking University) during the last week of April 2008. First, the
largest (and usually the only) academic high school in each of the 41 sample counties were
selected. Second, one class of STEM track students and one class of non-STEM track students
were randomly sampled from each high school.2 The 4,822 students in these classes then filled
out a survey covering their basic background characteristics (age, gender, rural or urban
residential status, total HSEE score and county) and the way in which they made their high
school choices.3 The survey response rate was above 98%.
The Shaanxi data contain significant information about the perceptions of girls and boys
as to why they chose the STEM or non-STEM track in high school. Most importantly, students
were asked to indicate whether certain factors influenced their choices. First, students were asked
whether their choice was influenced by any one of the following: (a) parents, (b) teachers, or (c)
friends. Second, students were asked whether they chose their track for economic reasons: (a)
whether they chose the track because of a higher likelihood of college admissions, or (b) whether
they chose the track because of higher (expected) wages in the labor market. Third, students
were asked whether they chose their track for non-monetary reasons: because the track was (a)
easier academically, or (b) more academically interesting. Fourth, students were asked whether
they chose their track because they thought they had a comparative advantage in their current
8
track, (meaning they thought that they had an academic advantage in the track they chose over
the other track).4 A limitation of the Shaanxi data is that questions on how students made their
track choice are retrospective – students in the third of high school (the final year) were asked to
recall how they made this choice at the start of their second year.
The Ningxia data tracks an entire cohort of students from the end of junior high school
(grade 9) to college. Specifically, the data contain information on 23,488 students who took the
HSEE (and entered academic high school) in 2007 and applied for colleges and majors in 2010.
The data include information on student background characteristics (age, gender, rural or urban
residential status, minority status, and county of residence), each student’s HSEE scores by
subject (math, science, Chinese language, politics, and English), and the college and major that
each student was admitted into (if they were admitted into a college and major).
The student population represented by the administrative data from Ningxia is similar to
the student population represented by the survey data from Shaanxi. The economic, social, and
educational context of the counties in Ningxia is similar to that of the counties in Shaanxi. The
proportion of girls and boys that chose the STEM track in high school is also similar across the
Shaanxi and Ningxia data (see subsection 3.1 below).
2.3 Statistical Models
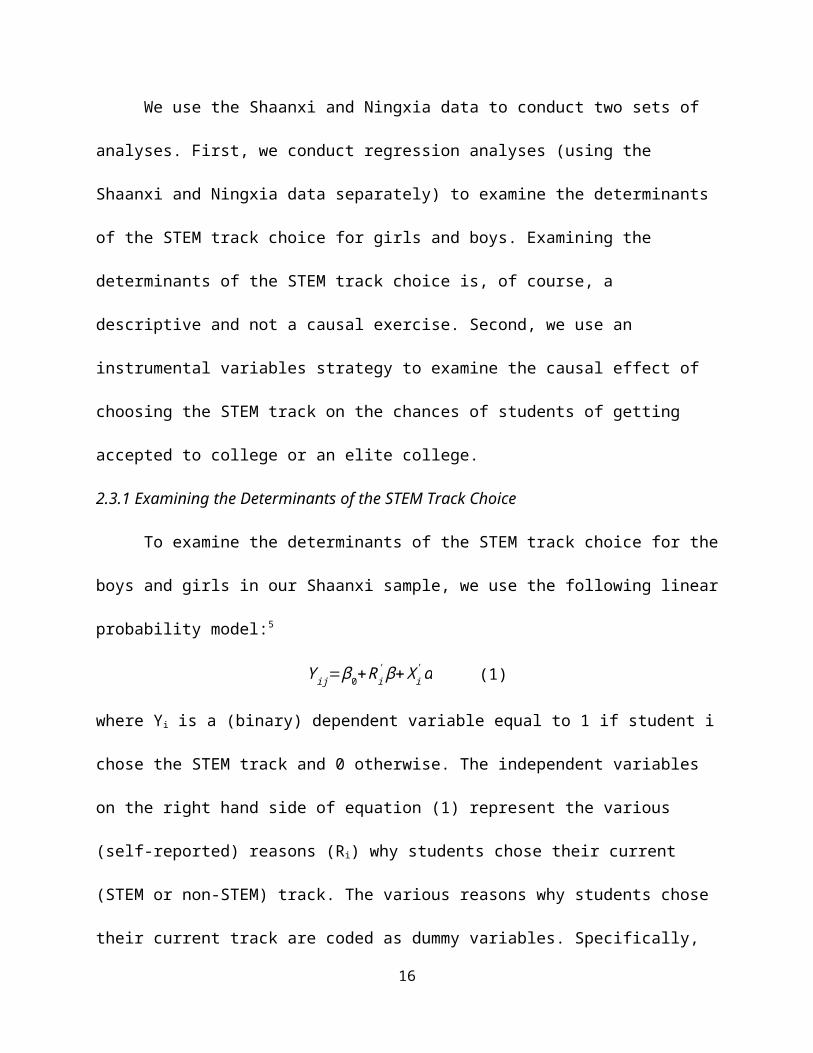
We use the Shaanxi and Ningxia data to conduct two sets of analyses. First, we conduct
regression analyses (using the Shaanxi and Ningxia data separately) to examine the determinants
of the STEM track choice for girls and boys. Examining the determinants of the STEM track
choice is, of course, a descriptive and not a causal exercise. Second, we use an instrumental
variables strategy to examine the causal effect of choosing the STEM track on the chances of
students of getting accepted to college or an elite college.
9
2.3.1 Examining the Determinants of the STEM Track Choice
To examine the determinants of the STEM track choice for the boys and girls in our
Shaanxi sample, we use the following linear probability model:5
Y ij=β0+Ri' β+ X i
' α (1)
where Yi is a (binary) dependent variable equal to 1 if student i chose the STEM track and 0
otherwise. The independent variables on the right hand side of equation (1) represent the various
(self-reported) reasons (Ri) why students chose their current (STEM or non-STEM) track. The
various reasons why students chose their current track are coded as dummy variables.
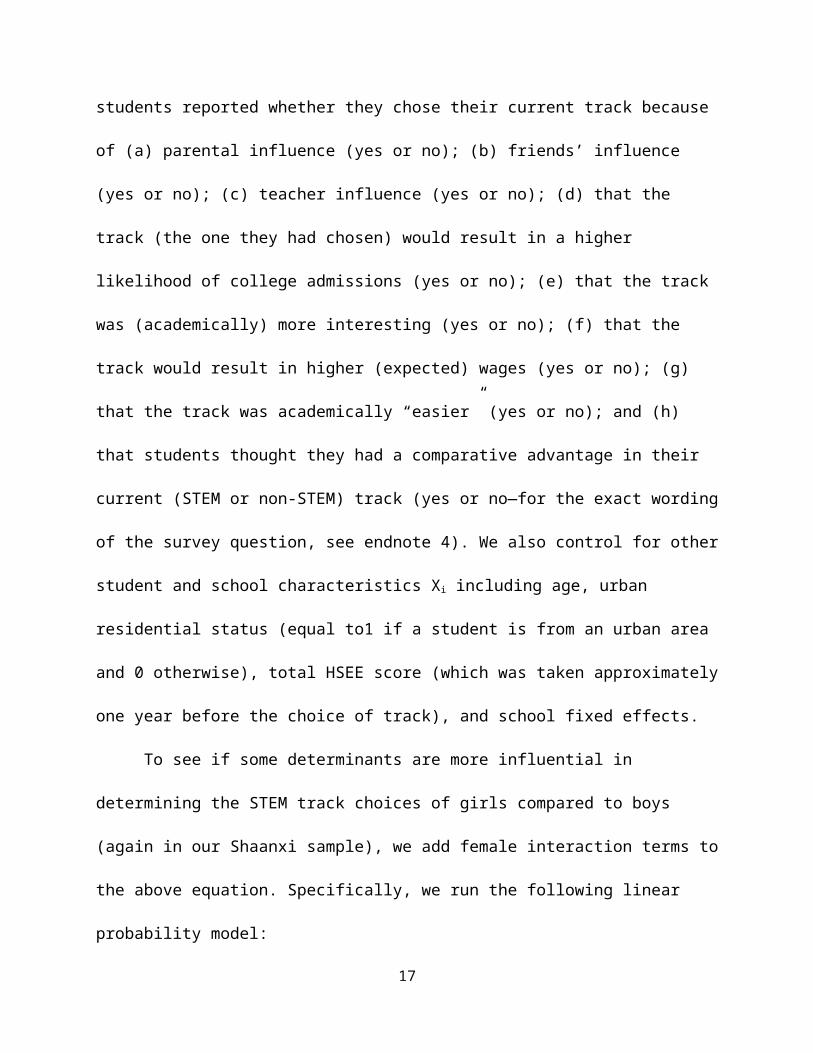
Specifically, students reported whether they chose their current track because of (a) parental
influence (yes or no); (b) friends’ influence (yes or no); (c) teacher influence (yes or no); (d) that
the track (the one they had chosen) would result in a higher likelihood of college admissions (yes
or no); (e) that the track was (academically) more interesting (yes or no); (f) that the track would
result in higher (expected) wages (yes or no); (g) that the track was academically “easier” (yes or
no); and (h) that students thought they had a comparative advantage in their current (STEM or
non-STEM) track (yes or no—for the exact wording of the survey question, see endnote 4). We
also control for other student and school characteristics Xi including age, urban residential status
(equal to1 if a student is from an urban area and 0 otherwise), total HSEE score (which was
taken approximately one year before the choice of track), and school fixed effects.
To see if some determinants are more influential in determining the STEM track choices
of girls compared to boys (again in our Shaanxi sample), we add female interaction terms to the
above equation. Specifically, we run the following linear probability model:
Y ij=β0+Ri' β+ female∗R i
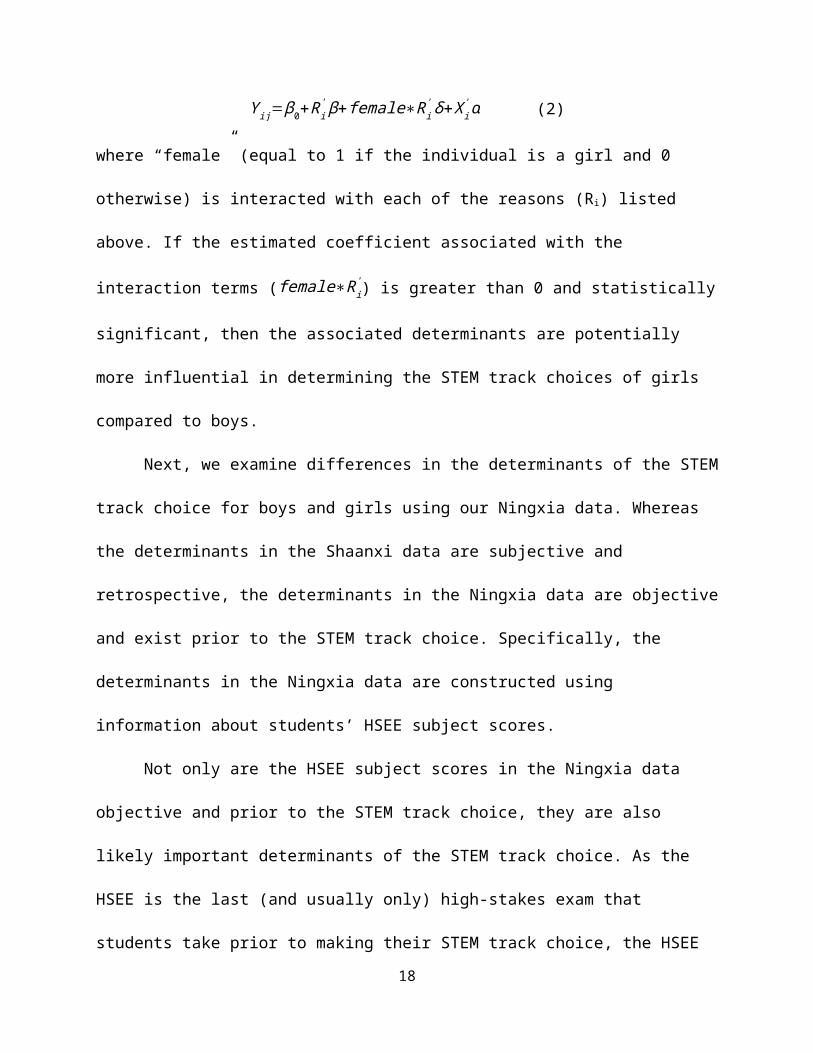
' δ +X i' α (2)
10
where “female” (equal to 1 if the individual is a girl and 0 otherwise) is interacted with each of
the reasons (Ri) listed above. If the estimated coefficient associated with the interaction terms (
female∗Ri') is greater than 0 and statistically significant, then the associated determinants are
potentially more influential in determining the STEM track choices of girls compared to boys.
Next, we examine differences in the determinants of the STEM track choice for boys and
girls using our Ningxia data. Whereas the determinants in the Shaanxi data are subjective and
retrospective, the determinants in the Ningxia data are objective and exist prior to the STEM
track choice. Specifically, the determinants in the Ningxia data are constructed using information
about students’ HSEE subject scores.
Not only are the HSEE subject scores in the Ningxia data objective and prior to the
STEM track choice, they are also likely important determinants of the STEM track choice. As
the HSEE is the last (and usually only) high-stakes exam that students take prior to making their
STEM track choice, the HSEE subject scores give students information about how well students
perform in STEM versus non-STEM subjects and how well they perform compared to other
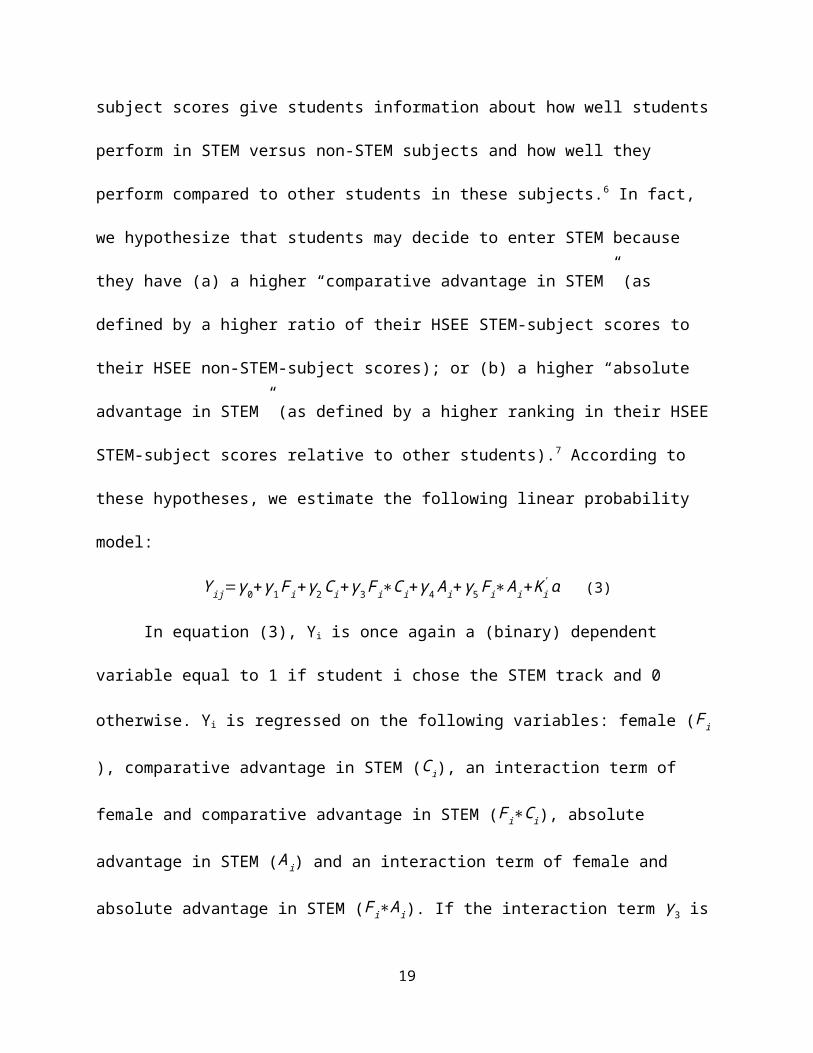
students in these subjects.6 In fact, we hypothesize that students may decide to enter STEM
because they have (a) a higher “comparative advantage in STEM” (as defined by a higher ratio
of their HSEE STEM-subject scores to their HSEE non-STEM-subject scores); or (b) a higher
“absolute advantage in STEM” (as defined by a higher ranking in their HSEE STEM-subject
scores relative to other students).7 According to these hypotheses, we estimate the following
linear probability model:
Y ij=γ0+γ1 F i+γ 2C i+γ 3 F i∗C i+γ 4 A i+γ 5 F i∗Ai+K i' α (3)
In equation (3), Yi is once again a (binary) dependent variable equal to 1 if student i
chose the STEM track and 0 otherwise. Yi is regressed on the following variables: female (F i),
11
comparative advantage in STEM (C i), an interaction term of female and comparative advantage
in STEM (F i∗C i), absolute advantage in STEM ( Ai) and an interaction term of female and
absolute advantage in STEM (F i∗Ai). If the interaction term γ3 is greater than one (in terms of
log odds) and statistically significant, this would suggest that girls are more likely to consider
comparative advantage in STEM in their STEM track choice. If the interaction term γ5 is greater
than one (in terms of log odds) and statistically significant, this would suggest that girls are more
likely to consider absolute advantage in STEM in their STEM track choice. Finally, equation 3
also controls for several background variables (K i') including age, urban residential status (equal
to1 if a student is from an urban area and 0 otherwise), minority status (equal to 1 if a student is a
minority and 0 otherwise), total HSEE score, and county (and alternatively school) fixed effects.
2.3.2 Estimating the Impact of the STEM Track Choice on College and Elite College Admissions
Because the STEM track choice is made within a competitive context, it may have
consequences for college and elite college admissions. Measuring the impact of the STEM track
choice on college and elite college admissions using standard regression analysis is difficult,
however, because there are likely many unobservable factors that are correlated both with the
STEM track choice and college admissions outcomes. Failing to account for these unobservable
factors in a standard regression analysis would give us biased estimates of the causal impact of
the STEM track choice on college and elite college admissions.
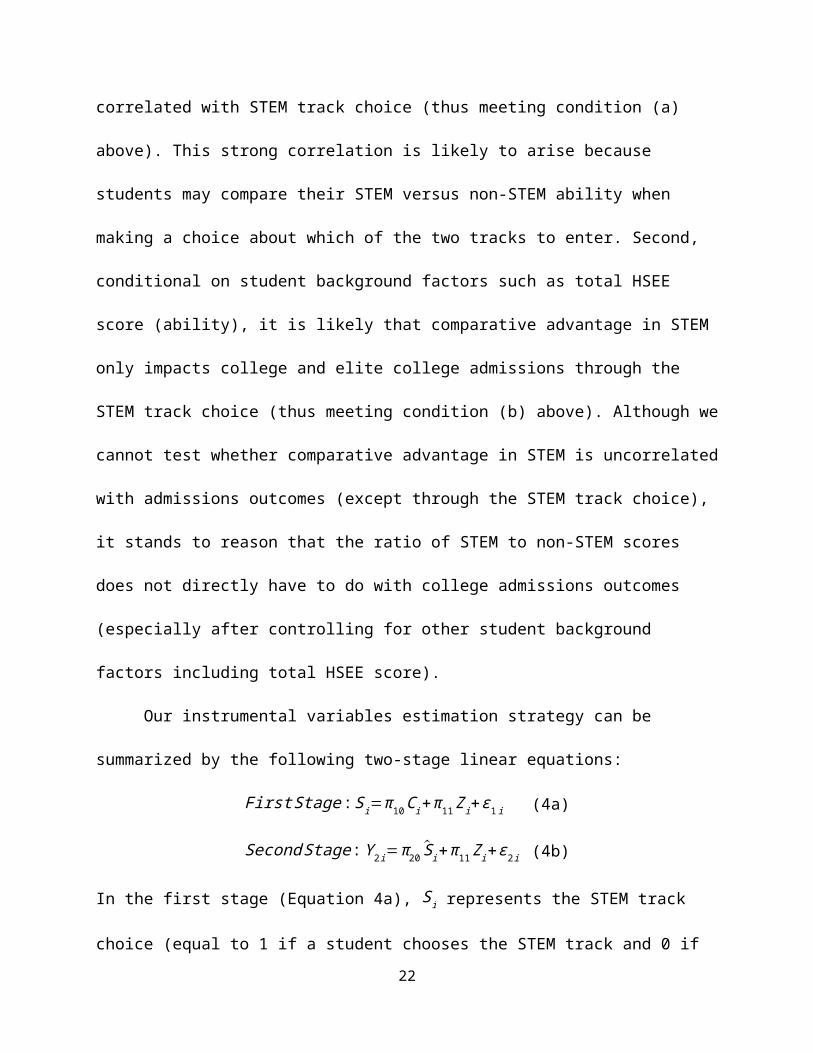
We instead use an instrumental variables (IV) strategy to estimate the causal effects of
choosing the STEM track on admissions to college and elite colleges. To obtain (asymptotically)
unbiased estimates, the IV strategy relies on finding an instrumental variable that is (a) strongly
correlated with the STEM track choice and that (b) affects admissions outcomes, but only
through the STEM track choice (Angrist, Imbens and Rubin, 1996). To be more precise,
12
condition (b) requires that the instrumental variable only affects admission outcomes through the
STEM track choice, conditional on other exogenous variables in the regression.
The instrumental variable that we use to find the impact of STEM track choice on college
and elite college admissions is our measure of comparative advantage in STEM. Comparative
advantage in STEM plausibly fulfills the two essential conditions for the IV analysis. First,
comparative advantage in STEM is strongly correlated with STEM track choice (thus meeting
condition (a) above). This strong correlation is likely to arise because students may compare
their STEM versus non-STEM ability when making a choice about which of the two tracks to
enter. Second, conditional on student background factors such as total HSEE score (ability), it is
likely that comparative advantage in STEM only impacts college and elite college admissions
through the STEM track choice (thus meeting condition (b) above). Although we cannot test
whether comparative advantage in STEM is uncorrelated with admissions outcomes (except
through the STEM track choice), it stands to reason that the ratio of STEM to non-STEM scores
does not directly have to do with college admissions outcomes (especially after controlling for
other student background factors including total HSEE score).
Our instrumental variables estimation strategy can be summarized by the following two-
stage linear equations:
First Stage :S i=π10C i+π 11 Z i+ε1 i (4a)
Second Stage :Y 2 i=π20 S i+π 11 Z i+ε2 i (4b)
In the first stage (Equation 4a), Si represents the STEM track choice (equal to 1 if a student
chooses the STEM track and 0 if the student chooses the non-STEM track). The STEM track
choice (Si) is regressed on the instrumental variable (comparative advantage in STEM, C i), as
well as other background covariates ¿) including total HSEE score, age, gender, minority,
13
residential status (urban or rural) and school fixed effects.8 In the second stage (Equation 4b), the
outcome variable (admission to college or alternatively admission to an elite college) is regressed
on the predicted value of the STEM track choice from stage 1 (Si) and the other background
covariates included in stage 1 (Zi). If the two major conditions of the IV estimation strategy hold,
then the estimate of π20 is an (asymptotically) unbiased local average treatment effect (LATE)
estimator of the impact of the STEM track on admissions to college (and alternatively elite
college). More specifically, π20 (the LATE estimator) will reflect the average impact of choosing
the STEM track on admissions to college among “compliers” (individuals who are induced to
take a treatment by assignment to the treatment, see Angrist, Imbens and Rubin, 1996). In other
words, the LATE estimator will reflect the average impact of choosing the STEM track among
those students who base their STEM track choice on their comparative advantage.9
We evaluate the robustness of our IV estimates for the effect of track choice on college
admissions using the plausibly exogenous approach of Conley et al. (2012). This allows us to
evaluate the sensitivity of IV estimates to small departures from an assumption of strict
exogeneity. Specifically, we use the “union of confidence intervals” method in Conley et al.
(2012) to derive 95% confidence intervals for a specified range of possible values for the direct
effect of the ratio of STEM to non-STEM scores on college admissions (That is, the range of
possible values for an endogenous effect of this ratio on college admissions not operating
through track choice, conditional on controlled covariates). We estimate bounds assuming that
the direct effect of the ratios of STEM to non-STEM HSEE scores ranges from [0,k] for values
of k ranging from 0 to 0.2.
14
3. Results
3.1 Gender Differences in the STEM Track Choice
At the start of the second year of academic high school in China, girls choose the STEM
track much less than the non-STEM track (and much less than boys). In the Ningxia sample, the
STEM track is composed mostly of boys (59%) compared to girls (41%). In contrast, the non-
STEM track is composed mostly of girls (71%) compared to boys (29%). In the Shaanxi data, the
results are strikingly similar. The STEM track is composed mostly of boys (62%) compared to
girls (38%). The Shaanxi results are exactly identical to those for Ningxia in the choice of non-
STEM track: the non-STEM track consists mostly of girls (71%) compared to boys (29%). The
gender gap remains even after adjusting for a number of important background factors (see
Appendix Table A.1).
Table 1 summarizes students’ self-reported reasons for why they made their STEM track
choice. For non-STEM students of both genders (first two columns) we see that the main
reported influences are a) comparative advantage (66.7%, Row 8); b) interest in subject (62.9%,
Row 5); and c) academic ease (34.9%, Row 7). For STEM students, however, the percent of
students choosing academic ease and comparative advantage are significantly less. Instead, these
students more often cite higher (expected) wages as a major factor of their decision (56% STEM
vs. 6% non-STEM, Row 6). Although many students also report other factors such as parent,
teacher, and friend influence as factors in their decision, the influence of these factors appears to
be relatively minor.
We also find differences in how girls and boys report making their STEM versus non-
STEM track choice (Columns 3-7). Boys are much more likely than girls to make their STEM
track choice based on higher (expected) wages (Row 6). Girls, on the other hand, are more likely
15
to make their STEM track choice based on comparative advantage in their current track as well
as the perceived academic ease of the track (Rows 7, 8). Although other reasons (parent
influence, teacher influence, and interest in subject matter) differ slightly between girls and boys,
the magnitude of the differences are small.10
Although the above results highlight some of the most common reasons underlying the
STEM track choice, the reasons are possibly confounded with each other and with other
background factors. To examine which reasons may be more influential at the margin (after
conditioning for other reasons and factors), we regress whether students chose the STEM track
choice on their self-reported reasons and background variables (see equation 1).
For the combined sample of girls and boys (Table 2, Column 1), parental influence and
wage returns are positively associated with students choosing the STEM track. Specifically, the
estimated coefficients for parental influence and wage returns are all positive and statistically
significant at the 1% level. By contrast, comparative advantage in their current (STEM or non-
STEM) track, teacher influence, and academic ease are associated with students choosing the
non-STEM track (Table 2, Column 1). The estimated coefficients associated with these three
variables are negative and statistically significant at (at least) the 5% level. These results hold for
both girls and boys.
Although there are several reasons underlying how all students make the STEM track
choice on average, only one factor explains the gender difference in the STEM track choice:
comparative advantage in their current (STEM or non-STEM) track. By regressing whether
students chose the STEM track on the self-reported reasons of students for having chosen a given
track and the interaction terms of female and self-reported reasons (equation 2), we find that only
the estimated coefficients for the “female-comparative advantage in their current track”
16
interaction term is statistically significant (Table 2, column 2). The coefficient on the “female-
comparative advantage in their current track” interaction term is negative. This implies that girls
who report making their decision based on comparative advantage in their current track are less
likely than boys to choose the STEM track. That is, girls are less likely to choose the STEM
track because they believe they have a comparative advantage in non-STEM versus STEM
subjects.
The finding that girls consider their comparative advantage more than boys is supported
by our analyses of the Ningxia data. According to Figure 2, girls and boys with higher
comparative advantage ratios in STEM versus non-STEM subjects (as measured by the ratio of
HSEE STEM subject scores to HSEE non-STEM subject scores) are more likely to choose the
STEM track.11 The estimated coefficient describing the relationship between the likelihood of
choosing the STEM track and comparative advantage (represented by the dashed line for boys
and the solid line for girls) is positive and moderately large in magnitude for both girls and boys.
Among girls and boys with the same comparative advantage, boys are also much more likely to
choose the STEM track than girls. Furthermore, the estimated coefficient is even larger for girls.
This means that while both girls and boys with a higher comparative advantage in STEM are
more likely to choose the STEM track, the comparative advantage of girls is likely to be an even
bigger factor in determining their STEM track choice than it is for boys.
Testing this more formally in Table 3, we find that not only are girls more likely than
boys to base their STEM track choice on comparative advantage in STEM, but boys are also
more likely than girls to base their STEM track choice on their absolute advantage (or ranking)
in STEM. This can be seen in two ways. First, even after controlling for a number of possible
confounding factors (by including control variables in the regression analysis), girls are more
17
likely than boys to base their STEM track choice on comparative advantage in STEM, (Table 3,
Column 2). The estimated coefficient for the female-comparative advantage (in STEM)
interaction term is positive, large and significant at the 1% level. Second, girls and boys both
appear to consider their absolute advantage in STEM when making the STEM track choice
(Table 3, Column 2) – the estimated coefficient for the absolute advantage variable is also
positive and significant at the 1% level. However, the estimated coefficient for the female-
absolute advantage (in STEM) interaction term is negative and significant at the 1% level. This
implies that girls consider their absolute advantage in STEM less when making their STEM track
choice. Taken together, the findings imply that girls are more likely to consider their comparative
advantage in STEM but are less likely than boys to consider their absolute advantage in STEM
when making the STEM track choice.
3.2 The Impact of Choosing the STEM Track on College and Elite College Attendance
What are the consequences of making the STEM track choice based on comparative
advantage in STEM? The results of the IV analysis (using equations 4a and 4b) are presented in
Table 4 (the results of the first-stage regressions are furthermore presented in Table A.2 in the
Appendix).12 We find that, among students who base their STEM track choice on comparative
advantage in STEM (as measured by the ratio of HSEE STEM-subject scores to HSEE non-
STEM-subject scores), choosing the STEM track substantially increases their chances of going
to college and elite colleges (Table 4, Columns 1 and 2).13 The results indicate that choosing the
STEM track increases the probability that these students can attend college by approximately 19
percentage points (significant at 1%; Table 4, Column 1), holding HSEE scores constant. That is,
among students who base their track choice on comparative advantage, choosing the STEM track
increases the probability a student will attend college by 19 percentage points compared to a
18
student with similar HSEE scores. The results also show that choosing the STEM track increases
the probability that students can attend elite colleges by 17 percentage points (statistically
significant at the 1% level—Table 4, Column 2).
Columns 3 through 6 of Table 4 present results separately for girls and boys. Choosing
the STEM track increases the probability that girls can attend college by approximately 17
percentage points (Table 4, Column 3). The point estimate for boys is similar at 21 percentage
points. Both estimates are statistically significant at the 1% level. The effect of choosing the
STEM track on attending an elite college is also similar for both girls (18 percentage points –
Table 4, Column 4) and boys (16 percentage points – Table 4 Column 5).
Our sensitivity analysis following Conley et al. (2012) suggests that these results are
robust to reasonable relaxations of the exclusion restriction. For all students (boys and girls
combined), we estimate that the direct effect of the ratios of scores on college attendance would
need to be greater than 5 percentage points for the 90% confidence interval of the effect of track
choice to span zero. For the effect of track choice on college attendance for girls, the direct effect
of the ratio would need to be 13 percentage points for the track choice confidence interval to
span zero. In other words, moving from a ratio of 1 (equal STEM and non-STEM scores) to 1.25
would need to directly increase the probability of college attendance for girls by around 3.25
percentage points independent of track choice, total HSEE scores and other controls.
From another angle, we see that the way girls make their track choice has implications
not only for the number of girls entering STEM, but also for the number of girls attending
college. Although estimates suggest that the negative effect on college attendance of choosing
the non-STEM track is similar for girls and boys, many more girls are affected because girls are
19
both more likely than boys to base their track decision on comparative advantage and to choose
the non-STEM track.
4. Discussion and Conclusion
The substantial gender imbalance in STEM majors worldwide may be due in part to
institutional rules established by national education systems. In this study, our objective was to
examine the impact of an important institutional rule in a number of countries—the STEM track
choice on the gender gap in STEM majors and college access. We examined the consequences of
the STEM track choice in China, a country with a highly competitive educational system and
which produces more scientists and engineers than any other country. Specifically, our goals
were to a) better understand how girls and boys make the competitive STEM track choice and b)
examine the consequences of the competitive STEM track choice for gender inequality in access
to colleges and elite colleges.
Our first set of findings is based on two qualitatively different datasets: one in which
students report their perceptions about why they choose a given track and one that allows us to
relate prior, objective (STEM and non-STEM) test score measures to the STEM track choice.
When examining students’ self-reported perceptions about why they chose their current track, we
find that girls are more likely than boys to weigh their comparative advantage in that (current)
track. This is confirmed using prior test score measures: we find that girls’ choices are much
more sensitive to their “comparative advantage in STEM” while boys tend to be more sensitive
to their “absolute advantage in STEM”.
The first set of findings is consistent with and extends previous theories about how girls
and boys are thought to make STEM choices. As in the psychology literature, we find that both
20
absolute and comparative advantages are important determinants of academic choices (Parker et
al., 2012; Nagy, Trautwein, Baumert, Köller and Garrett, 2006; Marsh, 1990). Our findings are
also consistent with theories from psychology implying that girls are more likely to think about
comparative advantage and boys are more likely to think about absolute advantage when making
educational choices (Eccles, 1994). We posit that our empirical finding—that girls and boys have
different sensitivities to comparative advantage and absolute advantage—may be particularly
stark because of the competitive nature of the STEM track choice in China. In other words, girls
may be even more likely than boys to use their comparative advantage in STEM (an internal
frame of reference) rather than their absolute advantage in STEM (an external frame of reference
—a comparison with their peers) in a competitive environment, since they tend to shy away from
competition more than boys (see Croson and Gneezy, 2009).
Our second finding is that choosing the STEM track significantly increases the chance
that students will attend college. Accounting for confounding factors, we estimate that choosing
the STEM track increases the probability that students attend college by approximately 19
percentage points and elite colleges by 17 percentage points on average among students who
base their choice on comparative advantage. Because girls are more likely to base this decision
on comparative advantage, this implies that there are many girls who would have gone to college
had they chosen the STEM track instead of the non-STEM track. This is not to say that choosing
STEM would increase every girl’s chance of attending college; just that there are a significant
number that would have been more likely to attend college had they done so. These girls lose out
on significantly higher wages: not only do they miss out on higher STEM wages, but also on the
returns to college and elite colleges. This may have significant implications for overall gender
21

inequality in countries like China where returns to higher education are high and rising over time
(Carnoy et al., 2013).
Whereas the findings of this paper are most applicable to national education systems
where students have to make a STEM-related track or major choice in high school (such as
China, India, and Russia, for example), they may also provide insights for more developed
countries. In particular, there are a number of developed countries (such as Norway, England,
and the Netherlands—see Borgen, 2014, Buser et al., 2014, and Malamud, 2010) where students
must choose a major (and hence whether they wish to go into STEM versus non-STEM majors)
before they enter college. Similar to the situation in China, students from these countries must
make these choices in the absence of complete information (Hoxby and Avery, 2013; Dinkelman
and Martínez, 2012). In the absence of complete information, students may be prone to relying
on frames of reference (for example, comparative versus absolute advantage in academic ability)
when choosing majors. Even in the United States, students may make major choices without
complete information (e.g., Wiswall and Zafar, 2011) and therefore rely on frames of reference
to make their choices. As shown in our paper, using different frames of reference in making
STEM choices can further have other consequences for the educational outcomes of students
(consequences outside of choosing STEM majors—such as failing to access college and elite
colleges).
The findings of our study (on early STEM tracking) also may have parallels with the
literature on early ability tracking. The literature has discussed how early ability tracking (where
students, based on their ability, are tracked early or late into different courses, classes or schools)
can lead to inequality in educational outcomes such as college access (e.g. Malamud and Pop-
Eleches, 2011; van Elk, 2011; Bauer and Riphahn, 2006; Hanushek and Wößmann, 2006; Rees
22
et al., 1996). If the results of our study on early STEM tracking are relevant for early ability
tracking, then our study suggests that the repercussions of such early ability tracking may be
moderated by the different ways that decision-makers (students or their teachers, for example)
frame ability when making tracking decisions. In our case, we show that if girls (or their parents
and/or teachers) are more conscious of the consequences of framing ability (in terms of absolute
versus comparative advantage) when making decisions early in the STEM pipeline, this may
reduce the impact of early STEM tracking on gender inequalities in educational outcomes (such
as college access). If there are parallels between our paper’s results on STEM tracking and the
early ability tracking literature, it may be that equipping decision makers with a greater
awareness of different ways of framing ability may reduce the negative consequences of early
ability tracking on inequality in educational outcomes in general.
Although our results highlight the potential role of comparative advantage and absolute
advantage in determining STEM track choices, we realize that more work in this area is needed.
Future studies would benefit from collecting detailed, longitudinal data (before and after students
make their STEM track choices) on both (a) the subjective beliefs of girls and boys; as well as
(b) achievement scores (in STEM and non-STEM subjects). Such information would help us
better understand how girls and boys use objective information on their comparative and
absolute advantage to update their STEM-related beliefs and subsequently their STEM choices
(e.g. see Zafar, 2009).
Our results also suggest alternative routes through which policymakers may wish to help
girls better understand how to make STEM choices. In China, for example, policymakers might
wish to do more to help girls understand the competitive nature of the STEM track choice and its
repercussions for college access. Future studies, for example, could randomly select and train a
23
subset of students about the costs and benefits associated with STEM track choices and the
different possible ways of assessing one’s ability when making those choices (e.g. using absolute
advantage versus comparative advantage). We plan to pursue these lines of inquiry in future
work.
24
References
Angrist J., Imbens G., Rubin D. (1996). Identification of causal effects using instrumental variables. Journal of the American Statistical Association 91(434): 444-455.
Barone, C. (2011). Some things never change gender segregation in higher education across eight nations and three decades. Sociology of Education 84(2): 157-176.
Barres, B. (2006). Does gender matter? Nature 442(7099): 133-136.
Borgen, N.T. (2014). College quality and hourly wages: Evidence from the self-revelation model, sibling models and instrumental variables. Social Science Research, in publication.
Borjas G. (2009). Immigration in high-skill labor markets: The impact of foreign students on the earning of doctorates, in Freeman, R.B. & Goroff D.L. (eds.) Science and Engineering Careers in the United States: An Analysis of Markets and Employment, (University of Chicago Press: Chicago), pp 131.
Bound, J., Turner, S., & Walsh P. (2009). Internationalization of U.S. doctorate education, in Freeman, R.B., Goroff D.L. (eds.) Science and Engineering Careers in the United States: An Analysis of Markets and Employment, (University of Chicago Press: Chicago), pp 59-97.
Buser, T., Niederle, M., & Oosterbeek, H. (2014). Gender, competitiveness and career choices. The Quarterly Journal of Economics, 129(3), 1409-1447.
Carnoy, M., Loyalka, P., Dobryakova, M., Dossani, R., Froumin, I., Kuhns, K. & Wang, R. (2013). University Expansion in a Changing Global Economy: Triumph of the BRICs? (Stanford University Press, Palo Alto, CA).
Ceci, S.J. & Williams, W.M. (2011). Understanding current causes of women's underrepresentation in science. Proceedings of the National Academy of Sciences USA 108(8): 3157-3162.
Conley, T.G., Hansen, C. and Rossi, P.E., (2012). Plausibly exogenous. Review of Economics and Statistics, 94(1), pp. 260-72.
Croson, R. & Gneezy, U. (2009). Gender differences in preferences. Journal of Economic Literature 47(2): 448-474.
Eccles, J.S. (1994). Understanding women's educational and occupational choices. Psychology of Women Quarterly 18(4): 585-609.
Eurostat. (2012). Statistics on tertiary students (ISCED 5A) by field of education and sex. Available at http://appsso.eurostat.ec.europa.eu/nui/.
25
Gerber, T.P. & Schaefer, D.R. (2004). Horizontal stratification of higher education in Russia: trends, gender differences, and labor market outcomes. Sociology of Education 77(1): 32-59.
Gereffi, G., Wadhwa, V., Rissing, B. & Ong, R. (2008). Getting the numbers right: international engineering education in the United States, China, and India. Journal of Engineering Education 97(1): 13-25.
Gneezy U. & Rustichini A. (2004). Gender and competition at a young age. The American Economic Review 94(2): 377-381.
Günther, C., Ekinci, N.A., Schwieren, C. & Strobel, M. (2010). Women can’t jump?—An experiment on competitive attitudes and stereotype threat. Journal of Economic Behavior & Organization 75(3): 395-401.
Guo, C.B., Tsang, M.C., & Ding, X.H. (2010). Gender disparities in science and engineering in Chinese universities. Economics of Education Review 29(2): 225-235.
Hanushek, E., Wößmann, L., 2006. Does educational tracking affect performance and inequality? Differences-in-differences evidence across countries. Economic Journal 116, 63-76.
Instituto Nacional de Estudos e Pesquisas (INEP). (2013). Sinopse estadistico da educacão superior. Brasilia: INEP.
Kingdon, G.G. (2002). The gender gap in educational attainment in India: how much can be explained? Journal of Development Studies 39(2), 25-53. Lu, G.S., Liu, S., & Chung, Y.P. (2009). An analysis of gender disparity in the demand for higher education and choice of study subject. Journal of Higher Education 30(10): 14-29.
Malamud, O. (2010). Breadth versus depth: The timing of specialization in Higher Education. Labour, 24(4), 359-390.
Malamud, O. Pop-Eleches, C. (2011). School tracking and access to higher education among disadvantaged groups. Journal of Public Economics 95, 1538-1549.
Marsh, H.W. (1986). Verbal and math self-concepts: an internal/external frame of reference model. American Educational Research Journal 23: 129–149.
Marsh, H.W. (1990). Influences of internal and external frames of reference on the formation of math and English self-concepts. Journal of Educational Psychology 82: 107–116.
Ministry of Education, Science, Cultural, and Technology, Japan (MEXT). (2009). White paper on gender equality 2009. Available at http://www.gender.go.jp/english_contents/about_danjo/whitepaper/index.html.
26
Möller, J. & Köller, O. (2001). Frame of reference effects following the announcement of exam results. Contemporary Educational Psychology 26(2): 277-287.
Möller, J., Retelsdorf, J., Köller, O., & Marsh, H. W. (2011). The reciprocal internal/external frame of reference model an integration of models of relations between academic achievement and self-concept. American Educational Research Journal, 48(6), 1315-1346.
Murnane, R.J. & Willett, J.B. (2010). Methods Matter: Improving Causal Inference in Educational and Social Science Research. Oxford University Press, USA.
Nagy, G., Trautwein, U., Baumert, J., Köller, O. & Garrett, J. (2006). Gender and course selection in upper secondary education: effects of academic self-concept and intrinsic value Educational Research and Evaluation 12: 323–345.
National Bureau of Statistics (NBS). (2011). China Statistical Yearbook 2010. (China Statistics Press: Beijing).
National Science Board. (2012). Science and engineering indicators. Washington DC: National Science Foundation (NSF). Available at http://www.nsf.gov/statistics/seind10/.
Niederle, M. & Vesterlund, L. (2010). Explaining the gender gap in math test scores: the role of competition. Journal of Economic Perspectives 24(2): 129–144.
Niederle, M. & Vesterlund, L. (2007). Do women shy away from competition? Do men compete too much? Quarterly Journal of Economics 122(3): 1067–1101.
Parker, P.D., Schoon, I., Tsai, Y., Nagy, G., Trautwein, U., & Eccles, J.S. (2012). Achievement, agency, gender, and socioeconomic background as predictors of postschool choices: a multicontext study. Developmental Psychology 48(6): 1629-1642.
Plucker, J. A., & Stocking, V. B. (2001). Looking outside and inside: Self-concept development of gifted adolescents. Exceptional children, 67(4), 535-548.
Rees, D.I., Argys, L.M., Brewer, D.J., 1996. Tracking in the United States: descriptive statistics fromNELS. Economics of Education Review 15 (1), 83–89.
Sana, M. (2010). Immigrants and natives in U.S. science and engineering occupations, 1994-2006. Demography 47(3): 801-20.
Skaalvik, E. M., & Rankin, R. J. (1990). Math, verbal, and general academic self-concept: The internal/external frame of reference model and gender differences in self-concept structure. Journal of Educational Psychology 82: 546-554.
27
Skaalvik, E. M., & Rankin, R. J. (1995). A test of the internal/external frame of reference model at different levels of math and verbal self-perception. American Educational Research Journal, 32: 161-184.
Turner, S. & Bowen, W. (1999). Choice of major: the changing (unchanging) gender gap. Industrial and Labor Relations Review 48(3): 289-313.
Valian, V. (1999). Why so Slow? The Advancement of Women. The MIT Press.
Wang, X. (1999). Female’s opportunities in higher education: Issues, causes and solutions. Jimei University Journal, Philosophy and Social Science Section, 3 (in Chinese).
Wen, D. (2005). Gender comparison in China’s higher education opportunity, process, and employment. Qinghua Higher Education Research, 5 (in Chinese).
Wiswall, M., & Zafar, B. (2011). Determinants of college major choice: Identification using an information experiment. Staff Report #500, Federal Reserve Bank of New York.
Xie, Y. & Shauman, K. (2003). Women in science: career processes and outcomes (Harvard University Press, Cambridge, MA).
Zafar, B. (2009). College major choice and the gender gap. No. 364 Staff Report, Federal Reserve Bank of New York.
Zhou, X. (2007). A historical review and reflection on China’s gender disparity issue in education. Shanghai Education Research, 3 (in Chinese).
28
Figure 1: The Education Pathway in China: from the End of Junior High School to College
College Entrance Exam (CEE) – STEP C
College and Elite College Admissions
College and Major Application Choices – STEP D
Humanities ExamScience Exam
Humanities trackScience track
Grade 2 Track Choice – STEP B
Academic High School (Grades 1-3)
High School Entrance Exam(HSEE) – STEP A
29
Figure 2: The Relationship between the Likelihood of Choosing the STEM Track and Comparative Advantage in STEM (HSEE STEM scores divided by HSEE non-STEM scores)
.2.4
.6.8
1Li
kelih
ood
of C
hoos
ing
the
STE
M T
rack
.5 1 1.5 2Ratio of HSEE STEM to HSEE non-STEM scores
female male
Source: Ningxia data
30
Table 1: Percentage of students that choose track based on a specific reason(Final year high school students in Shaanxi Province in 2008)
All Boys Girls Difference (boys - girls)
Non-STEM STEM Non-STEM STEM Non-STEM STEM Both tracks(1) Parent Influence 6.56 15.09 6.03 14.94 6.82 15.75 .018**(2) Friend Influence 10.87 13.05 11.64 12.98 10.61 13.18 .010(3) Teacher Influence 6.40 6.14 6.73 5.26 6.25 7.69 -.012*(4) Increases Likelihood of College Admit 7.37 10.00 7.99 8.89 7.11 12.11 -0.003(5) Interest in Subject Matter 62.99 62.85 66.2 63.87 61.47 61.52 .030**(6) Higher (Expected) Wages 6.00 56.96 6.03 55.83 6.02 58.95 .157***(7) Academically Easier 34.88 10.83 30.29 10.93 36.87 10.60 -.107***(8) Comparative Advantage in Current Track 66.69 44.72 56.24 44.77 70.99 44.19 -.130***N 4,822 4,822 4,822 4,822 4,822 4,822 4,822
Notes: 1) The statistical significance of the difference between boys and girls was tested using a test of proportions. 2) *** p<0.01, ** p<0.05, * p<0.1
31
Table 2: How the Determinants of the STEM Track Choice Differ for Female and Male Students (OLS Regressions using the 2008 Shaanxi Data)
(1)STEM track (y/n)
(2)STEM track (y/n)
Female -0.203*** -0.224***(0.013) (0.034)
Parent Influence 0.052*** 0.049***(0.012) (0.017)
Friend Influence -0.018 -0.010(0.018) (0.021)
Teacher Influence -0.073** -0.087**(0.030) (0.033)
Comparative Advantage in Current Track -0.121*** -0.053***(0.014) (0.016)
Interest in Subject Matter -0.002 -0.008(0.014) (0.016)
Academically Easier -0.193*** -0.170***(0.016) (0.022)
Increases Likelihood of College 0.023 -0.005(0.018) (0.027)
Higher (Expected) Wages 0.384*** 0.284***(0.021) (0.021)
Female X Parent Influence 0.004(0.027)
Female X Friend Influence -0.010(0.028)
Female X Teacher Influence 0.015(0.039)
Female X Comparative Advantage in Current Track -0.131***(0.021)
Female X Interest in Subject Matter 0.010(0.022)
Female X Academically Easier -0.025(0.031)
Female X Increases Likelihood of College 0.040(0.036)
Female X Higher (Expected) Wages 0.216***(0.025)
Controls Yes YesObservations 4,822 4,822Cluster robust standard errors in parentheses*** p<0.01, ** p<0.05, * p<0.1
Notes: Controls include Age, Rural (versus Urban) residence, total HSEE score, and county fixed effects
32
Table 3: Gender Differences in the Role of Comparative and Absolute Advantage in the STEM Track Choice (OLS Regressions using the 2007-2010 Ningxia Data)
(1) (2) (3)STEM track
(y/n)STEM track
(y/n)STEM track
(y/n)
Comparative advantage (ratio of HSEE STEM to non-STEM scores) 0.685*** 0.329*** 0.330***(0.056) (0.044) (0.043)
Female -0.763*** -0.743***(0.078) (0.082)
Female*Comparative Advantage 0.475*** 0.445***(0.060) (0.064)
Absolute Advantage (HSEE STEM z-score) 0.068*** 0.102*** 0.103***(0.019) (0.016) (0.015)
Female*Absolute Advantage -0.058*** -0.046***(0.014) (0.015)
Rural 0.084***(0.018)
Female*Rural 0.036**(0.015)
Minority 0.021*(0.011)
Age 0.018(0.050)
Age squared -0.001(0.001)
Constant -0.214*** 0.329*** 0.135(0.073) (0.057) (0.461)
Observations 23,477 23,477 23,477R-squared 0.202 0.236 0.248
Cluster-robust standard errors in parentheses*** p<0.01, ** p<0.05, * p<0.1
Notes: Regressions also include county fixed effects
33
Table 4: The Effect of Choosing the STEM Track on College and Elite College Admissions (Instrumental Variable Regression with School Fixed Effects, IV = ratio of STEM HSEE scores to non-STEM HSEE scores)
All Students Girls Boys(1) (2) (3) (4) (5) (6)
college (y/n) elite college (y/n) college (y/n) elite college (y/n) college (y/n) elite college (y/n)STEM (y/n) 0.187*** 0.168*** 0.174*** 0.177*** 0.212*** 0.164***
(0.033) (0.041) (0.033) (0.039) (0.047) (0.051)Total HSEE score 0.36*** 0.056*** 0.026*** 0.048*** 0.044*** 0.063***
(0.008) (0.014) (0.009) (0.015) (0.010) (0.015)Age -0.50 -0.165*** -0.063 -0.165*** -0.030 -0.168**
(0.049) (0.051) (0.086) (0.054) (0.045) (0.072)Age squared 0.001 0.004*** 0.002 0.004*** 0.001 0.004*
(0.001) (0.001) (0.002) (0.001) (0.013) (0.002)Female (y/n) 0.094*** 0.034***
(0.011) (0.010)Minority (y/n) -0.072*** -0.087*** -0.081*** -0.098*** -0.062*** -0.076***
(0.011) (0.014) (0.012) (0.016) (0.016) (0.015)Rural (y/n) -0.021*** 0.020** -0.050*** 0.007 0.009 0.034**
(0.011) (0.011) (0.014) (0.010) (0.016) (0.015)Constant 1.071** 1.749*** 1.311* 1.784*** 0.849*** 1.766***
(0.449) (0.482) (0.798) (0.511) (0.394) (0.667)Observations 22,985 22,985 11,825 11,825 11,160 11,160R-squared 0.079 0.173 0.077 0.156 0.081 0.189All regressions include school fixed effects (and further only include schools with more than 100 students)Cluster-robust standard errors in parentheses*** p<0.01, ** p<0.05, * p<0.1
34
Appendix A: Table A.1: The Gender-Sensitive Nature of the STEM Track Choice (Ningxia data)
(1) (2) (3) (4) (5) (6)STEM track
(y/n)STEM track
(y/n)STEM track
(y/n)STEM track
(y/n)STEM track
(y/n)STEM track
(y/n)
Female -0.277*** -0.274*** -0.277*** -0.281*** -0.286*** -0.155***(0.010) (0.011) (0.011) (0.010) (0.010) (0.010)
Rural 0.073*** 0.070*** 0.083*** 0.097*** 0.062***(0.022) (0.022) (0.021) (0.014) (0.014)
Female * Rural 0.006 0.008 0.018 0.031*(0.017) (0.017) (0.016) (0.016)
Minority 0.019 0.019* 0.001(0.015) (0.009) (0.008)
Age -0.155** -0.101** -0.032(0.060) (0.045) (0.036)
Age squared 0.004** 0.003** 0.001(0.002) (0.001) (0.001)
Total HSEE score 0.122***(0.016)
STEM HSEE score 0.266***(0.007)
non-STEM HSEE score -0.143***(0.007)
Constant 0.795*** 0.754*** 0.755*** 2.341*** 1.728*** 0.960***(0.013) (0.021) (0.021) (0.563) (0.412) (0.336)
Observations 23,488 23,488 23,488 23,488 23,488 23,488R-squared 0.084 0.090 0.090 0.093 0.144 0.267Cluster-robust standard errors in parentheses*** p<0.01, ** p<0.05, * p<0.1
Source: Ningxia dataNotes: (a) OLS Results (results from logit regressions are substantively the same); (b) All regressions include county fixed effects
35
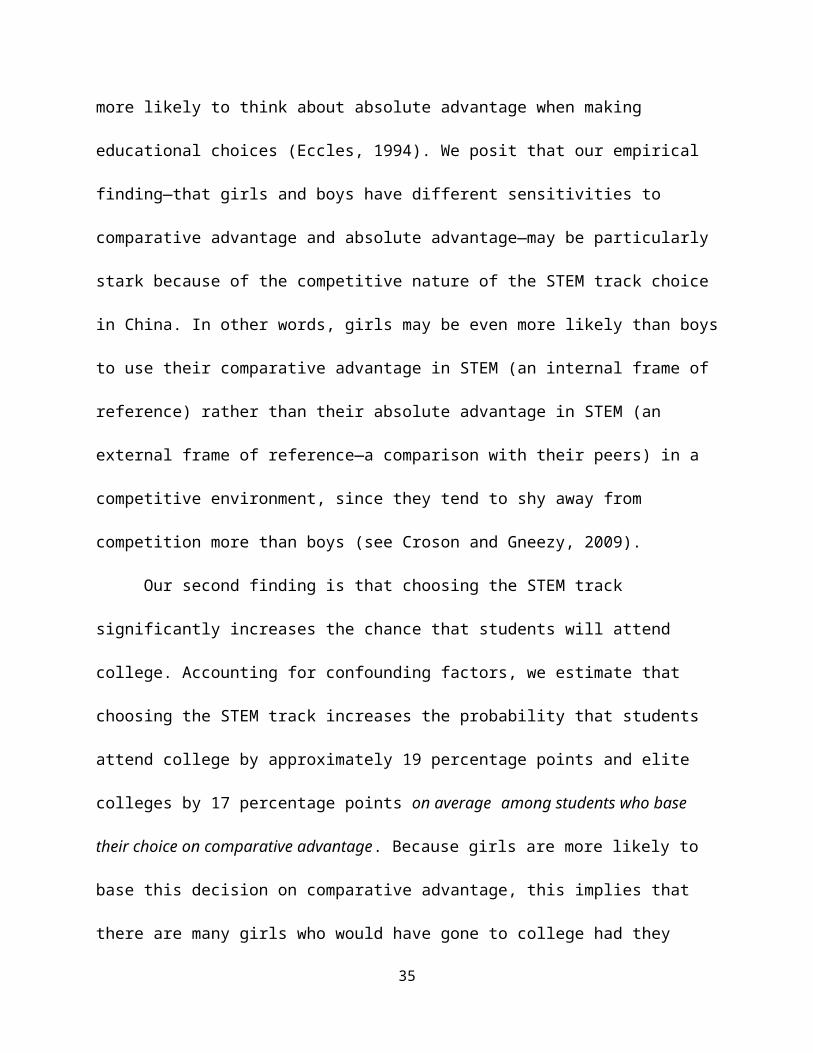
Table A2: First-Stage Instrumental Variable Regression ResultsComparative Advantage (the ratio of STEM HSEE scores to non-STEM HSEE scores) on STEM track (yes/no)
All Students Girls Boys(1) (2) (3)
Comparative Advantage in STEM .880*** 1.088*** 0.701***(0.022) (0.034) (0.022)
Total HSEE score 0.023*** 0.012 0.029***(0.009) (0.010) (0.010)
Age -0.037 -0.136** 0.056(0.035) (0.057) (0.053)
Age squared 0.001 0.003** -0.002(0.001) (0.002) (0.001)
Female (y/n) -0.151***(0.010)
Minority (y/n) 0.006 -0.005 0.014*(0.007) (0.011) (0.008)
Rural (y/n) 0.074*** 0.084*** 0.066(0.009) (0.013) (0.012)
Constant -0.057** 0.521 -0.744(0.329) (0.531) (0.489)
Observations 22,985 11,825 11,160R-squared 0.268 0.226 0.191F-Test for Weak Identification (p-value) <0.0001 <0.0001 <0.0001All regressions include school fixed effects (and further only include schools with more than 100 students)Cluster-robust standard errors in parentheses*** p<0.01, ** p<0.05, * p<0.1Note: The weak identification tests (using the Craig-Donald Wald F Statistic) all reject the null hypotheses that the equations are weakly identified.
36

Endnotes
37
1 Students in China may therefore face a more competitive environment when choosing the non-STEM track than students in other emerging economies. It is important to acknowledge this point when thinking about the generalizability of the findings of this paper.2 Whenever we conduct analyses using the Shaanxi data, we also use sample weights (that reflect the actual proportion of STEM and non-STEM track students in grade 3 in each high school in Shaanxi). Our results are in fact quite similar, whether or not we use the sample weights. 3 We could only obtain information on total HSEE scores and not HSEE subject scores in the Shaanxi survey. This is because final-year academic high school students had taken the HSEE three years prior to answering our survey. As such (during the pilot testing of our surveys), we found that final-year academic high school students could only recall their total HSEE scores and not their subject-specific HSEE scores.4 The survey asked students about which factors influenced their STEM track choice. Students could choose from various factors—factors that are thought to be important (as identified in the literature) in influencing gender differences in STEM choices. The (translated) wording of the survey question is as follows:“Why did you choose your current (STEM or non-STEM track)? Please choose yes or no for each of the following factors:
a) Parent’s influenceb) Friend’s influencec) Teacher’s influenced) I have a performance (achievement) advantage in my current (STEM or the non-STEM) track
(versus the other track).e) Interestf) The current track suits my personalityg) The current track is easier for meh) The current track makes it easier to enter university because there is less competitioni) The current track makes it easier to find a job in the futurej) Other”
5 Results are substantively similar when we use a logit model and report the coefficients using either odds ratios or marginal effects. Results are also substantively similar when we use school fixed effects instead of county fixed effects. For the sake of brevity, we only present the OLS estimates with country fixed effects in this paper.6 The HSEE is a provincial wide test in Ningxia. Because the scores on the HSEE are used to determine entry into different levels (ranks) of academic high schools, the scores are widely publicized. Students are often aware not only of their own HSEE scores (and subjects scores), and those of their classmates, but also of the distribution of scores in Ningxia as a whole.7 We define comparative advantage by dividing the sum of both STEM subject scores (math and science) by the sum of both non-STEM subject scores (Chinese and politics). We do not count English as a non-STEM subject, since English is tested (at the same level of difficulty) in both the STEM and non-STEM CEE. 8 There are at least three reasons why we believe that students are aware of comparative advantage when making their STEM track choice (and why comparative advantage is strongly correlated with the STEM track choice in our first stage IV regressions—see Appendix Table A2). First, as we have noted in the introduction, there is a fairly extensive literature on how high school students respond to comparative advantage versus absolute advantage in the education and psychology literature (see, for example, Marsh, 1986; Marsh, 1990; Skaalvik and Rankin, 1990 and 1995; Eccles, 1994; Möller and Köller, 2001; Barone, 2011). Second, we note that the students in our sample make their STEM track choice in the beginning of high school (when they are 15-16 or even 17 years old, rather than 12-15 years old). The literature that shows student responsiveness to measures of comparative versus absolute
advantage in fact focus on students in this age range (or even younger age ranges—see, for example, Marsh, 1986; Skaalvik and Rankin, 1990 and 1995; Plucker and Stocking, 2001; Moeller et al., 2011). Finally, approximately 45% of the students in our Shaanxi survey data reported (albeit retrospectively) that they made their STEM track choice based on their comparative advantage in STEM versus non-STEM subjects. Taken together, we believe that there is ample evidence that students are aware of (and respond to) comparative advantage.9 We also check the robustness of the instrumental variable model results (in Section 3) by relaxing the assumption of linearity. Specifically, we run a bivariate probit model in which we instrument for the endogenous binary treatment variable (STEM track choice) and examine the impacts of the treatment variable on binary outcomes (access to college or elite colleges). The results from the bivariate probit model are substantively the same as the results from the linear model: choosing the STEM track has a strong, positive impact on college and elite college access. This is true for all students, female students, and male students. The results are available from the authors upon request.10 We also note that we did not adjust the “test of proportions” (between the girl and boy groups) for the clustered nature of the data (students are clustered within classrooms). It is possible therefore that the differences that are small in magnitude would also not be significantly different from zero after adjusting the standard errors for clustering.11 Note that in Tables 1 and 2 (using the Shaanxi data), the measure of comparative is comparative advantage in one’s current track. In Figure 2 and Tables 3 and 4 (which use the Ningxia data), the measure of comparative advantage is comparative advantage in STEM. Thus, in Tables 1 and 2, comparative advantage is defined in relation to one’s current track (the measure uses a “floating” reference—that reference depends on the track that the student is currently in). By contrast, in Figure 2 and Tables 3 and 4, comparative advantage is defined as the ratio between STEM and non-STEM scores (the measure uses a fixed reference by always comparing STEM to non-STEM achievement).12 The first stage results show that the instrument (comparative advantage in STEM) has a strong and statistically significant relationship (at the 1% level) with the endogenous regressors (choosing the STEM track or not). The weak identification tests (using the Craig-Donald Wald F Statistic) further reject the null hypotheses that the equations are weakly identified (with a p-value of 0.000).13 In the school fixed effects model, we dropped schools that have fewer than 100 students (thus dropping 503 out of 23,488 observations). We did this to ensure the convergence of the standard error estimates associated with the IV regressions (especially since we adjust the standard errors for clustering at the school level and a handful of high schools had a small number of graduates). The results were, in fact, substantively similar whether or not we dropped the 503 observations.