Absolute Real-Time PCR: A Comparison of … · sizing and purity analysis in a single step (Figure...
4
Authors David-Mathieu Tremblay and Odile Carisse Agriculture & Agri-Food Canada, Horticulture Research and Development Centre Saint-Jean-sur-Richelieu, Qc, Canada Solange Borg and Melissa Huang Liu Agilent Technologies, Inc. La Jolla, CA, USA Absolute Real-Time PCR: A Comparison of Spectrophotometric and On-Chip Methods for External Standard Curve Construction from Different Nucleic Acid Dosages Application Note Agriculture Biotechnology and Nucleic Acid Analysis Abstract Concentration determination of DNA using real-time quantitative PCR technology plays a substantial role for identification and quantitation of microbes in unknown samples in many research areas. Absolute quantitation with qPCR fully depends on the accuracy of the external standards. This Application Note focuses on establishing calibration standards by two different approaches – spectrophotometry and on-chip electrophoresis. Conventional spectrophotometric techniques for the evaluation of DNA concentration may lead to greater variation between standard curve replicates and bring more variability to final results. In contrast, the Agilent 2100 Bioanalyzer System provides accurate and precise quantitation of DNA, enabling the preparation of reliable standard curves for absolute quantitation with qPCR assays. Introduction Quantitation of DNA using real-time quantitative PCR (qPCR) represents a significant contribution in plant pathology by allowing identification and calculation of pathogens in the air, soil, water, seeds, plants, and so forth. Two major strategies for qPCR are based on relative or absolute quantitation 1 . Absolute quantitation qPCR assays are increasingly adopted to track and monitor airborne fungi in fruit and vegetable production areas. The accuracy of this method depends on the accuracy of the standard curves. Typical challenges include standard design, production, determination of the exact concentration, and storage stability. A precise quantitation by reliable independent methods is mandatory for successful qPCR.
Transcript of Absolute Real-Time PCR: A Comparison of … · sizing and purity analysis in a single step (Figure...

AuthorsDavid-Mathieu Tremblay and Odile CarisseAgriculture & Agri-Food Canada, Horticulture Research and Development CentreSaint-Jean-sur-Richelieu, Qc, Canada
Solange Borg and Melissa Huang LiuAgilent Technologies, Inc.La Jolla, CA, USA
Absolute Real-Time PCR: A Comparison of Spectrophotometric and On-Chip Methods for External Standard Curve Construction from Different Nucleic Acid Dosages
Application NoteAgriculture Biotechnology and Nucleic Acid Analysis
AbstractConcentration determination of DNA using real-time quantitative PCR technology plays a substantial role for identifi cation and quantitation of microbes in unknown samples in many research areas. Absolute quantitation with qPCR fully depends on the accuracy of the external standards. This Application Note focuses on establishing calibration standards by two different approaches – spectrophotometry and on-chip electrophoresis. Conventional spectrophotometric techniques for the evaluation of DNA concentration may lead to greater variation between standard curve replicates and bring more variability to final results. In contrast, the Agilent 2100 Bioanalyzer System provides accurate and precise quantitation of DNA, enabling the preparation of reliable standard curves for absolute quantitation with qPCR assays.
IntroductionQuantitation of DNA using real-time quantitative PCR (qPCR) represents a signifi cant contribution in plant pathology by allowing identifi cation and calculation of pathogens in the air, soil, water, seeds, plants, and so forth. Two major strategies for qPCR are based on relative or absolute quantitation1. Absolute quantitation qPCR assays are increasingly adopted to track and monitor airborne fungi in fruit and vegetable production areas. The accuracy of this method depends on the accuracy of the standard curves. Typical challenges include standard design, production, determination of the exact concentration, and storage stability. A precise quantitation by reliable independent methods is mandatory for successful qPCR.

2
DNA analysis with on-chip electrophoresisDNA electrophoresis was performed on the 2100 Bioanalyzer System in combination with the Agilent DNA 1000 Kit, according to the manufacturer’s protocol2.
Copy number calculationThe DNA copy number was calculated based on the quantitation results using the following equation:
Copy number = (concentration)/(molar mass) × (6.022 × 10²³)
Standard preparationThe purifi ed amplicon was used to prepare fi ve standards ranging from 2 × 10⁵ to 2 × 101 copies/µL.
qPCRThe Mx3005P qPCR system with MxPro software was used for real-time qPCR using Brilliant II QPCR Low ROX Master Mix with multiple standards. The 25 µL PCR reaction was performed according to the manufacturer’s protocol, containing 1X-Brilliant II PCR buffer, 300 nM specifi c forward primers and reverse primers, 200 nM probe, and 2 µL DNA from 10x dilution of a standard. Specifi c primers and probes used are described in Table 1.
Results and DiscussionPCR was performed for two different genes from plant fungus species E. necator and B. cinerea as summarized in Table 1. Five independent PCR reactions for amplicon generation were performed using the same DNA as starting material. Internal Transcribe Spacer (ITS) specifi c primers forE. necator give an amplicon of 438 bp and Intergenic Spacer (IGS) specifi c primers
Agilent DNA 1000 kit (Cat#5067-1504) were obtained from Agilent Technologies (Santa Clara, CA, USA).
PCRFor amplicon generation, the SureCycler 8800 Thermal Cycler equipped with a 96-well block was used. A 1 μL amount of DNA extracted from fungus isolates E. necator and B. cinerea was used forPCR. The concentration of the startingmaterial was not determined. Specifi cprimers were used depending on thespecies (Table 1).
The PCR reaction was performed following a conventional Taq protocol with SurePRIME polymerase. The 25 µL PCR reaction was started with a pre-incubation step at 95 °C for 10 minutes to activate the polymerase, followed by 45 cycles (94 °C for 30 seconds, 54 °C for 30 seconds, and 72 °C for 45 seconds), and fi nally 72 °C for 5 minutes.
Sample purifi cationThe NucleoSpin Gel and PCR Clean-up kit was used according to the manufacturer’s recommendation for for PCR clean-up.
DNA quantifi cation with a spectrophotometerFor spectrophotometric DNA quantifi cation, the NanoDrop 2000 and the GE NanoVue Plus were used. As suggested by the manufacturers, a 2 µL droplet of each purifi ed amplicon was deposited on the measurement surface of the spectrophotometer. NucleoSpin kit elution buffer was used as a blank.
This Application Note compares the initial concentration determination of standards by two different approaches, spectrophotometry and on-chip electrophoresis. Based on the quantitative values obtained, the reproducibility of standard curve creation was evaluated. To compare these different approaches, absolute quantitation with qPCR was performed with standard curves generated from the DNA of two species of plant pathogens, Erysiphe necator and Botrytis cinerea. Those pathogens cause powdery mildew and grey mold on grapes and other plants, leading to potential crop loss and poor wine quality3,4. Specifi c amplicons were generated using standard PCR procedures. The purifi ed amplicons were quantifi ed using two spectrophotometric instruments, NanoDrop and NanoVue, and an Agilent 2100 Bioanalyzer System, an on-chip electrophoresis instrument. Based on the quantitation values given by each system, standard curves were generated by qPCR.
ExperimentalMaterialsE. necator and B. cinerea isolate, Internal Transcribe Spacer (ITS) specifi c primers for E. necator, Intergenic Spacer (IGS) specifi c primer for B. cinerea, specifi c forward primers, reverse primers, and probes were from Agriculture and Agri-Food Canada, St-Jean-sur-Richelieu, Qc, Canada. Details on specifi c primers and probes are not yet published.The NanoDrop 2000 was purchased from Thermo Scientifi c (Wilmington, DE, USA), the NanoVue Plus from Sigma-Aldrich (St. Louis, MO, USA). The NucleoSpin Gel and PCR Clean-up kit from MACHEREY-NAGEL GmbH & Co(Düren, Germany) was used for sample clean-up. SurePRIME DNA Polymerase was purchased from MP Biomedicals, LLC (Santa Ana, CA, USA). SureCycler 8800 Thermal Cycler (Cat#G8800A) with 96-well module (Cat#G8810A), Mx3005P qPCR system with MxPro software(Cat#401513), Brilliant II QPCR Low ROX Master Mix (Cat#600806), Agilent 2100 Bioanalyzer system (Cat# G2939AA), and
Table 1. Two species of plant fungus were used to test the absolute quantitation approach.
Source Erysiphe necator Botrytis cinereaPCR Internal Transcribed Spacer (ITS) specifi c
primers for E. necatorIntergenic Spacer (IGS) specifi c primers for B. cinerea
RT-PCR Internal Transcribed Spacer (ITS) specifi c qPCR primers and probe for E. necator. Size = 95 bp.
Intergenic Spacer (IGS) specifi c qPCR primers and probe for B. cinerea. Size = also 95 bp.

3
for B. cinerea give an amplicon of 576 bp. The fi ve PCR replicates obtained for each species were purifi ed and analyzed using agarose gel electrophoresis (Figure 1).
The agarose gel shows reproducible results for the fi ve replicates for both species. As expected, only one PCR product was detected and nonspecifi c PCR products were not observed. For E. necator, the PCR product migrates between 400 and 500 bp, which is in good agreement with the expected 483 bp. For , the PCR product migrates above 500 bp, again in good agreement with the expected size of 576 bp.
The PCR replicates were quantifi ed using two different spectrophotometric instruments, NanoVue and NanoDrop. DNA concentration was also determined on the 2100 Bioanalyzer System with the DNA 1000 kit, which is based on on-chip electrophoresis with fl uorescence detection. The PCR samples were analyzed in duplicate, and the average was calculated (Table 2).
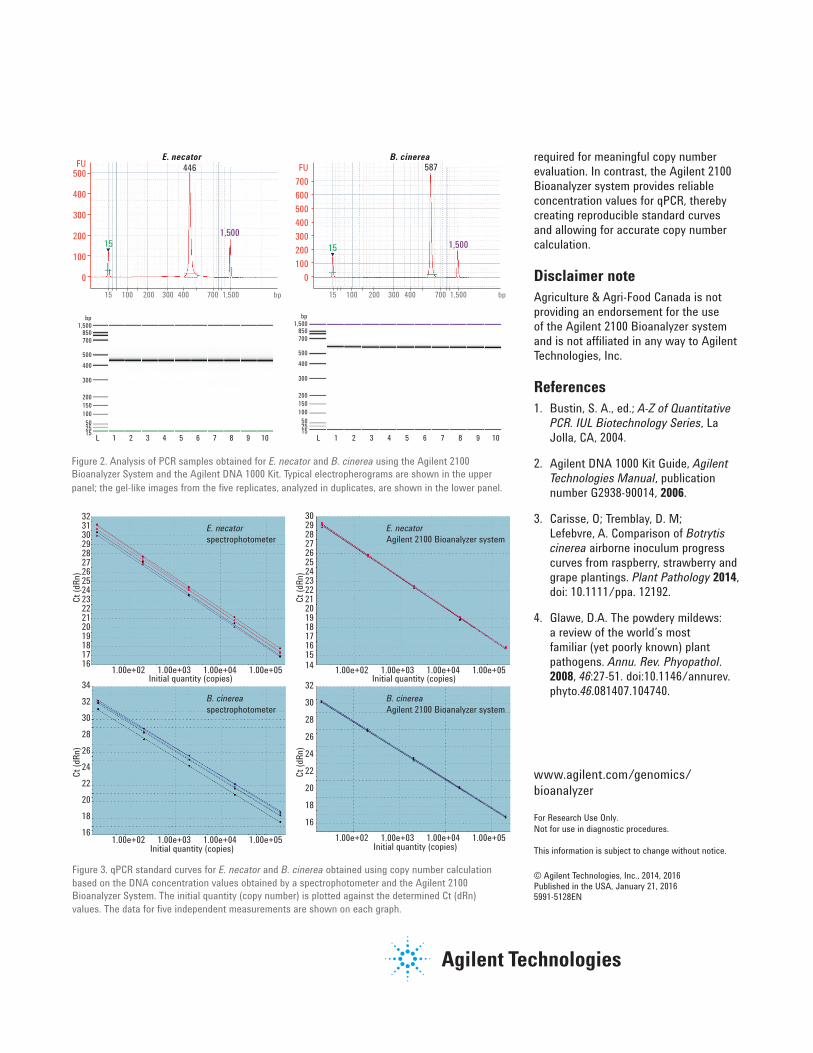
As expected, quantitation with the 2100 Bioanalyzer System results in signifi- cantly lower values compared to both of the spectrophotometric methods. The DNA quantitation with the DNA 1000 Kit is limited to the size range from 25 to 1,000 bp and is based on a fl uorescent dye specifi c for double-stranded nucleic acids. In contrast, spectrophotometers detect all molecules absorbing at a specifi c wavelength, including different types of nucleic acids or contaminants, which may yield inflated results. The 2100 Bioanalyzer System provides not only DNA quantitation, but also DNA sizing and purity analysis in a single step (Figure 2).
As shown in Figure 2, the 2100 Bioanalyzer System provides electropherograms and gel-like images. The separation of the five PCR reactions, ran in duplicate, are shown as gel-like images. None of the samples show the presence of nonspecific PRC products. The obtained results for the PCR product size and purity are in good agreement with the observations made after agarose gel electrophoresis (Figure 1).
Figure 1. The purifi ed PCR samples obtained for E. necator and B. cinerea were analyzed using agarose gels stained with ethidium bromide. Five replicates from each system were analyzed on each gel.
1,500 bp).
E. necator B. cinerea
Table 2. Summary of DNA quantitation obtained with different methods, on-chip electrophoresis with the Agilent 2100 Bioanalyzer system, and spectrophotometry with the NanoDrop 2000 and the NanoVue Plus instruments. The average of replicate measurements was determined.
System
E. necator B. cinereaDNA concentration Standard
deviation
DNA concentration Standard
deviationAgilent 2100 Bioanalyzer System 12.96 0.98 10.75 1.14NanoVue Plus 38.40 9.06 35.10 9.89NanoDrop 2000 38.75 8.87 35.01 9.84
The copy number of pathogens is typically calculated from standard curves generated by qPCR. Based on the quantitation results obtained with a spectrophotometer and the 2100 Bioanalyzer System, samples of differing concentrations were prepared and subjected to qPCR. The reactions were performed as fi ve replicate measurements to obtain the standard curves shown in Figure 3.
Regardless of amplicons used for the creation of the standard curve, comparable copy numbers would have comparable Ct values. Hence, the qPCR experiment was expected to show similar standard curves. However, Figure 3 shows differences in the standard curves for E. necator and B. cinerea obtained when using the copy number determination based on the spectrophotometric measurement. This unexpected difference between the standard curves clearly indicates an inconsistencywith the quantitation precision of the spectrophotometric approach.
In contrast, when the standard curves are created and calculated based on the quantitation with the 2100 Bioanalyzer System, much less variation between the five standard curves is observed (Figure 3) providing needed confidence in copy number calculations. The 2100 Bioanalyzer System provides reproducible and reliable quantitation of amplicons compared tospectrophotometry.
ConclusionAbsolute quantitation by real-time PCR is a widely accepted technique in numerous research applications allowing for copy number determination of microbes or genes in many sample types. Airborne plant pathogen detection was used as an example of a critical fi alp ni dle nt biology requiring sensitive and accurate methods for absolute quantitation and copy number calculation. The results presented in this Application Note reveal that two independent spectrophotometric methods used for DNA quantitation measurement lack the co nsistency
www.agilent.com/genomics/bioanalyzer
For Research Use Only. Not for use in diagnostic procedures.
This information is subject to change without notice.
© Agilent Technologies, Inc., 2014, 2016Published in the USA, January 21, 20165991-5128EN
required for meaningful copy number evaluation. In contrast, the Agilent 2100 Bioanalyzer system provides reliable concentration values for qPCR, thereby creating reproducible standard curves and allowing for accurate copy number calculation.
Disclaimer noteAgriculture & Agri-Food Canada is not providing an endorsement for the use of the Agilent 2100 Bioanalyzer system and is not affi liated in any way to Agilent Technologies, Inc.
References1. Bustin, S. A., ed.; A-Z of Quantitative
PCR. IUL Biotechnology Series, LaJolla, CA, 2004.
2. Agilent DNA 1000 Kit Guide, AgilentTechnologies Manual, publicationnumber G2938-90014, 2006.
3. Carisse, O; Tremblay, D. M;Lefebvre, A. Comparison of Botrytiscinerea airborne inoculum progresscurves from raspberry, strawberry andgrape plantings. Plant Pathology 2014,doi: 10.1111/ppa. 12192.
4. Glawe, D.A. The powdery mildews:a review of the world’s mostfamiliar (yet poorly known) plantpathogens. Annu. Rev. Phyopathol.2008, 46:27-51. doi:10.1146/annurev.phyto.46.081407.104740.
E. necator B. cinerea
400
500FU
15 100 200
bp
L 1 2 3 4 5 6 7 8 9 10
1,500850700
500400
300
200150100502515
bp1,500
850700
500400
300
200150100502515
L 1 2 3 4 5 6 7 8 9 10
15
446
1,50015
587
1,500
300 400 700 1,500 bp
300
200
100
0
FU
300400500600700
200100
015 100 200 300 400 700 1,500 bp
Figure 2. Analysis of PCR samples obtained for E. necator and B. cinerea using the Agilent 2100 Bioanalyzer System and the Agilent DNA 1000 Kit. Typical electropherograms are shown in the upper panel; the gel-like images from the fi ve replicates, analyzed in duplicates, are shown in the lower panel.
Figure 3. qPCR standard curves for E. necator and B. cinerea obtained using copy number calculation based on the DNA concentration values obtained by a spectrophotometer and the Agilent 2100 Bioanalyzer System. The initial quantity (copy number) is plotted against the determined Ct (dRn) values. The data for five independent measurements are shown on each graph.
E. necatorspectrophotometer
E. necatorAgilent 2100 Bioanalyzer system
B. cinereaspectrophotometer
B. cinereaAgilent 2100 Bioanalyzer system
3231302928272625242322212019181716 1.00e+02 1.00e+03
Initial quantity (copies)
Ct (d
Rn)
Ct (d
Rn)
Ct (d
Rn)
Ct (d
Rn)
Initial quantity (copies)
1.00e+04 1.00e+05
3234
3028262422201816
1.00e+02 1.00e+03 1.00e+04 1.00e+05
3029282726252423222120191817161514 1.00e+02 1.00e+03
Initial quantity (copies)
Initial quantity (copies)
1.00e+04 1.00e+0532
30
28
26
24
22
20
18
161.00e+02 1.00e+03 1.00e+04 1.00e+05