Psychiatry in postgraduate teaching hospital ABRAHAMSON* M ...

Abrahamson (2007, April). The real world as a trick question: Undergraduate statistics majors’ construction-based modeling of probability. Paper presented at the annual meeting of the American Education Research Association, Chicago, IL
1
The Real World as a Trick Question: Undergraduate Statistics Majors’ Construction-Based Modeling of Probability
Dor Abrahamson
Graduate School of Education, University of California, Berkeley [email protected]
Abstract: 24 undergraduate/graduate students enrolled in mathematical programs participated in one-to-one interviews as part of a design-based research study of the cognition of probability. The students were asked to estimate outcome distributions of a very simple randomness generator consisting of an exposed bin full of marbles, half green and half blue, and a scooper—a 2-by-2 array of concavities—for drawing out exactly four marbles from the mix. This array formation (4-block) featured also in combinatorial-analysis materials and computer-based simulations of the probability experiment. Central to the design is the combinations tower, an assembly of the 16 unique outcomes in the form of a 1:4:6:4:1 "picto-barchart," i.e., with the outcomes themselves, not just stark columns as in regular histograms. All students said that the relatively most common experimental outcome should have 2 green and 2 blue marbles, but only 10 students initiated combinatorial analysis as a means of warranting their guess, of whom only 4 conducted it successfully. For all students, the combinations tower constituted a context for coordinating between the sample space of the stochastic device and distributions of actual outcomes in experiments with this device. I argue for the utility of guided, situated problem solving for the learning and consolidation of probability concepts.
Introduction Background and Objectives
A fundamental tenet of pedagogical philosophies inspired by Piagetian genetic epistemology, i.e., constructivism, is that students learn best in environments that enable them to begin from what they know and assimilate new content through problem solving, reflection, and expression (Freudenthal, 1986; Papert, 1991; von Glasersfeld, 1987). For education researchers, designers, and practitioners interested in promoting student learning of particular content, such as the mathematical content of probability, the constructivist tenet posits the questions: (a) What are students’ in-coming understandings, explicit as well as implicit, that pertain to the study of this content?; and (b) What is the nature of intervention that may foster developmental continuity from the in-coming understanding toward age-appropriate curricular goals? The first question is empirical—students’ in-coming understandings can be elicited through studies, such as individual interviews, in which the students are presented with a situation and are asked to solve a problem, and the interviewer probes in attempt to characterize the nature and extent of the cognitive resources students bring to bear (Ginsburg, 1997). The second question is addressed through design-based research methodology, the study of student content-specific cognition through engaging the students in learning activities with innovative objects and/or facilitation structures—the research is conducted in iterated cycles of design, testing, and data analysis (Brown, 1992; Cobb, Confrey, diSessa, Lehrer, & Schauble, 2003; Collins, 1992; Edelson,
Abrahamson (2007, April). The real world as a trick question: Undergraduate statistics majors’ construction-based modeling of probability. Paper presented at the annual meeting of the American Education Research Association, Chicago, IL
2
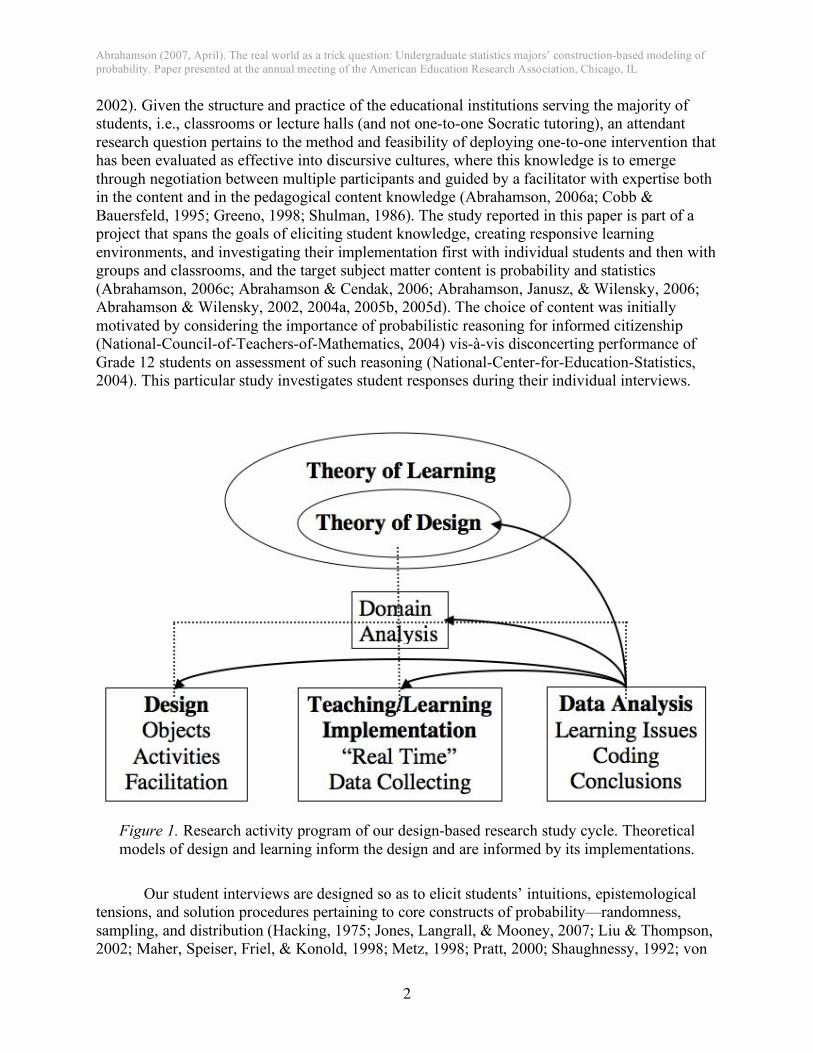
2002). Given the structure and practice of the educational institutions serving the majority of students, i.e., classrooms or lecture halls (and not one-to-one Socratic tutoring), an attendant research question pertains to the method and feasibility of deploying one-to-one intervention that has been evaluated as effective into discursive cultures, where this knowledge is to emerge through negotiation between multiple participants and guided by a facilitator with expertise both in the content and in the pedagogical content knowledge (Abrahamson, 2006a; Cobb & Bauersfeld, 1995; Greeno, 1998; Shulman, 1986). The study reported in this paper is part of a project that spans the goals of eliciting student knowledge, creating responsive learning environments, and investigating their implementation first with individual students and then with groups and classrooms, and the target subject matter content is probability and statistics (Abrahamson, 2006c; Abrahamson & Cendak, 2006; Abrahamson, Janusz, & Wilensky, 2006; Abrahamson & Wilensky, 2002, 2004a, 2005b, 2005d). The choice of content was initially motivated by considering the importance of probabilistic reasoning for informed citizenship (National-Council-of-Teachers-of-Mathematics, 2004) vis-à-vis disconcerting performance of Grade 12 students on assessment of such reasoning (National-Center-for-Education-Statistics, 2004). This particular study investigates student responses during their individual interviews.
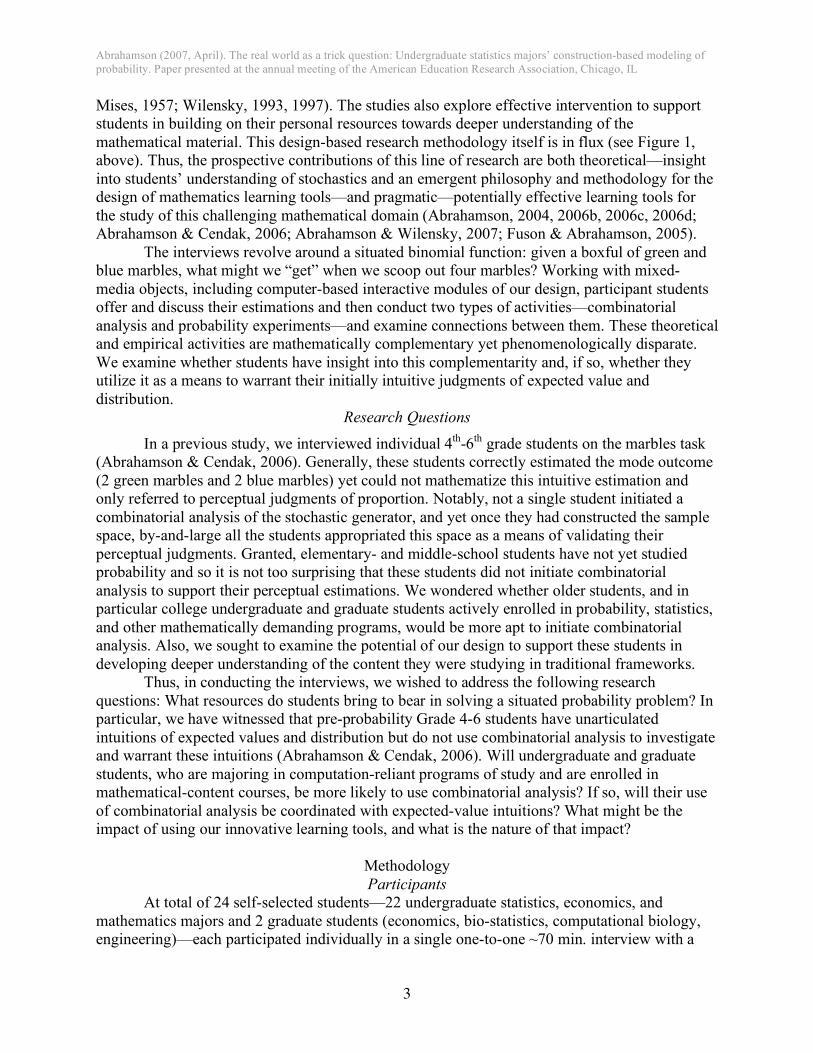
Figure 1. Research activity program of our design-based research study cycle. Theoretical models of design and learning inform the design and are informed by its implementations.
Our student interviews are designed so as to elicit students’ intuitions, epistemological
tensions, and solution procedures pertaining to core constructs of probability—randomness, sampling, and distribution (Hacking, 1975; Jones, Langrall, & Mooney, 2007; Liu & Thompson, 2002; Maher, Speiser, Friel, & Konold, 1998; Metz, 1998; Pratt, 2000; Shaughnessy, 1992; von
Abrahamson (2007, April). The real world as a trick question: Undergraduate statistics majors’ construction-based modeling of probability. Paper presented at the annual meeting of the American Education Research Association, Chicago, IL
3
Mises, 1957; Wilensky, 1993, 1997). The studies also explore effective intervention to support students in building on their personal resources towards deeper understanding of the mathematical material. This design-based research methodology itself is in flux (see Figure 1, above). Thus, the prospective contributions of this line of research are both theoretical—insight into students’ understanding of stochastics and an emergent philosophy and methodology for the design of mathematics learning tools—and pragmatic—potentially effective learning tools for the study of this challenging mathematical domain (Abrahamson, 2004, 2006b, 2006c, 2006d; Abrahamson & Cendak, 2006; Abrahamson & Wilensky, 2007; Fuson & Abrahamson, 2005).
The interviews revolve around a situated binomial function: given a boxful of green and blue marbles, what might we “get” when we scoop out four marbles? Working with mixed-media objects, including computer-based interactive modules of our design, participant students offer and discuss their estimations and then conduct two types of activities—combinatorial analysis and probability experiments—and examine connections between them. These theoretical and empirical activities are mathematically complementary yet phenomenologically disparate. We examine whether students have insight into this complementarity and, if so, whether they utilize it as a means to warrant their initially intuitive judgments of expected value and distribution.
Research Questions
In a previous study, we interviewed individual 4th-6th grade students on the marbles task (Abrahamson & Cendak, 2006). Generally, these students correctly estimated the mode outcome (2 green marbles and 2 blue marbles) yet could not mathematize this intuitive estimation and only referred to perceptual judgments of proportion. Notably, not a single student initiated a combinatorial analysis of the stochastic generator, and yet once they had constructed the sample space, by-and-large all the students appropriated this space as a means of validating their perceptual judgments. Granted, elementary- and middle-school students have not yet studied probability and so it is not too surprising that these students did not initiate combinatorial analysis to support their perceptual estimations. We wondered whether older students, and in particular college undergraduate and graduate students actively enrolled in probability, statistics, and other mathematically demanding programs, would be more apt to initiate combinatorial analysis. Also, we sought to examine the potential of our design to support these students in developing deeper understanding of the content they were studying in traditional frameworks.
Thus, in conducting the interviews, we wished to address the following research questions: What resources do students bring to bear in solving a situated probability problem? In particular, we have witnessed that pre-probability Grade 4-6 students have unarticulated intuitions of expected values and distribution but do not use combinatorial analysis to investigate and warrant these intuitions (Abrahamson & Cendak, 2006). Will undergraduate and graduate students, who are majoring in computation-reliant programs of study and are enrolled in mathematical-content courses, be more likely to use combinatorial analysis? If so, will their use of combinatorial analysis be coordinated with expected-value intuitions? What might be the impact of using our innovative learning tools, and what is the nature of that impact?
Methodology Participants
At total of 24 self-selected students—22 undergraduate statistics, economics, and mathematics majors and 2 graduate students (economics, bio-statistics, computational biology, engineering)—each participated individually in a single one-to-one ~70 min. interview with a

Abrahamson (2007, April). The real world as a trick question: Undergraduate statistics majors’ construction-based modeling of probability. Paper presented at the annual meeting of the American Education Research Association, Chicago, IL
4
researcher. Our screening criterion was that participants had taken or were actively enrolled in at least the introductory college-level courses in probability. Participants were recruited through classroom announcements and e-mail messages. They each received $20.00 compensation. The interviews were conducted by the author and five undergraduate and graduate members of the Embodied Design Research Laboratory, all with backgrounds in mathematics and computer science and/or cognitive sciences.
Materials and Activities
The materials and activities used in this study were part of ProbLab (Abrahamson & Wilensky, 2002), an underdevelopment middle-school probability-and-statistics unit initially created at the Center for Connected Learning and Computer-Based Modeling, Northwestern University, under the umbrella of Wilensky’s Connected Probability project (Wilensky, 1997). The unit includes materials in traditional media, such as crayons and construction paper, as well as computer based simulations of experiments in theoretical and empirical probability authored in NetLogo (Wilensky, 1999) and participatory simulation activities for networked classrooms using HubNet (Wilensky & Stroup, 1999). For a discussion of the theoretical underpinnings of the design rationale, an overview of the activities, and reports on earlier empirical studies with individuals, groups, and classrooms, the reader is referred to other publications (Abrahamson, 2006b, 2006e; Abrahamson, Blikstein, Lamberty, & Wilensky, 2005; Abrahamson & Cendak, 2006; Abrahamson et al., 2006; Abrahamson & Wilensky, 2002, 2003, 2004a, 2004b, 2004c, 2005a, 2005b, 2005c, 2005d, 2006, 2007). Below, I elaborate only on the objects used in this study.
Note that in describing the design, I will be using mathematical terms, so as to communicate the design rationale, e.g., relations between objects and activities. This language need not imply that participating students construe the activities as such. For example, students might engage in a “theoretical probability” activity without initially realizing that the product of their combinatorial analysis bears on expected outcome distributions. It is only through participating in the activities and reflecting on them that the designed connections may emerge.
a b c
Figure 2. Selected materials, all embodiments of the 4-Block mathematical object: (a) the 4-block marbles-scooper stochastic device; (b) the combinations tower (an “itemized histogram” of
the sample space of the 4-block); and (c) a fragment from 4-Blocks, a model built in NetLogo and showing the outcome distribution from over 10,000 samples.

Abrahamson (2007, April). The real world as a trick question: Undergraduate statistics majors’ construction-based modeling of probability. Paper presented at the annual meeting of the American Education Research Association, Chicago, IL
5
The 4-Block, a Mixed-Media Stochastic Device for Exploring Probability Concepts For this study, all the materials were embodiments of the 4-block mathematical object
(see Figure 2, below), a 2-by-2 grid in which each cell is randomly assigned one of two colors, e.g., white or black (green or blue in the original device; white or black to accommodate print constraints). The 4-Block was implemented in different media: a marbles scooper (stochastic generator including a sampling utensil and an “urn” of hundreds of marbles), a combinations
tower (sample space built with construction paper and crayons), and NetLogo computer-based simulations of stochastic experiments. I now explain each of these materials.
4-block marbles scooper. The marbles scooper is a device for scooping a fixed number of marbles out of a vessel containing many marbles. We have built a marbles scooper that scoops exactly four marbles (see Abrahamson & Wilensky, 2005d, for a study using a 9-block marbles scooper). Scooping with the 4-block is mathematically commensurate and functionally isomorphc with tossing 4 coins—both operate as a set of 4 independent outcomes that each randomly take on one of two values (black or white; Heads or Tails). Whereas the 4-block is functionally equivalent to a set of 4 coins, it is structurally distinct from the coins experiment: unlike coins that land in analytically arbitrary locations on a desk, the marbles settle in fixed
locations that are analytically vital.1 That is, in the case of the 4-Block but not in the case of coins, the analytic treatment of permutations is supported by inherent structural properties of the device. Analogously, the theoretical distinction between the 4-coins outcomes HHHT as compared to HHTH would be supported by distinguishable configurations in the empirical
domain—they would look different and be labeled as such.2 Yet, here an important cognitive–pedagogical caveat is due: Whereas the materials are said to embed mathematical ideas, whether a student actually attends to distinctive properties of designed objects and interprets these properties in ways that are conducive to context-specific problem solving and, perhaps, conceptual development, is another question. At the least, one can assert that the materials have been specifically designed so as to potentially afford the salience of perceptual properties that the designer judges as supportive of developing conceptual schemes underlying the understanding of mathematical content according to a particular model that the designer is privileging.
How a student perceptually–conceptually construes a designed mathematical object informs the mathematical knowledge the student brings to bear, i.e., how the student will frame subsequent interactions with this object. Usually, there would be a single preferred framing, and so a designer would eschew ambiguity by building mathematical tools that unambiguously afford a desired framing. However, a designer’s rationale might also be such that ambiguity is conducive to multiple framings that are all useful, and in fact the designer may regard ambiguity as inherent to learning, because it stimulates a student to evoke and coordinate idea elements that are complementary to a target concept (Abrahamson & Wilensky, 2007). Note, then, that the marbles and scooper constitute an ambiguous mathematical tool. Depending on the context, this
1 Is scooping four marbles from the box mathematically commensurate with tossing four coins?
If the scooping were sequential, the answer would be “strictly no, but practically yes,” because
the ratio between the great number of marbles in the box as compared to the size of the sample
make issues of replacement/no-replacement ignorable. However, the scoop is simultaneous, even
in “slow motion,” and so the four selections appear to be truly independent. 2 Tossed coins, once settled on a desk, do create a spatial configuration. Yet this spatiality, a
functional requisite of the coin-tossing process, does not readily relate to the left-to-right
spatiality of analytic sequences such as ‘HHTH.’
Abrahamson (2007, April). The real world as a trick question: Undergraduate statistics majors’ construction-based modeling of probability. Paper presented at the annual meeting of the American Education Research Association, Chicago, IL
6
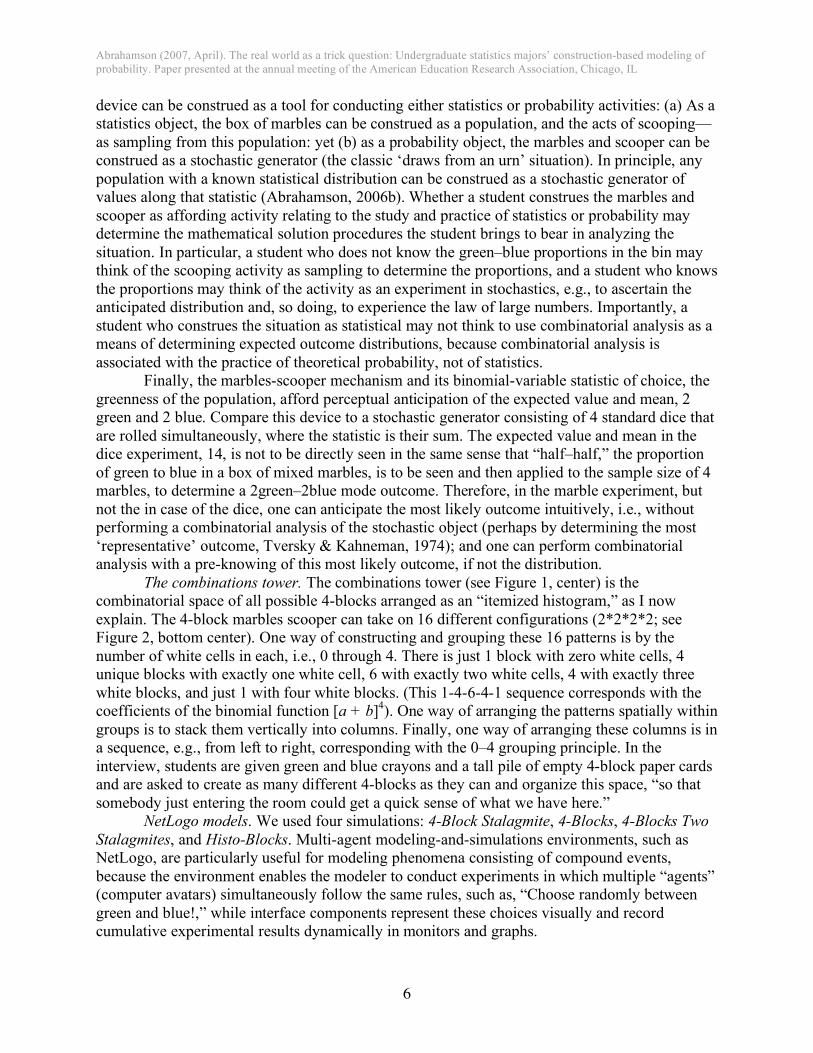
device can be construed as a tool for conducting either statistics or probability activities: (a) As a statistics object, the box of marbles can be construed as a population, and the acts of scooping—as sampling from this population: yet (b) as a probability object, the marbles and scooper can be construed as a stochastic generator (the classic ‘draws from an urn’ situation). In principle, any population with a known statistical distribution can be construed as a stochastic generator of values along that statistic (Abrahamson, 2006b). Whether a student construes the marbles and scooper as affording activity relating to the study and practice of statistics or probability may determine the mathematical solution procedures the student brings to bear in analyzing the situation. In particular, a student who does not know the green–blue proportions in the bin may think of the scooping activity as sampling to determine the proportions, and a student who knows the proportions may think of the activity as an experiment in stochastics, e.g., to ascertain the anticipated distribution and, so doing, to experience the law of large numbers. Importantly, a student who construes the situation as statistical may not think to use combinatorial analysis as a means of determining expected outcome distributions, because combinatorial analysis is associated with the practice of theoretical probability, not of statistics.
Finally, the marbles-scooper mechanism and its binomial-variable statistic of choice, the greenness of the population, afford perceptual anticipation of the expected value and mean, 2 green and 2 blue. Compare this device to a stochastic generator consisting of 4 standard dice that are rolled simultaneously, where the statistic is their sum. The expected value and mean in the dice experiment, 14, is not to be directly seen in the same sense that “half–half,” the proportion of green to blue in a box of mixed marbles, is to be seen and then applied to the sample size of 4 marbles, to determine a 2green–2blue mode outcome. Therefore, in the marble experiment, but not the in case of the dice, one can anticipate the most likely outcome intuitively, i.e., without performing a combinatorial analysis of the stochastic object (perhaps by determining the most ‘representative’ outcome, Tversky & Kahneman, 1974); and one can perform combinatorial analysis with a pre-knowing of this most likely outcome, if not the distribution.
The combinations tower. The combinations tower (see Figure 1, center) is the combinatorial space of all possible 4-blocks arranged as an “itemized histogram,” as I now explain. The 4-block marbles scooper can take on 16 different configurations (2*2*2*2; see Figure 2, bottom center). One way of constructing and grouping these 16 patterns is by the number of white cells in each, i.e., 0 through 4. There is just 1 block with zero white cells, 4 unique blocks with exactly one white cell, 6 with exactly two white cells, 4 with exactly three white blocks, and just 1 with four white blocks. (This 1-4-6-4-1 sequence corresponds with the coefficients of the binomial function [a + b]4). One way of arranging the patterns spatially within groups is to stack them vertically into columns. Finally, one way of arranging these columns is in a sequence, e.g., from left to right, corresponding with the 0–4 grouping principle. In the interview, students are given green and blue crayons and a tall pile of empty 4-block paper cards and are asked to create as many different 4-blocks as they can and organize this space, “so that somebody just entering the room could get a quick sense of what we have here.”
NetLogo models. We used four simulations: 4-Block Stalagmite, 4-Blocks, 4-Blocks Two
Stalagmites, and Histo-Blocks. Multi-agent modeling-and-simulations environments, such as NetLogo, are particularly useful for modeling phenomena consisting of compound events, because the environment enables the modeler to conduct experiments in which multiple “agents” (computer avatars) simultaneously follow the same rules, such as, “Choose randomly between green and blue!,” while interface components represent these choices visually and record cumulative experimental results dynamically in monitors and graphs.

Abrahamson (2007, April). The real world as a trick question: Undergraduate statistics majors’ construction-based modeling of probability. Paper presented at the annual meeting of the American Education Research Association, Chicago, IL
7
3a. 3b.
Figure 3. A 4-block “stalagmite” under two conditions: Figure 3a shows the combinatorial space of the 4-block, and Figure 3b shows its outcome distribution. An examination of Figure 3b
reveals that although the outcomes were generated randomly, the relative heights of the columns are by-and-large as in the combinatorial space (3a), e.g., in both figures the middle column is 6
times as tall as the left-most column (6:1 or 48:8, respectively).

Abrahamson (2007, April). The real world as a trick question: Undergraduate statistics majors’ construction-based modeling of probability. Paper presented at the annual meeting of the American Education Research Association, Chicago, IL
8
In the 4-Blocks Stalagmite model (Abrahamson & Wilensky, 2004a; see Figure 3, previous page), 4-blocks are generated randomly. Each sample first appears at the top of the columns and slightly to their left (not seen in this figure) and then descends down a column corresponding to the number of white squares in the 4-block, to be stacked on top of any other samples already in that column. For example, 4-blocks with exactly 3 white squares descend down the column that bears the numeral ‘3’ at its base. The simulation can be run under various conditions. Under one condition, (see Figure 3a, on the left) only blocks that have not yet been “discovered” are kept, so the experiment results in the combinations tower (16 unique blocks), whereas under another condition (see Figure 3b, on the right), all samples are kept, resulting in a random-outcome distribution. In fine-tuning this simulation toward the interviews, we set the height of the columns so as to make it very unlikely for any column other than the middle column to “win” (accumulate samples so as to arrive first at the top). Nevertheless, all properties of the simulation environment, such as the heights of the columns, can be adjusted in response to emerging inquiry directions.
Figure 4. The ProbLab model “4-Blocks” built in NetLogo.
In 4-Blocks (see Figure 4, above), four squares independently “choose” randomly between two colors, e.g., between green and blue. The program classifies, counts, and histograms

Abrahamson (2007, April). The real world as a trick question: Undergraduate statistics majors’ construction-based modeling of probability. Paper presented at the annual meeting of the American Education Research Association, Chicago, IL
9
the results according to the number of green squares in them (see the “# target color” monitor and the histogram in Figure 4). Note that unlike 4-Blocks Stalagmite, this simulation does not keep a record of the specific outcomes but only of overall accumulations. Over numerous trials, the histogram converges on the 1-4-6-4-1 binomial distribution, as predicted by the Law of Large Numbers.
Figure 5. The ProbLab model 4-Blocks Two Stalagmites, built in NetLogo, dynamically
displays visualizations of two concurrent statistical analyses of a random 4-block generator: (a) 16 unique events (the “flat” distribution in the left-side stalagmite and corresponding histogram);
and (b) 5 event classes, by number of green cells in the 4-block (columns converging on a 1:4:6:4:1 distribution in the right-side stalagmite and corresponding histogram).
4-Blocks Two Stalagmites (see Figure 5) features the stalagmite of the 4-Blocks
Stalagmite simulation as well as the histogram of the 4-Blocks simulation. However, it additionally features a stalagmite and corresponding histogram in which the 16 possible outcomes are treated as unique classes-of-1 that are expected to occur an equal number of times. When the simulation runs, a 4-block is generated randomly and is then “cloned,” with one sibling descending down its chute in the 16-column structure and its doppelganger descending down the appropriate of the five chutes in the other structure. These simultaneous statistical analyses of a single stochastic experiment are geared to help students understand that the triangular (discrete normal) distribution is partly a result of the arbitrary decision to group the 16 events by the number of white squares in them. Namely, just as the combinations tower is a particular arrangement of the 16 possible events, so the “triangular” outcome distribution—on the right—results from stacking the 16 empirical columns on the left.

Abrahamson (2007, April). The real world as a trick question: Undergraduate statistics majors’ construction-based modeling of probability. Paper presented at the annual meeting of the American Education Research Association, Chicago, IL
10
Figure 6. Interface of the ProbLab model Histo-Blocks, built in NetLogo. In this screen-shot, the monitors express properties of the middle column for a p value of .6. The corresponding middle
column in the histogram, directly above, is equal in height to the column immediately adjacent to the right, because the properties of that column are 4 * .6 * .6 * .6 * .4 = ~.346.
Histo-Blocks (see Figure 6, above) is a unique ProbLab model in that it does not simulate
empirical experiments. Rather, the model supports an exploration of theoretical probability. The model features interlinked visualization, plotting, monitor, and control elements: a combinations tower, with each little colored square labeled with its specific probability—the user sets this probability on a slider directly below the combinations tower; a histogram of the expected distribution, were we to run this experiment empirically; and monitors depicting elements of the
Abrahamson (2007, April). The real world as a trick question: Undergraduate statistics majors’ construction-based modeling of probability. Paper presented at the annual meeting of the American Education Research Association, Chicago, IL
11
binomial function corresponding to the probability setting—the user mouse-click a column to see its calculations. See http://edrl.berkeley.edu/Histo-Blocks.shtml for an applet of Histo-Blocks.
Interview Protocol
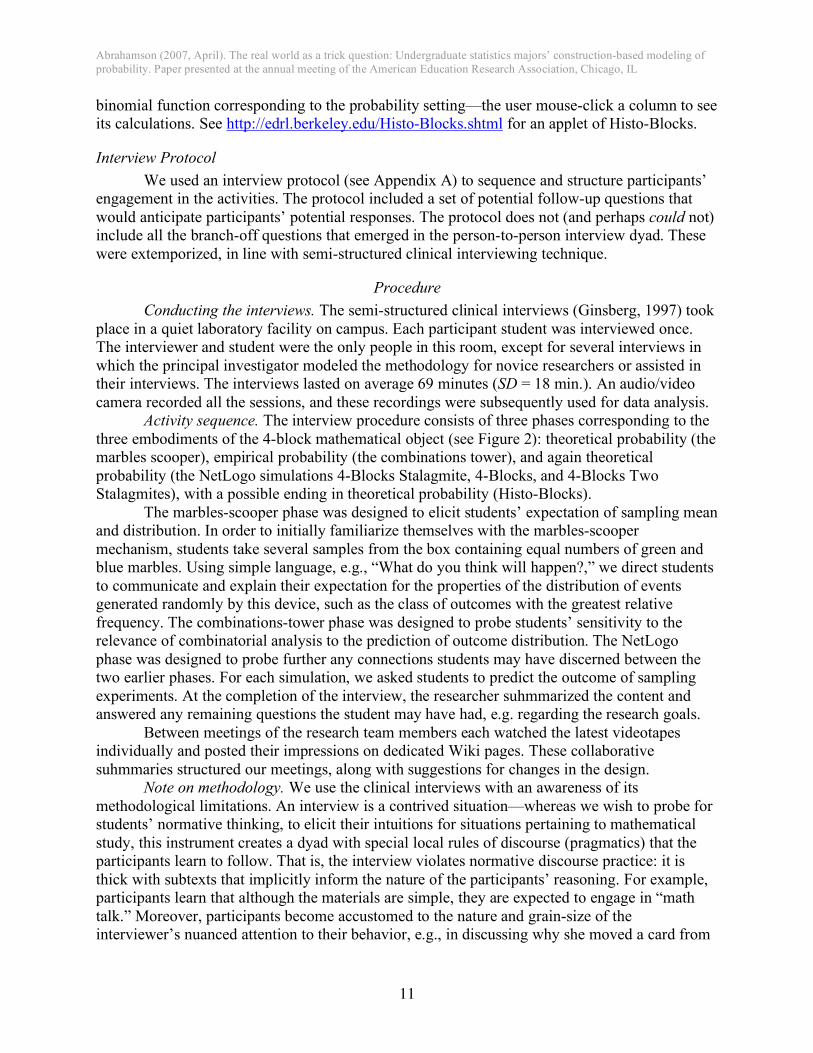
We used an interview protocol (see Appendix A) to sequence and structure participants’ engagement in the activities. The protocol included a set of potential follow-up questions that would anticipate participants’ potential responses. The protocol does not (and perhaps could not) include all the branch-off questions that emerged in the person-to-person interview dyad. These were extemporized, in line with semi-structured clinical interviewing technique.
Procedure
Conducting the interviews. The semi-structured clinical interviews (Ginsberg, 1997) took place in a quiet laboratory facility on campus. Each participant student was interviewed once. The interviewer and student were the only people in this room, except for several interviews in which the principal investigator modeled the methodology for novice researchers or assisted in their interviews. The interviews lasted on average 69 minutes (SD = 18 min.). An audio/video camera recorded all the sessions, and these recordings were subsequently used for data analysis.
Activity sequence. The interview procedure consists of three phases corresponding to the three embodiments of the 4-block mathematical object (see Figure 2): theoretical probability (the marbles scooper), empirical probability (the combinations tower), and again theoretical probability (the NetLogo simulations 4-Blocks Stalagmite, 4-Blocks, and 4-Blocks Two Stalagmites), with a possible ending in theoretical probability (Histo-Blocks).
The marbles-scooper phase was designed to elicit students’ expectation of sampling mean and distribution. In order to initially familiarize themselves with the marbles-scooper mechanism, students take several samples from the box containing equal numbers of green and blue marbles. Using simple language, e.g., “What do you think will happen?,” we direct students to communicate and explain their expectation for the properties of the distribution of events generated randomly by this device, such as the class of outcomes with the greatest relative frequency. The combinations-tower phase was designed to probe students’ sensitivity to the relevance of combinatorial analysis to the prediction of outcome distribution. The NetLogo phase was designed to probe further any connections students may have discerned between the two earlier phases. For each simulation, we asked students to predict the outcome of sampling experiments. At the completion of the interview, the researcher suhmmarized the content and answered any remaining questions the student may have had, e.g. regarding the research goals.
Between meetings of the research team members each watched the latest videotapes individually and posted their impressions on dedicated Wiki pages. These collaborative suhmmaries structured our meetings, along with suggestions for changes in the design.
Note on methodology. We use the clinical interviews with an awareness of its methodological limitations. An interview is a contrived situation—whereas we wish to probe for students’ normative thinking, to elicit their intuitions for situations pertaining to mathematical study, this instrument creates a dyad with special local rules of discourse (pragmatics) that the participants learn to follow. That is, the interview violates normative discourse practice: it is thick with subtexts that implicitly inform the nature of the participants’ reasoning. For example, participants learn that although the materials are simple, they are expected to engage in “math talk.” Moreover, participants become accustomed to the nature and grain-size of the interviewer’s nuanced attention to their behavior, e.g., in discussing why she moved a card from

Abrahamson (2007, April). The real world as a trick question: Undergraduate statistics majors’ construction-based modeling of probability. Paper presented at the annual meeting of the American Education Research Association, Chicago, IL
12
one location on the table to another. Thus, as the participants learn the rules of the interview game, they become partners in collecting the data.
The principle of the protocol-based dialogue between researcher and participant was that the participant is given as little information as possible for each activity. Over several activities, participants learned that they were to attempt to make sense of the objects and to report their thoughts. For each activity, the protocol consisted of a succession of increasingly suggestive “Socratic” questions that prompted the participant to seek connections between the activities. The rationale of this Piagetian protocol construction principle is that on the one hand we are probing for students’ capacity to generate knowledge on the basis of their spontaneous discoveries, yet on the other hand we need to steer students so that they arrive at insight milestones that inform subsequent activities. The interviewer proceeds along the succession of prompts only once s/he sense that the participant has exhausted his/her personal resources. In this sense, the interview is a concatenation of micro experiments that are conducted in one seating only due to issues of access and due to the nature of the subject mater content of probability—it requires moving between ‘theoretical’ and ‘empirical’ aspects that are interconnected and reciprocal. Fortuitously, the study’s inquiry methodology suits its pedagogical objectives. Namely, the Socratic dialogue that we use to elicit participants’ reasoning may constitute a powerful teaching/learning mechanism that could be implemented when this experimental unit is used in normative pedagogical frameworks, such as classrooms. This dual purpose of the protocol—eliciting data and building curriculum—reflects objectives of design-based research.
Iterative improvement of models: A methodological tradeoff. Design-based research studies optimally produce both better understanding of student’s cognition and better learning tools. Therefore, in the interest of creating effective learning tools, our data analysis focuses also on the artifacts—whether they facilitate the unit’s intended conceptual insights; whether our instructions were clear; whether the sequencing of the activities was conducive to beneficial learning trajectories. Specifically, we analyze students’ explicit comments on the learning tools as well as implicit aspects of their interaction with these tools so as to evaluate whether the design can be improved. Wherever we are able to locate, interpret, and articulate shortcomings of the design, we perform modifications or even create new artifacts, sometimes from one interview to the next, with the objective of maximizing resonance between the emerging theory of learning and the design. Thus, the ‘materials’ and ‘procedure’ component of our methodology are in flux, if a nuanced flux, and each successive interview is an opportunity to evaluate the modifications.
Such inconsistency may appear a methodological aberration from the perspective of classical science, since the independent factors are not held constant. However, we compensate for such inconsistency through qualitative accounts that monitor for the effects of these changes on student behavior. Moreover, the net gain in the efficacy of the design and the improved theory of learning should weigh favorably vis-à-vis the flux in the independent factors.
Data Collected
Video data include a total of close to 28 hours. Student artifacts include the green/blue cards they created in constructing the combinatorial space, any worksheets students used in solving the problems, and screen captures of selected simulation runs that occurred during the interview and were discussed. Finally, the interviewer’s field notes were compiled into electronic form. All the data were archived and shared within the research team.

Abrahamson (2007, April). The real world as a trick question: Undergraduate statistics majors’ construction-based modeling of probability. Paper presented at the annual meeting of the American Education Research Association, Chicago, IL
13
Data Analysis
Data collection and analysis spanned about one year. Employing microgenetic qualitative-analysis methods (Schoenfeld, Smith, & Arcavi, 1991; Siegler & Crowley, 1991), members of the laboratory team scrutinized the video-data in attempt to build understanding of student reasoning and determine patterns across students. From meeting to meeting, as the data came in, we each searched for episodes that illuminated the intra/inter-student comparisons and transcribed these episodes for closer analysis with subtitled clips. These selected data excerpts were then debated collectively until consensus was achieved. Thus, dimensions of comparison emerged from working in a methodological space between the general research questions (top-down) and the actual data (bottom-up), using principles of grounded theory (Glaser & Strauss, 1967). These collaboratory analysis spirals iteratively fed back into searches through the data corpus.
Results and Discussion
A major focus of this study was to investigate the capacity of mathematically trained
college students to model a very simple situated probability problem. In particular, I examined whether the students could identify a box of marbles and a scooping device as the classical ‘urn’ with a known ratio between marbles of two colors, from which samples with a fixed size are drawn. Beyond examining whether the participants could model the problem correctly, select appropriate mathematical tools, and apply those tools correctly, I was interested whether the students understood the tools they were using. In particular, I wanted to discover whether students understand how the binomial function is grounded in combinatorial analysis. The nature of the intervention was design based. Participants worked with innovative learning tools of my design, and I guided and observed these interactions both so as to elicit the participants’ understanding and difficulty and to evaluate the potential use of the under-development learning tools.
Summary of Students’ Mathematical Resources in Solving the Marbles-scooper Problem
In analyzing all the interview data, the following overview points were observed.
(a) All 24 interview participants expected that in an experiment with the marbles-scooper stochastic generator, a 4-block sample with exactly two green squares would be:
a. the mean outcome (8 participants); b. the expected value (12 participants); or c. the outcome with the highest relative frequency, with 1-green and 3-green
samples the second most frequent, and 0- and 4-green samples the least frequent (13 participants).
(b) Participants supported their estimates using: 1. Rule, Theorem: citing the Law of Large Numbers, so as to support an anticipation
of convergence (12 participants) 2. Stochastic process: describing the nature of probability experiments with
numerous samples (18 participants) 3. Spatial reasoning for understanding the stochastic process under conditions of p =
.5: evoking notions of symmetry and compensation (13 participants)

Abrahamson (2007, April). The real world as a trick question: Undergraduate statistics majors’ construction-based modeling of probability. Paper presented at the annual meeting of the American Education Research Association, Chicago, IL
14
4. Procedure: alluding to formulas that can be used as tools for computing expected frequencies, such as n*p; or pn (20 participants)
5. Concepts: referring to additional mathematical concepts, such as ‘limit’ (16 participants)
6. Heuristics: e.g., 30 trials are enough to get a normal curve (15 participants); and 7. Authority: pointing to source of strategy, e.g., “We learned it in Stats” (8
participants)
(c) Before being explicitly prompted to do so, only 4 participants employed combinatorial analysis correctly, and another 6 participants used some form of combinatorial reasoning but either they were not confident the procedure would prove helpful and so abandoned the procedure or they could not complete the procedure correctly. The rest of the participants (14) did not mention combinatorial analysis at all in any form (see below for further details and a case-study description from each of these three groups).
(d) Once they had constructed the sample space of the 4-block and assembled it in the form
of the combinations tower, all students expressed the implications of the sample space for the experimental outcomes and coordinated this expectation with their initial estimate.
In the remainder of this section I first present findings regarding the impact of the
combinations tower on students’ attention to combinatorics, then look closer at the cases of three participants, and finally offer conclusions and implications for mathematics education.
Impact of the Combinations Tower on Students’ Attention to Combinatorics
Prior to building the combinations tower, only 4 of the 24 undergraduate participants spontaneously initiated combinatorial analysis as a means to justify their claim that the most likely outcome would have 2-blue- and 2-green marbles. These participants were all well aware that attending to permutations is crucial for determining relative frequencies:
- MK, unable to recall the binomial formula, initiates a combinatorial analysis in order to determine the number of ways to get each outcome (see Case Study 1 and Appendix B).
- IL says “the mathematical reason [that 2-blue 2-green is the most likely outcome] is the most number of combinations are the ones that have 2 blue 2 green.” (His use of “combinations” should most probably be taken to mean “arrangements” or “permutations,” not actual combinations.)
- RB recognizes that there are “more configurations that are okay” for the 2-blue 2-green outcome.
- BS recognizes each specific permutation as having a 1/16 chance, and attempts (with some difficulty) to perform mental combinatorial analysis.
Once constructed, the combinations tower served these 4 students as a “hub” for making
further connections that consolidated their understanding of the mathematics of the binomial randomness generator. For example, MK recognizes the combinations tower as an instance of the binomial distribution, then, in turn, recalls the binomial formula. For BS, the construction of the sample space enables accurate calculation of the numerical probabilities of each outcome, which he had been approximated incorrectly. He says, “[The combinations tower] helps to reinforce
Abrahamson (2007, April). The real world as a trick question: Undergraduate statistics majors’ construction-based modeling of probability. Paper presented at the annual meeting of the American Education Research Association, Chicago, IL
15
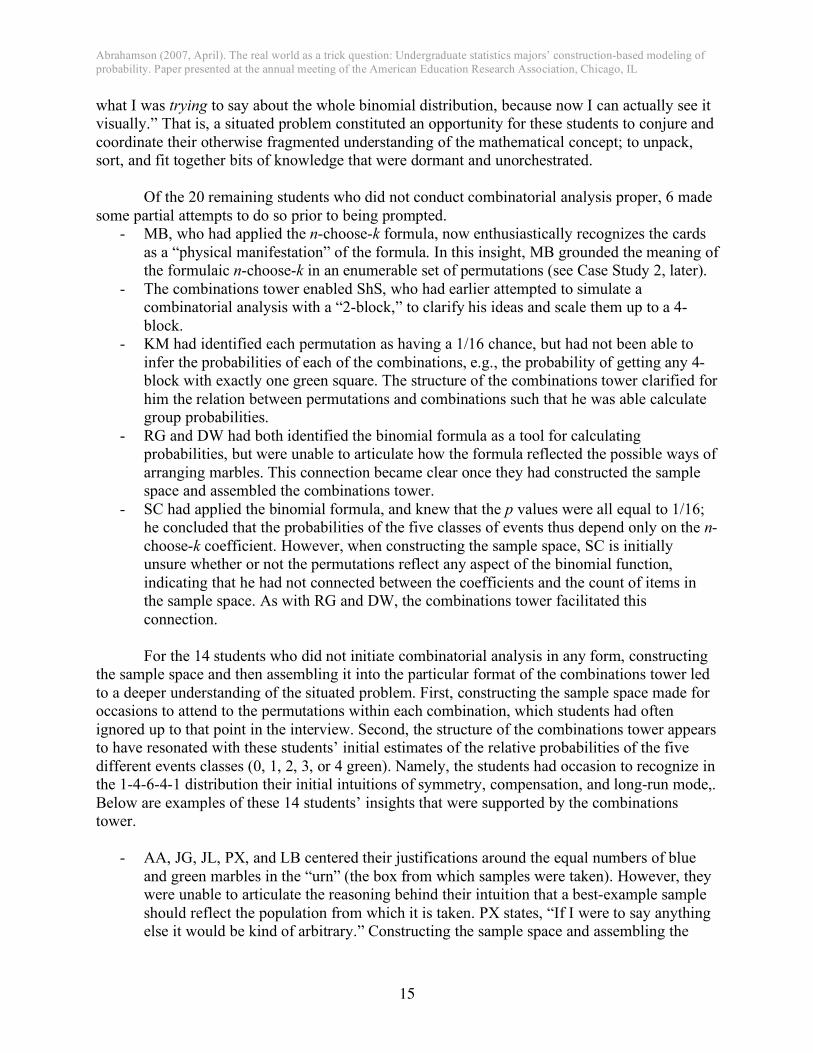
what I was trying to say about the whole binomial distribution, because now I can actually see it visually.” That is, a situated problem constituted an opportunity for these students to conjure and coordinate their otherwise fragmented understanding of the mathematical concept; to unpack, sort, and fit together bits of knowledge that were dormant and unorchestrated.
Of the 20 remaining students who did not conduct combinatorial analysis proper, 6 made some partial attempts to do so prior to being prompted.
- MB, who had applied the n-choose-k formula, now enthusiastically recognizes the cards as a “physical manifestation” of the formula. In this insight, MB grounded the meaning of the formulaic n-choose-k in an enumerable set of permutations (see Case Study 2, later).
- The combinations tower enabled ShS, who had earlier attempted to simulate a combinatorial analysis with a “2-block,” to clarify his ideas and scale them up to a 4-block.
- KM had identified each permutation as having a 1/16 chance, but had not been able to infer the probabilities of each of the combinations, e.g., the probability of getting any 4-block with exactly one green square. The structure of the combinations tower clarified for him the relation between permutations and combinations such that he was able calculate group probabilities.
- RG and DW had both identified the binomial formula as a tool for calculating probabilities, but were unable to articulate how the formula reflected the possible ways of arranging marbles. This connection became clear once they had constructed the sample space and assembled the combinations tower.
- SC had applied the binomial formula, and knew that the p values were all equal to 1/16; he concluded that the probabilities of the five classes of events thus depend only on the n-choose-k coefficient. However, when constructing the sample space, SC is initially unsure whether or not the permutations reflect any aspect of the binomial function, indicating that he had not connected between the coefficients and the count of items in the sample space. As with RG and DW, the combinations tower facilitated this connection.
For the 14 students who did not initiate combinatorial analysis in any form, constructing
the sample space and then assembling it into the particular format of the combinations tower led to a deeper understanding of the situated problem. First, constructing the sample space made for occasions to attend to the permutations within each combination, which students had often ignored up to that point in the interview. Second, the structure of the combinations tower appears to have resonated with these students’ initial estimates of the relative probabilities of the five different events classes (0, 1, 2, 3, or 4 green). Namely, the students had occasion to recognize in the 1-4-6-4-1 distribution their initial intuitions of symmetry, compensation, and long-run mode,. Below are examples of these 14 students’ insights that were supported by the combinations tower.
- AA, JG, JL, PX, and LB centered their justifications around the equal numbers of blue and green marbles in the “urn” (the box from which samples were taken). However, they were unable to articulate the reasoning behind their intuition that a best-example sample should reflect the population from which it is taken. PX states, “If I were to say anything else it would be kind of arbitrary.” Constructing the sample space and assembling the

Abrahamson (2007, April). The real world as a trick question: Undergraduate statistics majors’ construction-based modeling of probability. Paper presented at the annual meeting of the American Education Research Association, Chicago, IL
16
combinations tower gave these students analytic tools to re-express their initial intuition in mathematical procedures and vocabulary (on LB, see also Case Study 3, later).
- JH and AlF had initially identified ‘2-blue 2-green’ as the expected value, and had used the n*p formula (with n = 4, p = .5) to justify this value. Yet, through working with the sample space, these students came to realize the added value of combinatorial reasoning for predicting the outcome distribution.
- AW, GC, and AlF had determined ‘2-blue 2-green’ as the mean outcome. They justified this claim using notions of symmetry and compensation (AF describes outcomes on either side of the mean as “canceling out”) as well as stochastics (citing the Law of Large Numbers). For these students, the combinations tower pictured the mean outcome as the mode, too.
- MT was an exception in that he relied on notions of symmetry and compensation within
the context of expected values. Once he constructed the sample space, he recognized the symmetry and compensation between the various permutations, thus deepening his initial understanding of the expected value.
- LL, GZ, and JK were less inclined to use mathematical procedures specific to the problem. Instead, they used heuristics (mathematics-general solution approaches) to inform their solution. Both JK and GZ compared the problem to rolling a die (thus assuming a fast distribution), and LL invented a gambling game based on the binary number system. The construction of the sample space and the combinations tower both corrected and expanded their respective understandings, because it provided a representation of the problem at hand.
- AnF incorrectly identified each combination as equally likely (a flat distribution with 5 outcomes). He explicitly rejected attending to permutations, saying, “Intuitively, it feels less interesting.” The construction of the sample space illuminated the fundamental importance of permutations and significantly altered AnF’s understanding of the problem.
Thus, all of the 20 students, who either did not use combinatorial analysis successfully or
did not use it all, benefited from constructing the combinations tower. However, these students’ experiences differed in accord with how close these students had already been to grasping the relevance of permutations to predicting outcome patterns. For some, the combinations tower “fleshed out” the binomial formula, which they had already applied. For many others, the tower first enabled an articulation of ideas that hadn’t been accessible to them prior to participating in the construction activity. Following, we will examine a case study for each of the three identified student groups: successful combinatorics; partial combinatorics; and no combinatorics.
In suhmmary, of the 24 total participants, 4 initiated combinatorial analysis and
conducted it successfully, 6 considered using such analysis but initially could not conduct it, and
14 never considered the analysis. All 24 students availed from working with the combinations
tower.
Three Case Studies
The combinations-tower activity—constructing and assembling a sample space—created context for all of the students to deepen their understanding of probability. I now present three cases studies, one for each of the three identified groups, so as to better understand the nature of these progressions and, in particular, students’ insights before and during their work with the
Abrahamson (2007, April). The real world as a trick question: Undergraduate statistics majors’ construction-based modeling of probability. Paper presented at the annual meeting of the American Education Research Association, Chicago, IL
17
combinations tower. Recall that the group names apply to student reasoning prior to constructing and assembling the combinations tower.
Group 1—Successful Combinatorial Reasoning
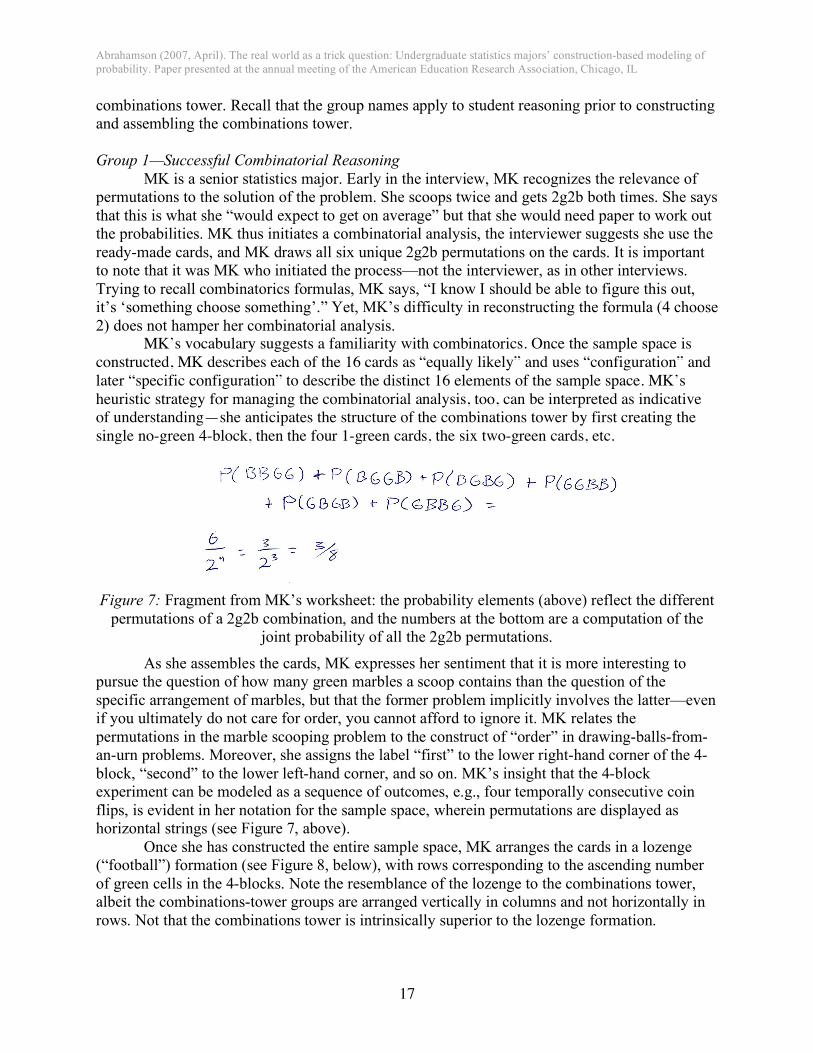
MK is a senior statistics major. Early in the interview, MK recognizes the relevance of permutations to the solution of the problem. She scoops twice and gets 2g2b both times. She says that this is what she “would expect to get on average” but that she would need paper to work out the probabilities. MK thus initiates a combinatorial analysis, the interviewer suggests she use the ready-made cards, and MK draws all six unique 2g2b permutations on the cards. It is important to note that it was MK who initiated the process—not the interviewer, as in other interviews. Trying to recall combinatorics formulas, MK says, “I know I should be able to figure this out, it’s ‘something choose something’.” Yet, MK’s difficulty in reconstructing the formula (4 choose 2) does not hamper her combinatorial analysis.
MK’s vocabulary suggests a familiarity with combinatorics. Once the sample space is
constructed, MK describes each of the 16 cards as “equally likely” and uses “configuration” and
later “specific configuration” to describe the distinct 16 elements of the sample space. MK’s
heuristic strategy for managing the combinatorial analysis, too, can be interpreted as indicative
of understanding—she anticipates the structure of the combinations tower by first creating the
single no-green 4-block, then the four 1-green cards, the six two-green cards, etc.
Figure 7: Fragment from MK’s worksheet: the probability elements (above) reflect the different permutations of a 2g2b combination, and the numbers at the bottom are a computation of the
joint probability of all the 2g2b permutations.
As she assembles the cards, MK expresses her sentiment that it is more interesting to pursue the question of how many green marbles a scoop contains than the question of the specific arrangement of marbles, but that the former problem implicitly involves the latter—even if you ultimately do not care for order, you cannot afford to ignore it. MK relates the permutations in the marble scooping problem to the construct of “order” in drawing-balls-from-an-urn problems. Moreover, she assigns the label “first” to the lower right-hand corner of the 4-block, “second” to the lower left-hand corner, and so on. MK’s insight that the 4-block experiment can be modeled as a sequence of outcomes, e.g., four temporally consecutive coin flips, is evident in her notation for the sample space, wherein permutations are displayed as horizontal strings (see Figure 7, above).
Once she has constructed the entire sample space, MK arranges the cards in a lozenge (“football”) formation (see Figure 8, below), with rows corresponding to the ascending number of green cells in the 4-blocks. Note the resemblance of the lozenge to the combinations tower, albeit the combinations-tower groups are arranged vertically in columns and not horizontally in rows. Not that the combinations tower is intrinsically superior to the lozenge formation.

Abrahamson (2007, April). The real world as a trick question: Undergraduate statistics majors’ construction-based modeling of probability. Paper presented at the annual meeting of the American Education Research Association, Chicago, IL
18
However, the combinations tower is the privileged configuration of the sample space in this design, because it appears to better enable between-group comparison.
Figure 8: MK’s lozenge formation.
Once the cards have been rearranged into the combinations tower, MK recognizes it as a
representation of a binomial distribution. She says that the combinations tower is a better way of
arranging the cards, since people have more experience working with graphs, and it is a “more
familiar metaphor.” Because MK has already utilized successful combinatorial reasoning in
solving the initial steps of the problem, the combinations tower does not enhance her conceptual
understanding of the combinatorial process. However, it does enable links to other functional
elements of probability, such as the binomial theorem and probability density histograms, which
her lozenge formation did not make so obvious. See Appendix B for a debriefing conversation with MK, once the interview protocol had been completed.
Group 2—Some Combinatorial Reasoning
MB is a junior economics major, with a minor in mathematics and much academic and
personal investment in probability.
Figure 9. Fragment from MB’s worksheet: formula “head” (on left) and “calculation” (on right).
Similar to all other participants, he initially expects a 2green–2blue outcome to be the
most frequent. Asked to warrant his guess, MB performs calculations to determine the
probabilities of the five classes of 4-block events (see Figure 9, above; see Figure 10, below, for
the full worksheet). The interviewer holds up a scooped sample (as in Figure 2a) and asks MB
whether there could be any benefit to thinking of outcomes in terms of permutations, not only
combinations. As the interview ensues, MB’s responses change from initial repudiation of
drawings as simplistic and unhelpful to an eventual appreciation of their relevance.

Abrahamson (2007, April). The real world as a trick question: Undergraduate statistics majors’ construction-based modeling of probability. Paper presented at the annual meeting of the American Education Research Association, Chicago, IL
19
Figure 10. MB’s completed worksheet, with formulas (above) and, later, drawings (below). The dotted region is enlarged in the previous figure.
Coordinating formulas and drawings helped MB re-ground the meaning of the binomial.
MB’s evaluation of the relevance of his drawings to understanding the problem appears to be contingent on having first realized that the drawings express elements of pertinent algebraic statements. He later comments that such drawings should be important for younger students first learning the material. Group 3—No Combinatorial Reasoning. LB is a graduate student in biophysics and statistical biology. The interviewer asks LB
what her “best guess” would be for a single random scoop. Note, in the following how she offers
an initial correct guess, then changes her mind when trying to warrant the guess, then—
supported by the combinations tower—eventually returns to the original guess, this time
warranting the guess.
Initially, LB replies: “Two of one color and two of the other color... I mean, yeahh...
You’d expect that the most... the most common is, I think, the one that represents the
distribution.”
Then she hesitates, and adds, “My first intuition is to say half and half—so two [blue]
balls and two green balls—and their position here [in the marbles scooper] doesn’t
matter—I don’t care about that.
She then muses, “Is 1 blue and 3 green equally likely?”
Interviewer: “As what?”
LB: “As... I mean, 1 green and 3 blue is equally likely as 1 green and 3 blue, because
there is no preference for one color, obviously. But it seems like 2 and 2 should be the
one that is most common. Even though when I drew... When I drew, it seemed like I
got 3-and-1 more often than 2-and-2.”
20:19 [The interviewer prompts MB to consider working with
diagrams] “… I don’t see any particular benefit, in this situation specifically, [for] thinking of it in this way [drawing]
as opposed to thinking of it in this way [formulas]”
27:42 [Once MB has constructed the combinations tower, he is
still confused as to what it represents. Then:] “...[I]t took me a
while to realize that what I was doing here [drawing] was a
physical manifestation of this [formulas], and actually now I
am even more-so realizing that….these coefficients [in formula
calculation] especially—they reflect the layout of the thing
[drawings].”
1:12:38 [In the post-interview reflection] “I think in terms of
this now [formulas].... and that's potentially a problem….I
thought in terms of the combinatorics—I didn't even think that
the combinatorics were reflecting the individual outcomes
themselves. And after that, I came to that little realization for a
second… I’m, like, hey!, These “choose” numbers are
representing these [drawings]! It was, like, of course it is—it's
really intuitive, but I didn't think about that before.”

Abrahamson (2007, April). The real world as a trick question: Undergraduate statistics majors’ construction-based modeling of probability. Paper presented at the annual meeting of the American Education Research Association, Chicago, IL
20
Int. asks her to say more about her intuition that 2g2b would be the most likely, and LB
says: ”It seems like the draws that are most probable should reflect the actual
distribution of the balls.”
Next, LB goes down the following garden path. She collapses 3g1b and 3b1g, and
determines that it is more likely to get a 4-block with either 3 of the same color
(“abstracted over color”) than to get 2g2b (correct statement).
LB then states that this logical conclusion contradicts her intuition that 2g2b should be
the most likely event. Possibly, as a means of resolving this apparent conflict, LB
concludes that all combinations are equally likely. “Each time I draw, I have a half-
chance to get a blue and half chance to get a green [each specific combination has a
(1/2)4 chance ]. So it seems like... Now, even though my intuition was first that the
half...that 2 blue and 2 green would be equally likely, if I actually do the calculation,
it seems like any choice would be just as...It doesn’t seem like there’s a preference for
any choice, really. Because what...”
LB then states that all specific outcomes are equally likely. She systematically ignores the
combinatorics—that there may be more ways to arrange some given combination
than another. It is clear that she is aware of permutations, because twice she refers to
the different arrangements of a combination. Yet either she states that these
permutations are irrelevant to the problem or just ignores these permutations.
When LB begins creating the sample space and has created two cards, she remarks,
“Some of them are really... seems like they’re not... OK, I guess I’ll draw all of them.
Because there are many that... where the orientation, I guess, seems like it shouldn’t...
Oh, actually there are more. Ok, I see now that there are more... Like even though this
is as equally likely as this [two different permutations of the same combination, the 1-
green], this [the 1-green group] is going to be more likely just because it has more
configurations [as compared to another group with less permutations, the 0-green that
has just one item].”
LB says she now realizes that her initial intuition had been correct; that she had been
confused, because she had “abstracted over color,” clumping 3g1b with 3b1g. She
says that the 2g2b group reflects the distribution. Then she changes her mind, saying,
“It’s not the one that reflects the distribution, it’s just the one that appears the most.”
Later, LB explains her earlier difficulty as resulting from an incapacity to imagine the
sample space “in her head.” She takes back her claim that the most common outcome
should represent the distribution, implying that the overall distribution, and not just
one sample, gives us the p value. “It is not because you have half-and-half balls [in
the box] that you are more likely to get half-and-half balls into the scoop. But on the
average you do.” She is abstracting over color. LB says that only due to drawing the
sample space could she clarify the issues. She says that if she wanted to explain this
to someone else who did not understand probability, she would not use words but
would just draw the picture.
I have presented three case studies of undergraduate and graduate students, all enrolled in
mathematics-focused programs, who analyzed a simple stochastics generator consisting of an urn and sampling device. Each student brought different mathematical knowledge to bear on the problem, and each following an idiosyncratic learning path, yet all appear to have availed of

Abrahamson (2007, April). The real world as a trick question: Undergraduate statistics majors’ construction-based modeling of probability. Paper presented at the annual meeting of the American Education Research Association, Chicago, IL
21
working with the sample space and in particular of assembling the space in the form of the combinations tower.
Conclusions
Building and using a sample space to deduce outcome frequencies requires attention to
the distinct identity of outcomes that belong to the same class according to some perspective, i.e., the permutations on each combination. To the elementary- and middle-school students, and to many undergraduate mathematics-related majors, the order of outcomes in the events is initially irrelevant to the prediction, because the prediction is intuitive and not analytic. That is, the order of outcomes appears irrelevant to students, because they are attempting to predict the frequency of a phenomenon, e.g., “getting 2 green and 3 blue,” yet they do not construe this phenomenon as a class of events, i.e., as made up of a finite number of permutations on a combination. Thus, it appears, an analysis of order is necessary to warrant an intuition that ignores order. The order of outcomes becomes relevant and thus salient only once a learner is guided to conduct combinatorial analysis. It is such relevancy that the explored intervention is attempting to support (see Abrahamson, under revision, for a discussion of the challenge of making permutations visible to learners).
The tools and facilitation used in this study supported students’ discovery-based learning that would possibly not have occurred outside of this designed environment. In particular, the availability of tools for conducting combinatorial analysis as well as the interviewer’s explicit request that participants engage in analysis and subsequent support in conducting this analysis enabled five-sixths of the undergraduate and gradate students, who initially did not use combinatorial analysis successfully or at all in solving a situated probability problem, to produce the sample space and then apprehend this space as an object resonating with their initial intuition regarding the expected outcome frequencies—an intuition which had been correct yet unwarranted. For the other sixth of the students, who had initiated attention to the combinatorics underlying the expected frequencies, the combinations tower afforded an opportunity to braid together a deeper understanding of probability.
In sum, despite several prompts, most students’ explanations were couched as descriptions of empirical probability—projected experiments with the stochastic device—and these were supported by mathematical rules, solution procedures, imagistic heuristics, and concepts. However, combinatorial analysis, the underlying rationale of theoretical probability, does not appear to be prominent in college students’ repertory of spontaneous resources. Note that these mathematically sophisticated students are evidently familiar with the idea of combinatorics, because once asked to build the combinatorial space, they eventually recognize the nature of the activity as “combinatorics.” Our earlier study (Abrahamson & Cendak, 2006) demonstrated that Grade 4-6 students’ probabilistic intuitions pertain to empirical-, not theoretical- probability. It appears that despite a growing mathematical sophistication, students’ intuitions do not change from “grade to grad.”
Implications for Mathematics Education
This study demonstrates the educational benefit of student engagement with “hands-on” modeling-based learning activities, beyond middle school and into undergraduate courses. Specifically, participants’ increased capacity, during the interview sessions, to connect the “real world” with the “real math” when using hybrid mathematical representations of their own

Abrahamson (2007, April). The real world as a trick question: Undergraduate statistics majors’ construction-based modeling of probability. Paper presented at the annual meeting of the American Education Research Association, Chicago, IL
22
construction (such that include both iconic/descriptive and symbolic/arbitrary elements) suggest the potential contribution of these representations to all students’ mathematical sense making. Furthermore, students’ affective inhibitions toward construction-based mathematical inquiry appears, at least in part, to result from the students’ initial incapacity to relate between the suggested constructions and the stated mathematical problem, as though the “real world” and the “real math” were too disparate for students to bridge the phenomenal gap. These cognitive and affective factors at play in inhibiting student mathematical reasoning suggest, in turn, that students may avail of hybrid representations that could help them bridge the iconic–symbolic fault. Thus, designers of learning environment may need frameworks that delineate principled methodology for constructing such hybrid representations. Elsewhere (Abrahamson, 2004), I have introduced the construct bridging tools that attempts to formulate the cognitive advantages of such hybrid tools, and I have been developing a design framework that attempts to support insight through engaging with these tools (Abrahamson & Wilensky, 2007). This type of learning tools is related to but not quite the same as Clement’s (1993) ‘bridging analogies,’ Case’s (1996) ‘bridging context,’ or Lesh and Doerr’s (2003) modeling activities Affective Disposition Toward Modeling/Construction-Based Mathematical Inquiry
For all students, hands-on activities were conducive to insight into the focal concepts. Yet, whereas young students’ conception of mathematical practice is an integrated learning-through-doing, older students demonstrate a decoupled view of “the real world” and “the real math”; students progressively deprecate the utility of “the real world” for learning “the real math.” Thus, over their K – 16 schooling experience, students’ disposition toward modeling develops from feeling that modeling is the “real thing” (and inscriptions are derivations thereof) to feeling that inscriptions are the “real thing” and models are trivializations thereof. That is, with their meta-cognitive and “school-wise” development, students come to regard their intuitive/experiential and formal knowledge as separate resources, as though the former constitutes a possible impediment to “really learning.” Moreover, students become reluctant to construct knowledge, because they grow wary both of their own capacity to deeply understand the material and of the prospective utility of such deep understanding. Finally, students in traditional learning environments who have experienced the power of modeling may nevertheless repudiate this approach, because they do not receive immediate rewards within the extant assessment scheme (see Freire, 1973, on 'banking'). The above analysis implies that construction-based modeling should be sustained through secondary and post-secondary education. Finally, an open pedagogical question raised by this study pertains to the advantage, for students, of sustaining a grounding of mathematical ideas once they have already proceduralized these ideas. Yet what might be criteria for setting appropriate standards? Need users of the Pythagorean Theorem always be prepared to prove it?
If You Build It, Will They Come?–A Reflection on Design and Learning
The 4-Block randomness generator was designed specifically so as to make permutations a salient property of experimental outcomes. The rationale was that making permutations salient would facilitate students’ connecting between the sample space, where permutations are intrinsic and hence marked, and experimental outcomes, where permutations are non determinable for traditional randomness generators such as coins and dice (one cannot see HHTH when one observes 4 coins that have been tossed on a desk). Having designed for salient permutations, I expected that students would be likely, in this experiment, to initiate combinatorial analysis as a

Abrahamson (2007, April). The real world as a trick question: Undergraduate statistics majors’ construction-based modeling of probability. Paper presented at the annual meeting of the American Education Research Association, Chicago, IL
23
means of warranting their intuitive claims. And yet, by and large most students either ignored the permutations or hesitated to judge the permutations as relevant to analytic process. Perhaps even in the case of structurally ordinal randomness devices, such as slot machines—“give away” situations in probability quizzes—students would not apprehend and heed the sequentiality in the physical contiguity of independent devices. The implication for design is that learning tools do not necessarily bespeak their affordances—these need to be revealed and appropriated (see Pratt, Jones, & Prodromou, 2006, on potential affordances vs. realised affordances; see Verillon & Rabardel, 1995, 'instrumental genesis'). This is certainly not to mitigate the role of cognition-based object design. On the contrary, this is to re-alert designers and education practitioners to the disparity between the conceptual schemes of those who are in the know and those who are not yet in the know; to express this conceptual disparity in terms of mental construction of a learning tool; and to highlight the roles of facilitators in the learning process and characterize this role as helping learners develop concept-specific vision (see Goodwin, 1994, on 'professional vision'; see Stevens & Hall, 1998, on 'disciplined perception'). If you build it, still you need to help them come.
Acknowledgements
For their insights into the data, I wish to thank members of the Embodied Design Research Laboratory at the University of California–Berkeley’s Graduate School of Education (http://edrl.berkeley.edu/), and especially students participating in the Undergraduate Research Apprenticeship Program—Michael Bryant, Rose Cendak, Cindy del Rosario, and Josephine Relaford-Doyle—who also assisted greatly in collecting, analyzing, and interpreting the data. For more insights, thanks to members of UC Berkeley’s Gesture Group (Eve Sweetser, Director). Thank you Paulo Blikstein and Josh Unterman, members of the Center for Connected Learning and Computer-Based Modeling at Northwestern University (Uri Wilensky, Director), for help with constructing materials for the study. This study was conducted under a National Academy of Education/Spencer Postdoctoral fellowship 2005-6 and supported by a UC Berkeley Junior Faculty Research Grant for the project The Real World as a Trick Question: Mathematical
Modeling, Knowledge, and Assessment. Thank you to faculty members of UC Berkeley’s Statistics department for facilitating student recruitment. I am grateful to three anonymous reviewers for the Annual Conference of the American Educational Research Association, Division C: Section 3. Finally, I thank all the University of California—Berkeley students who participated in the interviews reported in this study.
References
Abrahamson, D. (2004). Keeping meaning in proportion: The multiplication table as a case of
pedagogical bridging tools. Unpublished doctoral dissertation. Northwestern University,
Evanston, IL.
Abrahamson, D. (2006a). “Because in the world, there are more blocks of this type”: The real-
worldness of immersive combinatorial analysis as a grounding of simulated probability
experiments. In D. Abrahamson (org.), What’s a situation in situated cognition? – A
constructionist critique of authentic inquiry. In S. Barab, K. Hay & D. Hickey (Eds.),
Proceedings of the Seventh International Conference of the Learning Sciences.
Bloomington, IN: ICLS.
Abrahamson, D. (2006b). Bottom-up stats: Toward an agent-based “unified” probability and
statistics. In D. Abrahamson (Org.), U. Wilensky (Chair), and M. Eisenberg (Discussant),
Small steps for agents… giant steps for students?: Learning with agent-based models.
Abrahamson (2007, April). The real world as a trick question: Undergraduate statistics majors’ construction-based modeling of probability. Paper presented at the annual meeting of the American Education Research Association, Chicago, IL
24
Paper presented at the Symposium conducted at the annual meeting of the American
Educational Research Association, San Francisco, CA.
Abrahamson, D. (2006c). Learning chance: Lessons from a learning-axis and bridging-tools
perspective. In A. Rossman & B. Chance (Eds.), Proceedings of the Seventh
International Conference on Teaching of Statistics. Salvador, Bahia, Brazil.
Abrahamson, D. (2006d). Mathematical representations as conceptual composites: Implications
for design. In S. Alatorre, C. J. L, M. Sáiz & A. Méndez (Eds.), Proceedings of the
Twenty Eighth Annual Meeting of the North American Chapter of the International
Group for the Psychology of Mathematics Education: Universidad Pedagógica Nacional.
Abrahamson, D. (2006e). The shape of things to come: The computational pictograph as a bridge
from combinatorial space to outcome distribution International Journal of Computers for
Mathematical Learning, 11(1), 137-146.
Abrahamson, D. (under revision). Counter-intuitive judgment: Developing understanding of
probability through coordinating sample spaces of stochastic devices and distributions of
their actual experimental outcomes. Cognition and Instruction.
Abrahamson, D., Blikstein, P., Lamberty, K. K., & Wilensky, U. (2005). Mixed-media learning
environments. In M. Eisenberg & A. Eisenberg (Eds.), Proceedings of the Fourth
International Conference for Interaction Design and Children, Boulder, Colorado.
Abrahamson, D., & Cendak, R. M. (2006). The odds of understanding the Law of Large
Numbers: A design for grounding intuitive probability in combinatorial analysis. In J.
Novotná, H. Moraová, M. Krátká & N. Stehlíková (Eds.), Proceedings of the Thirtieth
Conference of the International Group for the Psychology of Mathematics Education.
(Vol. 2, pp. 1-8). Charles University, Prague: PME.
Abrahamson, D., Janusz, R., & Wilensky, U. (2006). There once was a 9-Block... -- A middle-
school design for probability and statistics [Electronic Version]. Journal of Statistics
Education, 14(1) from http://www.amstat.org/publications/jse/v14n1/abrahamson.html.
Abrahamson, D., & Wilensky, U. (2002). ProbLab. Northwestern University, Evanston, IL: The
Center for Connected Learning and Computer-Based Modeling, Northwestern University.
http://ccl.northwestern.edu/curriculum/ProbLab/.
Abrahamson, D., & Wilensky, U. (2003). The quest of the bell curve: A constructionist approach
to learning statistics through designing computer-based probability experiments. In M.
Allessandra, B. C., R. Biehler, M. Henry & D. Pratt (Eds.), Third Conference of the
European Society for Research in Mathematics Education. Balleria, Italy.
Abrahamson, D., & Wilensky, U. (2004a). ProbLab: A computer-supported unit in probability
and statistics. In M. J. Høines & A. B. Fuglestad (Eds.), Proceedings of the 28th Annual
Meeting of the International Group for the Psychology of Mathematics Education Vol. 1
(pp. 369). Bergen, Norway: PME.
Abrahamson, D., & Wilensky, U. (2004b). S.A.M.P.L.E.R.: Collaborative interactive computer-
based statistics learning environment. Paper presented at the 10th International Congress
on Mathematical Education, Copenhagen, Denmark.
Abrahamson, D., & Wilensky, U. (2004c). S.A.M.P.L.E.R.: Statistics As Multi-Participant
Learning-Environment Resource. Paper presented at the annual meeting of the American
Educational Research Association, San Diego, CA.
Abrahamson, D., & Wilensky, U. (2005a). Collaboration and equity in classroom activities
using Statistics As Multi-Participant Learning-Environment Resource (S.A.M.P.L.E.R.).
In W. Stroup & U. Wilensky (Chairs), C. D. Lee (Discussant), Patterns in group learning

Abrahamson (2007, April). The real world as a trick question: Undergraduate statistics majors’ construction-based modeling of probability. Paper presented at the annual meeting of the American Education Research Association, Chicago, IL
25
with next-generation network technology. Paper presented at the annual meeting of the
American Educational Research Association, Montreal, Canada.
Abrahamson, D., & Wilensky, U. (2005b). ProbLab goes to school: Design, teaching, and
learning of probability with multi-agent interactive computer models. In D. Pratt, R.
Biehler, M. B. Ottaviani & M. Meletiou (Eds.), Proceedings of the Fourth Conference of
the European Society for Research in Mathematics Education. San Feliu de Gixols,
Spain.
Abrahamson, D., & Wilensky, U. (2005c). The stratified learning zone: Examining
collaborative-learning design in demographically diverse mathematics classrooms. In D.
Y. White (Chair) & E. H. Gutstein (Discussant), Equity and diversity studies in
mathematics learning and instruction. Paper presented at the annual meeting of the
American Educational Research Association, Montreal, Canada.
Abrahamson, D., & Wilensky, U. (2005d). Understanding chance: From student voice to
learning supports in a design experiment in the domain of probability. In G. M. Lloyd, M.
Wilson, J. L. M. Wilkins & S. L. Behm (Eds.), 27th Annual Meeting of the North
American Chapter of the International Group for the Psychology of Mathematics
Education. Roanoke, VA: PME-NA.
Abrahamson, D., & Wilensky, U. (2006). ProbLab: An experimental unit on probability and
statistics. Manuscript in preparation.
Abrahamson, D., & Wilensky, U. (2007). Learning axes and bridging tools in a technology-
based design for statistics. International Journal of Computers for Mathematical
Learning, 12(1), pp. pending.
Brown, A. (1992). Design experiments: Theoretical and methodological challenges in creating
complex interventions in classroom settings. Journal of the Learning Sciences, 2(2), 141-
178.
Case, R., & Okamoto, Y. (1996). The role of central conceptual structures in the development of
children's thought. In Monographs of the society for research in child development:
Serial No. 246 (Vol. 61). Chicago: University of Chicago Press.
Clement, J. (1993). Using bridging analogies and anchoring intuitions to deal with students'
preconceptions in physics. Journal of Research in Science Teaching, 30(10), 1241-1257.
Cobb, P., & Bauersfeld, H. (Eds.). (1995). The emergence of mathematical meaning: Interaction
in classroom cultures. Hillsdale, NJ: Lawrence Erlbaum.
Cobb, P., Confrey, J., diSessa, A., Lehrer, R., & Schauble, L. (2003). Design experiments in
educational research. Educational Researcher, 32(1), 9-13.
Collins, A. (1992). Towards a design science of education. In E. Scanlon & T. O'shea (Eds.),
New directions in educational technology (pp. 15-22). Berlin: Springer.
Edelson, D. C. (2002). Design research: What we learn when we engage in design Journal of the
Learning Sciences, 11(1).
Freudenthal, H. (1986). Didactical phenomenology of mathematical structure. Dordrecht, The
Netherlands: Kluwer Academic Publishers.
Fuson, K. C., & Abrahamson, D. (2005). Understanding ratio and proportion as an example of
the Apprehending Zone and Conceptual-Phase problem-solving models. In J. Campbell
(Ed.), Handbook of mathematical cognition (pp. 213-234). New York: Psychology Press.
Ginsburg, H. P. (1997). Entering the child’s mind. New York: Cambridge University Press.
Glaser, B. G., & Strauss, A. L. (1967). The discovery of grounded theory: Strategies for
qualitative research. Chicago: Aldine Publishing Company.

Abrahamson (2007, April). The real world as a trick question: Undergraduate statistics majors’ construction-based modeling of probability. Paper presented at the annual meeting of the American Education Research Association, Chicago, IL
26
Goodwin, C. (1994). Professional vision. American Anthropologist, 96(3), 603-633.
Greeno, J. G. (1998). The situativity of knowing, learning, and research. American Psychologist,
53(1), 5-26.
Hacking, I. (1975). The emergence of probability. Cambridge, U.K.: Cambridge University
Press.
Jones, G. A., Langrall, C. W., & Mooney, E. S. (2007). Research in probabilty: Responding to
classroom realities. In D. A. Grouws (Ed.), Handbook of Research on mathematics
teaching and learning (pp. 909 - 955). Charlotte, NC: Information Age Publishing.
Lesh, R., & Doerr, H. M. (2003). Beyond constructivism: Models and modeling perspectives on
mathematics teaching, learning, and problem solving. Mahwah, NJ: Lawrence Erlbaum
Associates.
Liu, Y., & Thompson, P. (2002). Randomness: Rethinking the foundation of probability. In D.
Mewborn, P. Sztajn, E. White, H. Wiegel, R. Bryant & K. Nooney (Eds.), Proceedings of
the Twenty Fourth Annual Meeting of the North American Chapter of the International
Group for the Psychology of Mathematics Education, Athens, GA (Vol. 3, pp. 1331–
1334). Columbus, OH: Eric Clearing House.
Maher, C. A., Speiser, R., Friel, S., & Konold, C. (1998). Learning to reason probabilistically. In
Proceedings of the twentieth annual conference of the North American group for the
Psychology of Mathematics Education (pp. 82–87). Columbus, OH: Eric Clearinghouse
for Science, Mathematics, and Environmental Education.
Metz, K. E. (1998). Emergent understanding and attribution of randomness: Comparative
analysis of the reasoning of primary grade children and undergraduates. Cognition and
Instruction, 16(3), 285-365.
National-Center-for-Education-Statistics. (2004). Nation's Report Card. from
http://nces.ed.gov/nationsreportcard/itmrls (Accessed March 23, 2004)
National-Council-of-Teachers-of-Mathematics. (2004). Principles and standards for school
mathematics: Data analysis and probability. from
http://standards.nctm.org/document/chapter3/data.htm (Accessed August 1, 2006)
Papert, S. (1991). Situating constructionism. In I. Harel & S. Papert (Eds.), Constructionism (pp.
1-12). Norwood, NJ: Ablex Publishing.
Pratt, D. (2000). Making sense of the total of two dice. Journal for Research in Mathematics
Education, 31(5), 602–625.
Pratt, D., Jones, I., & Prodromou, T. (2006). An elaboration of the design construct of
phenomenalisation. Paper presented at the Seventh International Conference on Teaching
Statistics, Salvador, Bahia, Brazil, July 2-7, 2006.
Schoenfeld, A. H., Smith, J. P., & Arcavi, A. (1991). Learning: The mircrogenetic analysis of
one student’s evolving understanding of a complex subject matter domain. In R. Glaser
(Ed.), Advances in instructional psychology (pp. 55-175). Hillsdale, NJ: Erlbaum.
Shaughnessy, M. (1992). Research in probability and statistics: Reflections and directions. In D.
A. Grouws (Ed.), Handbook of Research on Mathematics Teaching and Learning (pp.
465–494). New York: Macmillan.
Shulman, L. S. (1986). Those who understand: Knowledge growth in teaching. Educational
Researcher, 15(2), 4-14.
Siegler, R. S., & Crowley, K. (1991). The microgenetic method: a direct means for studying
cognitive development. American Psychologist, 46(6), 606-620.
Abrahamson (2007, April). The real world as a trick question: Undergraduate statistics majors’ construction-based modeling of probability. Paper presented at the annual meeting of the American Education Research Association, Chicago, IL
27
Stevens, R., & Hall, R. (1998). Disciplined perception: Learning to see in technoscience. In M.
Lampert & M. L. Blunk (Eds.), Talking mathematics in school: Studies of teaching and
learning (pp. 107-149 ). New York: Cambridge University Press.
Tversky, A., & Kahneman, D. (1974). Judgment under uncertainty: Heuristics and biases.
Science, 185(4157), 1124-1131.
Verillon, P., & Rabardel, P. (1995). Cognition and artifacts: A contribution to the study of
thought in relation to instrumented activity. European Journal of Psychology of
Education, 10(1), 77-101.
von Glasersfeld, E. (1987). Learning as a constructive activity. In C. Janvier (Ed.), Problems of
representation in the teaching and learning of mathematics (pp. 3-18). Hillsdale, NJ:
Lawrence Erlbaum.
von Mises, R. (1957). Probability, statistics, and truth (H. Geiringer, Trans.). New York: Dover
Publications Inc.
Wilensky, U. (1993). Connected mathematics—Building concrete relationships with
mathematical knowledge Unpublished manuscript, Cambridge, MA: M.I.T.
Wilensky, U. (1997). What is normal anyway?: Therapy for epistemological anxiety.
Educational Studies in Mathematics, 33(2), 171-202.
Wilensky, U. (1999). NetLogo. Northwestern University, Evanston, IL: The Center for
Connected Learning and Computer-Based Modeling http://ccl.northwestern.edu/netlogo/.
Wilensky, U., & Stroup, W. (1999). HubNet. Evanston, IL: The Center for Connected Learning
and Computer-Based Modeling, Northwestern University.

Abrahamson (2007, April). The real world as a trick question: Undergraduate statistics majors’ construction-based modeling of probability. Paper presented at the annual meeting of the American Education Research Association, Chicago, IL
28
Appendix A—Seeing Chance Semi-Clinical Interview Protocol3
What We Say/Do Why We/Do This Possible
Responses Follow Ups
Hi, we’re from _____ (name
of university).
First of all, thanks for
agreeing to take part in this
study. I hope you’ll find it
interesting. We’d like to get
your help to understand how
students think about our stuff. We’re going to be
asking you some questions,
but remember there are no
right or wrong answers. We
just want to hear what you
have to say about these
things. We’ll be glad to
answer any questions you
have now or later.
Introduce ourselves My mother works
at ___ (name of
university) etc.
Do you know so-
and-so?
Cool, Go ____ (name of
university team)!
You’ll notice we’re using a
camera to video-tape this
session. We use it because
we don’t want to miss anything you say. If at
anytime you wish not to be
recorded, please let us know
and we’ll turn off the camera.
Also, please feel free to use
any of the items on the table
at any time to help you to
explain or to think about
things.
Make students comfortable;
Let them understand their
rights as volunteer
participants.
Let students know it’s fine to
touch and use materials:
paper, crayons, pennies, dice,
etc.
Will I be on TV? Probably not, but lots of
professors will see you,
maybe in some far-away
countries!
[Show bin with marbles]
What do you see in here?
What do you think we’re
going to do with this?
Gauge initial reactions to the
instruments. Specifically,
evaluate the obviousness of
the design. What “goes
without saying?” What aspect is abstruse?
A lot of marbles.
How many marbles
are there in the
box?’ Are there
more greens than blues? How do you
know?; How much
did this
cost?/Where did
you buy this?;
Count them
Use the marbles
with the ‘scooper’
Fill holes with
marbles
Why is that important to
you? How many marbles do
you think there are? Why do
you think that?
Can you show me?
Do you want to show me?
3 This is the original protocol used in the earlier Grade 4 – 6 study. The college-level protocol
varies only to make it more age appropriate, but the activity sequence was kept intact.

Abrahamson (2007, April). The real world as a trick question: Undergraduate statistics majors’ construction-based modeling of probability. Paper presented at the annual meeting of the American Education Research Association, Chicago, IL
29
[Show the marbles scooper]
What do you think this is?
Have you ever seen anything
like this? What does it
remind you of? Guess what
we’re going to do with it.
Ditto Golf club. It’s like
a lottery; It’s fair,
because there is an
even number of
holes; where did
you buy this/how did you make this?
Are we going to
put marbles in the
holes?
How do you know that?
What do you mean? Can you
show me that? Would you
like to try it? If that were
true, would it matter?
How should we call this?
I’m about to dip [the
scooper] in here—what do
you think will happen? I’ll
make sure that each of the
slots gets its own marble and
I’ll let any extras spill out.
((optional questions: How
likely is it/What is the prob. that a certain slot will get a
blue marble? How about a
green marble? What about a
different slot? [Don’t imply
importance of location if
student has not yet attended
to this.]))
What do you think about this
pattern we just got? Do you
like this pattern? What can
you say about it?
Delineate details, elicit
clarifications, establish
common vocabulary
(‘pattern’ ‘arrangement’
‘combination’ ‘order’
‘hole/slot’; repeat; etc.).
See if students understand
that these are practically
“independent” events—like flipping 4 coins. See if
students think some patterns
are more likely than others
and elicit their reasoning for
this.
Marbles will go
into the slots;
you’ll get such and
such a pattern.
Patterns will be
different each time.
You have to mix
them first.
You can’t look while you’re doing
it.
How many green
marbles are there?
That’s interesting—why do
you think that?
Is it possible to get
something else? Ever?
Sometimes? Are some
patterns more rare than other
patterns? Why so?
Why?
What would/could happen if
we looked while we did it?
[Maybe get a cloth to cover
bin while scooping]
Is it important to know the
total number of marbles to
figure this out? What if
didn’t know – what would
we do?
Let student try it out about 5
times
Can you describe what we
have?
If they get an arrangement
that is a rotation of a
previous one—Is this the
same as before?
If they get all or no green—
what do you think about
getting all of one color?
How about getting just one
blue in the top-left corner and all the rest green–is that as
rare as getting all green?
Are students attending to the
specific arrangement of the colors. What seems to be the
default way of seeing and
describing the sample: in
terms of the pattern?; the
number of green and blue
squares irrespective of the
pattern? If they attend to the
number of green, do they
realize that some classes
(e.g., “1-green”) are smaller
than others?; ‘rarer’ than others? Do they have any
sense why this is so? ((We
have to be careful not to give
away that we care for
different arrangements, but
we do want to exhaust the
possibility that students
actually are attending to the
arrangements.))
It is equally likely
to get 1 green, 2
green, 3 green, or 4
green.
There are different
chances
What if we specify a top to
the scooper?
If no, why is this one
different?

Abrahamson (2007, April). The real world as a trick question: Undergraduate statistics majors’ construction-based modeling of probability. Paper presented at the annual meeting of the American Education Research Association, Chicago, IL
30
Do you think you’ll get that
again? Ever? Do any
[patterns] repeat from scoop
to scoop?
((optional – might be too
confusing/time-consuming If
this slot has a green, do you
have any sense whether the
slot next to it to has a green
or a blue?))
See what students feel is
predictable.
Yes/No
We’ll get 2G, 2B more often than
other
arrangements.
We’ll get
something different
each time.
When? Now? Later? How
are you so sure. Maybe we’ll
never get it?
That’s interesting. Now, how could we be sure this is
true?
Do you mean that if we keep
scooping it will be different
each time?–always? [if not:]
So how many times can we
keep scooping without
getting repeats?
Before a particular scoop–
How many greens do you think you’ll get this time?
When enough context has
been built: Can we know
what will happen each time
we scoop?; Is there anything
we can say about what
happens if we scoop many
times, like, 100 times?
See where students are
between ‘no idea’ and ‘best guess’.
No way to know.
Can’t know exactly
what we will get.
It’s chance.
How should it be (marble
mix up in bin) so that we always get the same pattern?
(Is that possible?)
Why do you think that?
If no, what can we say?
How many different
[combinations] do you think
there are? Is it possible to
find all?
(How could we keep track of
the combinations we have
gotten?)
After students are “on
board” with drawing
Let’s start drawing the
combinations. How can we
know if we have found all?
What should we do about repeats?
Prompting any form of
combinatorial analysis.
Trying to introduce drawing 4-blocks
Combinatorial analysis has
two important qualitative
principles that express its
systematicity and rigor: (1)
We must find all the possible
combinations; (2) We must
not repeat any combination.
What warrants might students present to support
(1) and/or (2)?
We are probing for
spontaneous methods.
4; 8; 16; 40…
infinity
Do we have to
count?
[after drawing]
there are 16
Can you show me? How did
you get that number? How
do you know? What makes
you think of this number? How sure are you? Is it
possible to prove that, or
will we never know? How
would you show me? Oh, I
have some paper and
crayons here, would this
help you? Here, why don’t
you use this grid to draw the
sample we just got?
Is that all? How do you know? How did you draw
these? [probe for procedure/
method]
Once we have the all the
patterns or the student
cannot find any more:
How could we arrange these
so we could see what kinds
Trying to get students to
create tower.
Oh, it doesn’t
really matter.
Well, when you were
building these, you kept on
talking about the number of
green squares. So maybe
that’s a helpful way to
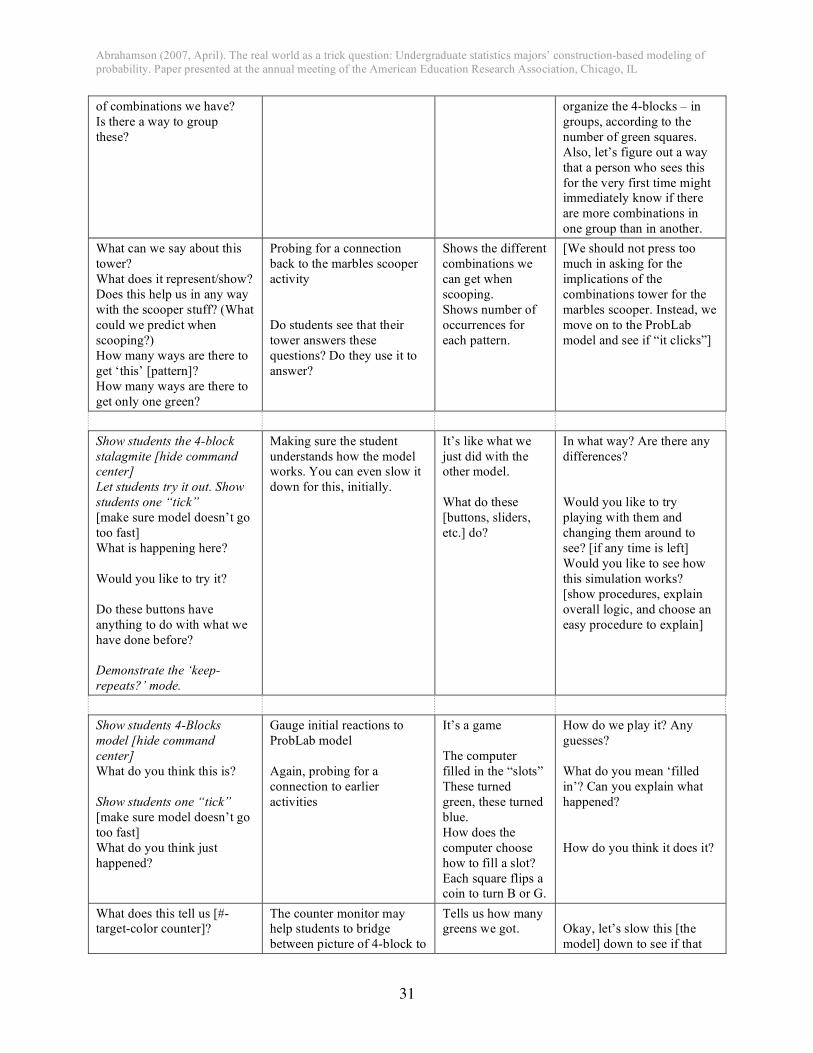
Abrahamson (2007, April). The real world as a trick question: Undergraduate statistics majors’ construction-based modeling of probability. Paper presented at the annual meeting of the American Education Research Association, Chicago, IL
31
of combinations we have?
Is there a way to group
these?
organize the 4-blocks – in
groups, according to the
number of green squares.
Also, let’s figure out a way
that a person who sees this
for the very first time might immediately know if there
are more combinations in
one group than in another.
What can we say about this
tower?
What does it represent/show?
Does this help us in any way
with the scooper stuff? (What
could we predict when
scooping?)
How many ways are there to
get ‘this’ [pattern]?
How many ways are there to
get only one green?
Probing for a connection
back to the marbles scooper
activity
Do students see that their
tower answers these
questions? Do they use it to
answer?
Shows the different
combinations we
can get when
scooping.
Shows number of
occurrences for
each pattern.
[We should not press too
much in asking for the
implications of the
combinations tower for the
marbles scooper. Instead, we
move on to the ProbLab
model and see if “it clicks”]
Show students the 4-block
stalagmite [hide command
center]
Let students try it out. Show
students one “tick”
[make sure model doesn’t go
too fast]
What is happening here?
Would you like to try it?
Do these buttons have
anything to do with what we
have done before?
Demonstrate the ‘keep-
repeats?’ mode.
Making sure the student
understands how the model works. You can even slow it
down for this, initially.
It’s like what we
just did with the other model.
What do these
[buttons, sliders,
etc.] do?
In what way? Are there any
differences?
Would you like to try
playing with them and
changing them around to
see? [if any time is left]
Would you like to see how
this simulation works?
[show procedures, explain
overall logic, and choose an
easy procedure to explain]
Show students 4-Blocks
model [hide command
center]
What do you think this is?
Show students one “tick”
[make sure model doesn’t go
too fast]
What do you think just
happened?
Gauge initial reactions to
ProbLab model
Again, probing for a
connection to earlier
activities
It’s a game
The computer
filled in the “slots”
These turned
green, these turned
blue.
How does the
computer choose
how to fill a slot?
Each square flips a coin to turn B or G.
How do we play it? Any
guesses?
What do you mean ‘filled
in’? Can you explain what
happened?
How do you think it does it?
What does this tell us [#-target-color counter]?
The counter monitor may help students to bridge
between picture of 4-block to
Tells us how many greens we got.
Okay, let’s slow this [the
model] down to see if that
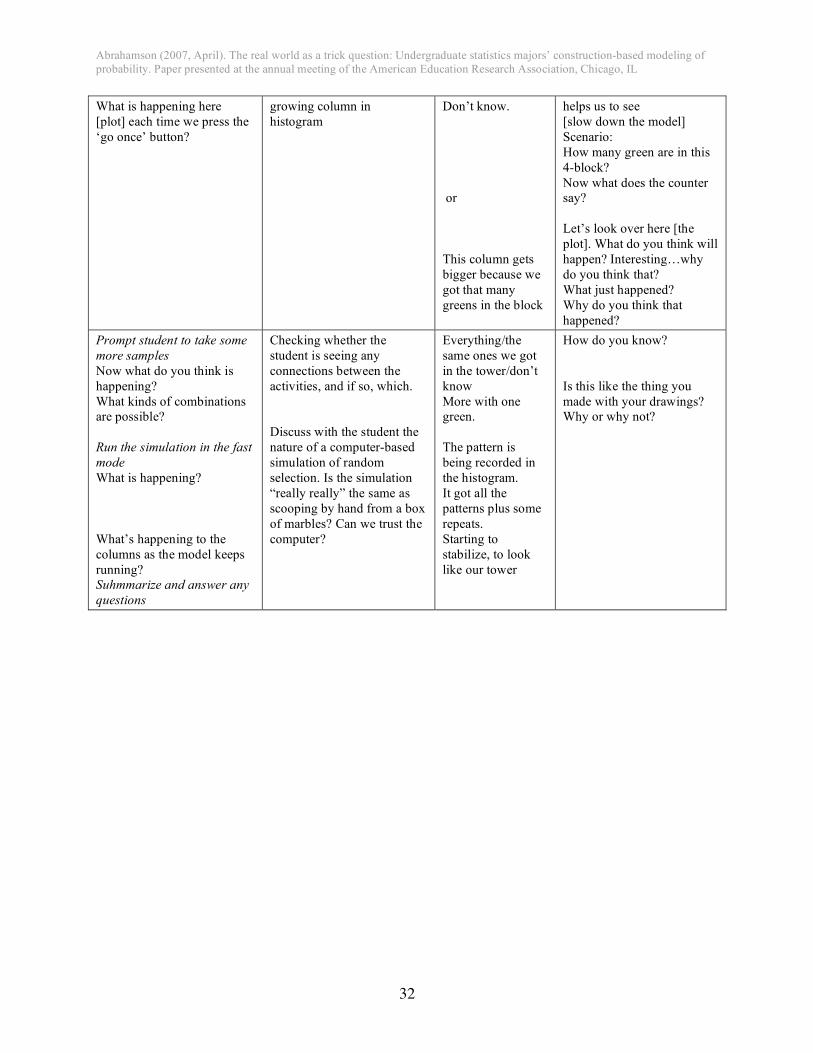
Abrahamson (2007, April). The real world as a trick question: Undergraduate statistics majors’ construction-based modeling of probability. Paper presented at the annual meeting of the American Education Research Association, Chicago, IL
32
What is happening here
[plot] each time we press the
‘go once’ button?
growing column in
histogram
Don’t know.
or
This column gets
bigger because we
got that many
greens in the block
helps us to see
[slow down the model]
Scenario:
How many green are in this
4-block?
Now what does the counter say?
Let’s look over here [the
plot]. What do you think will
happen? Interesting…why
do you think that?
What just happened?
Why do you think that
happened?
Prompt student to take some
more samples
Now what do you think is
happening?
What kinds of combinations are possible?
Run the simulation in the fast
mode
What is happening?
What’s happening to the
columns as the model keeps
running? Suhmmarize and answer any
questions
Checking whether the
student is seeing any
connections between the
activities, and if so, which.
Discuss with the student the
nature of a computer-based
simulation of random
selection. Is the simulation
“really really” the same as
scooping by hand from a box
of marbles? Can we trust the
computer?
Everything/the
same ones we got
in the tower/don’t
know
More with one green.
The pattern is
being recorded in
the histogram.
It got all the
patterns plus some
repeats.
Starting to
stabilize, to look
like our tower
How do you know?
Is this like the thing you
made with your drawings? Why or why not?

Abrahamson (2007, April). The real world as a trick question: Undergraduate statistics majors’ construction-based modeling of probability. Paper presented at the annual meeting of the American Education Research Association, Chicago, IL
33
Appendix B—Transcription of MK 6 Min. Debriefing Conversation
Researcher (an Undergraduate Research Apprenticeship Program student—herself a senior
Statistics major): Do you have any questions about anything?
MK (senior Statistics major): I don’t, I don’t think I do. I guess, any questions I’d be curious
about…would be like, how, I don’t know, how much do other people…how much does the
average math student, like—and I guess this is the reason that you’re doing this study—but how
much does the average math or stats student think about this stuff, as opposed to just knowing
the formulas, you know? Like, because I feel like I was. like, ‘I should know this.’
Res: That’s definitely a common theme of people going…you know, I’ve had people go, like,
“Oh my god, they shouldn’t let me graduate because I don’t know what to do!,” you know. But
people in general are able to, uhmm, are able to work it out and think it out, but I think, uhmm, it
just might not be a way that they initially think to work on the problem. But like, what would
you say—like what do you think would happen, like, if I, uhmm, if I took, like, a fifth grader
and, like, asked them—like, showed them—the marbles, and asked them like, “What do you
think I’m going to get this time? What’s the most likely to get?”
MK: Oh, see I think—I don’t know if they would do better than me because I already know the
statistics concepts to like… but I’m doing it backwards. I’m taking the stuff I already know and
trying to apply the stuff that I’m seeing to it and make it all make sense together. Like, I think,
kids who are still in elementary school are used to learning that way. They haven’t had it beaten
out of them yet. I think that there’s this idea that, like, if you have to go to looking at things like
this, it’s almost as though, like, no, you should be able to do that in the math way and on paper,
and, like, in the abstract way and learn to think abstractly, and that, like, this is somehow, like,
shows weakness. Like this kind of thing kind of…and instead of the idea that it gives you a
foundation [of] the math, which is, I think, more accurate, but, but so we kind of tend to stay
away from this because when you’re more…this—this kind of thinking, like visual thinking and,
like playing with stuff, kind of thinking, because…because it doesn’t help you do things faster.
But I think that someone in elementary school is still familiar enough with, like, learning-by-
playing-with-stuff that they’d probably learn it better than me.
Res: So, uhmm, so you’re saying, like, in elementary school, it’s still, like, okay to, like, do
things this way, but, like, as you go on in school, you learn the, you know, the math and the
equations to do things without, you know, say, drawing each, uhmm, you know, each possible
combination, without, you know, looking at the outcome distribution.
MK: Because if you have to draw it out every time, that’s a handicap, and so you have to learn to
do it without, but I think that it’s unfortunate that that means that we lose doing it visually and,
like, hands-on at all. Because it seems like that’s valuable for doing it a couple times to learn it
and then…but yeah, I mean, you can’t do that—it is a handicap if you have to do it all the time,
you know.
Res: What if we had—instead of, we call these little things 4-blocks—what if we had 9-blocks.

Abrahamson (2007, April). The real world as a trick question: Undergraduate statistics majors’ construction-based modeling of probability. Paper presented at the annual meeting of the American Education Research Association, Chicago, IL
34
MK: Right, no, it…it would be big. And it would take a lot of time and my hands would have
even more ink on them.
Res: That is washable, by the way.
MK: Oh that’s good.
Res: I know, I get it all over my hands. Okay, so you’re saying that, like, if you as, like, maybe a
college student or someone who’s studied math, if you were able to use the formulas but, like,
based on an understanding that came from this, that would be valuable, as opposed to maybe
just, like, using the formula. Or, like, were you…were you sure…I feel like, uhmm, after you
made this, you said, oh, the binomial formula…
MK: Yeah.
Res: So you didn’t think of that, like, beforehand?
MK: No, I didn’t. Well, I was thinking about…for some reason, like, I was thinking binomial is
like one thing, it’s number of successes, and that’s two colors and I didn’t think, just pick one
color and call that a success and call the other a failure, and then it’ll be…I didn’t make that
connection. I’m also very tired.
Res: Well, I think one important thing was, like, uhmm, like for me it’s…in a lot of stats classes,
it’s like, here’s how you apply this formula to this type of problem. And it doesn’t—I feel like
sometimes there’s not—they don’t give you the tools to say…to say this type of formula is useful
for…I mean, like, to give you the tools to see a problem and automatically know the type of
formula…
MK: Know what tool...know what tool to use because you—usually on tests, you like, you know
what tools you’re going to be using, because you know what section…
Res: If this were balls and urns I think you would have been…
MK: Yeah, if it were balls and urns I would have been right on it—“Oh that’s binomial!”..
Res: Yeah and, like, in tests or textbooks it’s like, well, right now, we’re studying, uhmm, you
know, the binomial theorem, so all the problems are going to use the binomial theorem, you
know, and so if you get a homework problem, that’s your best bet.
MK: I wonder what I should do…
Res: Yeah, or, like, you know, in calculus we’re taking the derivative of stuff, so basically take
the derivative and you’re set, you know. But, uhmm, but then to, like, go out into the world and
see a problem and automatically know, like, oh, I should…I should use, you know, the …this—
this is a ‘Poisson arrival process.’ I should use that formula, or something.

Abrahamson (2007, April). The real world as a trick question: Undergraduate statistics majors’ construction-based modeling of probability. Paper presented at the annual meeting of the American Education Research Association, Chicago, IL
35
MK: That’s what—that’s what you need to be able to do in the real world. I mean, it doesn’t
matter how many formulas you know if you can’t look at a problem and figure out which one to
use.