
Aboveground carbon stocks in oil palm plantations …€™matul Khasanah 1,2*, Meine van...
18
Khasanah et al., Cogent Environmental Science (2015), 1: 1119964 http://dx.doi.org/10.1080/23311843.2015.1119964 ENVIRONMENTAL MANAGEMENT & CONSERVATION | RESEARCH ARTICLE Aboveground carbon stocks in oil palm plantations and the threshold for carbon-neutral vegetation conversion on mineral soils Ni’matul Khasanah 1,2 *, Meine van Noordwijk 1,2 and Harti Ningsih 1,3 Abstract: The carbon (C) footprint of palm oil production is needed to judge emis- sions from potential biofuel use. Relevance includes wider sustainable palm oil debates. Within life cycle analysis, aboveground C debt is incurred if the vegeta- tion replaced had a higher C stock than oil palm plantations. Our study included 25 plantations across Indonesia, in a stratified study design representing the range of conditions in which oil palm is grown. From allometric equations for palm biomass and observed growth rates, we estimated the time-averaged aboveground C stock for 25-year rotation and 95%-confidence interval to be 42.07 (42.04–42.10) Mg C ha −1 for plantations managed by company on mineral soils, 40.03 (39.75–40.30) Mg C ha −1 for plantations managed by company on peat, and 37.76 (37.42–38.09) Mg C ha −1 for smallholder oil palm on mineral soils. Oil palm can be established C debt- free on mineral soils with aboveground C stocks below these values; neutrality of mineral soil C pools was documented in a parallel study. Acknowledging variation in shoot:root ratios, the types of vegetation that can be converted debt-free to oil palm include grasslands and shrub, but not monocultural rubber plantations, rubber agroforest, and similar secondary or logged-over forests of higher C stock. *Corresponding author: Ni’matul Khasanah, World Agroforestry Centre (ICRAF), Southeast Asia Regional Programme, Jl. CIFOR, Situgede, Sindang Barang, Bogor, 16115, PO Box 161, Bogor 16001, Indonesia; Plant Production Systems, Department of Plant Sciences, Wageningen University, Wageningen, The Netherland E-mail: [email protected] Reviewing editor: Serge Wich, Liverpool John Moores University, UK Additional information is available at the end of the article ABOUT THE AUTHORS Ni’matul Khasanah, trained as soil scientist, has been working for the World Agroforestry Centre since 2002. Her research is focused on tropical tree-cover change and its consequences for ecosystem services; and tree–soil–crop interactions. In 2013, she registered as a PhD candidate at Wageningen University working on oil palm production in Indonesia. Meine van Noordwijk, trained as a biologist, joined the World Agroforestry Center in 1993 and currently is its chief scientist. His research interest is tree–soil–crop interactions, multifunctional landscapes, interdisciplinary integration and ways of linking scientific knowledge to action and policy. He also serves as part-time Professor of Agroforestry at Wageningen University. Harti Ningsih, trained as a biologist, has worked at the World Agroforestry Center for three years as a research assistant involved in projects related to C footprint of oil palm production and biodiversity assessments. She joined the Zoological Society of London in November 2014 as assistant project manager. PUBLIC INTEREST STATEMENT Use of palm oil as biofuel and its rapid growth as major source of vegetable oil for the food industry has brought attention to the “carbon debt” that arises when forest is converted to oil palm plantations. A critical component of this calculation is the time-averaged carbon (C) stock of an oil palm plantation over its life cycle, and the way this may vary between situations and depend on management practices. In the most comprehensive study to date, we explored how this C stock varies in Indonesia, global leader in palm oil production. What confidence interval needs to be included around single value estimates? Under what conditions would values differ from the defaults? Our survey provided more detailed answers to this than currently exist, which can be the basis for revising current thresholds for “carbon neutrality” and standards for low-emission development strategies. Received: 15 June 2015 Accepted: 09 November 2015 Published: 15 December 2015 © 2015 The Author(s). This open access article is distributed under a Creative Commons Attribution (CC-BY) 4.0 license. Page 1 of 18
Transcript of Aboveground carbon stocks in oil palm plantations …€™matul Khasanah 1,2*, Meine van...
Khasanah et al., Cogent Environmental Science (2015), 1: 1119964http://dx.doi.org/10.1080/23311843.2015.1119964
ENVIRONMENTAL MANAGEMENT & CONSERVATION | RESEARCH ARTICLE
Aboveground carbon stocks in oil palm plantations and the threshold for carbon-neutral vegetation conversion on mineral soilsNi’matul Khasanah1,2*, Meine van Noordwijk1,2 and Harti Ningsih1,3
Abstract: The carbon (C) footprint of palm oil production is needed to judge emis-sions from potential biofuel use. Relevance includes wider sustainable palm oil debates. Within life cycle analysis, aboveground C debt is incurred if the vegeta-tion replaced had a higher C stock than oil palm plantations. Our study included 25 plantations across Indonesia, in a stratified study design representing the range of conditions in which oil palm is grown. From allometric equations for palm biomass and observed growth rates, we estimated the time-averaged aboveground C stock for 25-year rotation and 95%-confidence interval to be 42.07 (42.04–42.10) Mg C ha−1 for plantations managed by company on mineral soils, 40.03 (39.75–40.30) Mg C ha−1 for plantations managed by company on peat, and 37.76 (37.42–38.09) Mg C ha−1 for smallholder oil palm on mineral soils. Oil palm can be established C debt-free on mineral soils with aboveground C stocks below these values; neutrality of mineral soil C pools was documented in a parallel study. Acknowledging variation in shoot:root ratios, the types of vegetation that can be converted debt-free to oil palm include grasslands and shrub, but not monocultural rubber plantations, rubber agroforest, and similar secondary or logged-over forests of higher C stock.
*Corresponding author: Ni’matul Khasanah, World Agroforestry Centre (ICRAF), Southeast Asia Regional Programme, Jl. CIFOR, Situgede, Sindang Barang, Bogor, 16115, PO Box 161, Bogor 16001, Indonesia; Plant Production Systems, Department of Plant Sciences, Wageningen University, Wageningen, The Netherland E-mail: [email protected]
Reviewing editor:Serge Wich, Liverpool John Moores University, UK
Additional information is available at the end of the article
ABOUT THE AUTHORSNi’matul Khasanah, trained as soil scientist, has been working for the World Agroforestry Centre since 2002. Her research is focused on tropical tree-cover change and its consequences for ecosystem services; and tree–soil–crop interactions. In 2013, she registered as a PhD candidate at Wageningen University working on oil palm production in Indonesia.
Meine van Noordwijk, trained as a biologist, joined the World Agroforestry Center in 1993 and currently is its chief scientist. His research interest is tree–soil–crop interactions, multifunctional landscapes, interdisciplinary integration and ways of linking scientific knowledge to action and policy. He also serves as part-time Professor of Agroforestry at Wageningen University.
Harti Ningsih, trained as a biologist, has worked at the World Agroforestry Center for three years as a research assistant involved in projects related to C footprint of oil palm production and biodiversity assessments. She joined the Zoological Society of London in November 2014 as assistant project manager.
PUBLIC INTEREST STATEMENTUse of palm oil as biofuel and its rapid growth as major source of vegetable oil for the food industry has brought attention to the “carbon debt” that arises when forest is converted to oil palm plantations. A critical component of this calculation is the time-averaged carbon (C) stock of an oil palm plantation over its life cycle, and the way this may vary between situations and depend on management practices. In the most comprehensive study to date, we explored how this C stock varies in Indonesia, global leader in palm oil production. What confidence interval needs to be included around single value estimates? Under what conditions would values differ from the defaults? Our survey provided more detailed answers to this than currently exist, which can be the basis for revising current thresholds for “carbon neutrality” and standards for low-emission development strategies.
Received: 15 June 2015Accepted: 09 November 2015Published: 15 December 2015
© 2015 The Author(s). This open access article is distributed under a Creative Commons Attribution (CC-BY) 4.0 license.
Page 1 of 18
Page 2 of 18
Khasanah et al., Cogent Environmental Science (2015), 1: 1119964http://dx.doi.org/10.1080/23311843.2015.1119964
Subjects: Agriculture & Environmental Sciences; Conservation - Environment Studies; Environment & Agriculture; Environment & Resources; Environmental Studies & Management
Keywords: biomass; allometric equation; footprint; Indonesia sustainable palm oil; time-averaged carbon stock
1. IntroductionOil palm (Elaeis guineensis) plantations and their expansion may well be the driver of deforestation in Indonesia that has the highest degree of public scrutiny (Carlson et al., 2012; McCarthy, 2010; Sheil et al., 2009). In 1935, Indonesia became the global leader in palm oil export, with a plantation area of 74,000 ha (Rowaan, 1936). Seventy-five years later, it re-gained the number one position that it had lost to Malaysia, with a planted area of over 8 Mha, 100 times more than in 1935, but still less than 5% of its 193 Mha of land. Further expansion is planned but needs to reconcile with envi-ronmental regulations and consumer concerns.
The Renewable Energy Directive (RED) of the European Union includes a commitment to substitute part of the Union’s transport fuel with biofuels as an environmentally friendly alternative to fossil fuels. For diesel engines, biofuels can be derived from vegetable oils such as palm oil, rapeseed and soybean (Demirbas, 2007; Tan, Lee, Mohamed, & Bhatia, 2009). Similarly, environmental authorities in the USA have formulated standards for a minimum degree of net emission reduction for biofuel use (EPA, 2010). Currently, more than 80% of the world biodiesel production derives from rapeseed oil. However, palm oil production costs are lower than that of other vegetable oils (Tan et al., 2009; Thoenes, 2006) and increased demand for palm oil as a source of biodiesel can be expected, if envi-ronmental regulations and import restrictions allow. Demand of palm oil has increased, as it is a source of fats and oil for food products (Tan et al., 2009) as well as biofuel feedstock to replace fossil fuel (Reijnders & Huijbregts, 2008; Tan et al., 2009). These multiple types of use have promoted ex-pansion of oil palm plantation not only in Indonesia, but also in Malaysia (Barlow, Zahari, & Ria, 2003; Danielsen et al., 2009; Koh & Wilcove, 2008), and at more modest scale elsewhere in the humid trop-ics. Indonesia and Malaysia still represent 90% of global production and trade of palm oil (Thoenes, 2006). Environmental issues in expansion of oil palm plantations include loss of biodiversity and the net emission of carbon dioxide per unit product, especially when peatlands are used and high car-bon-stock forests are converted (Koh & Wilcove, 2008; Reijnders & Huijbregts, 2008). Carbon debts incurred at establishment of oil palm plantations can take decades or centuries to repay, depending on subsequent productivity, or have infinite payback times on peat soils where recurrent CO2 emis-sions exceed the possible emission saving from the fossil fuel for which it was substituted (Danielsen et al., 2009; Germer & Sauerborn, 2008; Gibbs et al., 2008; Searchinger et al., 2008).
While the debate on biofuels has focused on a comparison of default characteristics between com-modities, the “management swing potential”, or difference in environmental profile of a single com-modity depending on the location and the way it is grown is now recognized (Davis, Anderson-Teixeira, & DeLucia, 2009; Davis et al., 2013). Based on current estimates, palm oil has the widest “swing po-tential” as it is both among the best and the worst of current biofuels in terms of potential for emis-sion saving. If oil palm is grown on lands already deforested, it is among the best (Choo et al., 2011; George & Cowie, 2011; Hassan, Jaramillo, & Griffin, 2011; Siangjaeo, Gheewala, Unnanon, & Chidthaisong, 2011). However, when it is grown on deeply drained peat soils converted from forest, it is among the worst (Adachi et al., 2011; Davis et al., 2013; Nogueira, 2010; Sheil et al., 2009). The wide swing potential is a challenge for current regulators who seek a single average value as characteristic per commodity. A single average value per commodity is needed for thresholds that can be used to certify the segments of the production system that meet environmental standards, as an alternative to treating all uniformly. In a life cycle analysis, the potential carbon debt incurred at land use conver-sion (Fargione, Hill, Tilman, Polasky, & Hawthorne, 2008), the recurrent emissions in the production phase (linked to fertilizer use, drainage of wetlands and peat, among others), and the transport and processing phases jointly contribute to an overall footprint per unit product (Reijnders, 2011). We will
Page 3 of 18
Khasanah et al., Cogent Environmental Science (2015), 1: 1119964http://dx.doi.org/10.1080/23311843.2015.1119964
here focus on thresholds for “carbon-neutral” or “debt-free” land conversion, derive the aboveground time-averaged C stock of oil palm plantations that can be used in the carbon-debt calculations within life cycle analysis. The life cycle concept, however, cannot be easily applied to vegetation with low management intensity or where the balance between continued degradation and recovery cannot be predicted. In practice, we used the average of measured values for a certain land cover class as its time-averaged value in such cases. Apart from accountability for recurrent emissions from fertilizer use and soil carbon loss (Khasanah, van Noordwijk, Ningsih, & Rahayu, 2015), the footprint of oil palm includes terms for the aboveground carbon debt due to conversion (CAGB,P − CAGB,T), with CAGB,P, the aboveground carbon stocks preceding conversion, and CAGB,T, the time-averaged value after conversion.
As an initial estimate of the time-averaged carbon stock of oil palm, Dewi, Khasanah, Rahayu, Ekadinata, and van Noordwijk (2009) proposed a value of 40 Mg C ha−1 based on a limited data-set. If shoot:root estimates for oil palm can be assumed to be (at most) equal to that for other vegetation (Jourdan & Rey, 1997), the carbon debt-free status applies for all biomass, with no changes in soil organic carbon (Khasanah et al., 2015). However, the initial estimate of 40 Mg C ha−1 did not repre-sent the full range of conditions found in oil palm plantations in Indonesia, as regards soil type and plantation management (nucleus, plasma and independent smallholder). The term nucleus is used for the core area of a plantation managed by a company; the term plasma refers to surrounding areas of plantation that are initially managed by the core company during establishment, usually until the early production stage (4–5 years old) and then transferred to the farmers who own the land. In many cases, the plantation obtained land that was under community control and returns part as plasma to individual farmers. The term independent is used for a smallholding plantations managed by a farmer on land they control (whether legally owned or not) (Santoso, 2010), using planting material obtained in markets and selling produce to intermediaries or mills, without long-term contract. Koh, Gibbs, Potapov, and Hansen (2012) used an estimate of 24 Mg C ha−1 for above-ground biomass of oil palm averaged over a 25-year rotation, based on a limited data-set of Murdiyarso, Hergoualc’h, and Verchot (2010).
A recent HCS + proposal for self-regulation by the oil palm industry suggested that 75 Mg C ha−1 can be the threshold value for aboveground carbon (AGC) of land converted to oil palm—claiming that oil palm converted from land with aboveground carbon stocks below that value can be carbon neutral (Raison et al., 2015). Carbon neutrality can be evaluated at multiple scales. At product level, carbon neutrality may imply a “footprint” of zero, which is only achievable if there are gains in parts of the accounting sheet that offset the unavoidable emissions that are part of production and trans-port. Where palm oil is used as biofuel, offsets can be derived from the emissions avoided by not using fossil fuels, but only if the fate of these non-used fuels is deemed to be outside of accountabil-ity of the biofuel user. Even so, carbon neutrality of biofuels is not feasible, and existing standards, such as those of the European Union and USA Environmental Protection Agency only require partial emission reduction relative to fossil fuel use, not carbon neutrality. A simpler form of carbon neutral-ity applies to the way land use and land use change is accounted for in Intergovernmental Panel on Climate Change (IPCC) compliant national accounting systems. Tier-I and Tier-II accounting sys-tems, using global defaults and nationally appropriate values, respectively, calculate emissions from a comparison of time-averaged carbon stocks. Averaging the C stock over the life cycle of a land use system is appropriate if a landscape can be expected to contain proportional areas of each age class. That assumption is relaxed in Tier-III accounting of losses and gains, but at substantially increased data demand and marginal change of the bottom line of the accounting system in most cases. Carbon neutrality in this sense is obtained when the time-averaged C stock of a new land use system is equal to that of its predecessor. To apply this concept, we thus need to quantify the C stock of oil palm over all stages of its life cycle. If the value obtained is less than 75 Mg C ha−1, the HCS proposal can be rejected in its claim of securing carbon neutrality. However, if accountability extends to a larger area than that planted, there may be compensation for carbon debts in the planted area as long as other areas are effectively recovering and achieving higher C stocks (Raison et al., 2015).
Page 4 of 18
Khasanah et al., Cogent Environmental Science (2015), 1: 1119964http://dx.doi.org/10.1080/23311843.2015.1119964
Even so, the aboveground time-averaged C stock of oil palm is a critical value for any landscape-level calculations.
We thus initiated research to measure and assess the aboveground time-averaged C stock of oil palm across the three main management conditions found in Indonesia: nucleus, plasma and inde-pendent smallholder. This study aimed to:
(a) establish an allometric equation between oil palm height (m) and aboveground biomass (Mg per palm) applicable to different oil palm production conditions in Indonesia, potentially dif-ferentiated by soil type and management regime (nucleus, plasma and independent smallholder),
(b) estimate growth rates of aboveground oil palm biomass (Mg ha−1 year−1) based on actual stand density and palm heights under the same range of conditions,
(c) estimate the time-averaged aboveground C stock of oil palm plantations (Mg C ha−1) including oil palm biomass, understorey vegetation, standing litter stock and necromass stock, differen-tiated by the growing conditions.
2. Materials and methods
2.1. Oil palm characteristics relevant to the study designOil palm (Elaeis guineensis) is an African palm that yields oil from the pulp of the fruit as well as from the kernels (seed) (Corley & Tinker, 2003) and is mostly planted from hybrid (Tenera = Dura × Pisifera) seed. It typically has a life cycle of about 25 years, when harvesting becomes difficult as the colum-nar trunks exceed 20 m. Oil palm is unbranched and the planting pattern (typically between 128 to 148 palms/ha) is designed to secure a closed canopy once pinnate-leaved fronds reach their normal length of 3–5 m (Henson, 1999). It has a rigid development pattern with increments in stem height for every new frond that emerges in a 3–4 weekly interval, over time developing a flower in its axil that can, if not aborted due to a dry period, become a fruit bunch. The frond associated with a har-vestable fruit bunch is removed, leaving a frond base on the stem that over time will decay (Henson, 2004). Under suboptimal conditions of water and/or nutrient supply, all flowers in newly developing inflorescences become male and the number of harvestable fruit bunches declines. To secure fe-male flower and fruit development, high levels of fertilizer are typically used (Pahan, 2006), while locations with more than 1–2 dry months are suboptimal. On peat soils, buffered water supply in dry periods is associated with lack of mechanical support, unless the peat is intensively drained and as a consequence sensitive to drought as well as rapidly decomposing and emitting CO2 in the process. In the first year(s) after planting, there is enough light penetration to ground level for a leguminous cover crop to develop, which is shaded out over time and contributes nitrogen to the system in the process. Smallholders may intercrop with annual food crops in the first three years, instead of using a cover crop.
In contrast to rubber, coffee and cacao, the initial expansion of oil palm in Southeast Asia has been based on large-scale, centrally managed plantations, as the fruits need rapid processing once harvested. As economies of scale favour mills that cater for a planted area of the order of 10,000 ha, financial investment is substantial and the political connection needed to acquire land and credit has favoured large-scale schemes (Budidarsono, Susanti, & Zoomers, 2013). As acquisition of quality and trustable planting material is difficult for smallholders and the crop has a strongly negative re-sponse to suboptimal management, the company-controlled “nucleus” plantation management model continue to dominate in areas of new oil palm expansion. However, over time, smallholder oil palm has emerged in two ways: as contract farms in outgrower schemes (“plasma”) around nuclear plantations, often a pre-requirement for land acquisitions by plantations (Budidarsono et al., 2013), but also, in areas where there are enough mills, as independents with flexible marketing arrange-ments. The management types (nucleus, plasma and independent smallholder) differed (potential-ly) in fertilizer application, use of organic inputs (pruned fronds and empty fruit bunches) and
Page 5 of 18
Khasanah et al., Cogent Environmental Science (2015), 1: 1119964http://dx.doi.org/10.1080/23311843.2015.1119964
understorey vegetation maintenance. These differences are likely to have impact on the growth rates and aboveground carbon stocks during the production cycle.
To provide the range of aboveground C stocks, we derived stratifiers at national level and at plan-tation or landscape level for a sampling scheme. These stratifiers represent current condition of oil palm plantation in Indonesia. At the national level, we had three stratifiers to sample plantation or landscape: (1) plantation or landscape history (derived from forest versus non-forest (other vegeta-tion or from preceding oil palm), (2) soil type (mineral soils versus peat) and (3) the prevalence of oil palm in the surrounding area (<1, 1–5, 5–15%), assessed at provincial level, as areas of high oil palm prevalence are likely to represent a longer history of the crop, potentially selected for the most suit-able climatic conditions, and may have the best knowledge and processing infrastructure. At the plantation or landscape level, we applied three strata to sample oil palm stands: (1) plantation man-agement (nucleus, plasma, independent smallholder), (2) soil type (mineral soils versus peat) and (3) age during the crops’ life cycle.
2.2. Study and sampling design
2.2.1. Plantation or landscape selectionAt the national level, the study was designed to sample plantation or landscapes that represent the primary variation in oil palm production environment in Indonesia. It was differentiated by the three stratifiers mentioned. Factorial combinations across the three strata led to 12 (= 3 × 2 × 2) clusters. As the study was part of a programme designed to increase the capacity of the Indonesian oil palm sector to understand and assess its own carbon footprints, the selection of plantation or landscapes to be sampled in the various strata was based on voluntary nominations by plantation companies. As described in Khasanah et al. (2015), all participating companies were guaranteed confidentiality of plantation-level data while they all received a report in which their performance was compared with the data-set as a whole. This procedure, managed by an agency associated with the Ministry of Agriculture, was chosen to protect commercially sensitive information and stimulate voluntary nominations.
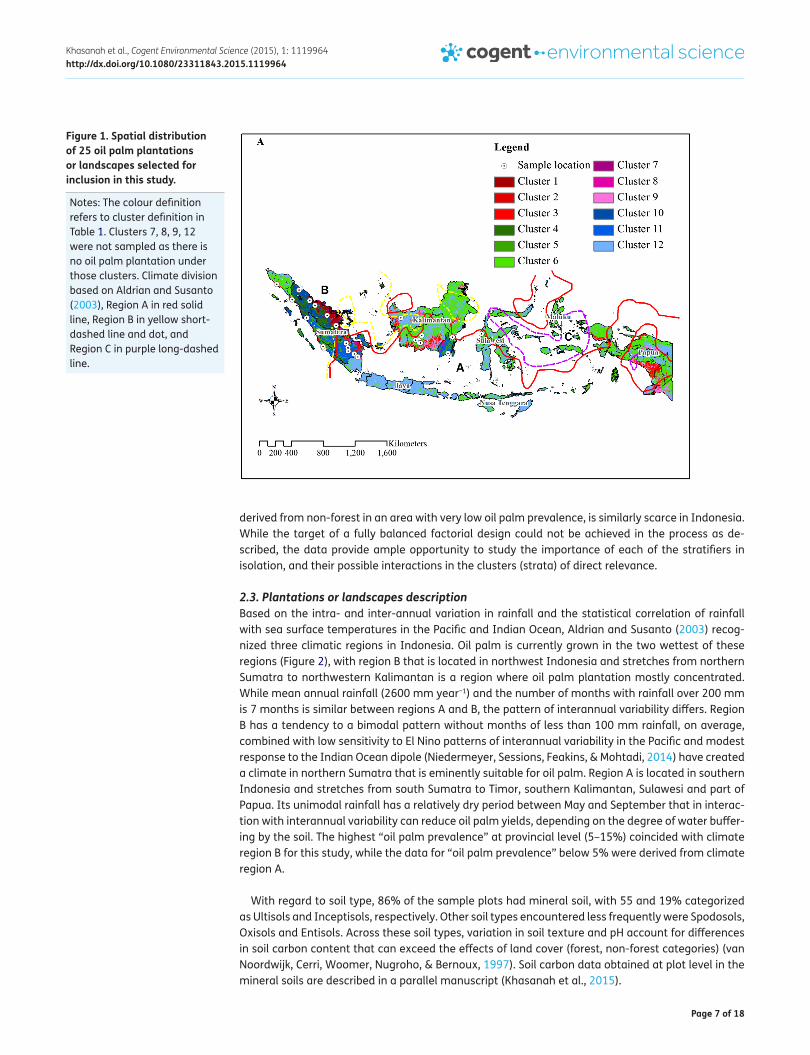
While nominations for some categories (non-forest history on mineral soil) were readily obtained, peat-based plantations were underrepresented. Selection of plantation or landscapes was based on a priori information provided by the companies, which was not in all cases confirmed in the subse-quent fieldwork. In the end, we were able to sample 8 of the 12 clusters identified, in a total of 25 oil palm plantation or landscapes surrounding a plantation agreeing to be part of the research (Table 1). Despite all efforts to secure access to the full range of conditions, willingness to participate may indicate that the company expected to represent “good practice” in oil palm management. The cur-rent data may therefore reflect what is possible in oil palm with current practice, rather than being the unbiased average of present conditions. Figure 1 presents the spatial distribution of the selected 25 oil palm plantation or landscapes across Indonesia, in 12 provinces: 7 provinces in Sumatra (16 plantations), 4 provinces in Kalimantan (8 plantations) and 1 province in Sulawesi (1 plantation).
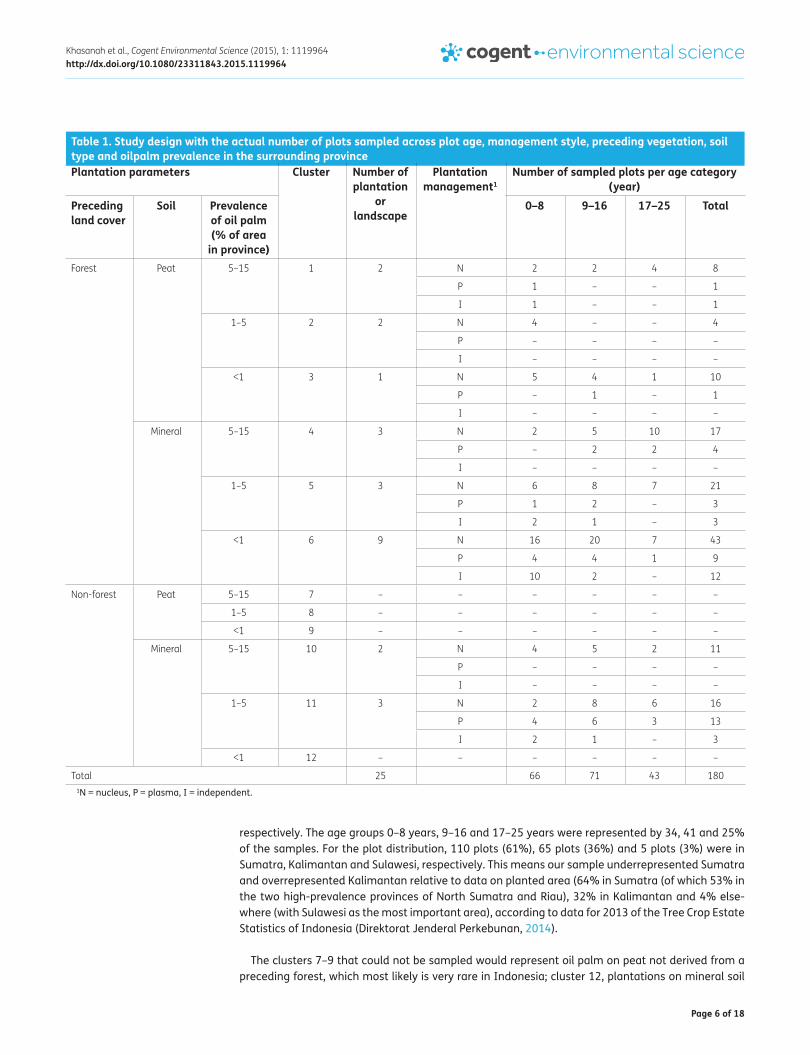
2.2.2. Plot selection within selected plantations or landscapesWithin each selected plantation or landscape in each cluster and in discussion with the plantation company hosting the study, a number of plots were selected, making use of the available range of conditions: (1) plantation management (nucleus, plasma, independent smallholders), (2) soil type (mineral soils versus peat) and (3) age during the crops’ life cycle. In terms of preceding vegetation and soil type, multiple clusters could be sampled in some of the plantations or landscapes. In most cases, there was limited choice in the plot ages, depending on the period since the nucleus planta-tion was developed. Table 1 presents the distribution of the selected 25 oil palm plantations or landscapes by cluster, as well as associated replicate plots (totaling 180 sampling plots), character-ized by age and management style. Table 1 presents the classifications after the survey, rather than that based on a priori information. The 180 plots selected included 86% on mineral soil and 14% on peat, with 70, 19 and 12%, under nucleus, plasma and independent smallholder management,
Page 6 of 18
Khasanah et al., Cogent Environmental Science (2015), 1: 1119964http://dx.doi.org/10.1080/23311843.2015.1119964
respectively. The age groups 0–8 years, 9–16 and 17–25 years were represented by 34, 41 and 25% of the samples. For the plot distribution, 110 plots (61%), 65 plots (36%) and 5 plots (3%) were in Sumatra, Kalimantan and Sulawesi, respectively. This means our sample underrepresented Sumatra and overrepresented Kalimantan relative to data on planted area (64% in Sumatra (of which 53% in the two high-prevalence provinces of North Sumatra and Riau), 32% in Kalimantan and 4% else-where (with Sulawesi as the most important area), according to data for 2013 of the Tree Crop Estate Statistics of Indonesia (Direktorat Jenderal Perkebunan, 2014).
The clusters 7–9 that could not be sampled would represent oil palm on peat not derived from a preceding forest, which most likely is very rare in Indonesia; cluster 12, plantations on mineral soil
Table 1. Study design with the actual number of plots sampled across plot age, management style, preceding vegetation, soil type and oilpalm prevalence in the surrounding province
1N = nucleus, P = plasma, I = independent.
Plantation parameters Cluster Number of plantation
or landscape
Plantation management1
Number of sampled plots per age category (year)
Preceding land cover
Soil Prevalence of oil palm (% of area
in province)
0–8 9–16 17–25 Total
Forest Peat 5–15 1 2 N 2 2 4 8
P 1 – – 1
I 1 – – 1
1–5 2 2 N 4 – – 4
P – – – –
I – – – –
<1 3 1 N 5 4 1 10
P – 1 – 1
I – – – –
Mineral 5–15 4 3 N 2 5 10 17
P – 2 2 4
I – – – –
1–5 5 3 N 6 8 7 21
P 1 2 – 3
I 2 1 – 3
<1 6 9 N 16 20 7 43
P 4 4 1 9
I 10 2 – 12
Non-forest Peat 5–15 7 – – – – – –
1–5 8 – – – – – –
<1 9 – – – – – –
Mineral 5–15 10 2 N 4 5 2 11
P – – – –
I – – – –
1–5 11 3 N 2 8 6 16
P 4 6 3 13
I 2 1 – 3
<1 12 – – – – – –
Total 25 66 71 43 180
Page 7 of 18
Khasanah et al., Cogent Environmental Science (2015), 1: 1119964http://dx.doi.org/10.1080/23311843.2015.1119964
derived from non-forest in an area with very low oil palm prevalence, is similarly scarce in Indonesia. While the target of a fully balanced factorial design could not be achieved in the process as de-scribed, the data provide ample opportunity to study the importance of each of the stratifiers in isolation, and their possible interactions in the clusters (strata) of direct relevance.
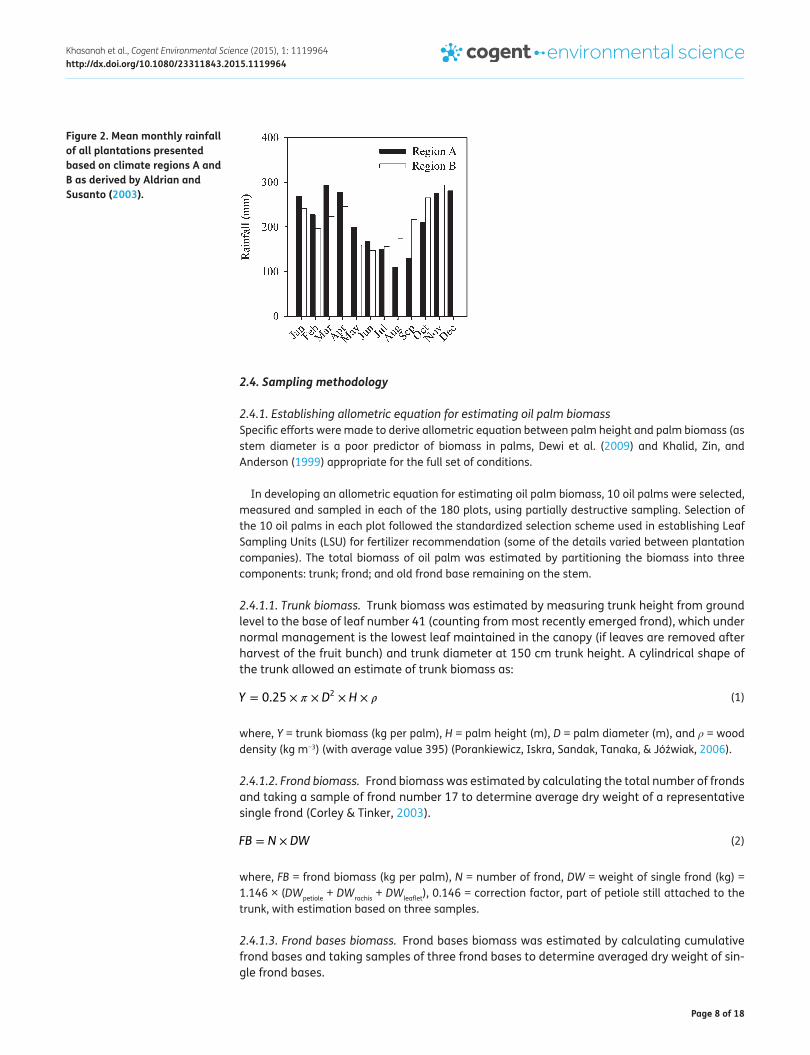
2.3. Plantations or landscapes descriptionBased on the intra- and inter-annual variation in rainfall and the statistical correlation of rainfall with sea surface temperatures in the Pacific and Indian Ocean, Aldrian and Susanto (2003) recog-nized three climatic regions in Indonesia. Oil palm is currently grown in the two wettest of these regions (Figure 2), with region B that is located in northwest Indonesia and stretches from northern Sumatra to northwestern Kalimantan is a region where oil palm plantation mostly concentrated. While mean annual rainfall (2600 mm year−1) and the number of months with rainfall over 200 mm is 7 months is similar between regions A and B, the pattern of interannual variability differs. Region B has a tendency to a bimodal pattern without months of less than 100 mm rainfall, on average, combined with low sensitivity to El Nino patterns of interannual variability in the Pacific and modest response to the Indian Ocean dipole (Niedermeyer, Sessions, Feakins, & Mohtadi, 2014) have created a climate in northern Sumatra that is eminently suitable for oil palm. Region A is located in southern Indonesia and stretches from south Sumatra to Timor, southern Kalimantan, Sulawesi and part of Papua. Its unimodal rainfall has a relatively dry period between May and September that in interac-tion with interannual variability can reduce oil palm yields, depending on the degree of water buffer-ing by the soil. The highest “oil palm prevalence” at provincial level (5–15%) coincided with climate region B for this study, while the data for “oil palm prevalence” below 5% were derived from climate region A.
With regard to soil type, 86% of the sample plots had mineral soil, with 55 and 19% categorized as Ultisols and Inceptisols, respectively. Other soil types encountered less frequently were Spodosols, Oxisols and Entisols. Across these soil types, variation in soil texture and pH account for differences in soil carbon content that can exceed the effects of land cover (forest, non-forest categories) (van Noordwijk, Cerri, Woomer, Nugroho, & Bernoux, 1997). Soil carbon data obtained at plot level in the mineral soils are described in a parallel manuscript (Khasanah et al., 2015).
Figure 1. Spatial distribution of 25 oil palm plantations or landscapes selected for inclusion in this study.
Notes: The colour definition refers to cluster definition in Table 1. Clusters 7, 8, 9, 12 were not sampled as there is no oil palm plantation under those clusters. Climate division based on Aldrian and Susanto (2003), Region A in red solid line, Region B in yellow short-dashed line and dot, and Region C in purple long-dashed line.
Page 8 of 18
Khasanah et al., Cogent Environmental Science (2015), 1: 1119964http://dx.doi.org/10.1080/23311843.2015.1119964
2.4. Sampling methodology
2.4.1. Establishing allometric equation for estimating oil palm biomassSpecific efforts were made to derive allometric equation between palm height and palm biomass (as stem diameter is a poor predictor of biomass in palms, Dewi et al. (2009) and Khalid, Zin, and Anderson (1999) appropriate for the full set of conditions.
In developing an allometric equation for estimating oil palm biomass, 10 oil palms were selected, measured and sampled in each of the 180 plots, using partially destructive sampling. Selection of the 10 oil palms in each plot followed the standardized selection scheme used in establishing Leaf Sampling Units (LSU) for fertilizer recommendation (some of the details varied between plantation companies). The total biomass of oil palm was estimated by partitioning the biomass into three components: trunk; frond; and old frond base remaining on the stem.
2.4.1.1. Trunk biomass. Trunk biomass was estimated by measuring trunk height from ground level to the base of leaf number 41 (counting from most recently emerged frond), which under normal management is the lowest leaf maintained in the canopy (if leaves are removed after harvest of the fruit bunch) and trunk diameter at 150 cm trunk height. A cylindrical shape of the trunk allowed an estimate of trunk biomass as:
where, Y = trunk biomass (kg per palm), H = palm height (m), D = palm diameter (m), and ρ = wood density (kg m−3) (with average value 395) (Porankiewicz, Iskra, Sandak, Tanaka, & Jóźwiak, 2006).
2.4.1.2. Frond biomass. Frond biomass was estimated by calculating the total number of fronds and taking a sample of frond number 17 to determine average dry weight of a representative single frond (Corley & Tinker, 2003).
where, FB = frond biomass (kg per palm), N = number of frond, DW = weight of single frond (kg) = 1.146 × (DWpetiole + DWrachis + DWleaflet), 0.146 = correction factor, part of petiole still attached to the trunk, with estimation based on three samples.
2.4.1.3. Frond bases biomass. Frond bases biomass was estimated by calculating cumulative frond bases and taking samples of three frond bases to determine averaged dry weight of sin-gle frond bases.
(1)Y = 0.25 × � × D2 × H × �
(2)FB = N × DW
Figure 2. Mean monthly rainfall of all plantations presented based on climate regions A and B as derived by Aldrian and Susanto (2003).
Page 9 of 18
Khasanah et al., Cogent Environmental Science (2015), 1: 1119964http://dx.doi.org/10.1080/23311843.2015.1119964
where, FBs = total frond bases biomass (kg per palm), N = number of frond bases still present, DW = weight of a single frond base (kg).
2.4.1.4. Allometric equation. All biomass components were combined and a regression equa-tion was established on the basis of trunk height, testing linear (Y = Ymean + b × (X − Xmean) and power function (Y = Ymean × (X/Xmean)b) models.
2.4.2. Estimating aboveground carbon stock of oil palm plantationIn the 25 selected plantations or landscapes, the full range of existing land cover and land use types was sampled for its aboveground carbon stocks using standard methods (Hairiah et al., 2011). However, we had to adjust the standard methods for oil palm considering the regularly spaced planting pattern, the specific “management zones” around each palm and the non-standard tree architecture.
Estimation of the aboveground carbon stock of oil palm plantations (Mg C ha−1) includes four pools: oil palm biomass; standing litter stock comprising pruned fronds; understorey vegetation; and preceding necromass stock (dead wood) (Dewi et al., 2009).
2.4.2.1. Oil palm biomass. Trunk height of selected 24 oil palms was measured in each plot and biomass was estimated using the allometric equation developed here. The selection of 24 oil palms in each plot also followed the standardized scheme for establishing Leaf Sampling Units for fertilizer recommendation. Results were scaled up to a hectare basis by multiplication with actual tree density 138 palms ha−1.
2.4.2.2. Understorey vegetation and standing litter stocks. The basic methods were as described in Hairiah et al. (2011). Understorey vegetation and litter stocks were estimated by taking sam-ples using a 0.5 m × 0.5 m sample frame. The sampling was done around 10 palms in four management zones: (1) weeded circle, often used for fertilizer application in young stages; (2) interrow/grass zone, in some cases in nucleus plantations used for application of empty fruit bunches (EFB) returned from the mill; (3) frond stack where pruned leaves are piled up (if not spread throughout zone 2) and decompose; and (4) harvest paths, subject to compaction. Details had to be adjusted to local management practice. All of the understorey and litter in-side the sample frame were removed and then separated between stem and leaves before being dried at 80°C for 48 h and weighed. A weighted mean for the four management zones was derived based on the proportions of each management zone under the specific situation found in the plantation.
2.4.2.3. Necromass stocks. Necromass was sampled in a transect across the plot, adjusted to local conditions where bulldozer clearing had established regularly spaced windrows. Height and diameter of the dead wood was measured and the necromass production was estimated using the following equation:
where, DW is dry weight of dead wood (g), ρ is the wood density (g cm−3), estimated from live wood density for the trees involved plus the degree of decomposition assessed by handling it; H is height (length) of dead tree (cm); D is diameter of dead tree (cm). Results were scaled up to a hectare basis using the effective sampling transect area.
The carbon stock of each pool then was estimated by multiplying the biomass of each pool with assumed organic carbon content. Organic carbon contents were assumed to be 0.47 for palm
(3)FBs = N × DW
(4)DW = (�∕4)� × H × D2
Page 10 of 18
Khasanah et al., Cogent Environmental Science (2015), 1: 1119964http://dx.doi.org/10.1080/23311843.2015.1119964
biomass and understorey vegetation, 0.5 for necromass (dead wood) and 0.4 for the standing litter stock (conform the standards used by The European Comission, 2010).
2.5. Time-averaged aboveground carbon stock of oil palm plantationTime-averaged aboveground biomass of oil palm was estimated by developing an allometric equa-tion of palm biomass (Mg ha−1) as a function of palm age (plot-level assessment of mode, ignoring possible gap filling in early stages) (year). A similar procedure was applied to estimate time-aver-aged necromass stock. While the time-averaged understorey biomass and standing litter stock was derived from average value of 180 measured plots.
The time-averaged total aboveground carbon stock of oil palm plantation was then estimated comprehensively by developing an allometric equation of total carbon stock (Mg C ha−1) of planta-tion, taking into account all pools of the plantation as a function of palm age (year).
Confidence intervals of the time-averaged total aboveground carbon stock of oil palm plantation were estimated using the following steps:
(1) Derive a random b of the linear or power form of the palm allometric equation using normal probability distribution:
where b is an intercept of the linear or power equation and se is the standard error estimate derived for this equation. The data had been centralized before regression analysis, so the intercept could be derived as Ymean − b × Xmean for linear equations and as Ymean/(Xmean)b for power curves,
(2) Estimate plot-level palm biomass by applying the random b to all palms measured, add data on the understorey, necromass and litter,
(3) Repeat steps 1 and 2 for all plots in the current category of soil and management type,
(4) Derive the parameters of a total aboveground C stock regression on plot age for this part of the data-set and evaluate the time-averaged C stock for a 25-year rotation, as:
where Ymean is mean of measured total aboveground carbon stock, Xmean is mean of measured age of palm and tcycle is the duration of one cycle of oil palm (here taken as to be 25 years),
(5) Repeat step 4 100 times and report mean and ± 1.96 × standard deviation as 95% confidence interval,
(6) Repeat steps 4 and 5 for other combinations of soil and management types.
3. Results
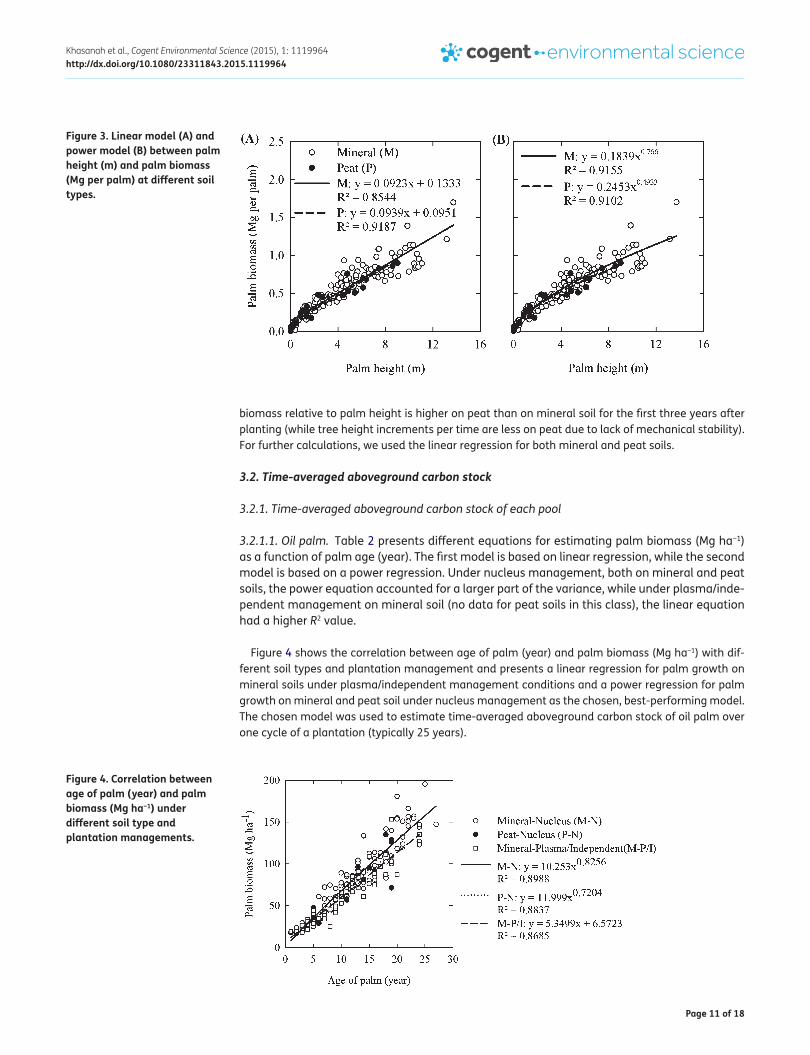
3.1. Allometric equation to estimate oil palm biomassFigure 3 correlates palm height (m) and palm biomass (Mg per palm) for different soil types. A power model for palm biomass (Figure 3 (B)) proved to account for a slightly larger fraction of the variance than a linear increment model for palms on mineral soils. On peat soils, however, the linear equation (Figure 3 (A)) accounted for a great fraction of variance accounted for (as seen from the R2 value).
The allometric data indicated no significant difference owing to preceding land cover and planta-tion management, but some differentiation owing to soil type. Oil palm growth on peat had a similar biomass increment per unit height increment to that on mineral soil (about 0.09 Mg per m palm height), but had a 30% lower intercept in the resulting linear equation. Applying the power equation derived for mineral soil conditions and a linear regression for peat soil palms, suggests that palm
random b = N(
b, se)
(5)CAGB,T = Ymean − b × Xmean + b ×
tcycle
2
Page 11 of 18
Khasanah et al., Cogent Environmental Science (2015), 1: 1119964http://dx.doi.org/10.1080/23311843.2015.1119964
biomass relative to palm height is higher on peat than on mineral soil for the first three years after planting (while tree height increments per time are less on peat due to lack of mechanical stability). For further calculations, we used the linear regression for both mineral and peat soils.
3.2. Time-averaged aboveground carbon stock
3.2.1. Time-averaged aboveground carbon stock of each pool
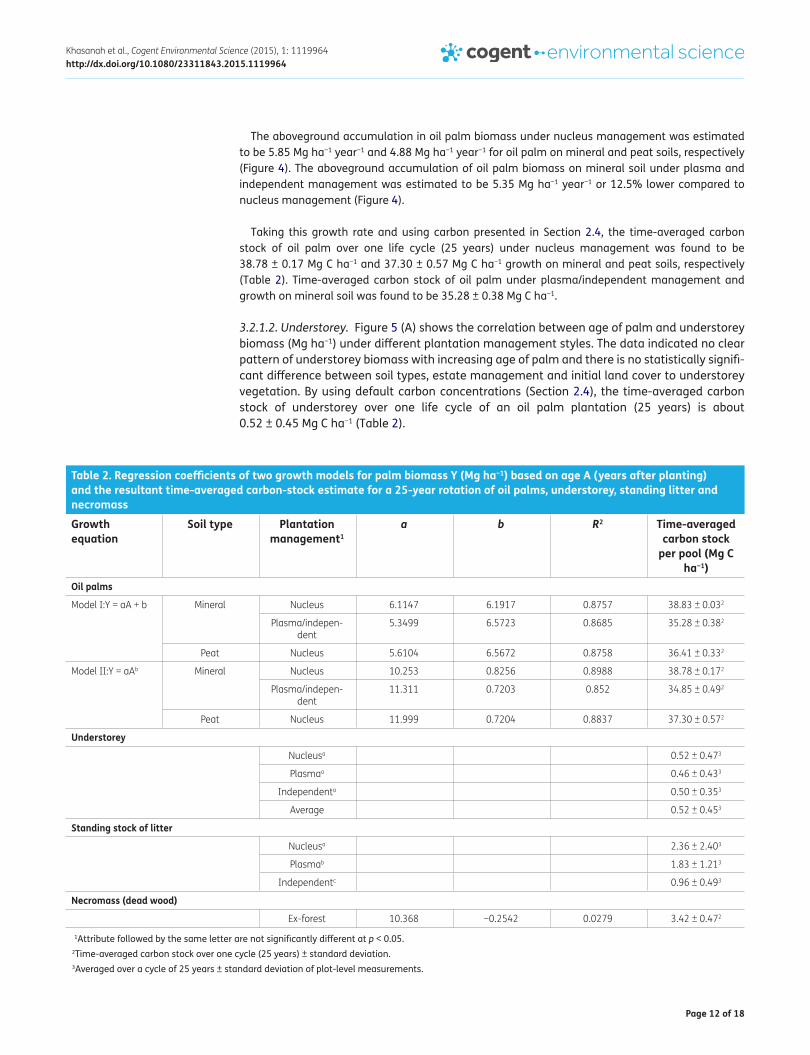
3.2.1.1. Oil palm. Table 2 presents different equations for estimating palm biomass (Mg ha−1) as a function of palm age (year). The first model is based on linear regression, while the second model is based on a power regression. Under nucleus management, both on mineral and peat soils, the power equation accounted for a larger part of the variance, while under plasma/inde-pendent management on mineral soil (no data for peat soils in this class), the linear equation had a higher R2 value.
Figure 4 shows the correlation between age of palm (year) and palm biomass (Mg ha−1) with dif-ferent soil types and plantation management and presents a linear regression for palm growth on mineral soils under plasma/independent management conditions and a power regression for palm growth on mineral and peat soil under nucleus management as the chosen, best-performing model. The chosen model was used to estimate time-averaged aboveground carbon stock of oil palm over one cycle of a plantation (typically 25 years).
Figure 3. Linear model (A) and power model (B) between palm height (m) and palm biomass (Mg per palm) at different soil types.
Figure 4. Correlation between age of palm (year) and palm biomass (Mg ha−1) under different soil type and plantation managements.
Page 12 of 18
Khasanah et al., Cogent Environmental Science (2015), 1: 1119964http://dx.doi.org/10.1080/23311843.2015.1119964
The aboveground accumulation in oil palm biomass under nucleus management was estimated to be 5.85 Mg ha−1 year−1 and 4.88 Mg ha−1 year−1 for oil palm on mineral and peat soils, respectively (Figure 4). The aboveground accumulation of oil palm biomass on mineral soil under plasma and independent management was estimated to be 5.35 Mg ha−1 year−1 or 12.5% lower compared to nucleus management (Figure 4).
Taking this growth rate and using carbon presented in Section 2.4, the time-averaged carbon stock of oil palm over one life cycle (25 years) under nucleus management was found to be 38.78 ± 0.17 Mg C ha−1 and 37.30 ± 0.57 Mg C ha−1 growth on mineral and peat soils, respectively (Table 2). Time-averaged carbon stock of oil palm under plasma/independent management and growth on mineral soil was found to be 35.28 ± 0.38 Mg C ha−1.
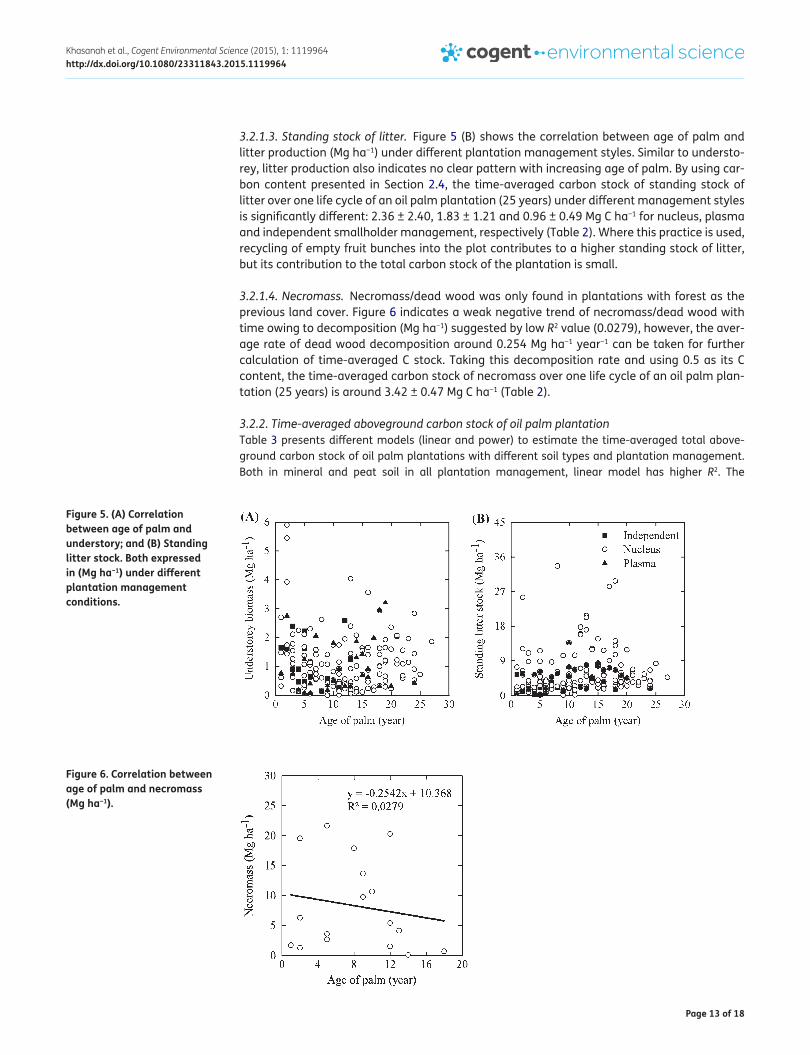
3.2.1.2. Understorey. Figure 5 (A) shows the correlation between age of palm and understorey biomass (Mg ha−1) under different plantation management styles. The data indicated no clear pattern of understorey biomass with increasing age of palm and there is no statistically signifi-cant difference between soil types, estate management and initial land cover to understorey vegetation. By using default carbon concentrations (Section 2.4), the time-averaged carbon stock of understorey over one life cycle of an oil palm plantation (25 years) is about 0.52 ± 0.45 Mg C ha−1 (Table 2).
Table 2. Regression coefficients of two growth models for palm biomass Y (Mg ha−1) based on age A (years after planting) and the resultant time-averaged carbon-stock estimate for a 25-year rotation of oil palms, understorey, standing litter and necromass
1Attribute followed by the same letter are not significantly different at p < 0.05.2Time-averaged carbon stock over one cycle (25 years) ± standard deviation.3Averaged over a cycle of 25 years ± standard deviation of plot-level measurements.
Growth equation
Soil type Plantation management1
a b R2 Time-averaged carbon stock
per pool (Mg C ha−1)
Oil palms
Model I:Y = aA + b Mineral Nucleus 6.1147 6.1917 0.8757 38.83 ± 0.032
Plasma/indepen-dent
5.3499 6.5723 0.8685 35.28 ± 0.382
Peat Nucleus 5.6104 6.5672 0.8758 36.41 ± 0.332
Model II:Y = aAb Mineral Nucleus 10.253 0.8256 0.8988 38.78 ± 0.172
Plasma/indepen-dent
11.311 0.7203 0.852 34.85 ± 0.492
Peat Nucleus 11.999 0.7204 0.8837 37.30 ± 0.572
Understorey
Nucleusa 0.52 ± 0.473
Plasmaa 0.46 ± 0.433
Independenta 0.50 ± 0.353
Average 0.52 ± 0.453
Standing stock of litter
Nucleusa 2.36 ± 2.403
Plasmab 1.83 ± 1.213
Independentc 0.96 ± 0.493
Necromass (dead wood)
Ex-forest 10.368 −0.2542 0.0279 3.42 ± 0.472
Page 13 of 18
Khasanah et al., Cogent Environmental Science (2015), 1: 1119964http://dx.doi.org/10.1080/23311843.2015.1119964
3.2.1.3. Standing stock of litter. Figure 5 (B) shows the correlation between age of palm and litter production (Mg ha−1) under different plantation management styles. Similar to understo-rey, litter production also indicates no clear pattern with increasing age of palm. By using car-bon content presented in Section 2.4, the time-averaged carbon stock of standing stock of litter over one life cycle of an oil palm plantation (25 years) under different management styles is significantly different: 2.36 ± 2.40, 1.83 ± 1.21 and 0.96 ± 0.49 Mg C ha−1 for nucleus, plasma and independent smallholder management, respectively (Table 2). Where this practice is used, recycling of empty fruit bunches into the plot contributes to a higher standing stock of litter, but its contribution to the total carbon stock of the plantation is small.
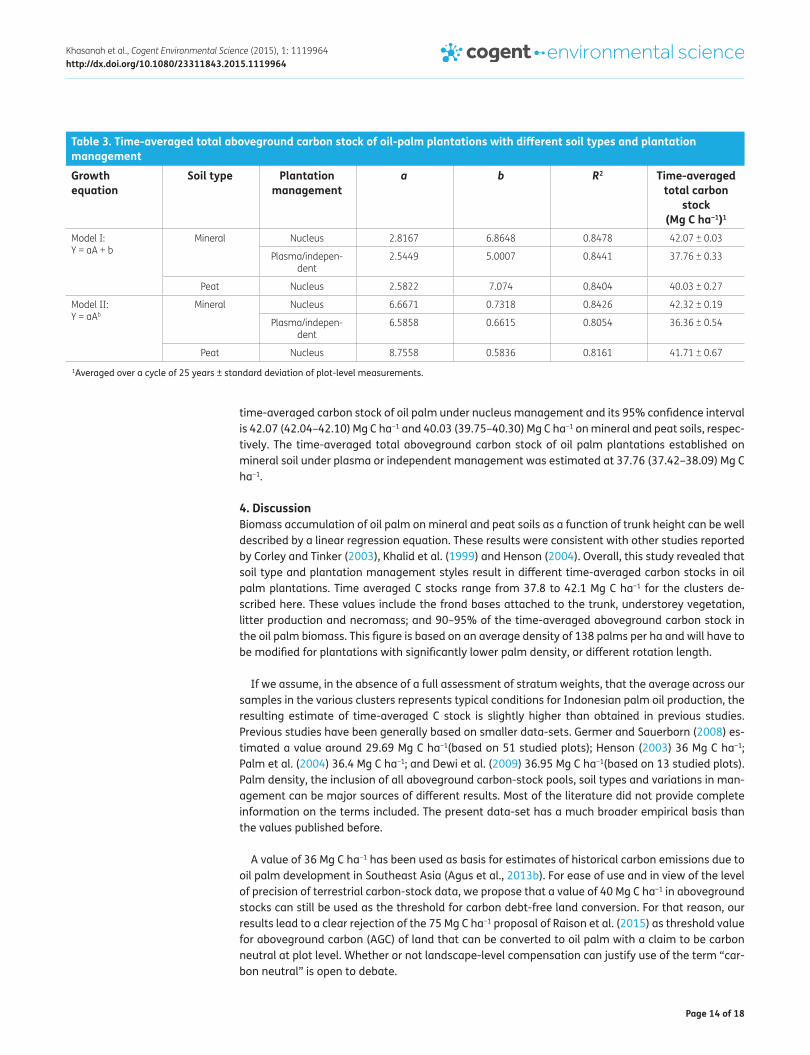
3.2.1.4. Necromass. Necromass/dead wood was only found in plantations with forest as the previous land cover. Figure 6 indicates a weak negative trend of necromass/dead wood with time owing to decomposition (Mg ha−1) suggested by low R2 value (0.0279), however, the aver-age rate of dead wood decomposition around 0.254 Mg ha−1 year−1 can be taken for further calculation of time-averaged C stock. Taking this decomposition rate and using 0.5 as its C content, the time-averaged carbon stock of necromass over one life cycle of an oil palm plan-tation (25 years) is around 3.42 ± 0.47 Mg C ha−1 (Table 2).
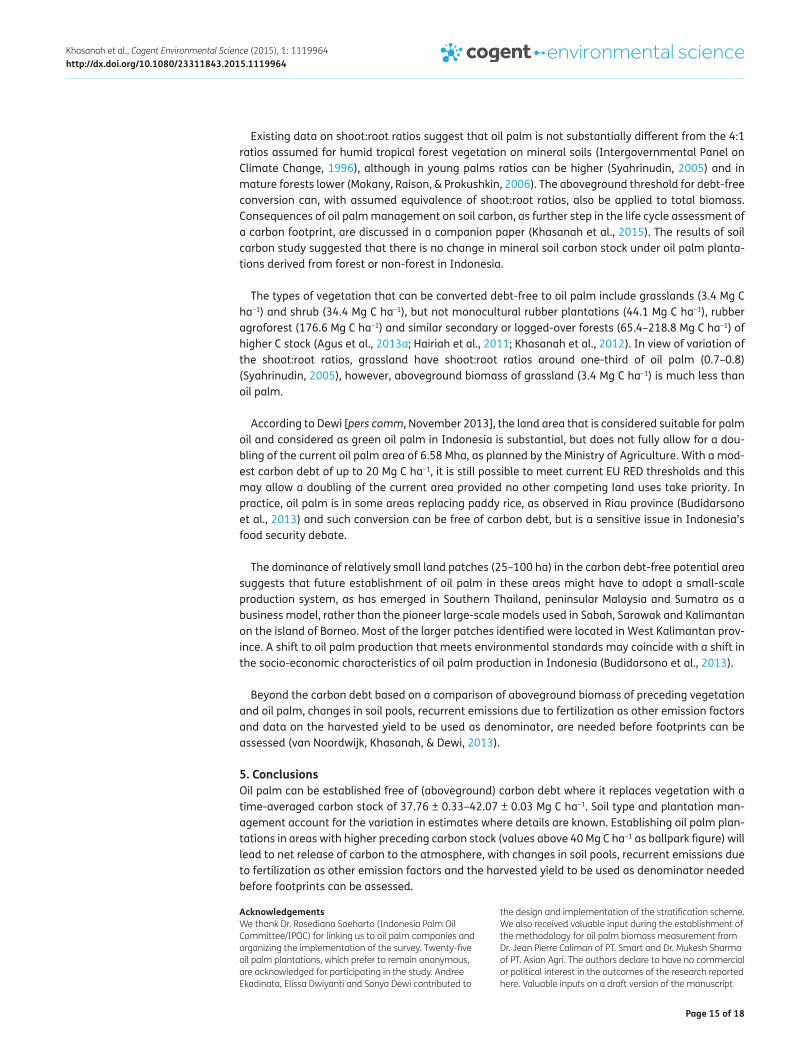
3.2.2. Time-averaged aboveground carbon stock of oil palm plantationTable 3 presents different models (linear and power) to estimate the time-averaged total above-ground carbon stock of oil palm plantations with different soil types and plantation management. Both in mineral and peat soil in all plantation management, linear model has higher R2. The
Figure 5. (A) Correlation between age of palm and understory; and (B) Standing litter stock. Both expressed in (Mg ha−1) under different plantation management conditions.
Figure 6. Correlation between age of palm and necromass (Mg ha−1).
Page 14 of 18
Khasanah et al., Cogent Environmental Science (2015), 1: 1119964http://dx.doi.org/10.1080/23311843.2015.1119964
time-averaged carbon stock of oil palm under nucleus management and its 95% confidence interval is 42.07 (42.04–42.10) Mg C ha−1 and 40.03 (39.75–40.30) Mg C ha−1 on mineral and peat soils, respec-tively. The time-averaged total aboveground carbon stock of oil palm plantations established on mineral soil under plasma or independent management was estimated at 37.76 (37.42–38.09) Mg C ha−1.
4. DiscussionBiomass accumulation of oil palm on mineral and peat soils as a function of trunk height can be well described by a linear regression equation. These results were consistent with other studies reported by Corley and Tinker (2003), Khalid et al. (1999) and Henson (2004). Overall, this study revealed that soil type and plantation management styles result in different time-averaged carbon stocks in oil palm plantations. Time averaged C stocks range from 37.8 to 42.1 Mg C ha−1 for the clusters de-scribed here. These values include the frond bases attached to the trunk, understorey vegetation, litter production and necromass; and 90–95% of the time-averaged aboveground carbon stock in the oil palm biomass. This figure is based on an average density of 138 palms per ha and will have to be modified for plantations with significantly lower palm density, or different rotation length.
If we assume, in the absence of a full assessment of stratum weights, that the average across our samples in the various clusters represents typical conditions for Indonesian palm oil production, the resulting estimate of time-averaged C stock is slightly higher than obtained in previous studies. Previous studies have been generally based on smaller data-sets. Germer and Sauerborn (2008) es-timated a value around 29.69 Mg C ha−1(based on 51 studied plots); Henson (2003) 36 Mg C ha−1; Palm et al. (2004) 36.4 Mg C ha−1; and Dewi et al. (2009) 36.95 Mg C ha−1(based on 13 studied plots). Palm density, the inclusion of all aboveground carbon-stock pools, soil types and variations in man-agement can be major sources of different results. Most of the literature did not provide complete information on the terms included. The present data-set has a much broader empirical basis than the values published before.
A value of 36 Mg C ha−1 has been used as basis for estimates of historical carbon emissions due to oil palm development in Southeast Asia (Agus et al., 2013b). For ease of use and in view of the level of precision of terrestrial carbon-stock data, we propose that a value of 40 Mg C ha−1 in aboveground stocks can still be used as the threshold for carbon debt-free land conversion. For that reason, our results lead to a clear rejection of the 75 Mg C ha−1 proposal of Raison et al. (2015) as threshold value for aboveground carbon (AGC) of land that can be converted to oil palm with a claim to be carbon neutral at plot level. Whether or not landscape-level compensation can justify use of the term “car-bon neutral” is open to debate.
Table 3. Time-averaged total aboveground carbon stock of oil-palm plantations with different soil types and plantation management
1Averaged over a cycle of 25 years ± standard deviation of plot-level measurements.
Growth equation
Soil type Plantation management
a b R2 Time-averaged total carbon
stock (Mg C ha−1)1
Model I: Y = aA + b
Mineral Nucleus 2.8167 6.8648 0.8478 42.07 ± 0.03
Plasma/indepen-dent
2.5449 5.0007 0.8441 37.76 ± 0.33
Peat Nucleus 2.5822 7.074 0.8404 40.03 ± 0.27
Model II: Y = aAb
Mineral Nucleus 6.6671 0.7318 0.8426 42.32 ± 0.19
Plasma/indepen-dent
6.5858 0.6615 0.8054 36.36 ± 0.54
Peat Nucleus 8.7558 0.5836 0.8161 41.71 ± 0.67
Page 15 of 18
Khasanah et al., Cogent Environmental Science (2015), 1: 1119964http://dx.doi.org/10.1080/23311843.2015.1119964
Existing data on shoot:root ratios suggest that oil palm is not substantially different from the 4:1 ratios assumed for humid tropical forest vegetation on mineral soils (Intergovernmental Panel on Climate Change, 1996), although in young palms ratios can be higher (Syahrinudin, 2005) and in mature forests lower (Mokany, Raison, & Prokushkin, 2006). The aboveground threshold for debt-free conversion can, with assumed equivalence of shoot:root ratios, also be applied to total biomass. Consequences of oil palm management on soil carbon, as further step in the life cycle assessment of a carbon footprint, are discussed in a companion paper (Khasanah et al., 2015). The results of soil carbon study suggested that there is no change in mineral soil carbon stock under oil palm planta-tions derived from forest or non-forest in Indonesia.
The types of vegetation that can be converted debt-free to oil palm include grasslands (3.4 Mg C ha−1) and shrub (34.4 Mg C ha−1), but not monocultural rubber plantations (44.1 Mg C ha−1), rubber agroforest (176.6 Mg C ha−1) and similar secondary or logged-over forests (65.4–218.8 Mg C ha−1) of higher C stock (Agus et al., 2013a; Hairiah et al., 2011; Khasanah et al., 2012). In view of variation of the shoot:root ratios, grassland have shoot:root ratios around one-third of oil palm (0.7–0.8) (Syahrinudin, 2005), however, aboveground biomass of grassland (3.4 Mg C ha−1) is much less than oil palm.
According to Dewi [pers comm, November 2013], the land area that is considered suitable for palm oil and considered as green oil palm in Indonesia is substantial, but does not fully allow for a dou-bling of the current oil palm area of 6.58 Mha, as planned by the Ministry of Agriculture. With a mod-est carbon debt of up to 20 Mg C ha−1, it is still possible to meet current EU RED thresholds and this may allow a doubling of the current area provided no other competing land uses take priority. In practice, oil palm is in some areas replacing paddy rice, as observed in Riau province (Budidarsono et al., 2013) and such conversion can be free of carbon debt, but is a sensitive issue in Indonesia’s food security debate.
The dominance of relatively small land patches (25–100 ha) in the carbon debt-free potential area suggests that future establishment of oil palm in these areas might have to adopt a small-scale production system, as has emerged in Southern Thailand, peninsular Malaysia and Sumatra as a business model, rather than the pioneer large-scale models used in Sabah, Sarawak and Kalimantan on the island of Borneo. Most of the larger patches identified were located in West Kalimantan prov-ince. A shift to oil palm production that meets environmental standards may coincide with a shift in the socio-economic characteristics of oil palm production in Indonesia (Budidarsono et al., 2013).
Beyond the carbon debt based on a comparison of aboveground biomass of preceding vegetation and oil palm, changes in soil pools, recurrent emissions due to fertilization as other emission factors and data on the harvested yield to be used as denominator, are needed before footprints can be assessed (van Noordwijk, Khasanah, & Dewi, 2013).
5. ConclusionsOil palm can be established free of (aboveground) carbon debt where it replaces vegetation with a time-averaged carbon stock of 37.76 ± 0.33–42.07 ± 0.03 Mg C ha−1. Soil type and plantation man-agement account for the variation in estimates where details are known. Establishing oil palm plan-tations in areas with higher preceding carbon stock (values above 40 Mg C ha−1 as ballpark figure) will lead to net release of carbon to the atmosphere, with changes in soil pools, recurrent emissions due to fertilization as other emission factors and the harvested yield to be used as denominator needed before footprints can be assessed.
AcknowledgementsWe thank Dr. Rosediana Soeharto (Indonesia Palm Oil Committee/IPOC) for linking us to oil palm companies and organizing the implementation of the survey. Twenty-five oil palm plantations, which prefer to remain anonymous, are acknowledged for participating in the study. Andree Ekadinata, Elissa Dwiyanti and Sonya Dewi contributed to
the design and implementation of the stratification scheme. We also received valuable input during the establishment of the methodology for oil palm biomass measurement from Dr. Jean Pierre Caliman of PT. Smart and Dr. Mukesh Sharma of PT. Asian Agri. The authors declare to have no commercial or political interest in the outcomes of the research reported here. Valuable inputs on a draft version of the manuscript
Page 16 of 18
Khasanah et al., Cogent Environmental Science (2015), 1: 1119964http://dx.doi.org/10.1080/23311843.2015.1119964
were also received from Dr. Johannes Dietz of the World Agroforestry Centre and from anonymous reviewers.
FundingThis research was financially supported by the Dutch Government through the project “Reducing carbon emissions associated with oil palm plantations in Indonesia: accounting for greenhouse gas emissions over the full life cycle on peat and mineral soils and building capacity for and industry response to emerging environmental regulation in European markets”. Further support for the preparation and publication of the manuscript was obtained from NORAD (Securing Ecosystems and Carbon benefits by Unlocking Reversal of Emissions Drivers in Landscapes) and the Forests, Trees and Agroforestry (FTA) research program of the CGIAR.
Author detailsNi’matul Khasanah1,2
E-mail: [email protected] van Noordwijk1,2
E-mail: [email protected] Ningsih1,3
E-mail: [email protected] ID: http://orcid.org/0000-0002-3868-26201 World Agroforestry Centre (ICRAF), Southeast Asia Regional
Programme, Jl. CIFOR, Situgede, Sindang Barang, Bogor, 16115, PO Box 161, Bogor 16001, Indonesia.
2 Plant Production Systems, Department of Plant Sciences, Wageningen University, Wageningen, The Netherland.
3 ZSL Indonesia, Jl. Papandayan No. 18, Bogor 16151, Indonesia.
Citation informationCite this article as: Aboveground carbon stocks in oil palm plantations and the threshold for carbon-neutral vegetation conversion on mineral soils, Ni’matul Khasanah, Meine van Noordwijk & Harti Ningsih, Cogent Environmental Science (2015), 1: 1119964.
ReferencesAdachi, M., Ito, A., Ishida, A., Kadir, W., Ladpala, P., & Yamagata,
Y. (2011). Carbon budget of tropical forests in Southeast Asia and the effects of deforestation: An approach using a process-based model and field measurements. Biogeosciences, 8, 2635–2647. http://dx.doi.org/10.5194/bg-8-2635-2011
Agus, F., Henson, I. E., Sahardjo, B. H., Harris, N., van Noordwijk, M., & Killeen, T. J. (2013a). Review of emission factors for assessment of CO2 emission from land use change to oil palm in Southeast Asia. In T. J. Killeen & J. Goon (Eds.), Reports from the technical panels of the second greenhouse gas working group of the roundtable for sustainable palm oil (RSPO) (pp. 7–27). Kuala Lumpur: RSPO. Retrieved from http://www.rspo.org/file/GHGWG2/3_review_of_emission_factors_Agus_et_al.pdf
Agus, F., Gunarso, P, Sahardjo, B. H., Harris, N., van Noordwijk, M., & Killeen, T. J. (2013b). Historical CO2 emissions from land use and land cover change from the oil palm industry in Indonesia, Malaysia and Papua New Guinea. In T. J. Killeen & J. Goon (Eds.), Reports from the technical panels of the second greenhouse gas working group of the roundtable for sustainable palm oil (RSPO) (pp. 65–88). Kuala Lumpur: RSPO. Retrieved from http://www.rspo.org/file/GHGWG2/5_historical_CO2_emissions_Agus_et_al.pdf
Aldrian, E., & Susanto, R. D. (2003). Identification of three dominant rainfall regions within Indonesia and their relationship to sea surface temperature. International Journal of Climatology, 23, 1435–1452. http://dx.doi.org/10.1002/(ISSN)1097-0088
Barlow, C., Zahari, Z., & Ria, G. (2003). The Indonesian palm oil industry. Oil Palm Industry Economic Journal, 3, 8–15.
Budidarsono, S., Susanti, A., & Zoomers, A. (2013). Oil palm plantations in Indonesia: The implications for migration, settlement/resettlement and local economic development. In Z. Fang (Ed.), Biofuels—Economy, environment and sustainability (pp. 173–193). Rijeka: InTech. doi:10.5772/53586
Carlson, K. M., Curran, L. M., Ratnasari, D., Pittman, A. M., Soares-Filho, B. S., Asner, G. P., … Rodrigues, H. O. (2012). Committed carbon emissions, deforestation, and community land conversion from oil palm plantation expansion in West Kalimantan, Indonesia. Proceedings of the National Academy of Sciences, 109, 7559–7564. http://dx.doi.org/10.1073/pnas.1200452109
Choo, Y., Muhamad, H., Hashim, Z., Subramaniam, V., Puah, C., & Tan, Y. (2011). Determination of GHG contributions by subsystems in the oil palm supply chain using the LCA approach. International Journal of Life Cycle Assessment, 16, 669–681. http://dx.doi.org/10.1007/s11367-011-0303-9
Corley, R. H. V., & Tinker, P. B. (2003). The oil palm (4th ed., 562 p.). Hoboken, NJ: Wiley. http://dx.doi.org/10.1002/9780470750971
Danielsen, F., Beukema, H., Burgess, N. D., Parish, F., Brühl, C. A., Donald, P. F., … Fitzherbert, E. B. (2009). Biofuel plantations on forested lands: Double jeopardy for biodiversity and climate. Conservation Biology, 23, 348–358. http://dx.doi.org/10.1111/cbi.2009.23.issue-2
Davis, S. C., Anderson-Teixeira, K. J., & DeLucia, E. H. (2009). Life-cycle analysis and the ecology of biofuels. Trends in Plant Science, 14, 140–146. http://dx.doi.org/10.1016/j.tplants.2008.12.006
Davis, S. C., Boddey, R. M., Alves, B. J. R., Cowie, A., George, B. H., Ogle, S. M., … van Wijk, M. T. (2013). Management swing potential for bioenergy crops. GCB Bioenergy, 5, 623–638. http://dx.doi.org/10.1111/gcbb.2013.5.issue-6
Demirbas, A. (2007). Importance of biodiesel as transportation fuel. Energy Policy, 35, 4661–4670. http://dx.doi.org/10.1016/j.enpol.2007.04.003
Dewi, S., Khasanah, N., Rahayu, S., Ekadinata, A., & van Noordwijk, M. (2009). Carbon footprint of Indonesian palm oil production: A Pilot study. Bogor: World Agroforestry Centre - ICRAF, SEA Regional Office.
Direktorat Jenderal Perkebunan. (2014). Statistik perkebunan Indonesia (tree crop estate statistics of Indonesia), 2013–2015, Kelapa Sawit (oil palm). Jakarta: Author.
EPA. (2010). Renewable fuel standard program (RFS2) regulatory impact analysis. Washington, DC: US Environmental Protection Agency.
Fargione, J., Hill, J., Tilman, D., Polasky, S., & Hawthorne, P. (2008). Land clearing and the biofuel carbon debt. Science, 319, 1235–1238. http://dx.doi.org/10.1126/science.1152747
George, B., & Cowie, A. (2011). Bioenergy systems, soil health and climate change. In B. Singh, A. Cowie, & K. Chang (Eds.), Soil health and climate change (pp. 369–397). Springer Berlin Heidelberg.
Germer, J., & Sauerborn, J. (2008). Estimation of the impact of oil palm plantation establishment on greenhouse gas balance. Environment, Development and Sustainability, 10, 697–716. http://dx.doi.org/10.1007/s10668-006-9080-1
Gibbs, H. K., Johnston, M., Foley, J. A., Holloway, T., Chad, M., Ramankutty, N., & Zaks, D. (2008). Carbon payback times for crop-based biofuel expansion in the tropics: The effects of changing yield and technology. Environmental research letters, 3, 1–10.
Hairiah, K., Dewi, S., Agus, F., Velarde, S. J., Ekadinata, A., Rahayu, S., & van Noordwijk, M. (2011). Measuring carbon stocks across land use systems: A manual (p. 154). Bogor: World Agroforestry Centre - ICRAF, SEA Regional Office.
Hassan, M., Jaramillo, P., & Griffin, W. (2011). Life cycle GHG emissions from Malaysian oil palm bioenergy development: The impact on transportation sector's
Page 17 of 18
Khasanah et al., Cogent Environmental Science (2015), 1: 1119964http://dx.doi.org/10.1080/23311843.2015.1119964
energy security. Energy Policy, 39, 2615–2625. http://dx.doi.org/10.1016/j.enpol.2011.02.030
Henson, I. E. (1999). Comparative ecophysiology of oil palm and tropical rain forest. In G. Singh, L. K. Huan, T. Leng, & D. L. Kow (Eds.), Oil palm and the environment—A Malaysian perspective (pp. 9–39). Kuala Lumpur: Malaysian Oil Palm Growers Council.
Henson, I. E. (2003). The Malaysian national average oil palm: Concept and evaluation. Oil Palm Bulletin, 14, 15–27.
Henson, I. E. (2004). Modelling carbon sequestration and emissions related to oil palm cultivation and associated land use change in Malaysia (MPOB Technology bulletin 27). Kuala Lumpur: Malaysian Palm Oil Board.
Intergovernmental Panel on Climate Change. (1997). Land use change & forestry. In J. T. Houghton, L. G. Meira Filho, B. Lim, K. Treanton, I. Mamaty, Y. Bonduki, … B. A. Callander (Eds.), Revised 1996 IPCC guidelines for National Greenhouse Inventories. Paris: IPCC/OECD/IEA.
Jourdan, C., & Rey, H. (1997). Modelling and simulation of the architecture and development of the oil palm (Elaeis guineensis Jacq.) root system. Plant and Soil, 190, 235–246. http://dx.doi.org/10.1023/A:1004270014678
Khalid, H., Zin, Z. Z., & Anderson, J. M. (1999). Quantification of oil palm biomass and nutrient value in a mature plantation. I Above-ground Biomass. Journal of Oil Palm Research, 1, 23–32.
Khasanah, N., van Noordwijk, M., Ekadinata, A., Dewi, S., Rahayu, S., Ningsih, H., … Octaviani, R. (2012). The carbon footprint of Indonesian palm oil production (Technical Brief No 25: palm oil series, 10 p.). Bogor: World Agroforestry Centre - ICRAF, SEA Regional Office.
Khasanah, N., van Noordwijk, M., Ningsih, H., & Rahayu, S. (2015). Carbon neutral? No change in mineral soil carbon stock under oil palm plantations derived from forest or non-forest in Indonesia. Agriculture, Ecosystems and Environment, 211, 195–206. http://dx.doi.org/10.1016/j.agee.2015.06.009
Koh, L. P., Gibbs, H. K., Potapov, P. V., & Hansen, M. C. (2012). REDDcalculator.com: A web-based decision-support tool for implementing Indonesia’s forest moratorium. Methods in Ecology and Evolution, 3, 310–316. http://dx.doi.org/10.1111/j.2041-210X.2011.00147.x
Koh, L. P., & Wilcove, D.S. (2008). Is oil palm agriculture really destroying tropical biodiversity? Conservation Letters, 1, 60–64. http://dx.doi.org/10.1111/j.1755-263X.2008.00011.x
McCarthy, J. F. (2010). Processes of inclusion and adverse incorporation: oil palm and agrarian change in Sumatra, Indonesia. Journal of Peasant Studies, 37, 821–850. http://dx.doi.org/10.1080/03066150.2010.512460
Mokany, K., Raison, R. J., & Prokushkin, A. S. (2006). Critical analysis of root: Shoot ratios in terrestrial biomes. Global Change Biology, 12, 84–96. http://dx.doi.org/10.1111/gcb.2006.12.issue-1
Murdiyarso, D., Hergoualc’h, K., & Verchot, L. V. (2010). Opportunities for reducing greenhouse gas emissions in tropical peatlands. Proceedings of the National Academy of Sciences, 107, 19655–19660. http://dx.doi.org/10.1073/pnas.0911966107
Niedermeyer, E. M., Sessions, A. L., Feakins, S. J., & Mohtadi, M. (2014). Hydroclimate of the western Indo-Pacific warm pool during the past 24,000 years. Proceedings of the National Academy of Sciences, 111, 9402–9406. http://dx.doi.org/10.1073/pnas.1323585111
Nogueira, L. (2010). Does biodiesel make sense? Energy, 36, 3659–3666.
Pahan, I. (2006). Panduan Lengkap Kelapa Sawit: Manajemen Agribisnis dari Hulu hingga Hilir [Complete guide of oil palm: Agribusiness management from upstream to downstream] (411 p.). Jakarta: Penebar Swadaya.
Palm, C., Tomich, T., Van Noordwijk, M., Vosti, S., Gockowski, J., Alegre, J., & Verchot, L. (2004). Mitigating GHG emissions
in the humid tropics: Case Studies from the alternatives to slash-and-burn program (ASB). Environment, Development and Sustainability, 6, 145–162. http://dx.doi.org/10.1023/B:ENVI.0000003634.50442.ca
Porankiewicz, B., Iskra, P., Sandak, J., Tanaka, C., & Jóźwiak, K. (2006). High-speed steel tool wear during wood cutting in the presence of high-temperature corrosion and mineral contamination. Wood Science and Technology, 40, 673–682. http://dx.doi.org/10.1007/s00226-006-0084-7
Raison, J., Atkinson, P., Chave, J., DeFries, R., Joo, G.K., Joosten, H., … Siegert, F. (2015). HCS+, A new pathway to sustainable oil palm development, draft extended summary. Retrieved October 7, 2015 from http://www.carbonstockstudy.com/carbonstockstudy/files/f6/f63fcf9e-10e1-47f8-bfbd-3b9e01505cec.pdf.
Reijnders, L. (2011). The life cycle emission of greenhouse gases associated with plant oils used as biofuel. Renewable Energy, 36, 879–880. http://dx.doi.org/10.1016/j.renene.2010.07.003
Reijnders, L., & Huijbregts, M. A. J. (2008). Palm oil and the emission of carbon-based greenhouse gases. Journal of Cleaner Production, 16, 477–482. http://dx.doi.org/10.1016/j.jclepro.2006.07.054
Rowaan, P. A. (1936). Palmoli [Oil palm]. De Indische Mercuur, 59, 353–363.
Santoso, A. (2010). Plasma and its accounting implications. In Palm oil plantation: Industry landscape, regulatory and financial overview. Indonesia: PricewaterhouseCoopers.
Searchinger, T., Heimlich, R., Houghton, R. A., Dong, F., Elobeid, A., Fabiosa, J., … Yu, T.-H. (2008). Use of US croplands for biofuels increases greenhouse gases through emissions from land-use change. Science, 319, 1238–1240. http://dx.doi.org/10.1126/science.1151861
Sheil, D., Casson, A., Meijaard, E., van Noordwijk, M., Gaskell, J., Sunderland-Groves, J., … Kanninen, M. (2009). The impacts and opportunities of oil palm in Southeast Asia. Bogor: Center for International Forestry Research (CIFOR).
Siangjaeo, S., Gheewala, S., Unnanon, K., & Chidthaisong, A. (2011). Implications of land use change on the life cycle greenhouse gas emissions from palm biodiesel production in Thailand. Energy for Sustainable Development, 15, 1–7. http://dx.doi.org/10.1016/j.esd.2011.01.002
Syahrinudin. (2005). The potential of oil palm and forest plantations for carbon sequestration on degraded land in Indonesia. In M. Denich, C. Martius, & C. Rodgers, & N. van de Giesen (Eds.), Ecology and Development Series No. 28. Göttingen: Cuvillier Verlag.
Tan, K. T., Lee, K. T., Mohamed, A. R., & Bhatia, S. (2009). Palm oil: Addressing issues and towards sustainable development. Renewable and Sustainable Energy Reviews, 13, 420–427. http://dx.doi.org/10.1016/j.rser.2007.10.001
The European Commission. (2010). Guideline for the calculation of land carbon stocks for the purpose of Annex V of Directive 2009/28/EC (notified under document C(2010) 3751) (2010/335/EU). Official Journal of the European Union.
Thoenes, P. (2006, October 24–25). Biofuels and commodity markets—Palm oil focus 1. In AgraInforma conference “The Impact of biofuels on commodity Markets”. Brussels.
van Noordwijk, M., Cerri, C., Woomer, P. L., Nugroho, K., & Bernoux, M. (1997). Soil carbon dynamics in the humid tropical forest zone. Geoderma, 79, 187–225. http://dx.doi.org/10.1016/S0016-7061(97)00042-6
van Noordwijk, M., Khasanah, N., & Dewi S. (2013). Biofuel emission reduction estimator scheme (BERES): Land-use history, production systems and technical emission factors. In M. van Noordwijk, B. Lusiana, B. Leimona, S. Dewi, D. Wulandari (Eds.), Negotiation-support toolkit for learning landscapes (pp. 157–162). Bogor: World Agroforestry Centre (ICRAF) Southeast Asia Regional Program.

Page 18 of 18
Khasanah et al., Cogent Environmental Science (2015), 1: 1119964http://dx.doi.org/10.1080/23311843.2015.1119964
© 2015 The Author(s). This open access article is distributed under a Creative Commons Attribution (CC-BY) 4.0 license.You are free to: Share — copy and redistribute the material in any medium or format Adapt — remix, transform, and build upon the material for any purpose, even commercially.The licensor cannot revoke these freedoms as long as you follow the license terms.
Under the following terms:Attribution — You must give appropriate credit, provide a link to the license, and indicate if changes were made. You may do so in any reasonable manner, but not in any way that suggests the licensor endorses you or your use. No additional restrictions You may not apply legal terms or technological measures that legally restrict others from doing anything the license permits.
Cogent Environmental Science (ISSN: 2331-1843) is published by Cogent OA, part of Taylor & Francis Group. Publishing with Cogent OA ensures:• Immediate, universal access to your article on publication• High visibility and discoverability via the Cogent OA website as well as Taylor & Francis Online• Download and citation statistics for your article• Rapid online publication• Input from, and dialog with, expert editors and editorial boards• Retention of full copyright of your article• Guaranteed legacy preservation of your article• Discounts and waivers for authors in developing regionsSubmit your manuscript to a Cogent OA journal at www.CogentOA.com


![repository.uhamka.ac.idrepository.uhamka.ac.id/463/1/Khasanah Intelektual Pesantren EDIT [compress].pdfFEMINISME DAN KONSEP KESETARAAN GENDER BAB 1 PENDAHULUAN A. Latar Belakang Masalah](https://static.fdocuments.us/doc/165x107/5d07251e88c99362028c0c95/intelektual-pesantren-edit-compresspdffeminisme-dan-konsep-kesetaraan-gender.jpg)

