ABOUT TURKEY Young Population Economic Size Geopolitical Position Logistic Advantage Investment...
44
ABOUT TURKEY Establishm entDate ofTurkish Republic 29O ctober1923 Official Language TURKISH Capital Ankara Num berofthe Cities 81 Citiesthathasthe m ostPopulation Intensity Istanbul Approxim ate Population ofIstanbul (31.12.2013) 14.160.467 Surface AreaofTurkey 814thousand 578km 2 Place in the W orld Accordingto the Surface Area 33 Population ofTurkey-Total 2013 76.667.864 Consum erPrice Index-Yearly(% )M ay2014 9,7% Unem ploym entRate (% )February2014 10,2% GDP Grow th Rate (% )1stTerm 2014 4,3% Num berofUniversities(Approxim ate) 183 Place ofthe M iddle EastTechnical University in the Top 100U niversitiesin the W orld List Line ofCom m unications Railroad 11.940 Km M ain Road 450.000Km W aterw ay 1.200Km AirportNum ber 120Unit Natural GasLine 12.528 Km Crude Oil Pipes 3.038Km HeliportNum ber 850Unit Bulgaria Greece Arm enia Georgia Syria Iraq Persia 53 NeighboringCountries • Young Population • Economic Size • Geopolitical Position • Logistic Advantage • Investment Opportunities
-
Upload
nicholas-hawkins -
Category
Documents
-
view
219 -
download
0
Transcript of ABOUT TURKEY Young Population Economic Size Geopolitical Position Logistic Advantage Investment...

ABOUT TURKEYEstablishment Date of Turkish Republic 29 October 1923Official Language TURKISHCapital AnkaraNumber of the Cities 81 Cities that has the most Population Intensity IstanbulApproximate Population of Istanbul (31.12.2013) 14.160.467 Surface Area of Turkey 814 thousand 578 km2 Place in the World According to the Surface Area 33 Population of Turkey - Total 2013 76.667.864 Consumer Price Index -Yearly (%) May 2014 9,7%Unemployment Rate (%) February 2014 10,2%GDP Growth Rate (%)1st Term 2014 4,3%Number of Universities (Approximate) 183 Place of the Middle East Technical Universityin the Top 100 Universities in the World ListLine of Communications
Railroad 11.940 KmMain Road 450.000 KmWaterway 1.200 Km
Airport Number 120 UnitNatural Gas Line 12.528 KmCrude Oil Pipes 3.038 Km
Heliport Number 850 UnitBulgariaGreece
ArmeniaGeorgia
SyriaIraq
Persia
53
Neighboring Countries
• Young Population
• Economic Size
• Geopolitical Position
• Logistic Advantage
• Investment Opportunities


NEAR EUROPE & NEAR ASIA
ABOUT TURKEY


81 CITIES
ABOUT TURKEY

ABOUT TURKEY

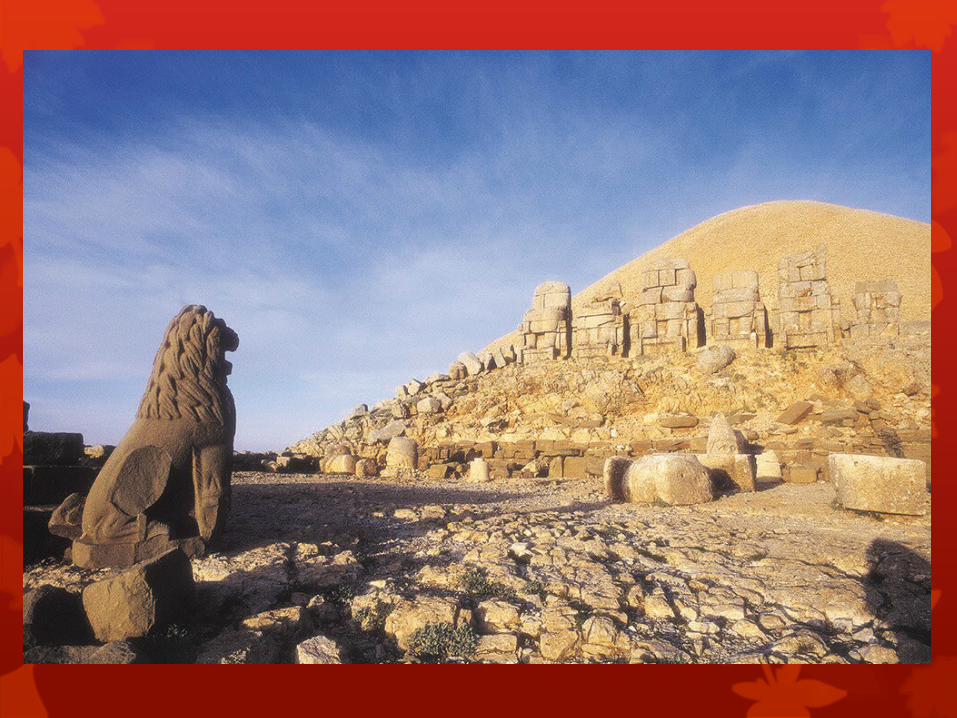
EVERYWHERE IS BEATIFUL
ABOUT TURKEY


ECONOMY & COMPANIES
Number of merchants and craftsmen businesses (approximate) 1.500.000 TOTAL COMPANY NUMBER 972.491
Limited Company (%81,5) 792.580 Stock Corporations (%11) 106.974
Other Company Types (%7,5) 72.937 Little Private Companies 570.509
Number of Foreign Companies - by the end of 2013 36.450 GDP by the end of 2013 - $ 820 Billion $GDP Growth Rate in 2013 %4Entrance of Direct Foreign Investment in 2013 12,9 Billion $Economic Size in the World 17
Number of Companies: 1.500.000
Number of Foreign Companies: 36.450
National Income: 820 Billion $
National Income/individual: 10.800 $
Growth Rate: 4%


POPULATION
PopulationProportion
(%)Population
Proportion(%)
Toplam-Total 74.525.696 100% 37 431 004 50,2 37 094 692 49,8
İstanbul 13.565.798 18,20% 6 819 253 50,3 6 746 545 49,7
Ankara 4.868.418 6,53% 2 428 942 49,9 2 439 476 50,1
İzmir 3.952.036 5,30% 1 973 048 49,9 1 978 988 50,1
Bursa 2.640.128 3,54% 1 319 607 50,0 1 320 521 50,0
Adana 2.102.375 2,82% 1 049 307 49,9 1 053 068 50,1
Antalya 2.035.563 2,73% 1 029 543 50,6 1 006 020 49,4
Konya 2.033.227 2,73% 1 007 211 49,5 1 026 016 50,5
Gaziantep 1.739.569 2,33% 876 140 50,4 863 429 49,6
Şanlıurfa 1.701.127 2,28% 850 505 50,0 850 622 50,0
Mersin 1.660.522 2,23% 827 561 49,8 832 961 50,2
Population of Provinces by Sex, 2 October 2011
Province TotalMale Female
Proportion(%)
Population - 2011 : 74.525.696
Population - 2013 : 76.667.864


POPULATIONfrom 1927 to 2013
Year Population %±1927 14.874.387 —1935 16.158.567 8.6 %1940 17.821.543 10.3 %1945 18.790.987 5.4 %1950 20.947.155 11.5 %1955 24.065.544 14.9 %1960 27.755.532 15.3 %1965 31.391.651 13.1 %1970 35.605.653 13.4 %1975 40.348.789 13.3 %1980 44.737.321 10.9 %1985 50.664.654 13.2 %1990 56.473.653 11.5 %2000 67.804.543 20.1 %2007 70.586.256 4.1 %2010 73.722.988 4.4 %2013 76.667.864 4.0 %
POPULATION ACCORDING TO YEARS
Population Growth: from 1927 to 2013 62.000.000
2050 = 95.000.000


ECONOMIC TERRITORIES ACCORDING TO THE CITIES AND REGIONS
Ecomonic Intensity: Istanbul - Ankara - Izmir


TOURISMAgricultureindustry
Tourism
IndustryLogisticTourism
Tourism TourismTourism Logistic
Agriculture
Agriculture
Agriculture
Agriculture
Industry
Agriculture
AgricultureAgriculture
IndustryAgriculture
Agriculture
IndustryAgriculture
servıces
Industry
Industry
IndustryAgriculture
Agriculture
AgricultureLogistic
IndustryIndustry
IndustryAgriculture
ServiceIndustryLogistic
ServiceIndustry,Agriculture
LogisticIndustryAgriculture
Services : %65
Agriculture : %10
Industry: %25


INFORMATION ABOUT EXPORT
Exports by country group and yearDeğer/Value: Bin-Thousand $
Country Groups 2013 2012 2011 2010
TOTAL 151.786.976 152.461.737 134.906.869 113.883.219
EUROPEAN UNION (EU 28) 63.026.233 59.398.377 62.589.257 52.934.452
7-Near and Middle Eastern 35.575.050 42.451.153 27.934.772 23.294.873
1-Other European Countries 14.214.496 14.166.917 12.734.548 11.124.225
8-Other Asian Countries 12.017.342 10.574.649 10.199.361 8.580.833
2-North African Countries 10.042.319 9.443.604 6.700.805 7.025.168
4-North American Countries 6.575.941 6.662.554 5.459.299 4.242.435
3-Other African Countries 4.103.977 3.913.246 3.633.016 2.257.898
FREE ZONES IN TURKEY 2.412.831 2.294.934 2.544.721 2.083.788
6-South American Countries 2.126.991 2.191.084 1.840.351 1.237.356
5-Central America and Caraips 1.004.173 769.630 626.293 597.975
9-Australia and New Zealand 538.473 490.339 480.755 402.591
10-Other Countries 149.150 105.250 163.690 101.627
Total Export: 151 billion $
Most of the exports are done to:


Country 2013 2012 2011 2010
Total 151.786.976 152.461.737 134.906.869 113.883.219
Germany 13.703.238 13.124.375 13.950.825 11.479.066
Iraq 11.949.076 10.822.144 8.310.130 6.036.362
United Kingdom 8.772.040 8.693.599 8.151.430 7.235.861
Russia 6.964.664 6.680.777 5.992.633 4.628.153
Italy 6.716.828 6.373.080 7.851.480 6.505.277
France 6.376.786 6.198.536 6.805.821 6.054.499
USA 5.635.895 5.604.230 4.584.029 3.762.919
UAE 4.965.649 8.174.607 3.706.654 3.332.885
Spain 4.334.422 3.717.345 3.917.559 3.536.205
Iran 4.192.484 9.921.602 3.589.635 3.044.177
The first 3 countries, which exports are done:
INFORMATION ABOUT EXPORT


Imports by country groups and yearValue: Thousand $
Country Groups 2013 2012 2011 2010
Total 251.649.892 236.545.141 240.841.676 185.544.332
A-EUROPEAN UNION (EU 28) 92.446.634 87.657.462 91.439.406 72.391.053
8-Other Asian Countries 54.648.320 49.602.022 53.143.945 40.343.434
1-Other European Countries 41.319.228 37.206.446 35.668.228 30.101.101
7-Near and Middle Eastern 22.214.051 21.410.008 20.439.413 13.010.828
4-North American Countries 13.952.865 15.084.268 17.345.670 13.234.069
10-Other Countries 13.423.725 12.607.589 8.789.500 6.703.268
6-South American Countries 3.665.676 4.079.580 4.500.367 2.942.329
2-North African Countries 3.508.479 3.308.343 3.342.055 3.098.091
3-Other African Countries 2.522.630 2.613.447 3.424.658 1.725.916
5-Central America and Caraips 1.362.167 1.069.126 903.455 622.763
9-Australia and New Zealand 1.318.247 861.022 806.922 493.033
Import=250 billion $
Most of the imports are come from:
INFORMATION ABOUT IMPORT


Country 2013 2012 2011 2010
Total 251.649.892 236.545.141 240.841.676 185.544.332
Russia 25.064.214 26.625.286 23.952.914 21.600.641
China 24.685.887 21.295.242 21.693.336 17.180.806
Germany 24.181.597 21.400.614 22.985.567 17.549.112
Italy 12.884.864 13.344.468 13.449.861 10.139.888
USA 12.596.171 14.130.546 16.034.121 12.318.745
Iran 10.383.217 11.964.779 12.461.532 7.645.008
Switzerland 9.645.289 4.304.864 5.018.977 3.153.702
France 8.079.840 8.589.896 9.229.558 8.176.600
Spain 6.417.719 6.023.625 6.196.452 4.840.062
India 6.367.791 5.843.638 6.498.651 3.409.938
The top 3 countries in import:
INFORMATION ABOUT IMPORT


FOREIGN TRADE OF TURKEY, BASED ON YEARS
İhracatın
ithalatı
karşılama oranı
Balance of Volume of Foreign Trade Foreign Trade
Değer Değişim Değer Değişim Değer Değer
Yıllar Value Change Value Change Value Value
Years Bin-Thousand $ % Bin-Thousand $ % Bin-Thousand $ Bin-Thousand $ %
2013*............ 151.786.976 -0,44 251.649.892 6,39 -99.862.915 403.436.868 60,32
2012............... 152.461.737 13,01 236.545.141 -1,78 -84.083.404 389.006.877 64,45
2011............... 134.906.869 18,46 240.841.676 29,80 -105.934.807 375.748.545 56,01
2010.................... 113.883.219 11,49 185.544.332 31,66 -71.661.113 299.427.551 61,38
2009.................... 102.142.613 -22,64 140.928.421 -30,22 -38.785.809 243.071.034 72,48
2008.................... 132.027.196 23,08 201.963.574 18,76 -69.936.378 333.990.770 65,37
2007............................107.271.750 25,41 170.062.715 21,84 -62.790.965 277.334.464 63,08
2006......................................................................85.534.676 16,41 139.576.174 19,53 -54.041.498 225.110.850 61,28
2005..........................73.476.408 16,32 116.774.151 19,72 -43.297.743 190.250.559 62,92
Foreign trade by yearsDeğer / Value: Bin-Thousand $
ImportsExports
İhracat İthalatDış ticaretdengesi
Dış ticaret 'hacmi
Proportion of 'Imports
Covered by Exports


INFORMATION ABOUT EMPLOYMENT IN TURKEY
• Labour force : 25 million people
• Unemployment rate: 10%


Poppa in İzmir

Trojan Horse - Çanakkale

Zeugma - Gaziantep

Zeugma - Gaziantep

Trabzon