![Math Presentation By: [CLASSIFIED] (Not David). Introduction This presentation is all about angles. In this presentation you shall learn about: definitions,](https://static.fdocuments.us/doc/165x107/5a4d1b697f8b9ab0599b27e0/math-presentation-by-classified-not-david-introduction-this-presentation-is.jpg)
About This Presentation
29
Transcript of About This Presentation
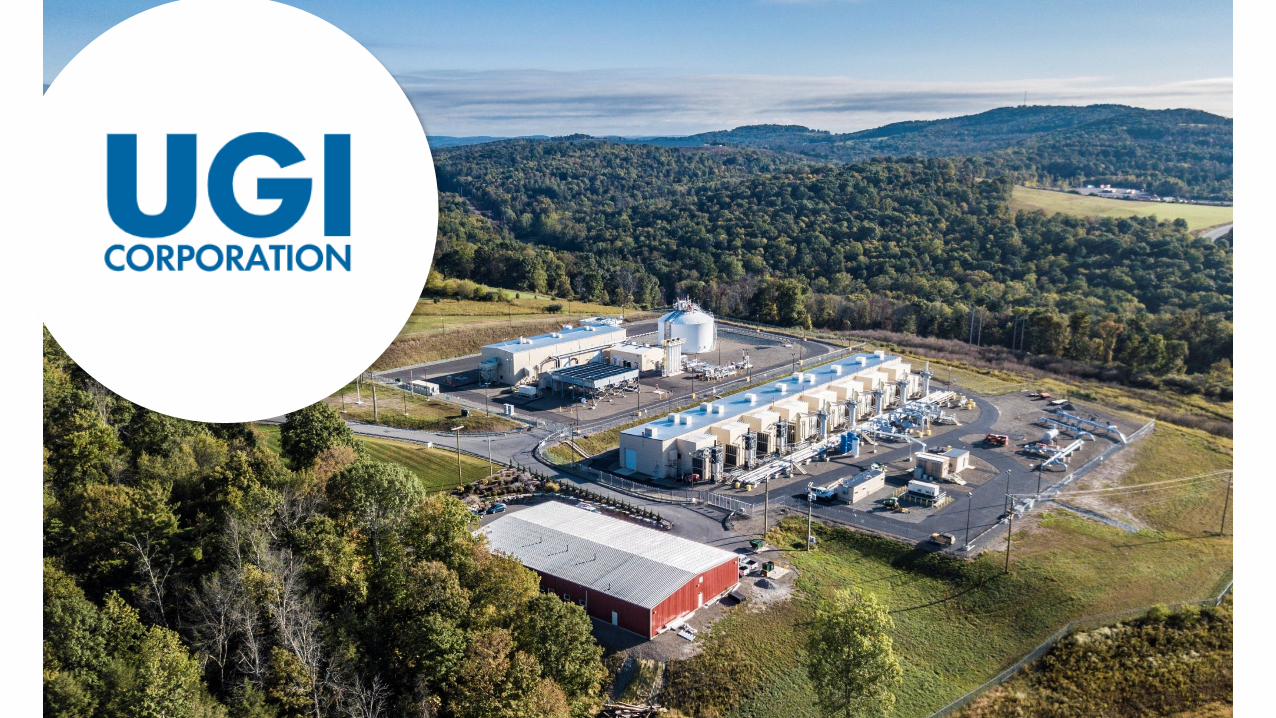
UGI
CORPORATION
About This Presentation This presentation contains certain forward-looking statements that management believes to be reasonable as of today’s date only. Actual results may differ significantly because of risks and uncertainties that are difficult to predict and many of which are beyond management’s control. You should read UGI’s Annual Report on Form 10-K for the fiscal year ended September 30, 2018, and its Quarterly Report on Form 10-Q for the three months ended March 31, 2019, for a more extensive list of factors that could affect results. Among them are adverse weather conditions, cost volatility and availability of all energy products, including propane, natural gas, electricity and fuel oil, increased customer conservation measures, the impact of pending and future legal proceedings, continued analysis of recent tax legislation, liability for uninsured claims and for claims in excess of insurance coverage, domestic and international political, regulatory and economic conditions in the United States and in foreign countries, including the current conflicts in the Middle East, and foreign currency exchange rate fluctuations (particularly the euro), the timing of development of Marcellus Shale gas production, the availability, timing and success of our acquisitions, commercial initiatives and investments to grow our business, our ability to successfully integrate acquired businesses and achieve anticipated synergies, the interruption, disruption, failure, malfunction, or breach of our information technology systems, including due to cyber-attack, the failure to realize the anticipated benefits of the AmeriGas Merger Transaction (as defined herein) , the possible diversion of management time on issues related to the AmeriGas Merger Transaction, the risk that the requisite approvals to complete the AmeriGas Merger Transaction are not obtained, the performance of AmeriGas, and the potential need to address any reviews, investigations or other proceedings by governmental authorities or shareholder actions. UGI undertakes no obligation to release revisions to its forward-looking statements to reflect events or circumstances occurring after today. In addition, this presentation uses certain non-GAAP financial measures. Please see the appendix for reconciliations of these measures to the most comparable GAAP financial measure.
2
UGI
CORPORATION
Use of Non-GAAP Measures In this presentation, Management uses certain non-GAAP financial measures, including UGI Corporation adjusted earnings per share, UGI Corporation Free Cash Flow, Midstream & Marketing Total Margin, UGI International Total Margin, and UGI France and AmeriGas Unit Margins. These financial measures are not in accordance with, or an alternative to, GAAP and should be considered in addition to, and not as a substitute for, the comparable GAAP measures. Management believes the presentation of these non-GAAP financial measures provide useful information to investors to more effectively evaluate period-over-period earnings, profitability and cash flow generation of the Company’s businesses. Reconciliations of these non-GAAP financial measures to the most directly comparable financial measure calculated and presented in accordance with GAAP are presented in the Appendix of this presentation.
3
UGI
CORPORATION
Legal Disclaimer No Offer or Solicitation
This presentation is for informational purposes only and shall not constitute an offer to sell or the solicitation of an offer to buy any securities pursuant to the proposed transaction or otherwise, nor shall there be any sale of securities in any jurisdiction in which the offer, solicitation or sale would be unlawful prior to the registration or qualification under the securities laws of any such jurisdiction. No offer of securities shall be made except by means of a prospectus meeting the requirements of Section 10 of the Securities Act of 1933, as amended.
Additional Information and Where You Can Find It
In connection with the AmeriGas Merger Transaction, UGI Corporation and AmeriGas Partners, L.P., as applicable, filed a registration statement on Form S-4, including a proxy statement/prospectus, and other related documents, including a Schedule 13E-3, with the SEC on May 6, 2019. In addition, UGI Corporation and AmeriGas Partners, L.P. each filed with the SEC on April 2, 2019 a Current Report on Form 8-K, which contained, among other things, a copy of the merger agreement and the support agreement. This presentation is not a substitute for the merger agreement, proxy statement/prospectus, the Schedule 13E-3 or any other document that UGI Corporation or AmeriGas Partners, L.P. may file with the SEC in connection with the transaction. BEFORE MAKING ANY VOTING DECISION OR ELECTION, SECURITY HOLDERS OF AMERIGAS ARE ADVISED TO CAREFULLY READ THE MERGER AGREEMENT, THE PROXY STATEMENT/PROSPECTUS (INCLUDING ALL AMENDMENTS AND SUPPLEMENTS THERETO), THE SCHEDULE 13E-3, AND ANY OTHER DOCUMENTS TO BE FILED WITH THE SEC IN CONNECTION WITH THE TRANSACTION, WHEN THEY BECOME AVAILABLE BECAUSE THEY WILL CONTAIN IMPORTANT INFORMATION ABOUT THE TRANSACTION, THE PARTIES TO THE TRANSACTION AND THE RISKS ASSOCIATED WITH THE TRANSACTION. A definitive proxy statement/prospectus will be sent to AmeriGas Partners, L.P. unitholders in connection with the special meeting. Investors and security holders may obtain a free copy of the proxy statement/prospectus (when available), the Schedule 13E-3 (when available) and other relevant documents filed by UGI Corporation or AmeriGas Partners, L.P. with the SEC from the SEC’s website at www.sec.gov. Security holders and other interested parties will also be able to obtain, without charge, a copy of the proxy statement/prospectus, the Schedule 13E-3 and other relevant documents (when available) from www.ugicorp.com under the tab “Investor Relations” and then under the heading “SEC Filings.”
Participants in the Solicitation
UGI Corporation, AmeriGas Partners, L.P., AmeriGas Propane, Inc. and each of their respective directors, executive officers and certain other members of management may be deemed to be participants in the solicitation of proxies from their respective security holders with respect to the transaction. Information about these persons is set forth in UGI Corporation’s proxy statement relating to its 2019 Annual Meeting of Shareholders, which was filed with the SEC on December 20, 2018, and AmeriGas Partners, L.P.’s Annual Report on Form 10-K for the fiscal year ended September 30, 2018, which was filed with the SEC on November 20, 2018, and subsequent statements of changes in beneficial ownership on file with the SEC. Security holders and investors may obtain additional information regarding the interests of such persons, which may be different than those of the respective companies’ security holders generally, by reading the joint proxy statement/prospectus and other relevant documents regarding the transaction, which will be filed with the SEC.
4
UGI
CORPORATION
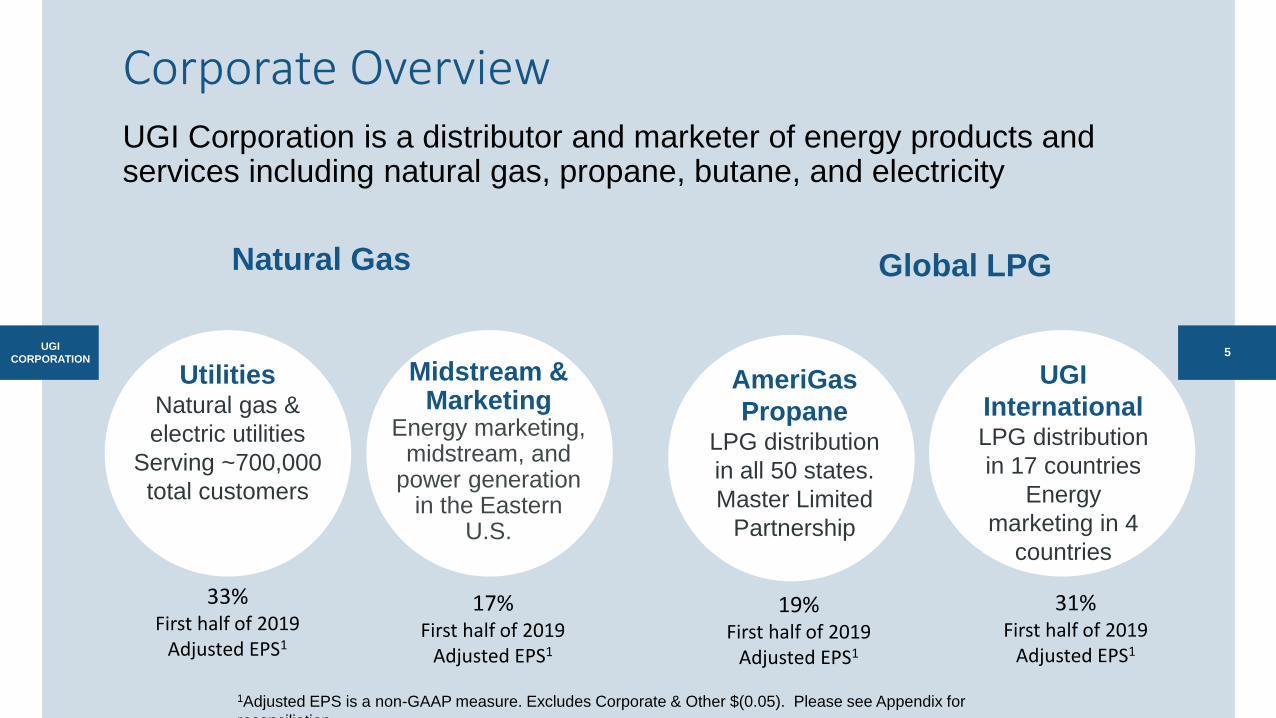
Corporate Overview UGI Corporation is a distributor and marketer of energy products and services including natural gas, propane, butane, and electricity
5
Global LPG
Natural Gas
Utilities Natural gas &
electric utilities
Serving ~700,000
total customers
Midstream & Marketing
Energy marketing, midstream, and
power generation in the Eastern
U.S.
UGI
International LPG distribution
in 17 countries
Energy
marketing in 4
countries
AmeriGas
Propane LPG distribution
in all 50 states.
Master Limited
Partnership
33% First half of 2019
Adjusted EPS1
17% First half of 2019
Adjusted EPS1
19% First half of 2019
Adjusted EPS1
31% First half of 2019
Adjusted EPS1
1Adjusted EPS is a non-GAAP measure. Excludes Corporate & Other $(0.05). Please see Appendix for
reconciliation.
UGI
CORPORATION
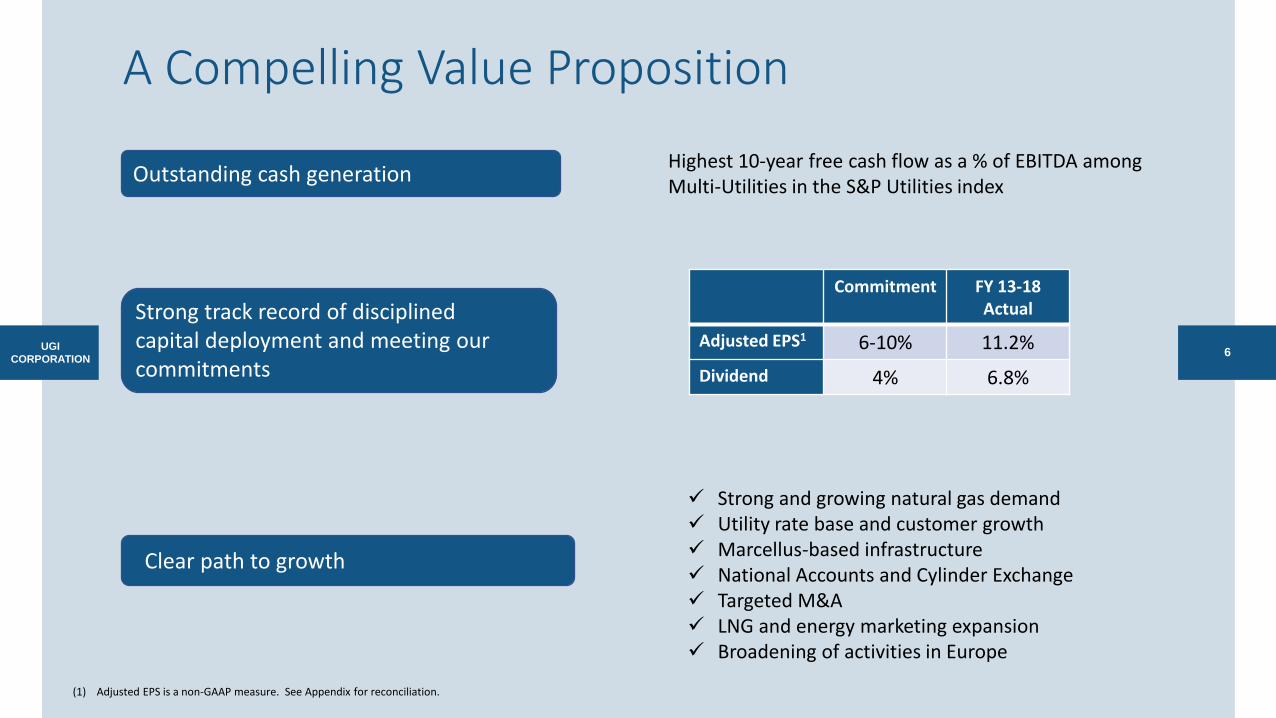
A Compelling Value Proposition
6
Outstanding cash generation
Clear path to growth
Strong track record of disciplined capital deployment and meeting our commitments
Highest 10-year free cash flow as a % of EBITDA among Multi-Utilities in the S&P Utilities index
Strong and growing natural gas demand Utility rate base and customer growth Marcellus-based infrastructure National Accounts and Cylinder Exchange Targeted M&A LNG and energy marketing expansion Broadening of activities in Europe
Commitment FY 13-18 Actual
Adjusted EPS1 6-10% 11.2%
Dividend 4% 6.8%
(1) Adjusted EPS is a non-GAAP measure. See Appendix for reconciliation.
UGI
CORPORATION
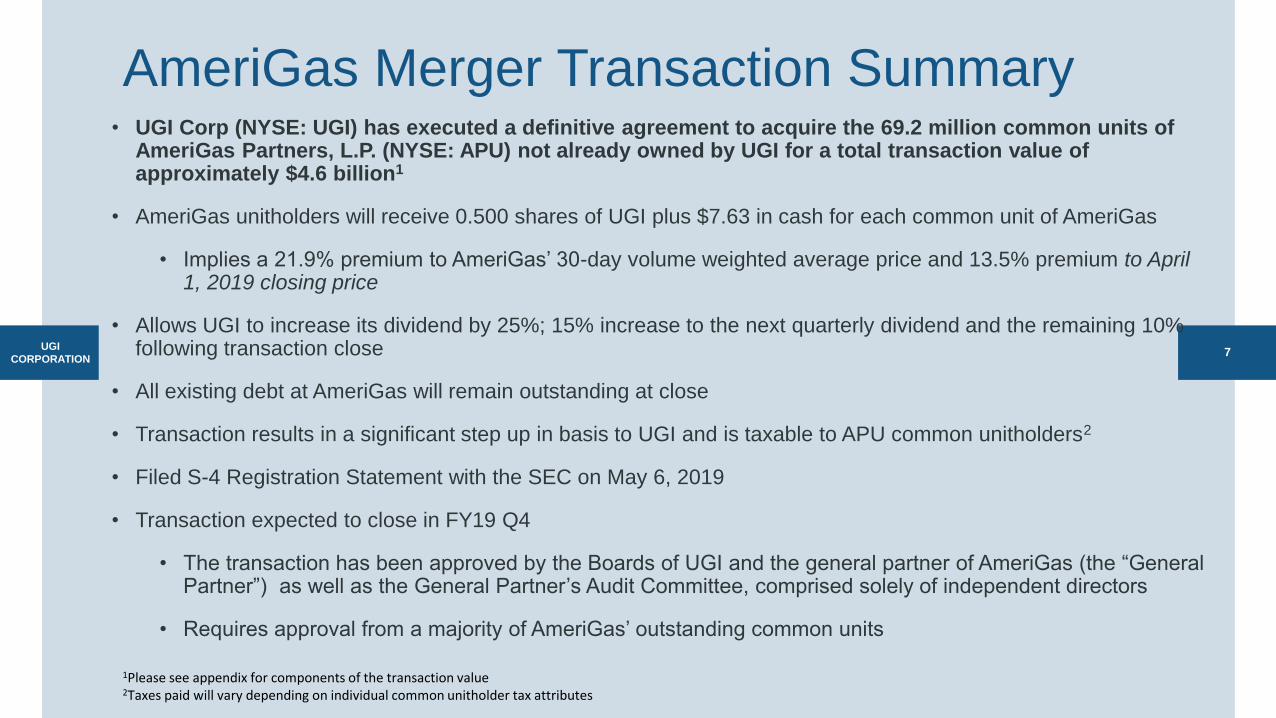
AmeriGas Merger Transaction Summary • UGI Corp (NYSE: UGI) has executed a definitive agreement to acquire the 69.2 million common units of
AmeriGas Partners, L.P. (NYSE: APU) not already owned by UGI for a total transaction value of approximately $4.6 billion1
• AmeriGas unitholders will receive 0.500 shares of UGI plus $7.63 in cash for each common unit of AmeriGas
• Implies a 21.9% premium to AmeriGas’ 30-day volume weighted average price and 13.5% premium to April 1, 2019 closing price
• Allows UGI to increase its dividend by 25%; 15% increase to the next quarterly dividend and the remaining 10% following transaction close
• All existing debt at AmeriGas will remain outstanding at close
• Transaction results in a significant step up in basis to UGI and is taxable to APU common unitholders2
• Filed S-4 Registration Statement with the SEC on May 6, 2019
• Transaction expected to close in FY19 Q4
• The transaction has been approved by the Boards of UGI and the general partner of AmeriGas (the “General Partner”) as well as the General Partner’s Audit Committee, comprised solely of independent directors
• Requires approval from a majority of AmeriGas’ outstanding common units
7
1Please see appendix for components of the transaction value 2Taxes paid will vary depending on individual common unitholder tax attributes
UGI
CORPORATION
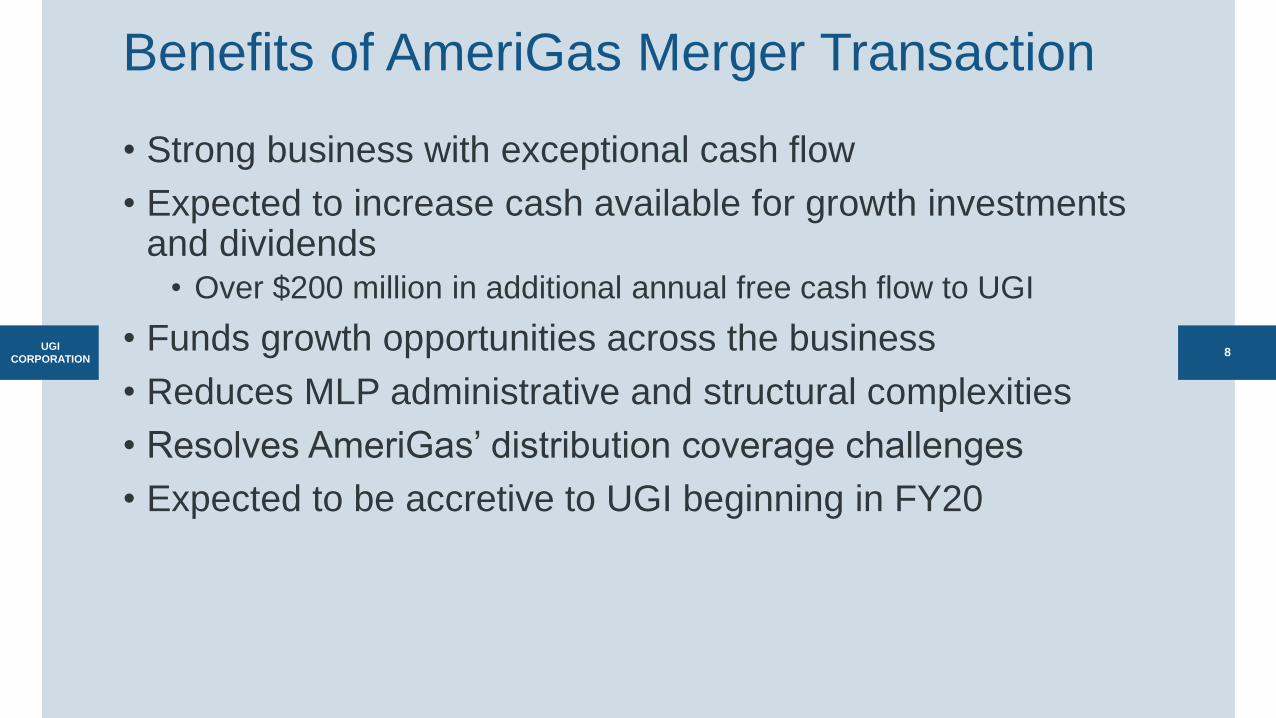
Benefits of AmeriGas Merger Transaction
8
• Strong business with exceptional cash flow
• Expected to increase cash available for growth investments and dividends
• Over $200 million in additional annual free cash flow to UGI
• Funds growth opportunities across the business
• Reduces MLP administrative and structural complexities
• Resolves AmeriGas’ distribution coverage challenges
• Expected to be accretive to UGI beginning in FY20
UGI
CORPORATION
-50
450
950
1450
1950
2450
2950
3450
Tota
l Re
turn
%
UGI S&P 500
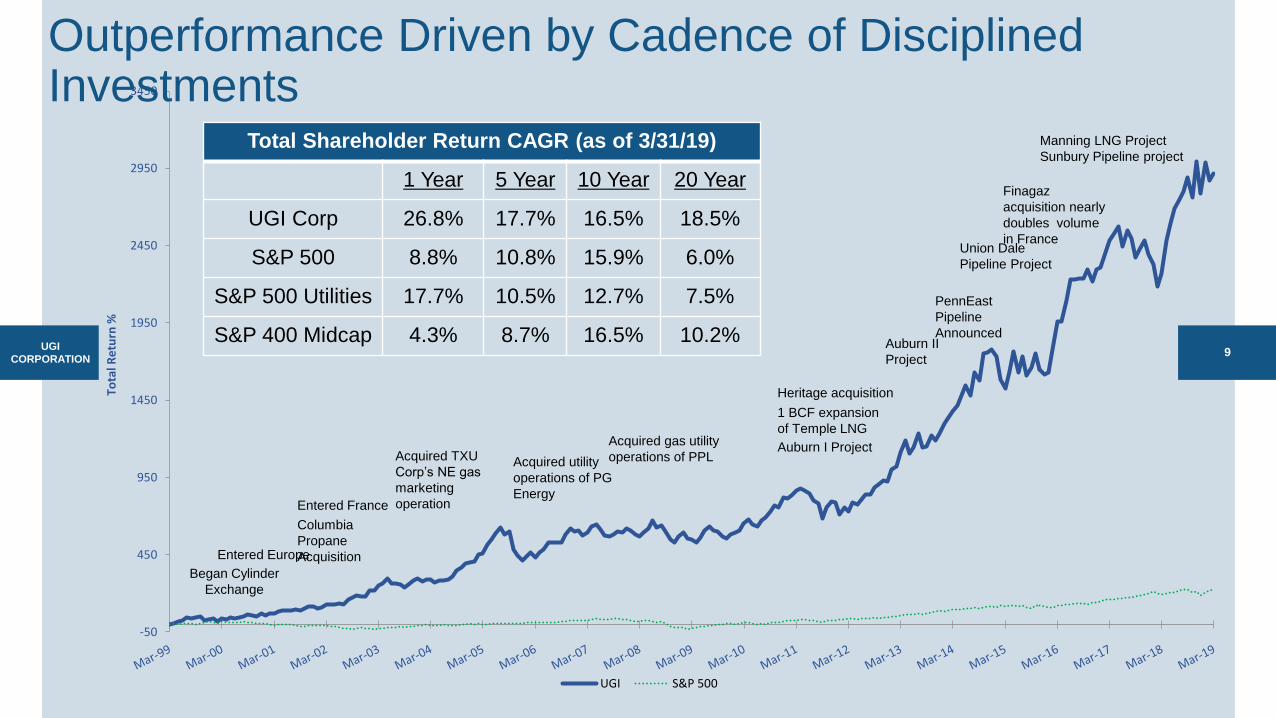
Outperformance Driven by Cadence of Disciplined Investments
9
Entered Europe
Auburn I Project
Began Cylinder
Exchange
Columbia
Propane
Acquisition
Acquired utility
operations of PG
Energy
Acquired gas utility
operations of PPL
Auburn II
Project
PennEast
Pipeline
Announced
Finagaz
acquisition nearly
doubles volume
in France
Manning LNG Project
Sunbury Pipeline project
Acquired TXU
Corp’s NE gas
marketing
operation Entered France
Heritage acquisition
1 BCF expansion
of Temple LNG
Union Dale
Pipeline Project
Total Shareholder Return CAGR (as of 3/31/19)
1 Year 5 Year 10 Year 20 Year
UGI Corp 26.8% 17.7% 16.5% 18.5%
S&P 500 8.8% 10.8% 15.9% 6.0%
S&P 500 Utilities 17.7% 10.5% 12.7% 7.5%
S&P 400 Midcap 4.3% 8.7% 16.5% 10.2%
UGI
CORPORATION
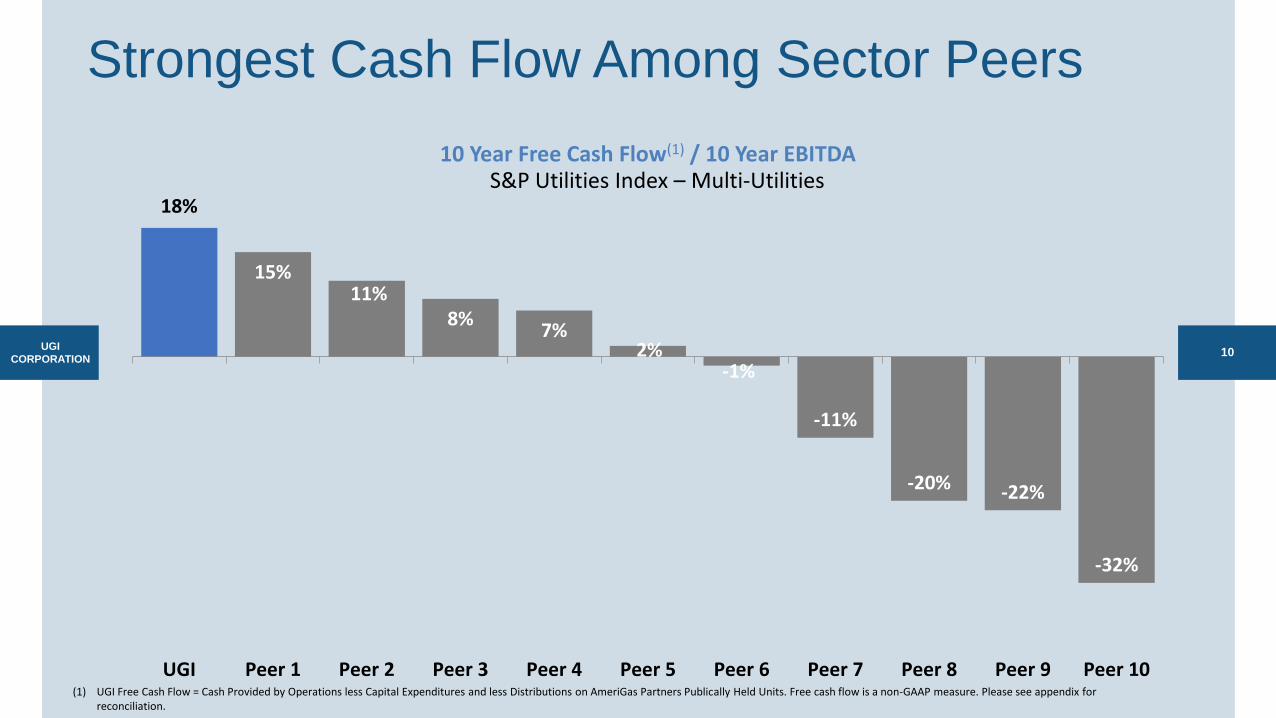
15% 11%
8% 7%
2% -1%
-11%
-20% -22%
-32%
UGI Peer 1 Peer 2 Peer 3 Peer 4 Peer 5 Peer 6 Peer 7 Peer 8 Peer 9 Peer 10
10 Year Free Cash Flow(1) / 10 Year EBITDA
Strongest Cash Flow Among Sector Peers
10
(1) UGI Free Cash Flow = Cash Provided by Operations less Capital Expenditures and less Distributions on AmeriGas Partners Publically Held Units. Free cash flow is a non-GAAP measure. Please see appendix for reconciliation.
S&P Utilities Index – Multi-Utilities 18%
UGI
CORPORATION
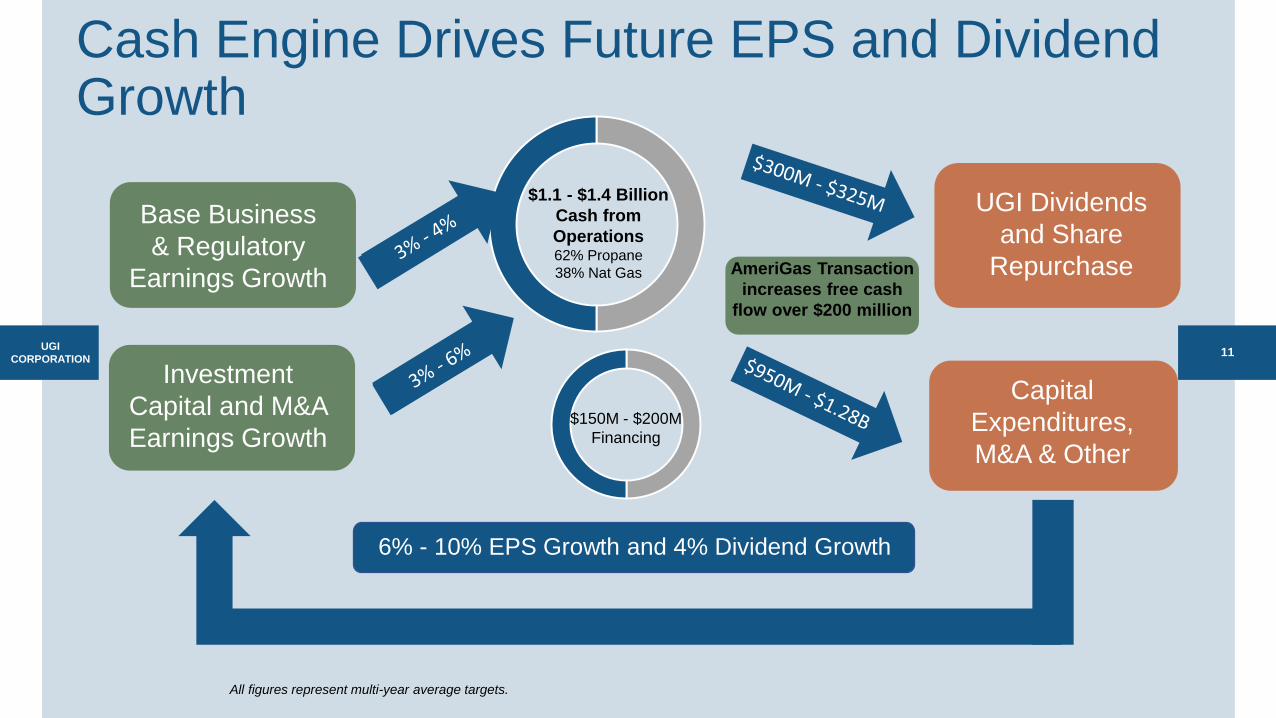
AmeriGas Transaction
increases free cash
flow over $200 million
Cash Engine Drives Future EPS and Dividend Growth
11
$1.1 - $1.4 Billion
Cash from
Operations 62% Propane
38% Nat Gas
$150M - $200M
Financing
All figures represent multi-year average targets.
UGI Dividends
and Share
Repurchase
Capital
Expenditures,
M&A & Other
Base Business
& Regulatory
Earnings Growth
Investment
Capital and M&A
Earnings Growth
6% - 10% EPS Growth and 4% Dividend Growth
UGI
CORPORATION
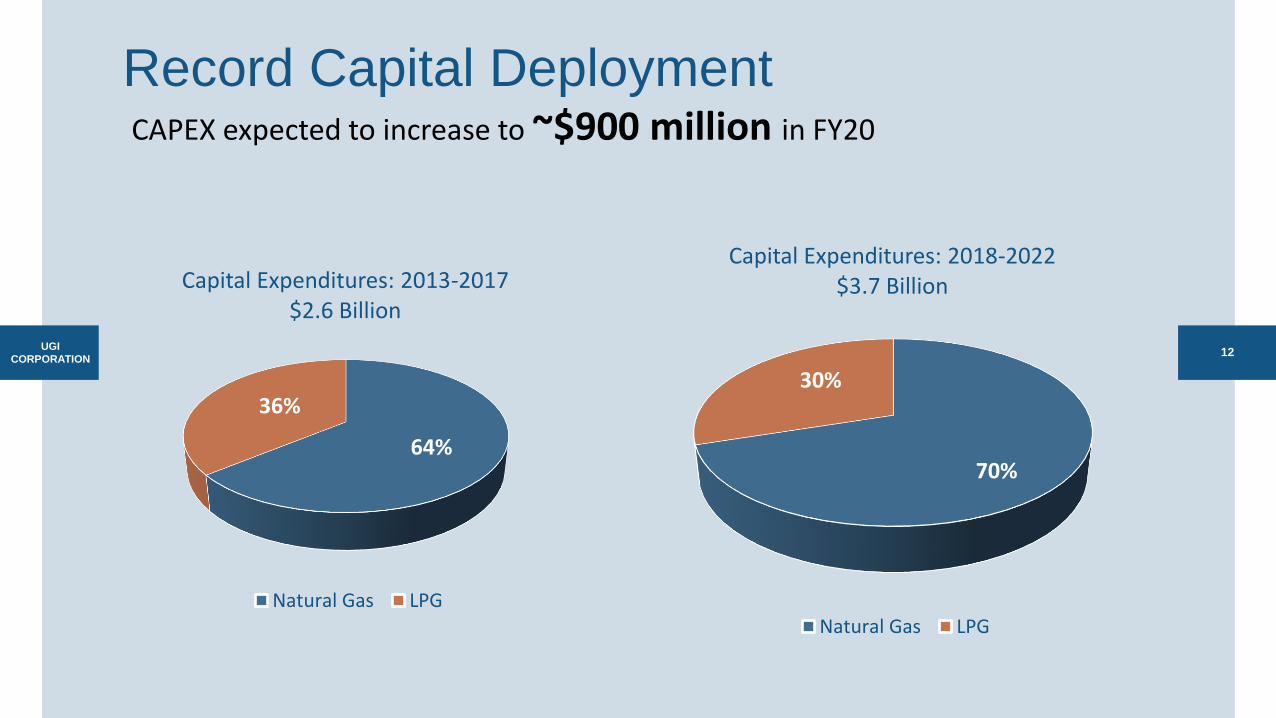
Record Capital Deployment
12
CAPEX expected to increase to ~$900 million in FY20
64%
36%
Capital Expenditures: 2013-2017 $2.6 Billion
Natural Gas LPG
70%
30%
Capital Expenditures: 2018-2022 $3.7 Billion
Natural Gas LPG

UGI UTILITIES
UTILITIES
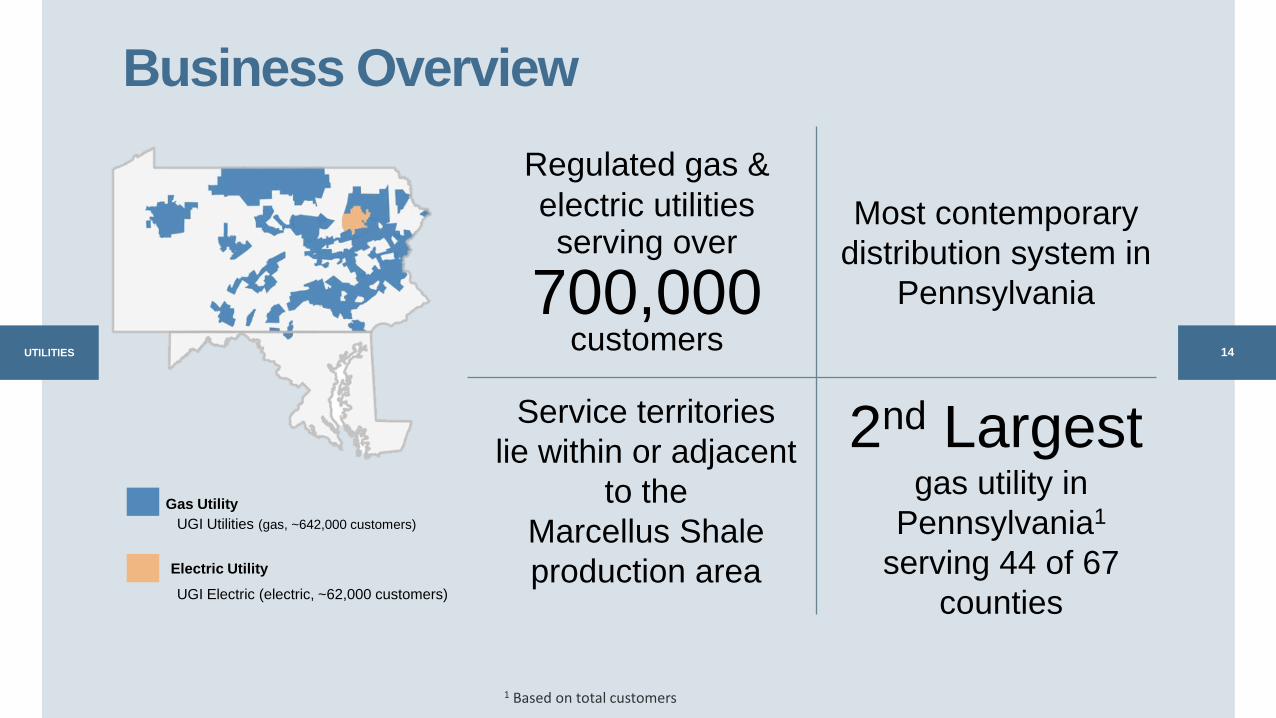
Business Overview
14
UGI Utilities (gas, ~642,000 customers)
UGI Electric (electric, ~62,000 customers)
Gas Utility
Electric Utility
1 Based on total customers
Regulated gas &
electric utilities serving over
700,000 customers
gas utility in
Pennsylvania1
serving 44 of 67
counties
2nd Largest Service territories
lie within or adjacent
to the
Marcellus Shale
production area
Most contemporary
distribution system in
Pennsylvania
UGI UTILITIES
UTILITIES
• Over 90% of UGI Utilities natural gas sourced from the Marcellus Shale
• Marcellus natural gas priced at over 29% discount to NYMEX during FY18
• Strong demand for natural gas (conversions, power generation, etc.)
• Favorable environment for economic development
• Significant value for customers
• Collectively, our customers paid ~$615MM less in 2018 than in 2008
• Average residential customer saved ~$1,000 in fiscal year 2018 vs. heating oil customers
Marcellus Advantage
15
Natural Gas Electric Marcellus Shale Area
UGI UTILITIES
UTILITIES
0
100,000
200,000
300,000
400,000
500,000
600,000
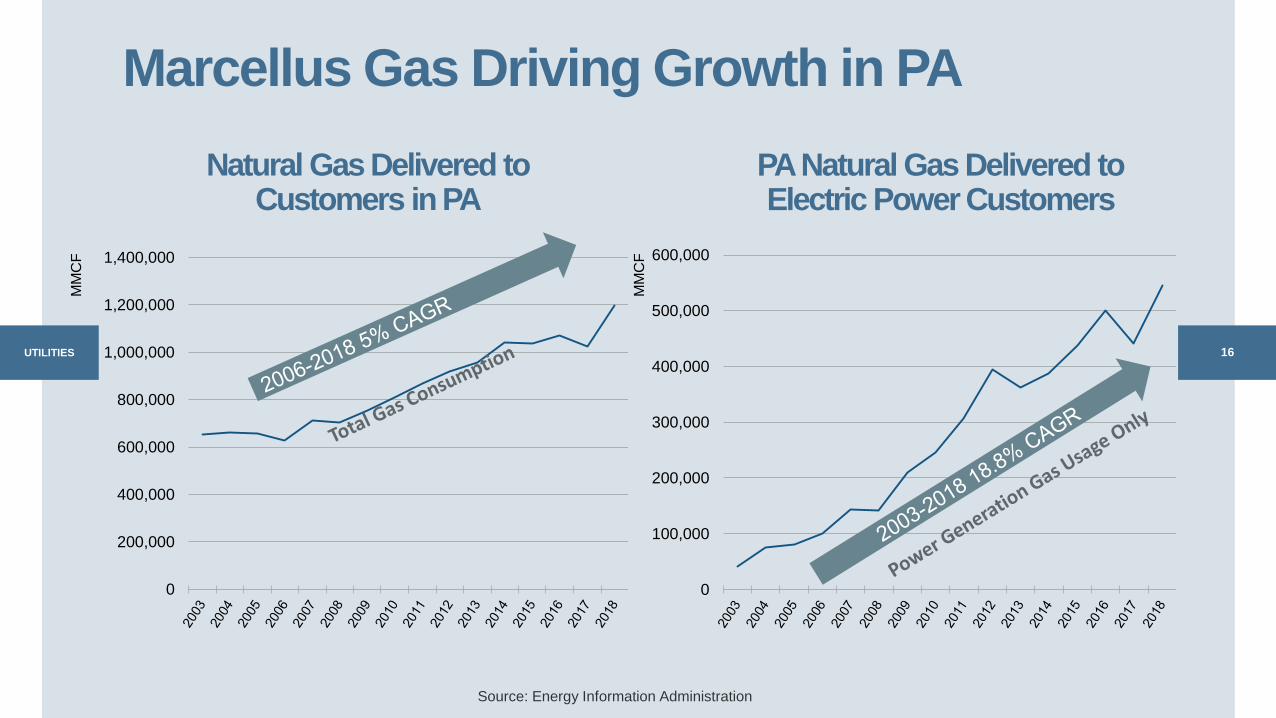
Marcellus Gas Driving Growth in PA
16
0
200,000
400,000
600,000
800,000
1,000,000
1,200,000
1,400,000
Natural Gas Delivered to Customers in PA
PA Natural Gas Delivered to Electric Power Customers
Source: Energy Information Administration
MM
CF
MM
CF
UGI UTILITIES
UTILITIES
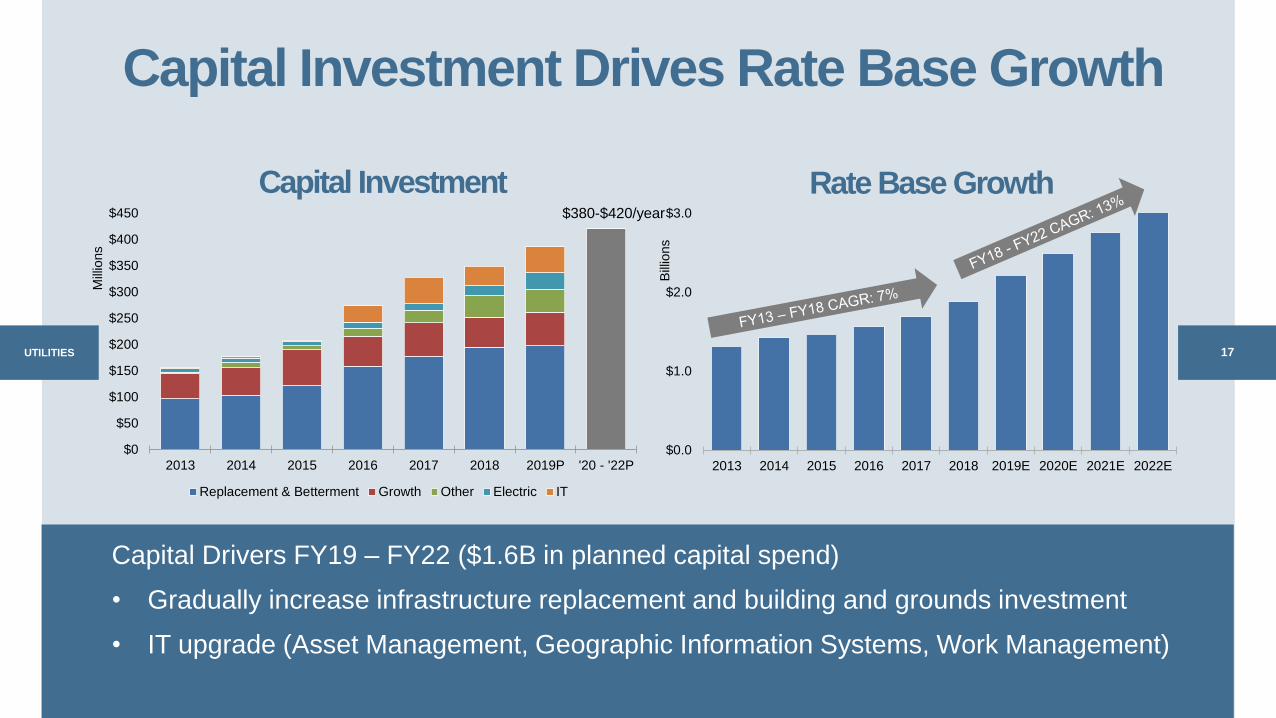
$0
$50
$100
$150
$200
$250
$300
$350
$400
$450
2013 2014 2015 2016 2017 2018 2019P '20 - '22P
Mill
ions
Replacement & Betterment Growth Other Electric IT
Capital Investment Drives Rate Base Growth
17
Capital Investment Rate Base Growth
$0.0
$1.0
$2.0
$3.0
2013 2014 2015 2016 2017 2018 2019E 2020E 2021E 2022E
Bill
ions
$380-$420/year
Capital Drivers FY19 – FY22 ($1.6B in planned capital spend)
• Gradually increase infrastructure replacement and building and grounds investment
• IT upgrade (Asset Management, Geographic Information Systems, Work Management)
UGI UTILITIES
UTILITIES
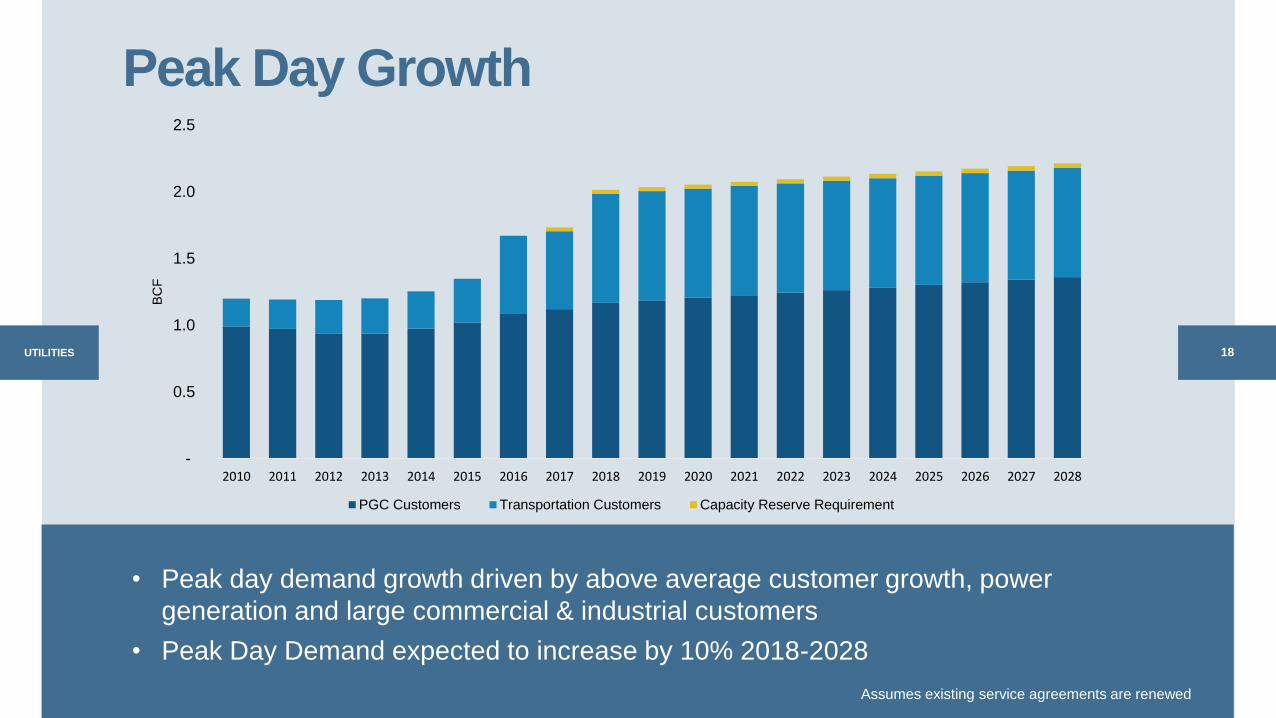
Peak Day Growth
18
-
0.5
1.0
1.5
2.0
2.5
2010 2011 2012 2013 2014 2015 2016 2017 2018 2019 2020 2021 2022 2023 2024 2025 2026 2027 2028
BC
F
PGC Customers Transportation Customers Capacity Reserve Requirement
• Peak day demand growth driven by above average customer growth, power
generation and large commercial & industrial customers
• Peak Day Demand expected to increase by 10% 2018-2028
Assumes existing service agreements are renewed
ENERGY
SERVICES 19
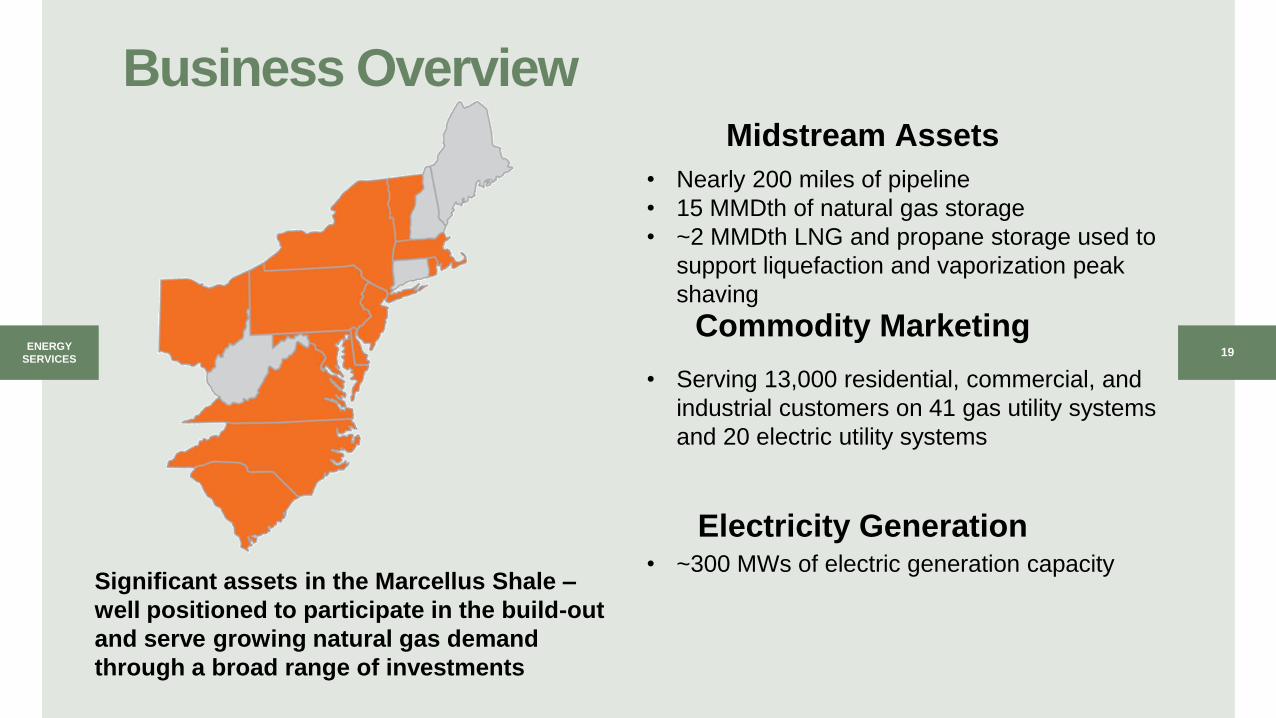
Commodity Marketing
Midstream Assets
Electricity Generation
• Serving 13,000 residential, commercial, and
industrial customers on 41 gas utility systems
and 20 electric utility systems
• Nearly 200 miles of pipeline
• 15 MMDth of natural gas storage
• ~2 MMDth LNG and propane storage used to
support liquefaction and vaporization peak
shaving
• ~300 MWs of electric generation capacity Significant assets in the Marcellus Shale –
well positioned to participate in the build-out
and serve growing natural gas demand
through a broad range of investments
Business Overview
ENERGY
SERVICES
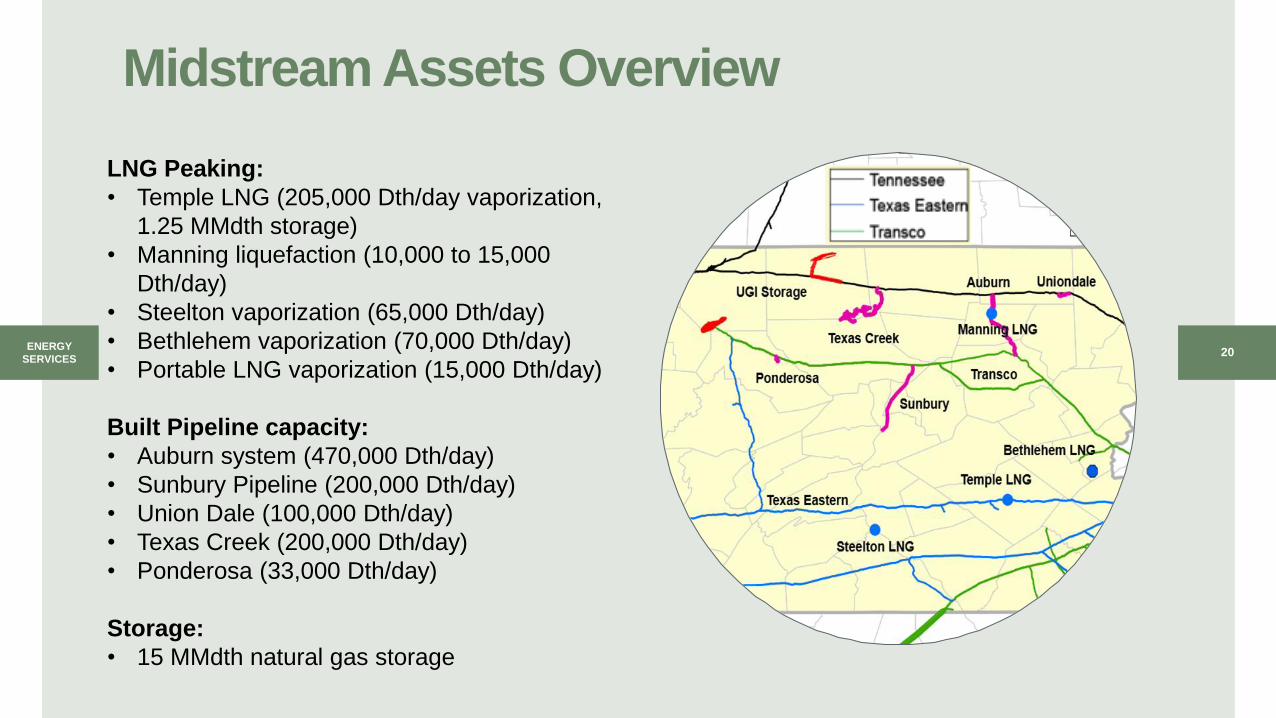
Midstream Assets Overview
20
LNG Peaking:
• Temple LNG (205,000 Dth/day vaporization,
1.25 MMdth storage)
• Manning liquefaction (10,000 to 15,000
Dth/day)
• Steelton vaporization (65,000 Dth/day)
• Bethlehem vaporization (70,000 Dth/day)
• Portable LNG vaporization (15,000 Dth/day)
Built Pipeline capacity:
• Auburn system (470,000 Dth/day)
• Sunbury Pipeline (200,000 Dth/day)
• Union Dale (100,000 Dth/day)
• Texas Creek (200,000 Dth/day)
• Ponderosa (33,000 Dth/day)
Storage:
• 15 MMdth natural gas storage
INTERNATIONAL
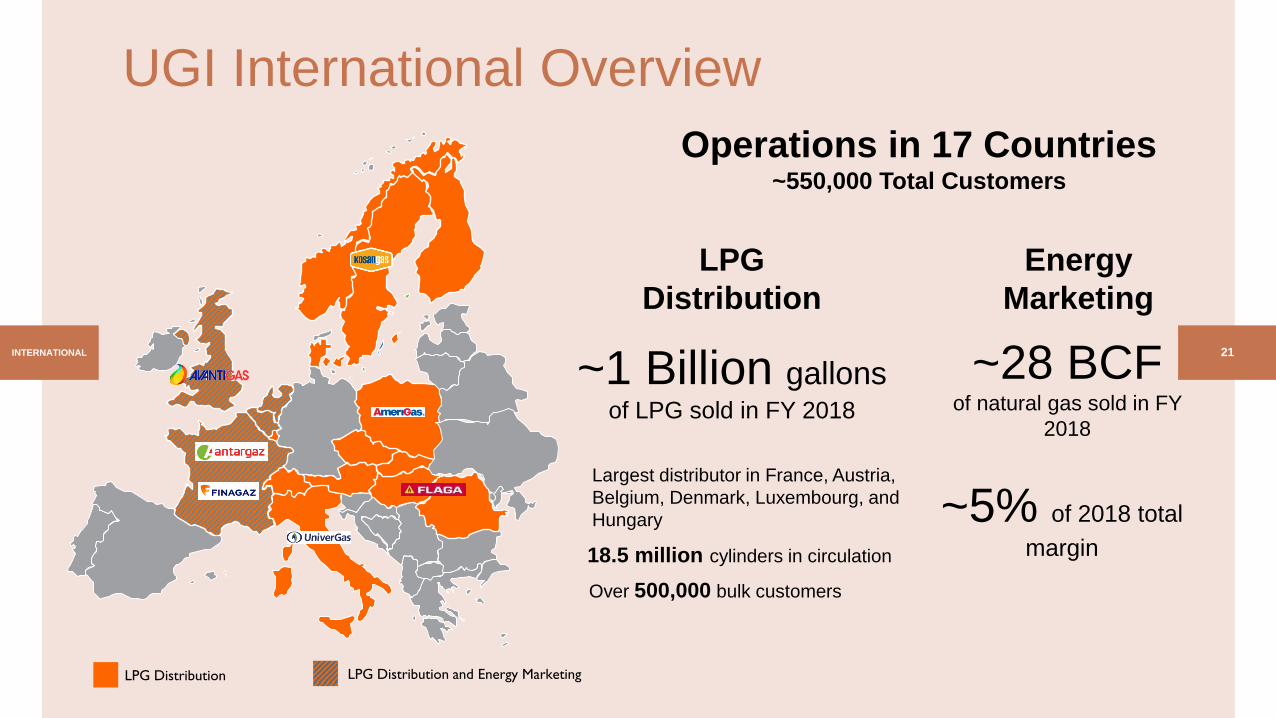
UGI International Overview
21
LPG Distribution LPG Distribution and Energy Marketing
~1 Billion gallons of LPG sold in FY 2018
~28 BCF of natural gas sold in FY
2018
LPG
Distribution
Energy
Marketing
Largest distributor in France, Austria,
Belgium, Denmark, Luxembourg, and
Hungary
18.5 million cylinders in circulation
Over 500,000 bulk customers
Operations in 17 Countries ~550,000 Total Customers
~5% of 2018 total
margin
INTERNATIONAL
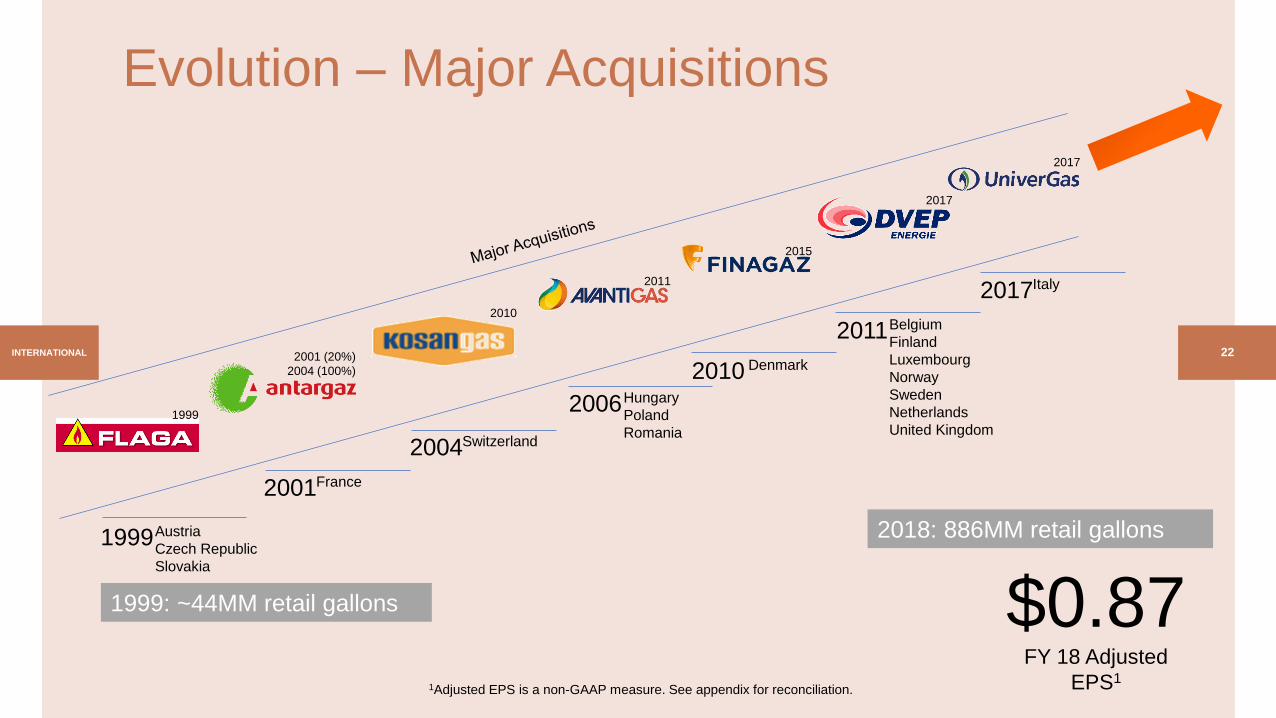
Evolution – Major Acquisitions
22
1999
Austria
Czech Republic
Slovakia
2001 France
2006 Hungary
Poland
Romania
2010 Denmark
2011 Belgium
Finland
Luxembourg
Norway
Sweden
Netherlands
United Kingdom
2017 Italy
2018: 886MM retail gallons
1999: ~44MM retail gallons $0.87 FY 18 Adjusted
EPS1
1999
2001 (20%)
2004 (100%)
2010
2011
2015
2017
2017
2004 Switzerland
1Adjusted EPS is a non-GAAP measure. See appendix for reconciliation.
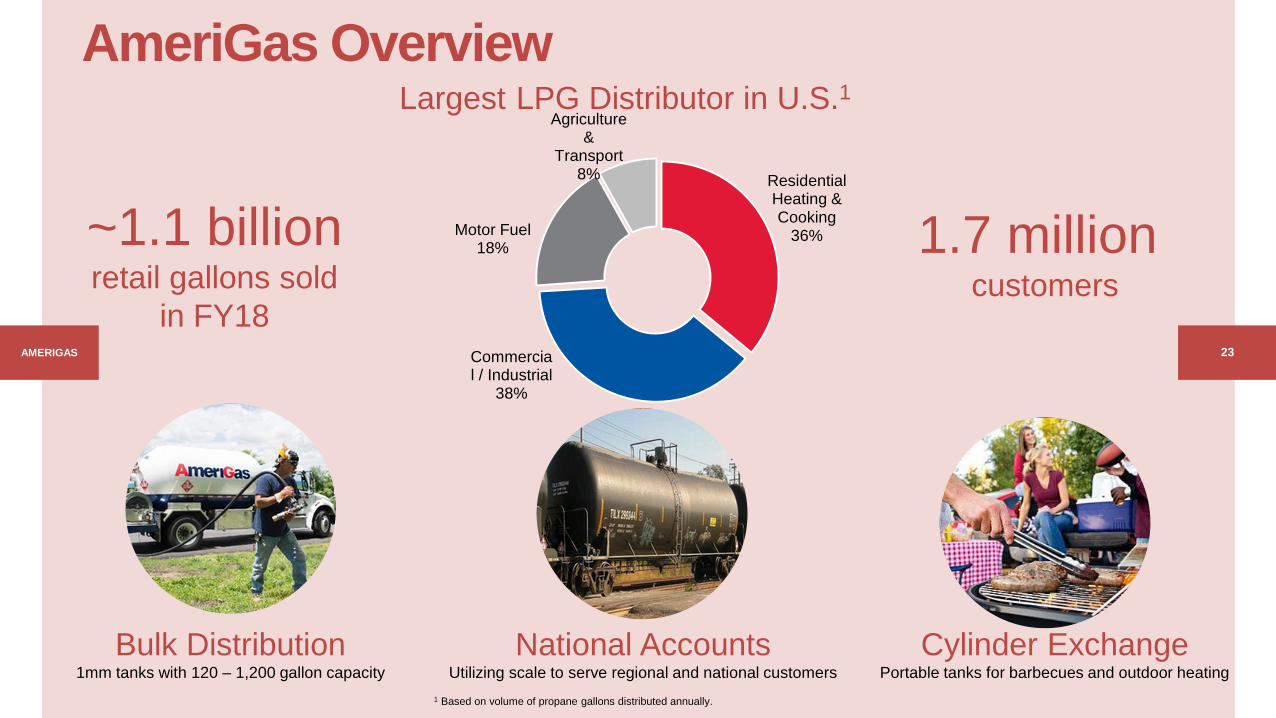
AMERIGAS
AmeriGas Overview
23
1 Based on volume of propane gallons distributed annually.
Bulk Distribution 1mm tanks with 120 – 1,200 gallon capacity
National Accounts Utilizing scale to serve regional and national customers
Cylinder Exchange Portable tanks for barbecues and outdoor heating
~1.1 billion retail gallons sold
in FY18
Largest LPG Distributor in U.S.1
Residential Heating & Cooking
36%
Commercial / Industrial
38%
Motor Fuel 18%
Agriculture &
Transport 8%
1.7 million customers
UGI
CORPORATION
Summary
24
• Proven track record of exceeding our commitments to our shareholders • 6% - 10% long-term annual EPS growth
• 4% annual dividend growth
• Well-positioned to build on our momentum • Strong and growing natural gas demand
• Utility rate base and customer growth
• Marcellus-based infrastructure
• Proposed AmeriGas transaction
• National Accounts, Cylinder Exchange
• Targeted M&A
• LNG, energy marketing expansion
• Broadening of activities in Europe
• Enhanced technology platform to support growth and improve customer experience
• Diversified and growing cash generation
Appendix
UGI
CORPORATION
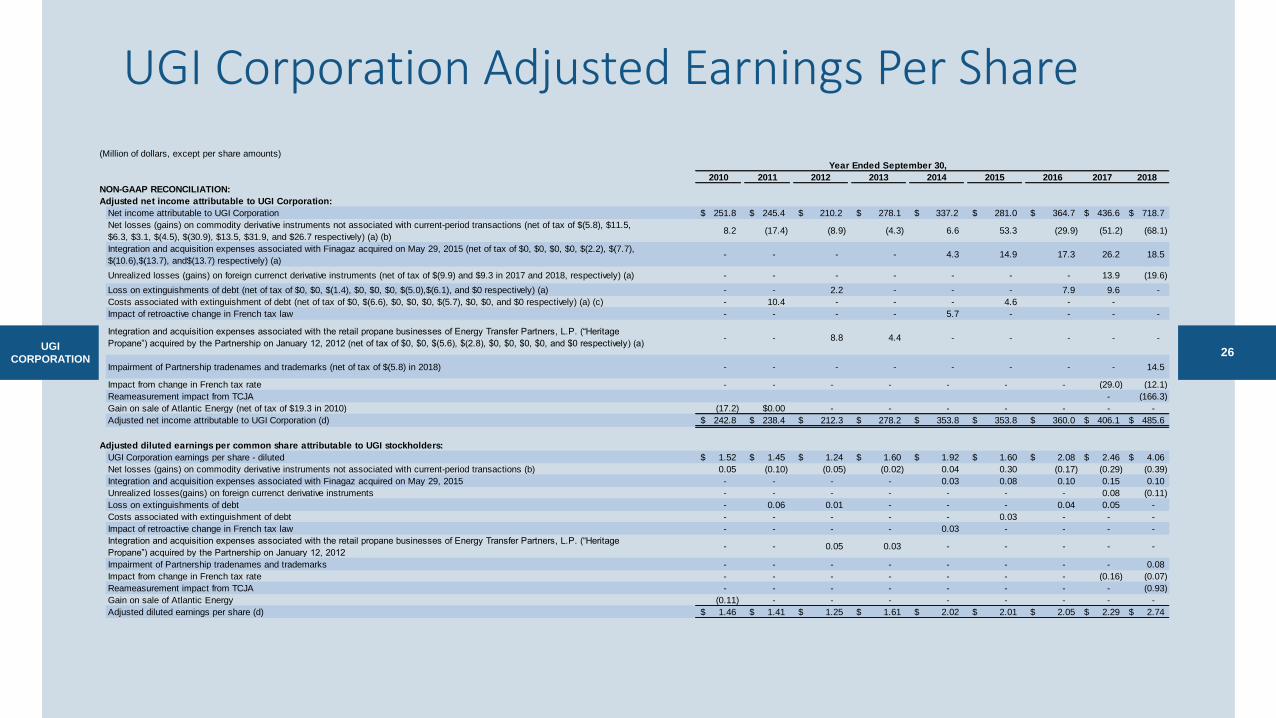
UGI Corporation Adjusted Earnings Per Share
26
(Million of dollars, except per share amounts)
Year Ended September 30,
2010 2011 2012 2013 2014 2015 2016 2017 2018
NON-GAAP RECONCILIATION:
Adjusted net income attributable to UGI Corporation:
Net income attributable to UGI Corporation $ 251.8 $ 245.4 $ 210.2 278.1$ $ 337.2 281.0$ 364.7$ 436.6$ 718.7$
Net losses (gains) on commodity derivative instruments not associated with current-period transactions (net of tax of $(5.8), $11.5,
$6.3, $3.1, $(4.5), $(30.9), $13.5, $31.9, and $26.7 respectively) (a) (b)8.2 (17.4) (8.9) (4.3) 6.6 53.3 (29.9) (51.2) (68.1)
Integration and acquisition expenses associated with Finagaz acquired on May 29, 2015 (net of tax of $0, $0, $0, $0, $(2.2), $(7.7),
$(10.6),$(13.7), and$(13.7) respectively) (a)- - - - 4.3 14.9 17.3 26.2 18.5
Unrealized losses (gains) on foreign currenct derivative instruments (net of tax of $(9.9) and $9.3 in 2017 and 2018, respectively) (a) - - - - - - - 13.9 (19.6)
Loss on extinguishments of debt (net of tax of $0, $0, $(1.4), $0, $0, $0, $(5.0),$(6.1), and $0 respectively) (a) - - 2.2 - - - 7.9 9.6 -
Costs associated with extinguishment of debt (net of tax of $0, $(6.6), $0, $0, $0, $(5.7), $0, $0, and $0 respectively) (a) (c) - 10.4 - - - 4.6 - -
Impact of retroactive change in French tax law - - - - 5.7 - - - -
Integration and acquisition expenses associated with the retail propane businesses of Energy Transfer Partners, L.P. (“Heritage
Propane”) acquired by the Partnership on January 12, 2012 (net of tax of $0, $0, $(5.6), $(2.8), $0, $0, $0, $0, and $0 respectively) (a)- - 8.8 4.4 - - - - -
Impairment of Partnership tradenames and trademarks (net of tax of $(5.8) in 2018) - - - - - - - - 14.5
Impact from change in French tax rate - - - - - - - (29.0) (12.1)
Reameasurement impact from TCJA - (166.3)
Gain on sale of Atlantic Energy (net of tax of $19.3 in 2010) (17.2) $0.00 - - - - - - -
Adjusted net income attributable to UGI Corporation (d) 242.8$ 238.4$ 212.3$ 278.2$ 353.8$ 353.8$ 360.0$ 406.1$ 485.6$
Adjusted diluted earnings per common share attributable to UGI stockholders:
UGI Corporation earnings per share - diluted 1.52$ 1.45$ 1.24$ 1.60$ 1.92$ 1.60$ 2.08$ 2.46$ 4.06$
Net losses (gains) on commodity derivative instruments not associated with current-period transactions (b) 0.05 (0.10) (0.05) (0.02) 0.04 0.30 (0.17) (0.29) (0.39)
Integration and acquisition expenses associated with Finagaz acquired on May 29, 2015 - - - - 0.03 0.08 0.10 0.15 0.10
Unrealized losses(gains) on foreign currenct derivative instruments - - - - - - - 0.08 (0.11)
Loss on extinguishments of debt - 0.06 0.01 - - - 0.04 0.05 -
Costs associated with extinguishment of debt - - - - - 0.03 - - -
Impact of retroactive change in French tax law - - - - 0.03 - - - -
Integration and acquisition expenses associated with the retail propane businesses of Energy Transfer Partners, L.P. (“Heritage
Propane”) acquired by the Partnership on January 12, 2012- - 0.05 0.03 - - - - -
Impairment of Partnership tradenames and trademarks - - - - - - - - 0.08
Impact from change in French tax rate - - - - - - - (0.16) (0.07)
Reameasurement impact from TCJA - - - - - - - - (0.93)
Gain on sale of Atlantic Energy (0.11) - - - - - - - -
Adjusted diluted earnings per share (d) 1.46$ 1.41$ 1.25$ 1.61$ 2.02$ 2.01$ 2.05$ 2.29$ 2.74$
UGI
CORPORATION
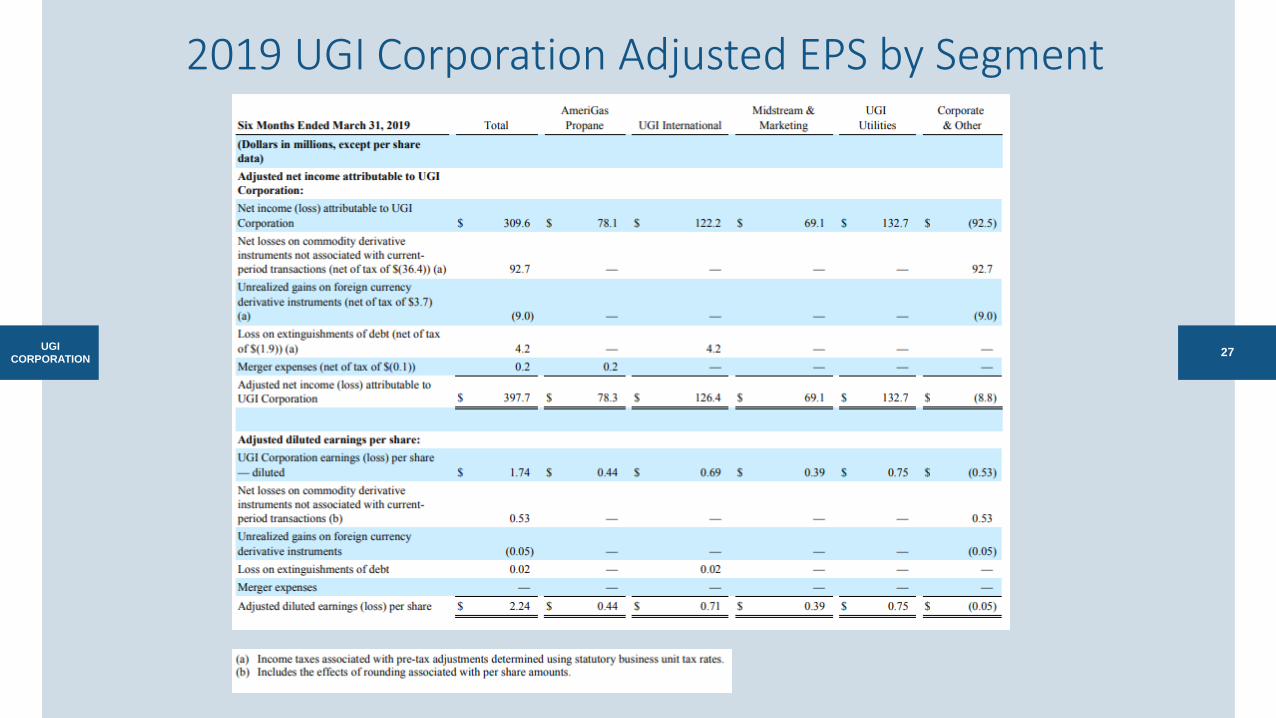
2019 UGI Corporation Adjusted EPS by Segment
27
UGI
CORPORATION
Transaction Value
28
Equity + Cash + Debt = Transaction Value
($69.2MM x 0.500) X $55.39 = $1.92BN
Converted AmeriGas units times UGI’s current stock price
+ $7.63 X 69.2MM = $528MM
Cash consideration for each common unit of AmeriGas
+ $2.9BN X 0.74 = $2.15BN
Proportion of total debt related to 74% ownership not held by UGI affiliates
= $1.92BN + $528MM + 2.15BN = $4.6BN Total Transaction Value
UGI
CORPORATION
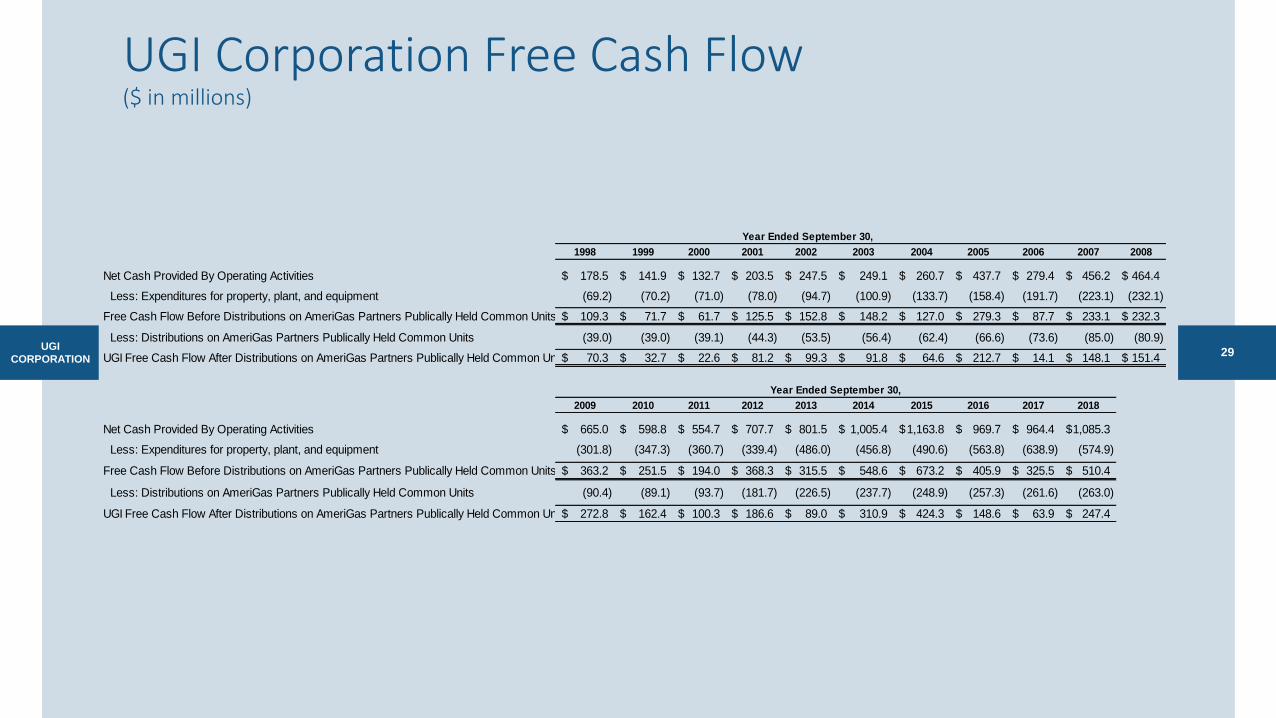
UGI Corporation Free Cash Flow ($ in millions)
29
Year Ended September 30,
1998 1999 2000 2001 2002 2003 2004 2005 2006 2007 2008
Net Cash Provided By Operating Activities 178.5$ 141.9$ 132.7$ 203.5$ 247.5$ 249.1$ 260.7$ 437.7$ 279.4$ 456.2$ 464.4$
Less: Expenditures for property, plant, and equipment (69.2) (70.2) (71.0) (78.0) (94.7) (100.9) (133.7) (158.4) (191.7) (223.1) (232.1)
Free Cash Flow Before Distributions on AmeriGas Partners Publically Held Common Units 109.3$ 71.7$ 61.7$ 125.5$ 152.8$ 148.2$ 127.0$ 279.3$ 87.7$ 233.1$ 232.3$
Less: Distributions on AmeriGas Partners Publically Held Common Units (39.0) (39.0) (39.1) (44.3) (53.5) (56.4) (62.4) (66.6) (73.6) (85.0) (80.9)
UGI Free Cash Flow After Distributions on AmeriGas Partners Publically Held Common Units 70.3$ 32.7$ 22.6$ 81.2$ 99.3$ 91.8$ 64.6$ 212.7$ 14.1$ 148.1$ 151.4$
Year Ended September 30,
2009 2010 2011 2012 2013 2014 2015 2016 2017 2018
Net Cash Provided By Operating Activities 665.0$ 598.8$ 554.7$ 707.7$ 801.5$ 1,005.4$ 1,163.8$ 969.7$ 964.4$ 1,085.3$
Less: Expenditures for property, plant, and equipment (301.8) (347.3) (360.7) (339.4) (486.0) (456.8) (490.6) (563.8) (638.9) (574.9)
Free Cash Flow Before Distributions on AmeriGas Partners Publically Held Common Units 363.2$ 251.5$ 194.0$ 368.3$ 315.5$ 548.6$ 673.2$ 405.9$ 325.5$ 510.4$
Less: Distributions on AmeriGas Partners Publically Held Common Units (90.4) (89.1) (93.7) (181.7) (226.5) (237.7) (248.9) (257.3) (261.6) (263.0)
UGI Free Cash Flow After Distributions on AmeriGas Partners Publically Held Common Units 272.8$ 162.4$ 100.3$ 186.6$ 89.0$ 310.9$ 424.3$ 148.6$ 63.9$ 247.4$