About the Medicaid Chart Book by the UMC Medicaid Workgroup Amy Lake...
40
About the Medicaid Chart Book by the UMC Medicaid Workgroup http://oseda.missouri.edu/ medicaid/ Amy Lake [email protected] or 573-882-5412 Extension Community Development Centra Teleconference March 8, 2006
-
date post
21-Dec-2015 -
Category
Documents
-
view
217 -
download
0
Transcript of About the Medicaid Chart Book by the UMC Medicaid Workgroup Amy Lake...
About the Medicaid Chart Book by the UMC Medicaid Workgroup
http://oseda.missouri.edu/medicaid/
Amy [email protected] or 573-882-5412
Extension Community Development Centra TeleconferenceMarch 8, 2006
Missouri Medicaid Chart Book
The Missouri Medicaid Program:The Missouri Medicaid Program: A Graphical Profile A Graphical Profile
Medicaid Work Group, University of Missouri--Columbia
August 2005
Medicaid Reform Commissionhttp://www.senate.mo.gov/medicaidreform/
“The Commission is charged with reforming, redesigning and restructuring a new Medicaid program for the
21st Century.”
Chair: Senator Charlie ShieldsMembers: Rep. Allen Icet; Rep. David Sater; Rep. Raymond 'Ray' Weter; Rep.
Margaret Donnelley; Rep. Yaphett S. El-Amin; Senator Michael Gibbons; Senator Chuck Purgason; Senator Rita Heard Days; Senator Pat Dougherty
Gary Sherman (Director, Dept. Social Services)Dorn Schuffman (Director, Dept. Mental Health)Julie Eckstein (Director, Dept. of Health and Senior Services)
Medicaid Reform Commission’s Final Report:
http://www.senate.mo.gov/medicaidreform/MedicaidReformCommFinal-122205.pdf
Lake’s additions for 3/8/06
4©2005 Medicaid Work Group, University of Missouri--Columbia
Missouri Medicaid Chartbook
AcknowledgmentsThank you to the members of the “Medicaid Work Group” at the University of Missouri-Columbia, who researched, designed, created, and compiled this summary report. The group is a collaboration of faculty and staff from several MU Centers
•Dr. Bill Elder Office of Social and Economic Data Analysis•Dr. Kris Hagglund Center for Health Policy •Dr. Lanis Hicks Department of Health Management & Informatics•Stanton Hudson Center for Health Policy•Tanna Klein Office of Social and Economic Data Analysis•Amy Lake Community Policy Analysis Center•Dr. Jane Mosley Institute of Public Policy•Bret Sanders Institute of Public Policy
Thank you to the staff at the Missouri Department of Social Services, who assisted with background information and data access.
•Dr. Eric Bempah•Karen Haslag•Dr. Richard L. Koon
Thank you to the staff at the Office of Social and Economic Data Analysis, who assisted with data access and management.
•John Blodgett •Dr. Keith Jamtgaard•Steven Meyer
For additional information about this report see: www.oseda.missouri.edu/medicaid or call OSEDA at 573-882-7396
The Office of Social and Economic Data Analysis is a unit of University Extension
The Center for Health Policy is a unit of the School of Health Professions and the School of Medicine
Health Management & Informatics is a department of the School of Medicine
The Community Policy Analysis Center is an Extension & Research unit of the College of Agriculture Food and Natural Resources
The Institute of Public Policy is a center of The Truman School of Public Affairs
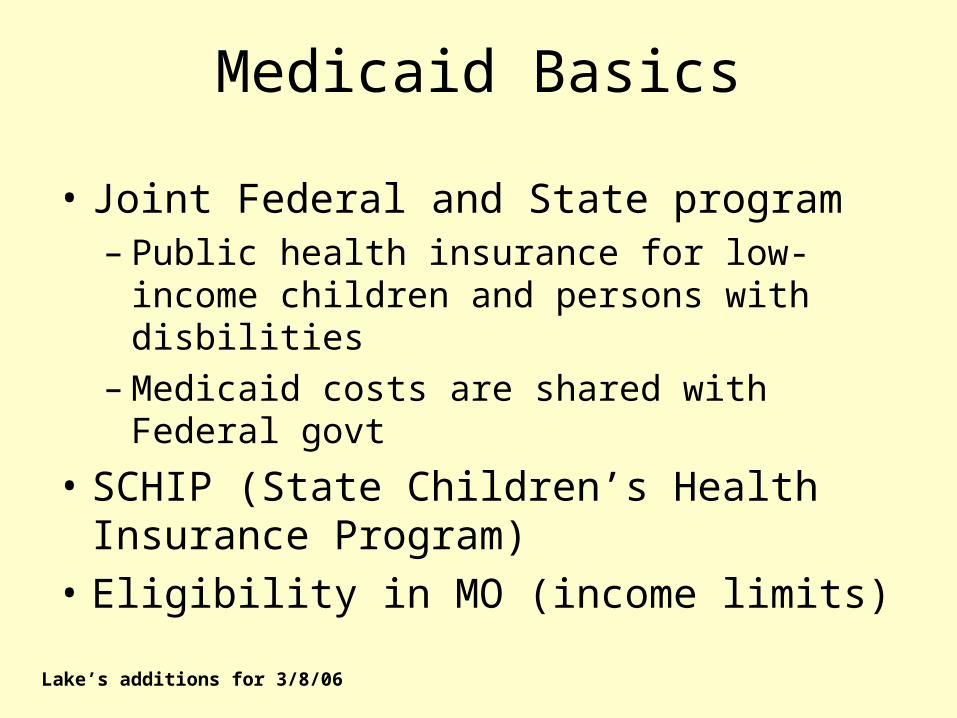
Medicaid Basics
• Joint Federal and State program– Public health insurance for low-income
children and persons with disbilities– Medicaid costs are shared with Federal govt
• SCHIP (State Children’s Health Insurance Program)
• Eligibility in MO (income limits)
Lake’s additions for 3/8/06
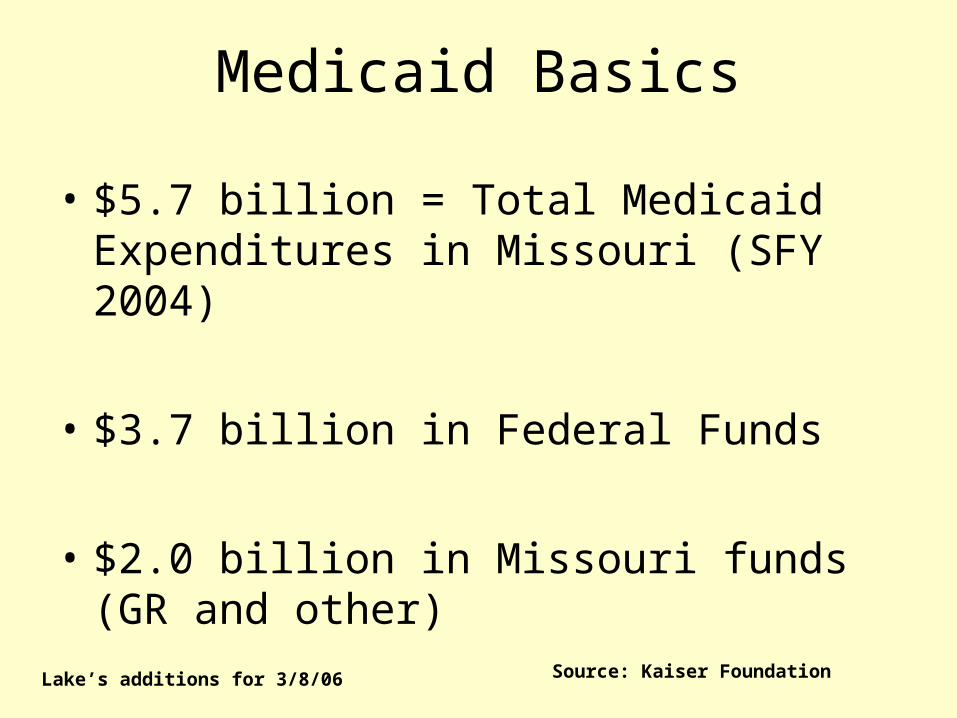
Medicaid Basics
• $5.7 billion = Total Medicaid Expenditures in Missouri (SFY 2004)
• $3.7 billion in Federal Funds
• $2.0 billion in Missouri funds (GR and other)
Lake’s additions for 3/8/06 Source: Kaiser Foundation
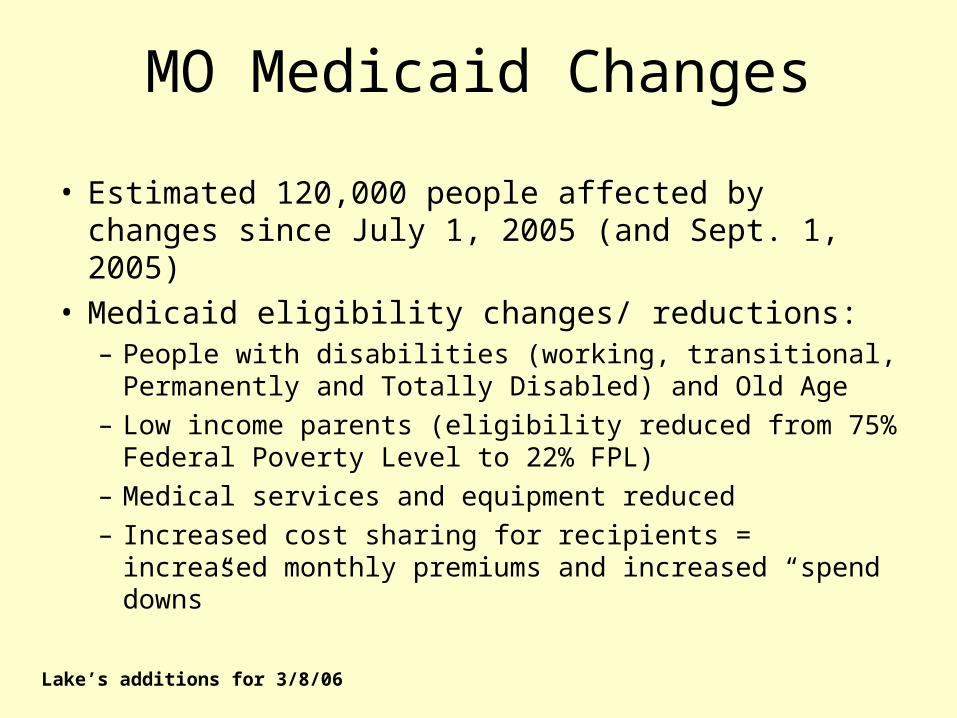
MO Medicaid Changes
• Estimated 120,000 people affected by changes since July 1, 2005 (and Sept. 1, 2005)
• Medicaid eligibility changes/ reductions:– People with disabilities (working, transitional,
Permanently and Totally Disabled) and Old Age– Low income parents (eligibility reduced from 75%
Federal Poverty Level to 22% FPL)– Medical services and equipment reduced– Increased cost sharing for recipients = increased
monthly premiums and increased “spend downs”
Lake’s additions for 3/8/06
10©2005 Medicaid Work Group, University of Missouri--Columbia
Missouri Medicaid Chartbook
Background
11©2005 Medicaid Work Group, University of Missouri--Columbia
Missouri Medicaid Chartbook
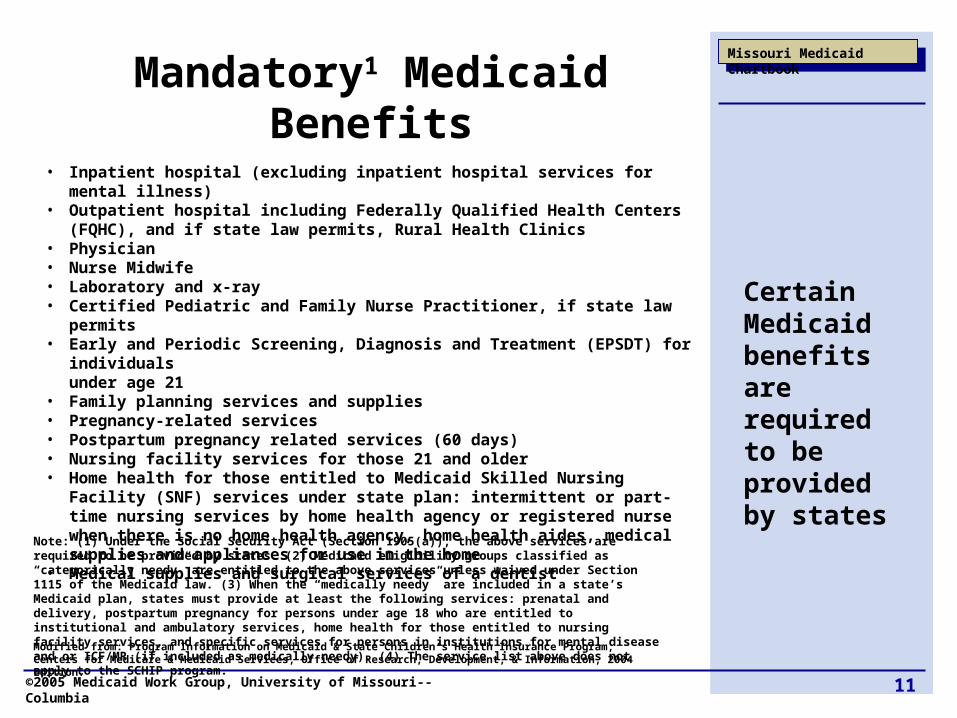
• Inpatient hospital (excluding inpatient hospital services for mental illness)• Outpatient hospital including Federally Qualified Health Centers (FQHC), and if state
law permits, Rural Health Clinics• Physician • Nurse Midwife • Laboratory and x-ray • Certified Pediatric and Family Nurse Practitioner, if state law permits• Early and Periodic Screening, Diagnosis and Treatment (EPSDT) for individuals
under age 21• Family planning services and supplies• Pregnancy-related services• Postpartum pregnancy related services (60 days)• Nursing facility services for those 21 and older• Home health for those entitled to Medicaid Skilled Nursing Facility (SNF) services
under state plan: intermittent or part-time nursing services by home health agency or registered nurse when there is no home health agency, home health aides, medical supplies and appliances for use in the home
• Medical supplies and surgical services of a dentist
Mandatory1 Medicaid Benefits
Modified from: Program Information on Medicaid & State Children’s Health Insurance Program, Centers for Medicare & Medicaid Services, Office of Research, Development, & Information, 2004 Edition.
Note: (1) Under the Social Security Act (Section 1905(a)), the above services are required to be provided by states. (2) Medicaid eligibility groups classified as “categorically needy” are entitled to the above services unless waived under Section 1115 of the Medicaid law. (3) When the “medically needy” are included in a state’s Medicaid plan, states must provide at least the following services: prenatal and delivery, postpartum pregnancy for persons under age 18 who are entitled to institutional and ambulatory services, home health for those entitled to nursing facility services, and specific services for persons in institutions for mental disease and or ICF/MR (if included as medically needy). (4) The service list above does not apply to the SCHIP program.
Certain Medicaid benefits are required to be provided by states
12©2005 Medicaid Work Group, University of Missouri--Columbia
Missouri Medicaid Chartbook
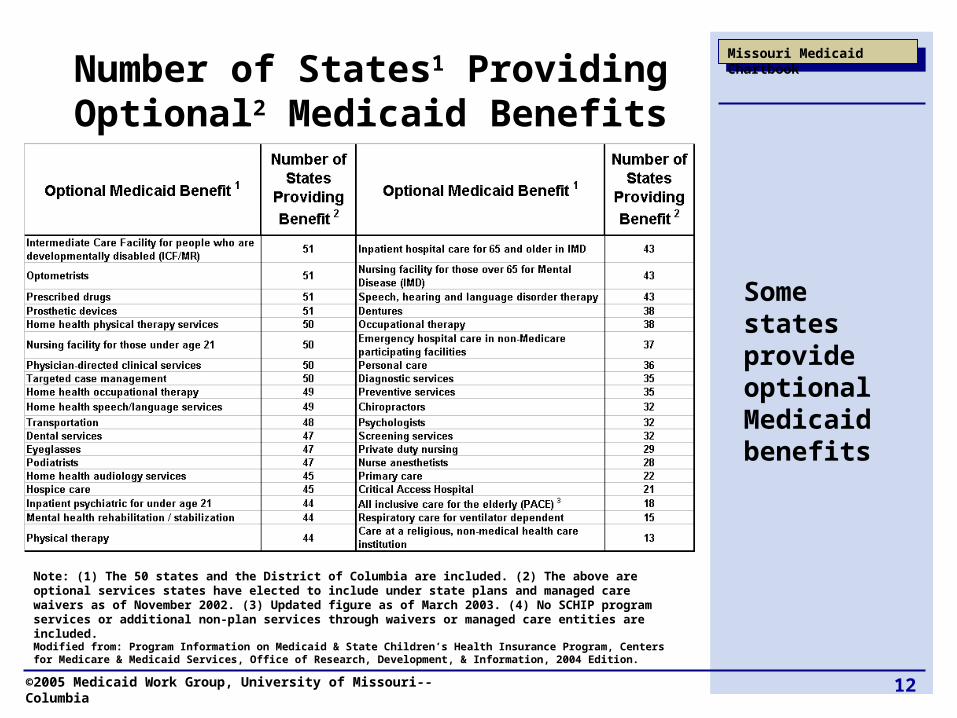
Number of States1 Providing Optional2 Medicaid Benefits
Modified from: Program Information on Medicaid & State Children’s Health Insurance Program, Centers for Medicare & Medicaid Services, Office of Research, Development, & Information, 2004 Edition.
Note: (1) The 50 states and the District of Columbia are included. (2) The above are optional services states have elected to include under state plans and managed care waivers as of November 2002. (3) Updated figure as of March 2003. (4) No SCHIP program services or additional non-plan services through waivers or managed care entities are included.
Some states provide optional Medicaid benefits
13©2005 Medicaid Work Group, University of Missouri--Columbia
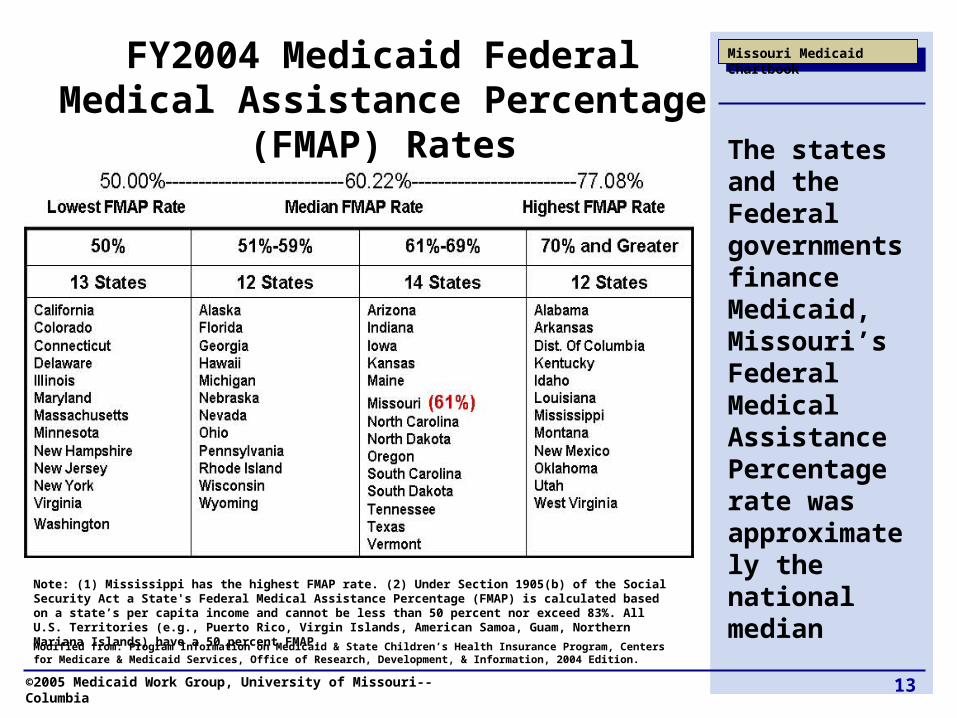
Missouri Medicaid ChartbookFY2004 Medicaid Federal Medical Assistance Percentage (FMAP)
Rates
Note: (1) Mississippi has the highest FMAP rate. (2) Under Section 1905(b) of the Social Security Act a State's Federal Medical Assistance Percentage (FMAP) is calculated based on a state’s per capita income and cannot be less than 50 percent nor exceed 83%. All U.S. Territories (e.g., Puerto Rico, Virgin Islands, American Samoa, Guam, Northern Mariana Islands) have a 50 percent FMAP.
Modified from: Program Information on Medicaid & State Children’s Health Insurance Program, Centers for Medicare & Medicaid Services, Office of Research, Development, & Information, 2004 Edition.
The states and the Federal governments finance Medicaid, Missouri’s Federal Medical Assistance Percentage rate was approximately the national median
14©2005 Medicaid Work Group, University of Missouri--Columbia
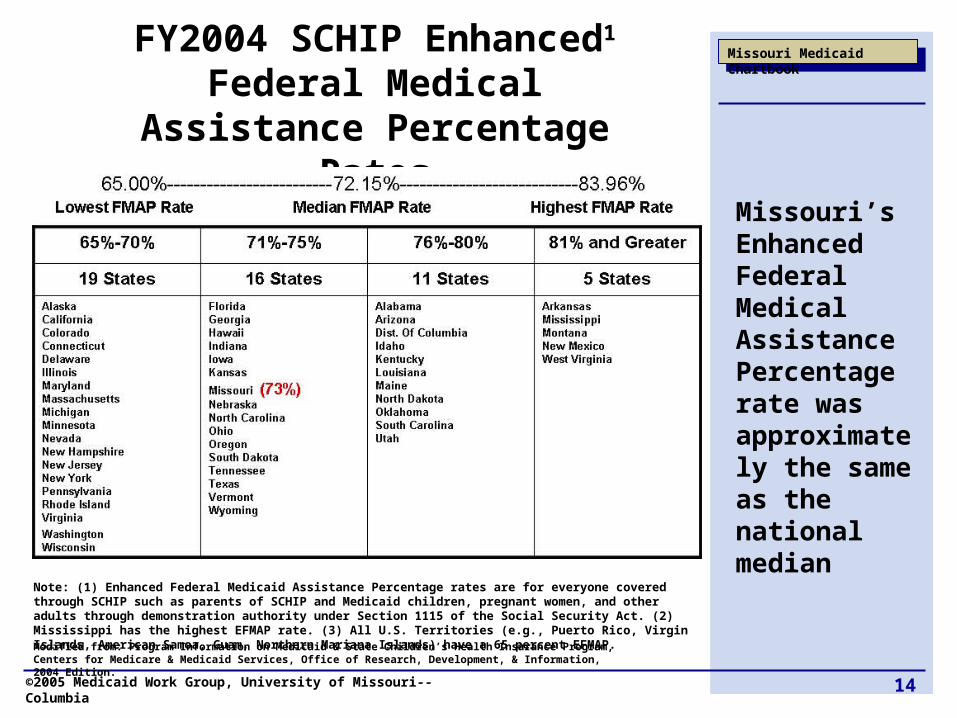
Missouri Medicaid ChartbookFY2004 SCHIP Enhanced1 Federal Medical Assistance
Percentage Rates
Modified from: Program Information on Medicaid & State Children’s Health Insurance Program, Centers for Medicare & Medicaid Services, Office of Research, Development, & Information, 2004 Edition.
Note: (1) Enhanced Federal Medicaid Assistance Percentage rates are for everyone covered through SCHIP such as parents of SCHIP and Medicaid children, pregnant women, and other adults through demonstration authority under Section 1115 of the Social Security Act. (2) Mississippi has the highest EFMAP rate. (3) All U.S. Territories (e.g., Puerto Rico, Virgin Islands, American Samoa, Guam, Northern Mariana Islands) have a 65 percent EFMAP.
Missouri’s Enhanced Federal Medical Assistance Percentage rate was approximately the same as the national median
15©2005 Medicaid Work Group, University of Missouri--Columbia
Missouri Medicaid Chartbook
National Maps
16©2005 Medicaid Work Group, University of Missouri--Columbia
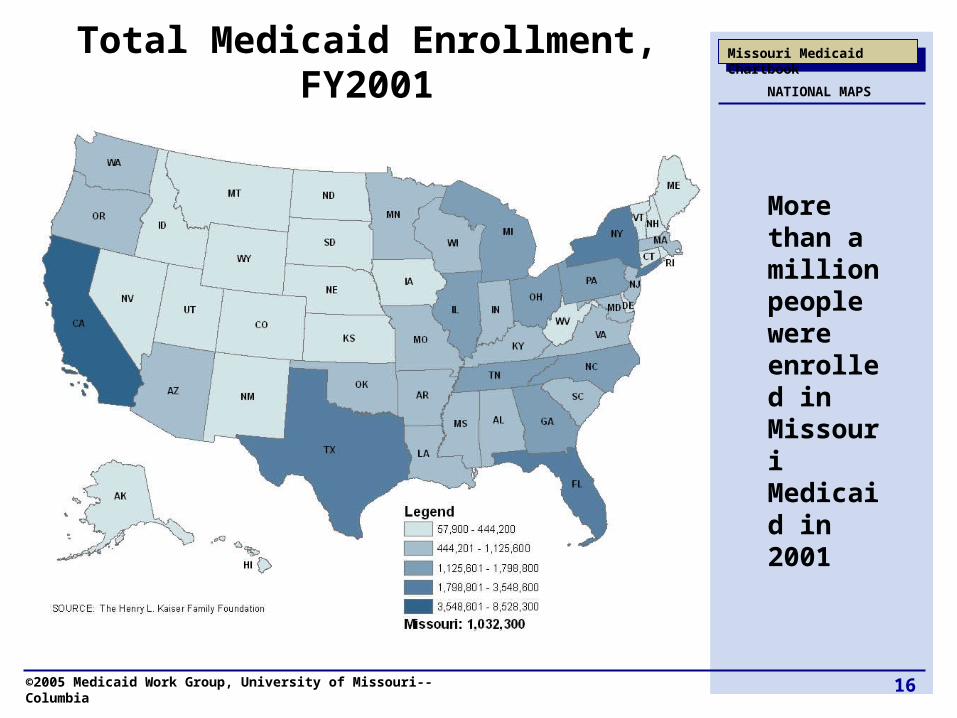
Missouri Medicaid ChartbookTotal Medicaid Enrollment, FY2001
More than a million people were enrolled in Missouri Medicaid in 2001
NATIONAL MAPS
17©2005 Medicaid Work Group, University of Missouri--Columbia
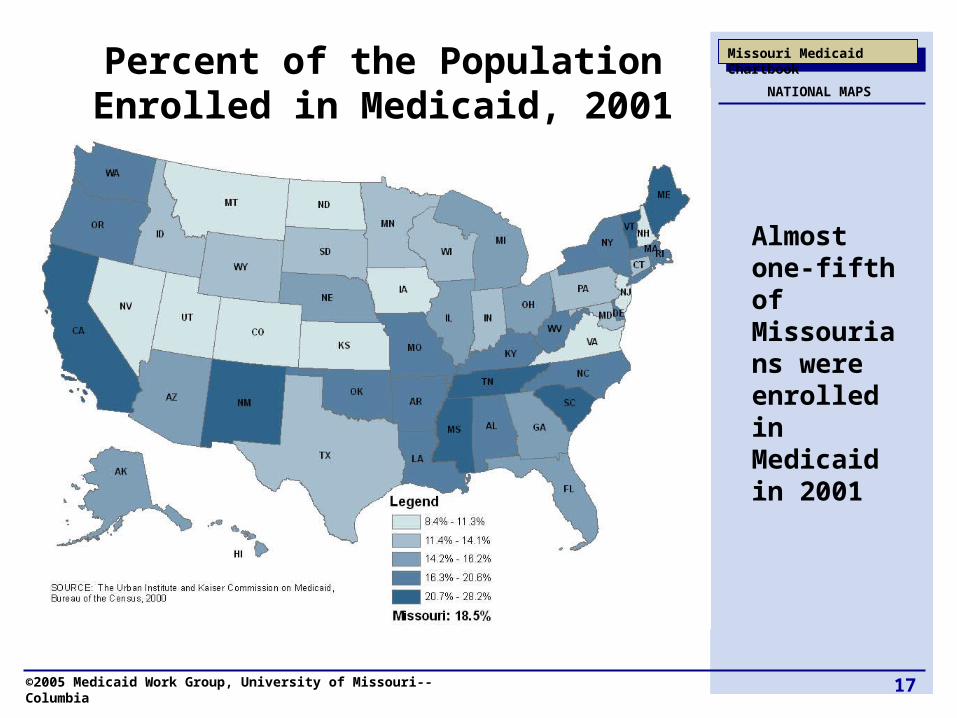
Missouri Medicaid ChartbookPercent of the Population Enrolled in Medicaid, 2001
Almost one-fifth of Missourians were enrolled in Medicaid in 2001
NATIONAL MAPS
18©2005 Medicaid Work Group, University of Missouri--Columbia
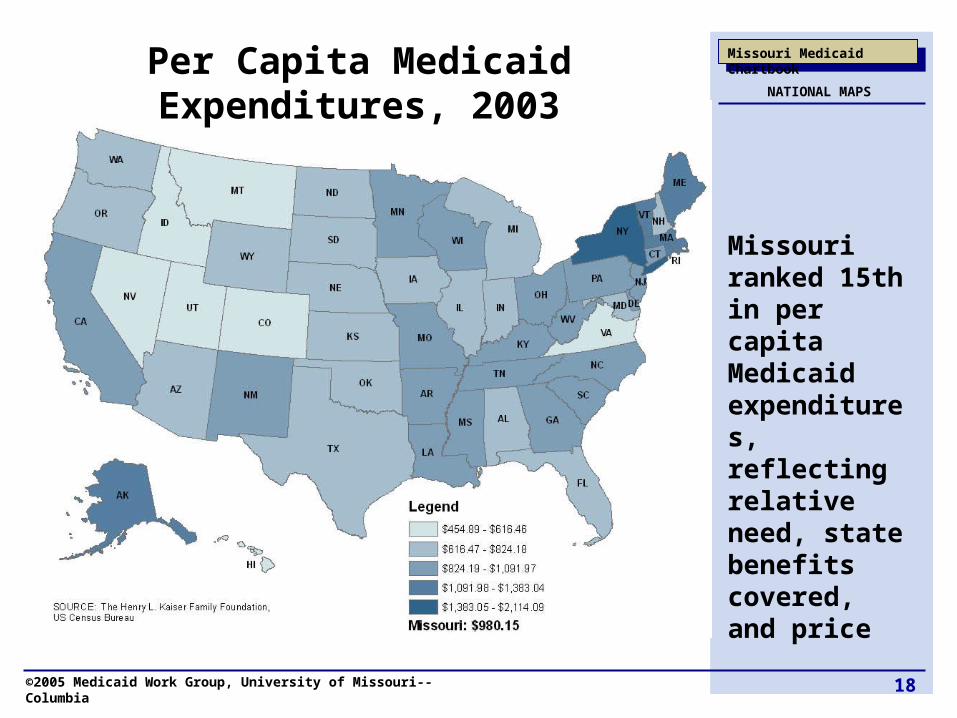
Missouri Medicaid ChartbookPer Capita Medicaid Expenditures, 2003
Missouri ranked 15th in per capita Medicaid expenditures, reflecting relative need, state benefits covered, and price
NATIONAL MAPS
19©2005 Medicaid Work Group, University of Missouri--Columbia
Missouri Medicaid Chartbook
Missouri Charts
20©2005 Medicaid Work Group, University of Missouri--Columbia
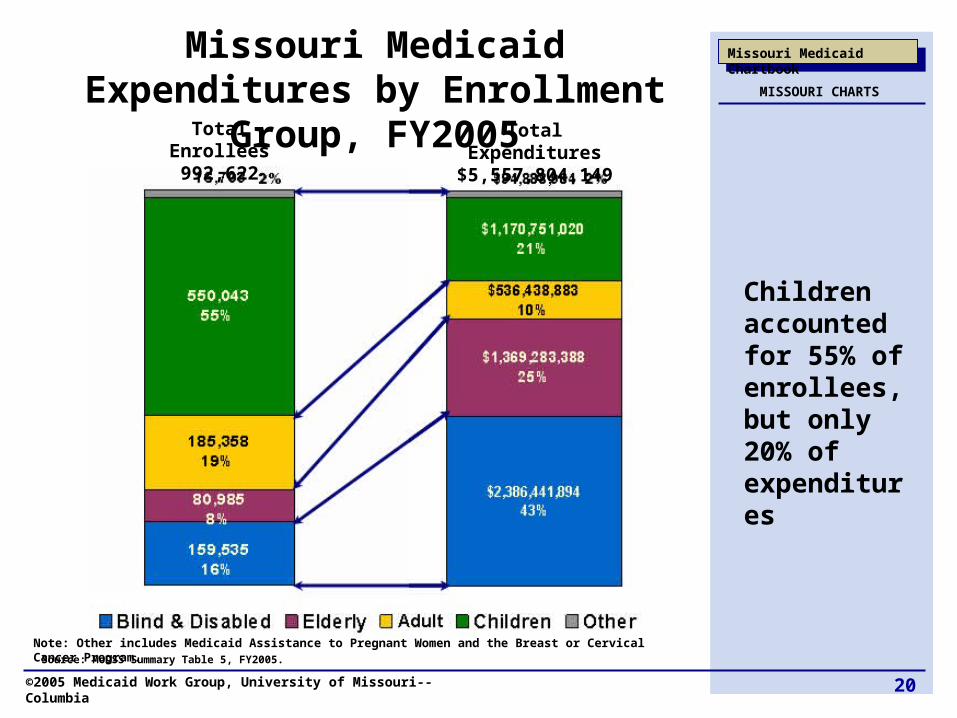
Missouri Medicaid ChartbookMissouri Medicaid Expenditures by Enrollment Group, FY2005
Source: MoDSS Summary Table 5, FY2005.
Children accounted for 55% of enrollees, but only 20% of expenditures
MISSOURI CHARTS
Total Enrollees992,622
Total Expenditures$5,557,804,149
Note: Other includes Medicaid Assistance to Pregnant Women and the Breast or Cervical Cancer Program.
21©2005 Medicaid Work Group, University of Missouri--Columbia
Missouri Medicaid Chartbook
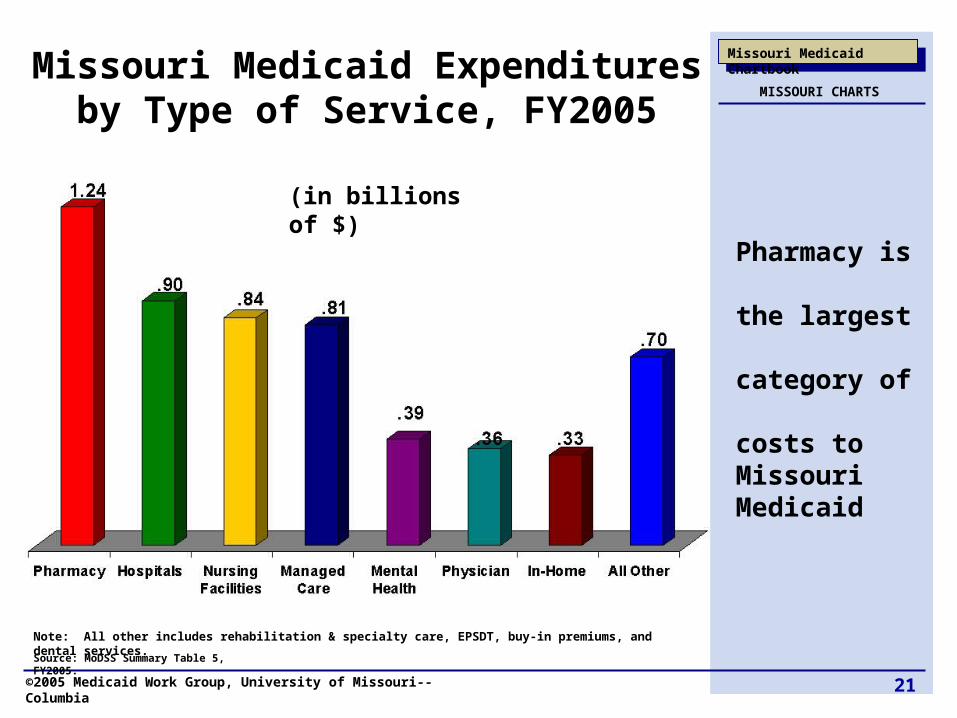
Source: MoDSS Summary Table 5, FY2005.
Missouri Medicaid Expenditures by Type of Service, FY2005
Pharmacy is the largest category of costs to Missouri Medicaid
Note: All other includes rehabilitation & specialty care, EPSDT, buy-in premiums, and dental services.
(in billions of $)
MISSOURI CHARTS
22©2005 Medicaid Work Group, University of Missouri--Columbia
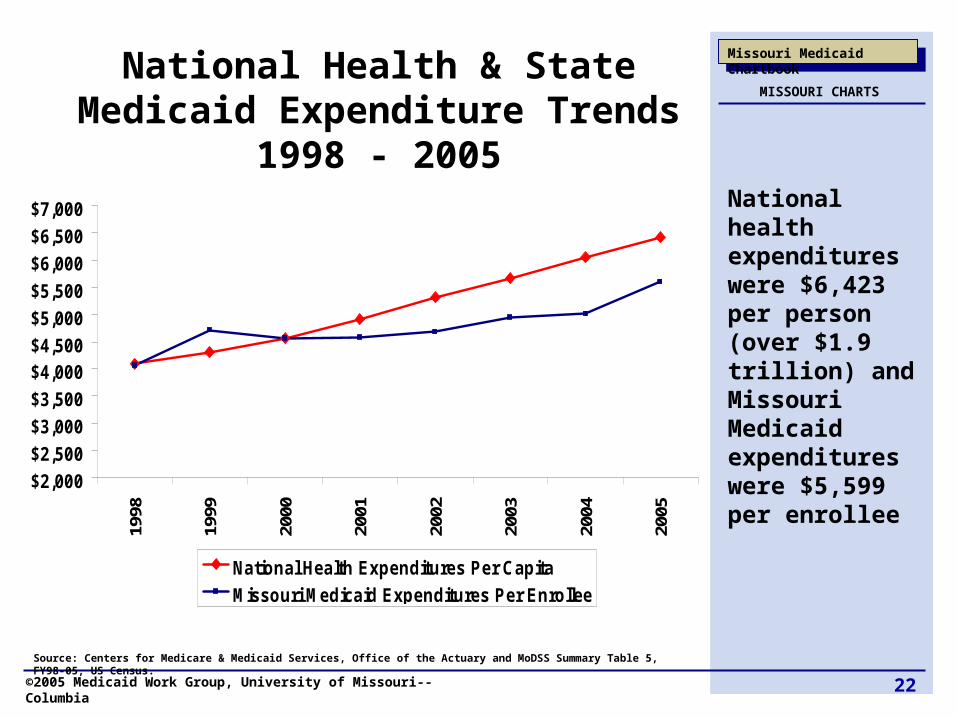
Missouri Medicaid ChartbookNational Health & State Medicaid Expenditure Trends 1998 - 2005
National health expenditures were $6,423 per person (over $1.9 trillion) and Missouri Medicaid expenditures were $5,599 per enrollee
MISSOURI CHARTS
Source: Centers for Medicare & Medicaid Services, Office of the Actuary and MoDSS Summary Table 5, FY98-05, US Census.
$2,000
$2,500
$3,000
$3,500
$4,000$4,500
$5,000
$5,500
$6,000
$6,500
$7,000
1998
1999
2000
2001
2002
2003
2004
2005
National Health Expenditures Per Capita
Missouri Medicaid Expenditures Per Enrollee
23©2005 Medicaid Work Group, University of Missouri--Columbia
Missouri Medicaid Chartbook
Missouri Maps
24©2005 Medicaid Work Group, University of Missouri--Columbia
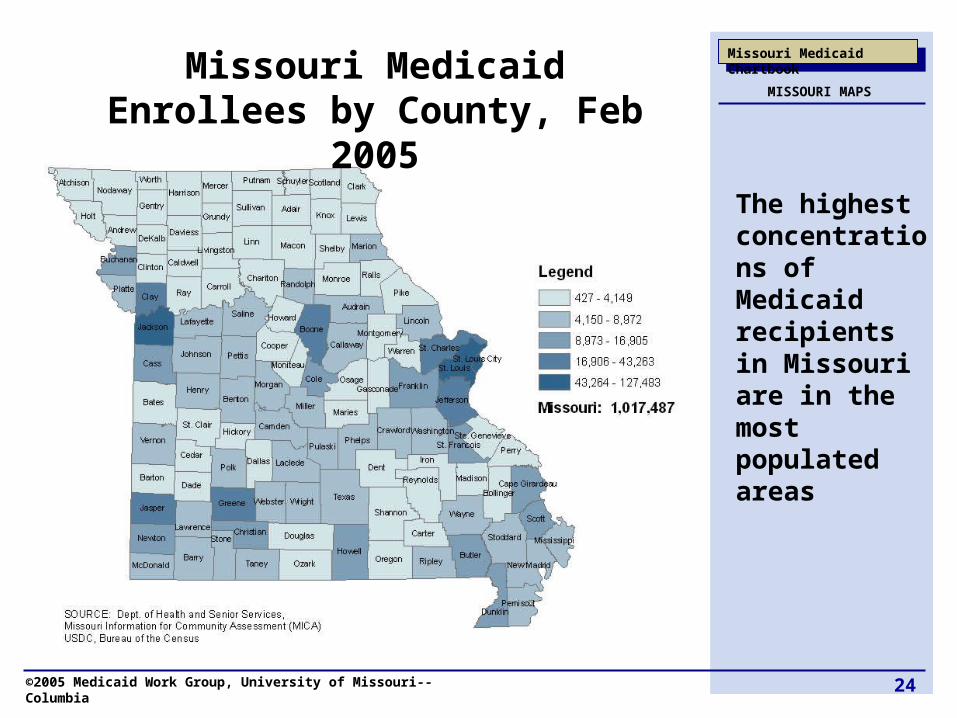
Missouri Medicaid ChartbookMissouri Medicaid Enrollees by County, Feb 2005
The highest concentrations of Medicaid recipients in Missouri are in the most populated areas
MISSOURI MAPS
25©2005 Medicaid Work Group, University of Missouri--Columbia
Missouri Medicaid Chartbook
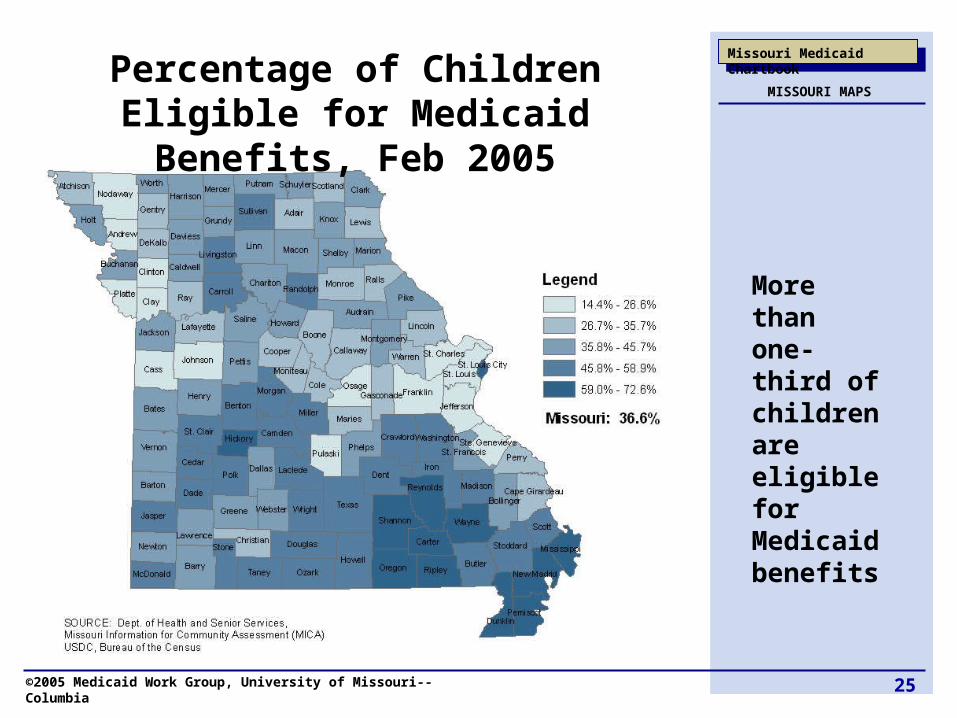
Percentage of Children Eligible for Medicaid Benefits, Feb 2005
More than one-third of children are eligible for Medicaid benefits
MISSOURI MAPS
26©2005 Medicaid Work Group, University of Missouri--Columbia
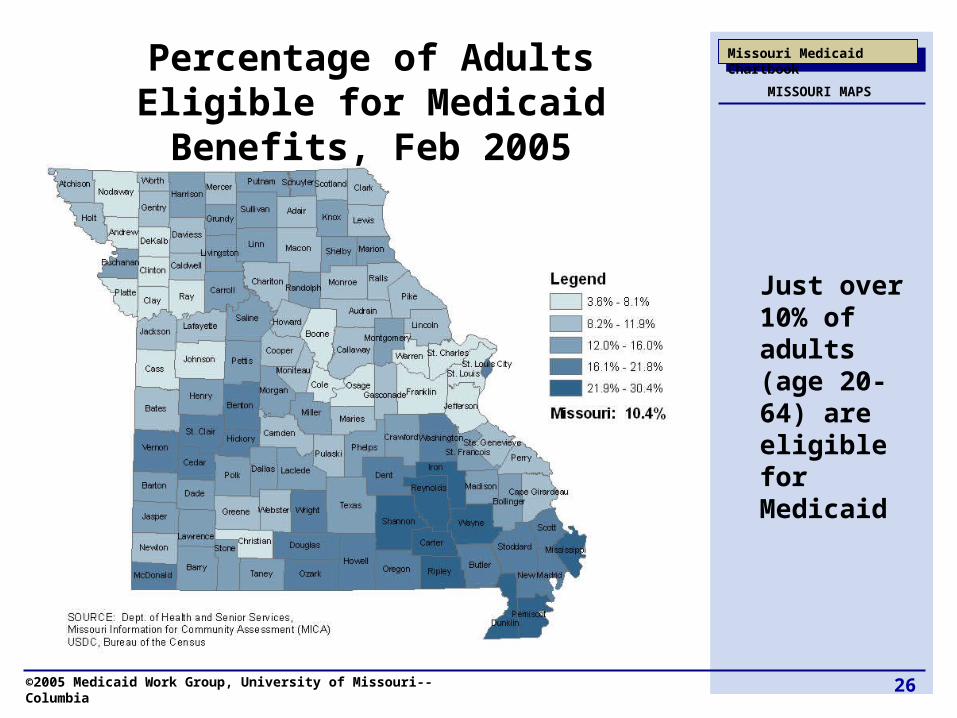
Missouri Medicaid ChartbookPercentage of Adults Eligible for Medicaid Benefits, Feb 2005
Just over 10% of adults (age 20-64) are eligible for Medicaid
MISSOURI MAPS
27©2005 Medicaid Work Group, University of Missouri--Columbia
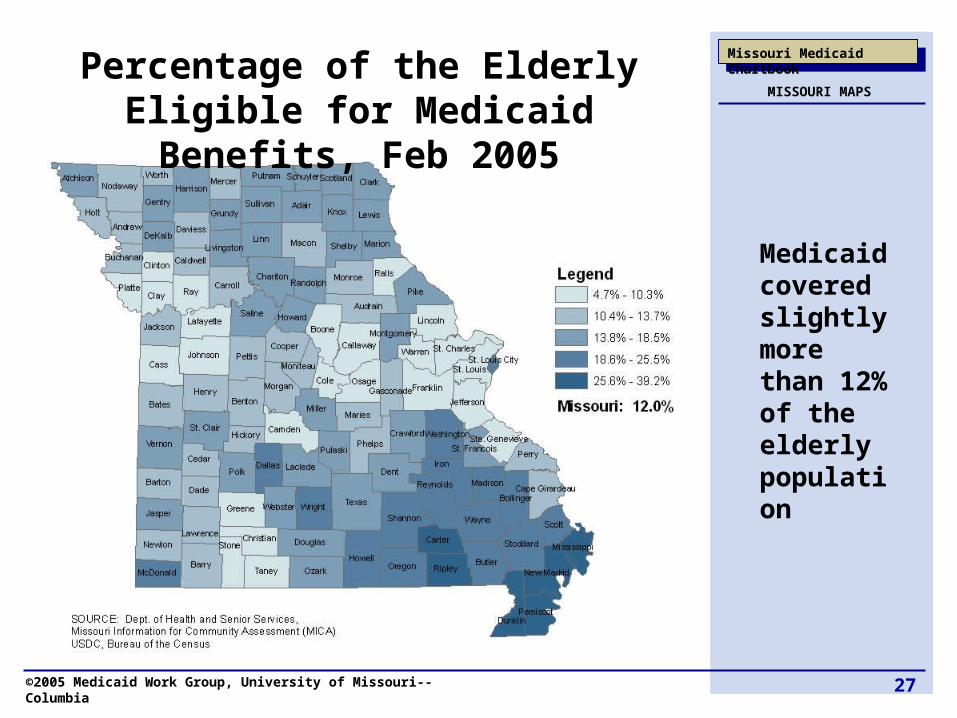
Missouri Medicaid ChartbookPercentage of the Elderly Eligible for Medicaid Benefits, Feb 2005
Medicaid covered slightly more than 12% of the elderly population
MISSOURI MAPS
28©2005 Medicaid Work Group, University of Missouri--Columbia
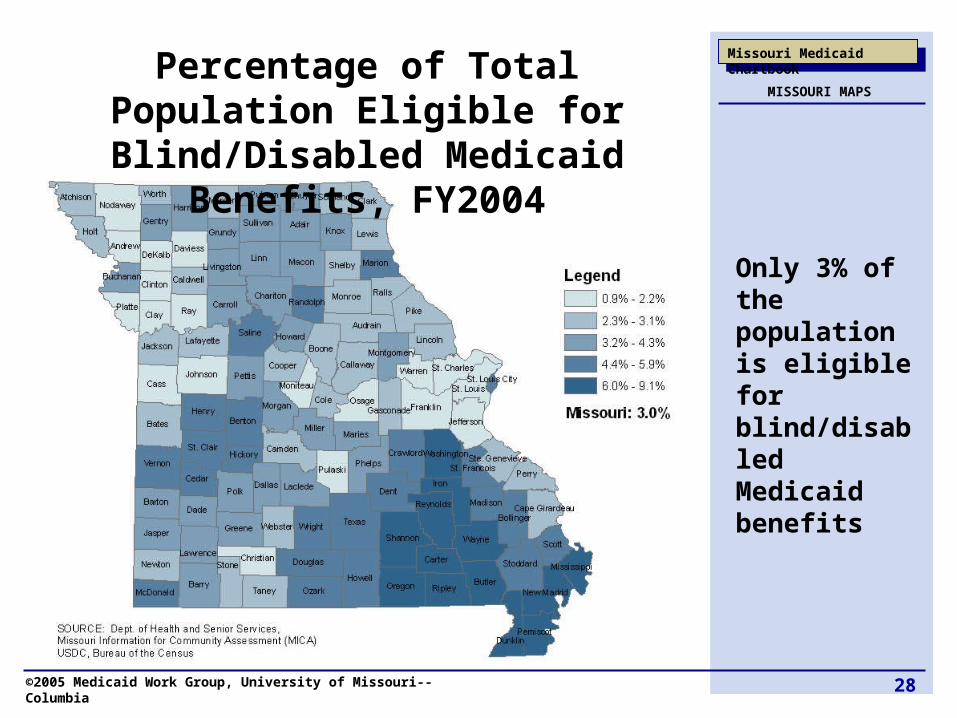
Missouri Medicaid ChartbookPercentage of Total Population Eligible for Blind/Disabled Medicaid Benefits, FY2004
Only 3% of the population is eligible for blind/disabled Medicaid benefits
MISSOURI MAPS
29©2005 Medicaid Work Group, University of Missouri--Columbia
Missouri Medicaid Chartbook
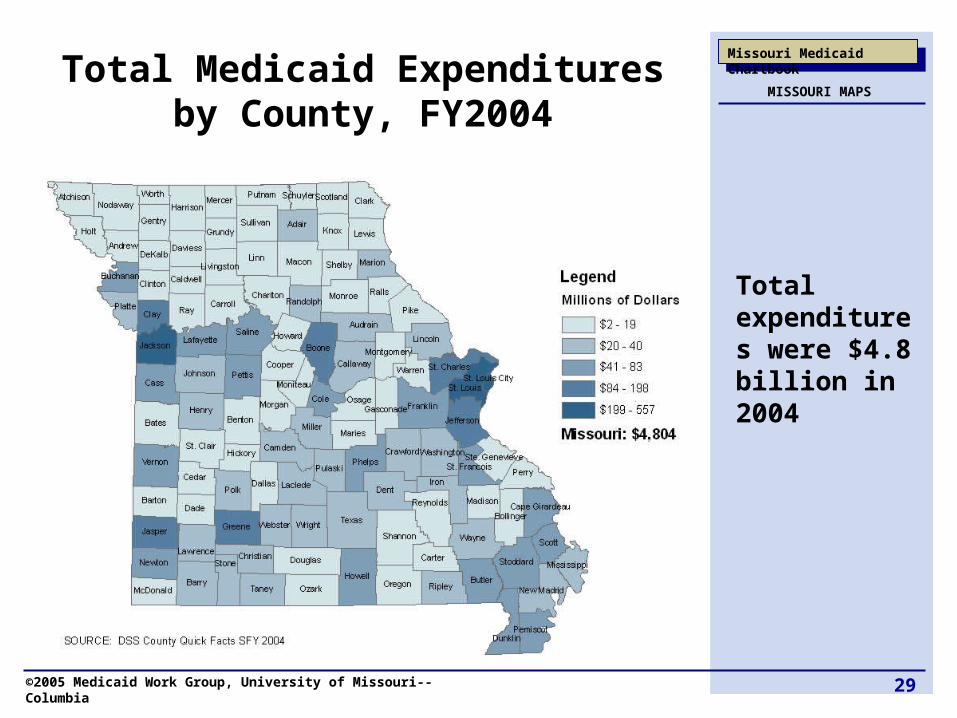
Total Medicaid Expenditures by County, FY2004
Total expenditures were $4.8 billion in 2004
MISSOURI MAPS
30©2005 Medicaid Work Group, University of Missouri--Columbia
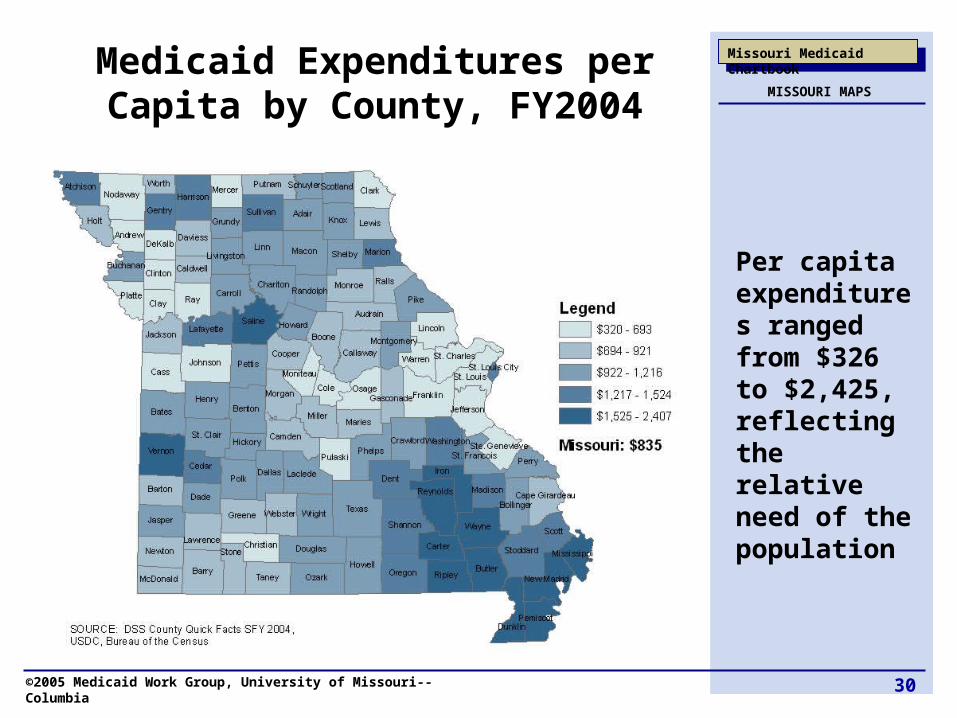
Missouri Medicaid ChartbookMedicaid Expenditures per Capita by County, FY2004
Per capita expenditures ranged from $326 to $2,425, reflecting the relative need of the population
MISSOURI MAPS
31©2005 Medicaid Work Group, University of Missouri--Columbia
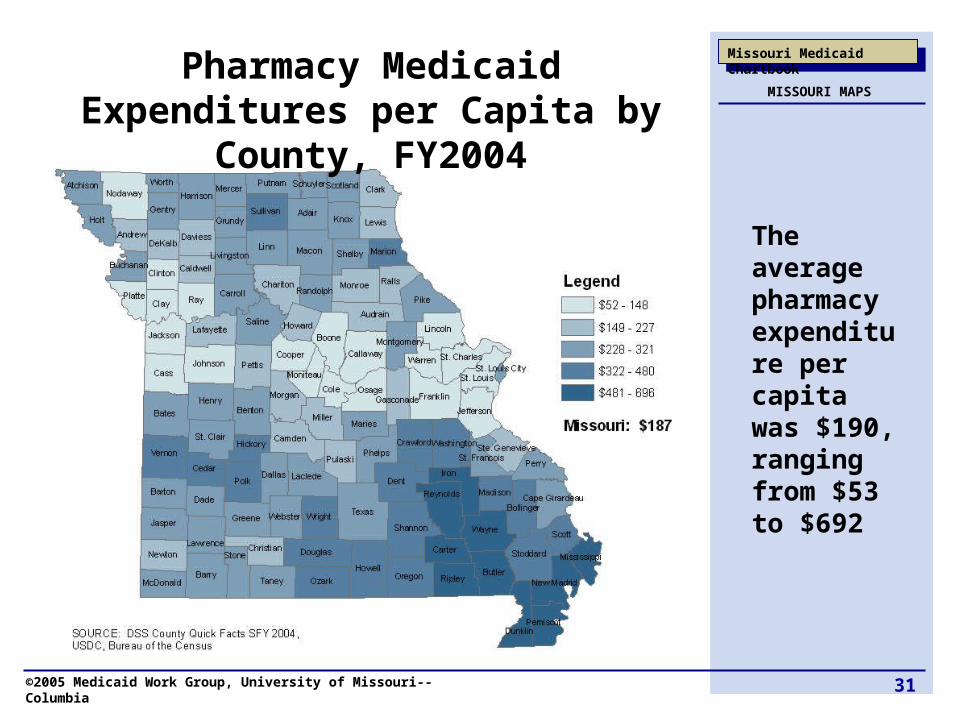
Missouri Medicaid ChartbookPharmacy Medicaid Expenditures per Capita by County, FY2004
The average pharmacy expenditure per capita was $190, ranging from $53 to $692
MISSOURI MAPS
32©2005 Medicaid Work Group, University of Missouri--Columbia
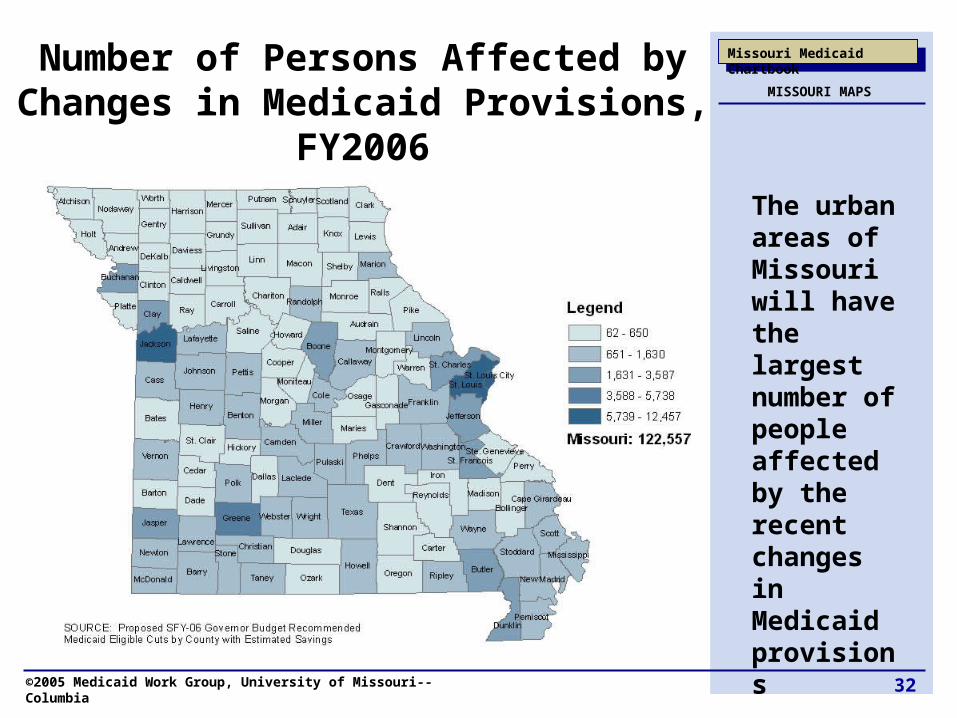
Missouri Medicaid ChartbookNumber of Persons Affected by Changes in Medicaid Provisions,
FY2006
The urban areas of Missouri will have the largest number of people affected by the recent changes in Medicaid provisions
MISSOURI MAPS
33©2005 Medicaid Work Group, University of Missouri--Columbia
Missouri Medicaid Chartbook
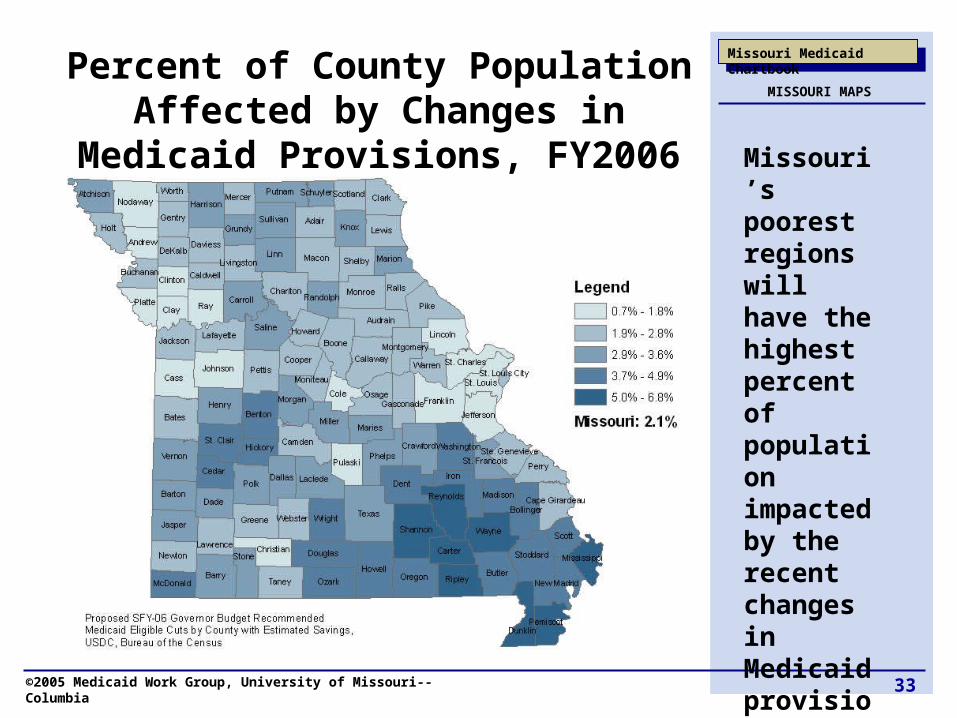
Percent of County Population Affected by Changes in Medicaid
Provisions, FY2006 Missouri’s poorest regions will have the highest percent of population impacted by the recent changes in Medicaid provisions
MISSOURI MAPS
34©2005 Medicaid Work Group, University of Missouri--Columbia
Missouri Medicaid Chartbook
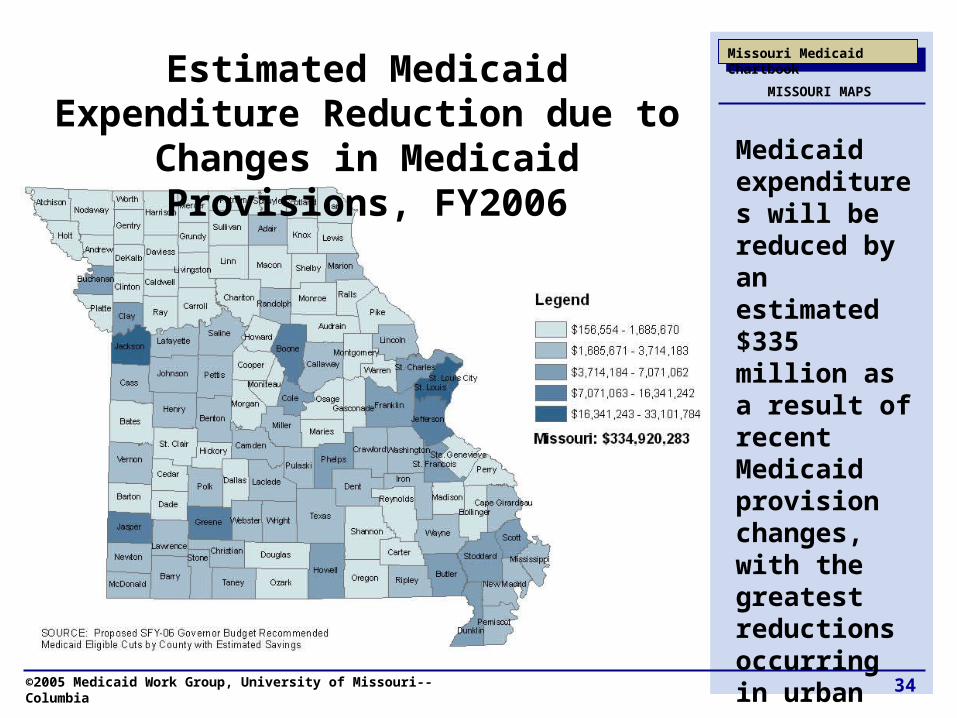
Estimated Medicaid Expenditure Reduction due to Changes in Medicaid Provisions, FY2006 Medicaid
expenditures will be reduced by an estimated $335 million as a result of recent Medicaid provision changes, with the greatest reductions occurring in urban areas
MISSOURI MAPS
Missouri Medicaid Chart Book
The Missouri Medicaid Program:The Missouri Medicaid Program: A Graphical Profile A Graphical Profile
Medicaid Work Group, University of Missouri--Columbia
August 2005
Missouri Medicaid Chartbook
0.0%
20.0%
40.0%
60.0%
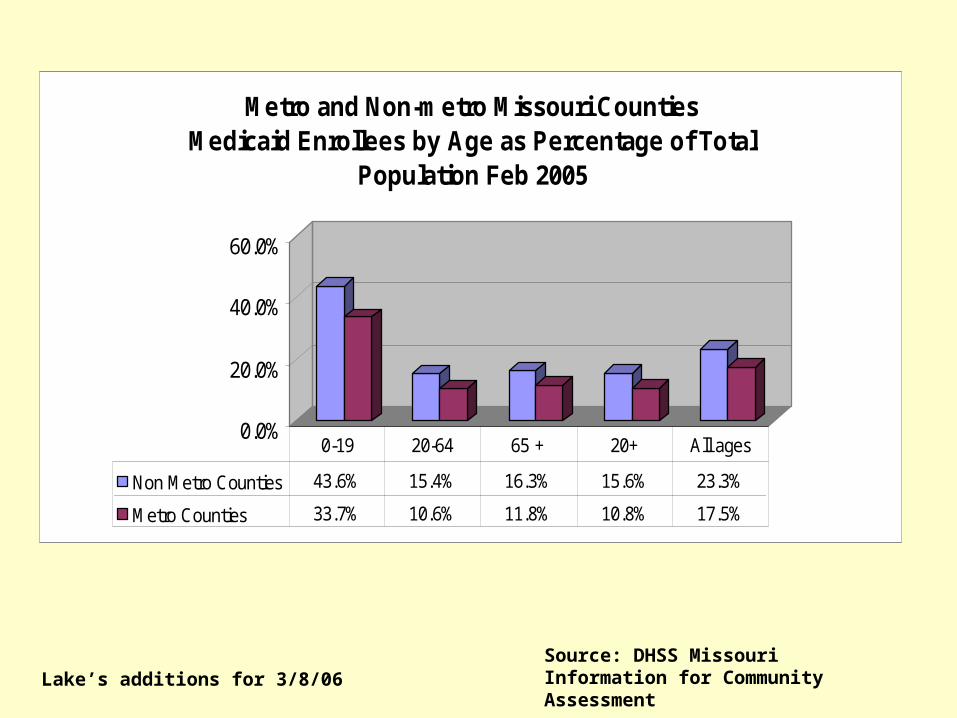
Metro and Non-metro Missouri CountiesMedicaid Enrollees by Age as Percentage of Total
Population Feb 2005
Non Metro Counties 43.6% 15.4% 16.3% 15.6% 23.3%
Metro Counties 33.7% 10.6% 11.8% 10.8% 17.5%
0-19 20-64 65 + 20+ All ages
Lake’s additions for 3/8/06Source: DHSS Missouri Information for Community Assessment
Lake’s additions for 3/8/06
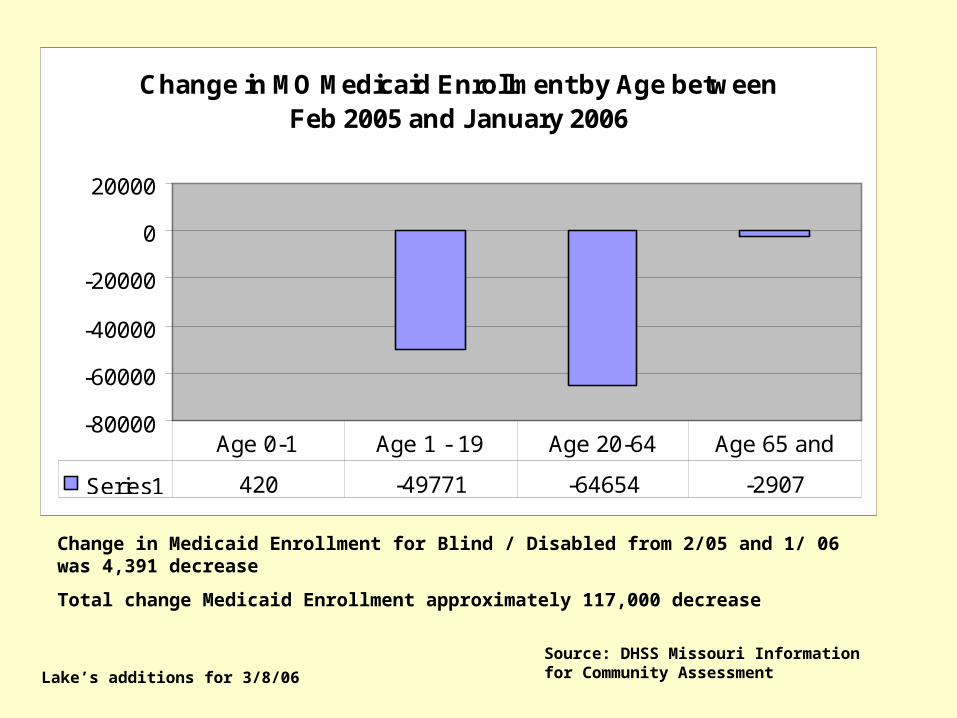
Source: DHSS Missouri Information for Community Assessment
Change in Medicaid Enrollment for Blind / Disabled from 2/05 and 1/ 06 was 4,391 decrease
Total change Medicaid Enrollment approximately 117,000 decrease
Change in MO Medicaid Enrollment by Age between Feb 2005 and January 2006
-80000
-60000
-40000
-20000
0
20000
Series1 420 -49771 -64654 -2907
Age 0-1 Age 1 - 19 Age 20-64 Age 65 and
Things to consider…
• Significant program changes are happening both in Medicaid in MO and in Medicare Part D (prescription drug program) nationally– Rural populations tend to be older and sicker
than urban counter parts– Rural health care providers depend heavily on
Medicare and Medicaid– Health care providers are spending time and
resources helping individuals find ways to pay
Lake’s additions for 3/8/06
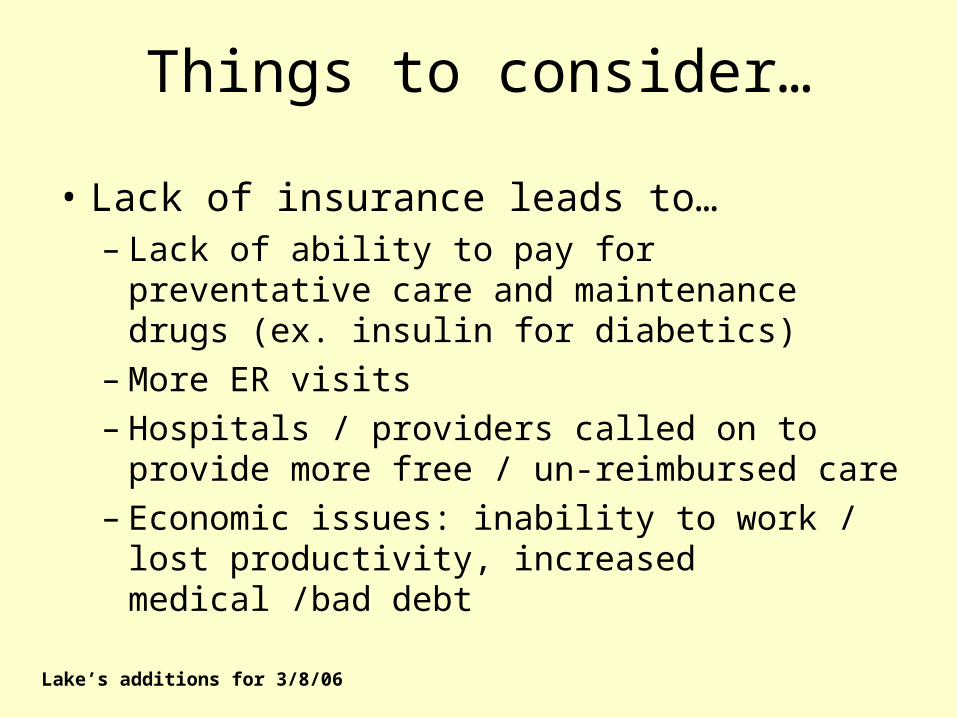
Things to consider…
• Lack of insurance leads to…– Lack of ability to pay for preventative care and
maintenance drugs (ex. insulin for diabetics)– More ER visits– Hospitals / providers called on to provide
more free / un-reimbursed care– Economic issues: inability to work / lost
productivity, increased medical /bad debt
Lake’s additions for 3/8/06
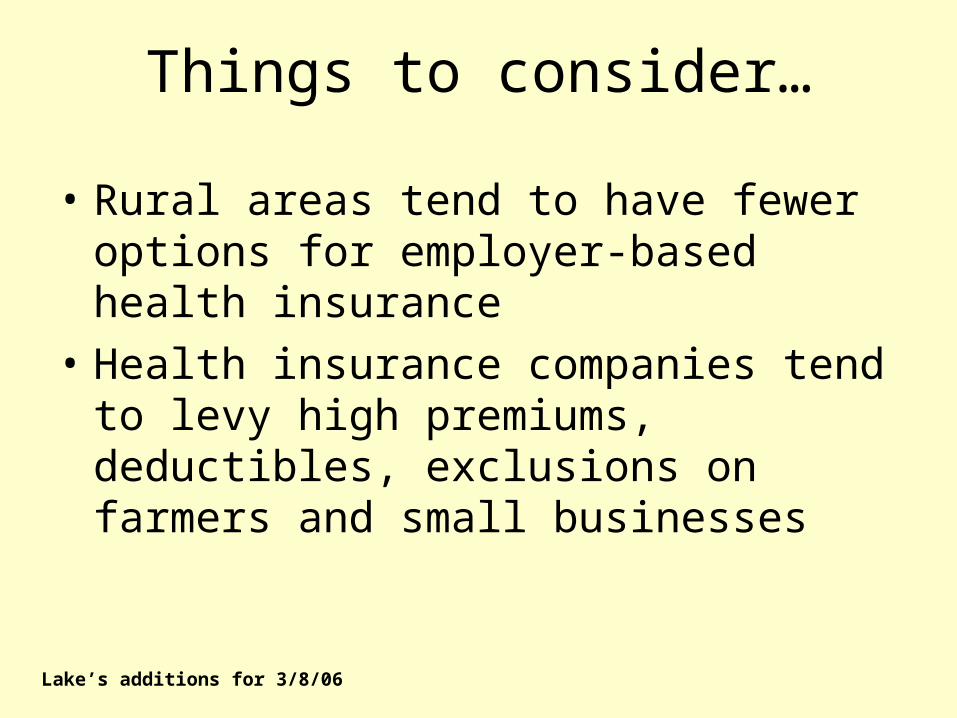
Things to consider…
• Rural areas tend to have fewer options for employer-based health insurance
• Health insurance companies tend to levy high premiums, deductibles, exclusions on farmers and small businesses
Lake’s additions for 3/8/06
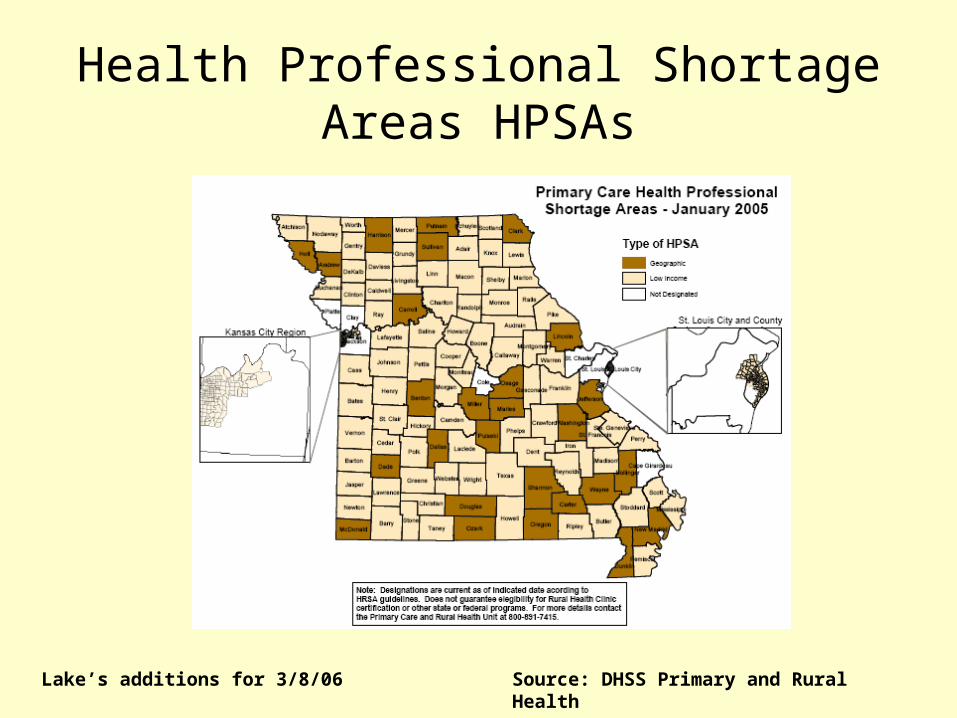
Lake’s additions for 3/8/06 Source: DHSS Primary and Rural Health
Health Professional Shortage Areas HPSAs
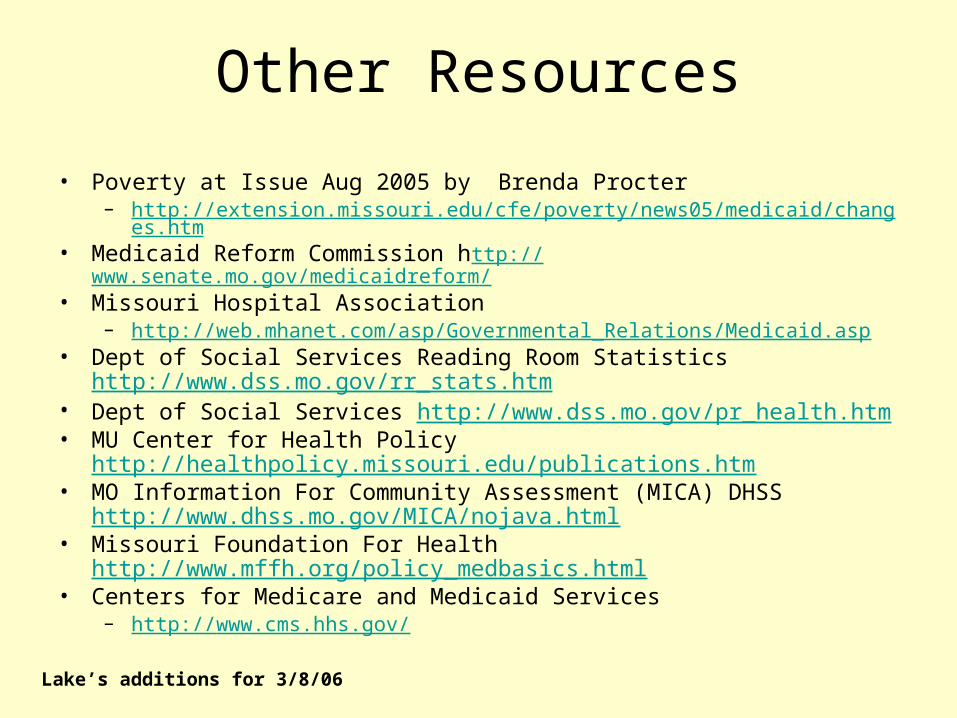
Other Resources
• Poverty at Issue Aug 2005 by Brenda Procter – http://extension.missouri.edu/cfe/poverty/news05/medicaid/changes.htm
• Medicaid Reform Commission http://www.senate.mo.gov/medicaidreform/• Missouri Hospital Association
– http://web.mhanet.com/asp/Governmental_Relations/Medicaid.asp• Dept of Social Services Reading Room Statistics
http://www.dss.mo.gov/rr_stats.htm• Dept of Social Services http://www.dss.mo.gov/pr_health.htm• MU Center for Health Policy
http://healthpolicy.missouri.edu/publications.htm• MO Information For Community Assessment (MICA) DHSS
http://www.dhss.mo.gov/MICA/nojava.html• Missouri Foundation For Health http://www.mffh.org/policy_medbasics.html• Centers for Medicare and Medicaid Services
– http://www.cms.hhs.gov/
Lake’s additions for 3/8/06