About the lithospheric structure of central Tibet, based ...
25
About the lithospheric structure of central Tibet, based on seismic data from the INDEPTH III profile Rolf Meissner a, * , Frederik Tilmann b,1 , Seth Haines c a Institute of Geosciences, Christian Albrechts University, Otto Hahn Platz 1, Kiel, D-24118, Germany b GEOMAR, Kiel, Germany c Geoscience, Stanford University, USA Received 27 November 2002; accepted 5 November 2003 Abstract Signals from 11 shots and 8 earthquakes, and numerous teleseismic events were recorded along the 400-km seismic line INDEPTH III in central Tibet and interpreted together with previous seismic and tectonic data. The abnormal behavior of various mantle phases reveals a complex Moho-transition zone, especially in the northern part of the line, in the Changtang Block, where the lower crust and the mantle show unusually low velocities, a shingled appearance of P n and no low-velocity layer in the upper crust. The strong east – west anisotropy in the Changtang Block is related to an easterly escape movement of the whole lithosphere, facilitated by the warm and weak layers in the lower crust and the upper mantle, bounded apparently by two prominent west – east running fault zones. D 2004 Elsevier B.V. All rights reserved. Keywords: Central Tibet; Crust – mantle transition; Refraction seismics; Anisotropy and tectonic escape 1. Introduction A 400-km seismic wide-angle profile (INDEPTH III) was collected in summer 1998 in central Tibet. Three component broad-band seismometer stations remained on the profile up to summer 1999 for studies of teleseismic events and local earthquakes. During the active shooting phase, 11 large shots delivered seismic signals to the 62 seismometers, creating a dense network of overlapping travel time branches. Based on the seismic data of INDEPTH III, a number of papers were recently published: Huang et al. (2000) report on the seismic anisotropy in central Tibet and its correlation to tectonics, based on teleseismic stud- ies, and Zhao et al. (2001) report on modeling the crustal structure in central Tibet from analyzing travel times from the 11 big shots along INDEPTH III. Rapine et al. (2003) constrain the regional scale crustal structure in Tibet based on surface wave dispersion analysis; Haines et al. (2003) concentrate on the shot-point data of INDEPTH III and deep crustal processes; and Kind et al. (2002) present discontinuity images of the mantle, based on the migration of receiver functions and show that the Poisson ratio is almost normal in north central Tibet. Although the above-mentioned papers cover the most important geologic topics in central Tibet, we feel that tectonic questions about structure and evo- 0040-1951/$ - see front matter D 2004 Elsevier B.V. All rights reserved. doi:10.1016/j.tecto.2003.11.007 * Corresponding author. E-mail address: [email protected] (R. Meissner). 1 Now at: University Cambridge, England. www.elsevier.com/locate/tecto Tectonophysics 380 (2004) 1 –25 brought to you by CORE View metadata, citation and similar papers at core.ac.uk provided by OceanRep
Transcript of About the lithospheric structure of central Tibet, based ...
www.elsevier.com/locate/tecto
Tectonophysics 380 (2004) 1–25
brought to you by COREView metadata, citation and similar papers at core.ac.uk
provided by OceanRep
About the lithospheric structure of central Tibet,
based on seismic data from the INDEPTH III profile
Rolf Meissnera,*, Frederik Tilmannb,1, Seth Hainesc
a Institute of Geosciences, Christian Albrechts University, Otto Hahn Platz 1, Kiel, D-24118, GermanybGEOMAR, Kiel, Germany
cGeoscience, Stanford University, USA
Received 27 November 2002; accepted 5 November 2003
Abstract
Signals from 11 shots and 8 earthquakes, and numerous teleseismic events were recorded along the 400-km seismic line
INDEPTH III in central Tibet and interpreted together with previous seismic and tectonic data. The abnormal behavior of
various mantle phases reveals a complex Moho-transition zone, especially in the northern part of the line, in the Changtang
Block, where the lower crust and the mantle show unusually low velocities, a shingled appearance of Pn and no low-velocity
layer in the upper crust. The strong east–west anisotropy in the Changtang Block is related to an easterly escape movement of
the whole lithosphere, facilitated by the warm and weak layers in the lower crust and the upper mantle, bounded apparently by
two prominent west–east running fault zones.
D 2004 Elsevier B.V. All rights reserved.
Keywords: Central Tibet; Crust–mantle transition; Refraction seismics; Anisotropy and tectonic escape
1. Introduction report on the seismic anisotropy in central Tibet and
A 400-km seismic wide-angle profile (INDEPTH
III) was collected in summer 1998 in central Tibet.
Three component broad-band seismometer stations
remained on the profile up to summer 1999 for studies
of teleseismic events and local earthquakes. During
the active shooting phase, 11 large shots delivered
seismic signals to the 62 seismometers, creating a
dense network of overlapping travel time branches.
Based on the seismic data of INDEPTH III, a number
of papers were recently published: Huang et al. (2000)
0040-1951/$ - see front matter D 2004 Elsevier B.V. All rights reserved.
doi:10.1016/j.tecto.2003.11.007
* Corresponding author.
E-mail address: [email protected] (R. Meissner).1 Now at: University Cambridge, England.
its correlation to tectonics, based on teleseismic stud-
ies, and Zhao et al. (2001) report on modeling the
crustal structure in central Tibet from analyzing travel
times from the 11 big shots along INDEPTH III.
Rapine et al. (2003) constrain the regional scale
crustal structure in Tibet based on surface wave
dispersion analysis; Haines et al. (2003) concentrate
on the shot-point data of INDEPTH III and deep
crustal processes; and Kind et al. (2002) present
discontinuity images of the mantle, based on the
migration of receiver functions and show that the
Poisson ratio is almost normal in north central Tibet.
Although the above-mentioned papers cover the
most important geologic topics in central Tibet, we
feel that tectonic questions about structure and evo-
R. Meissner et al. / Tectonophysics 380 (2004) 1–252
lution have yet to be solved. We list a few of the
remaining topics which will be addressed in this
paper: (1) We give an alternative interpretation of
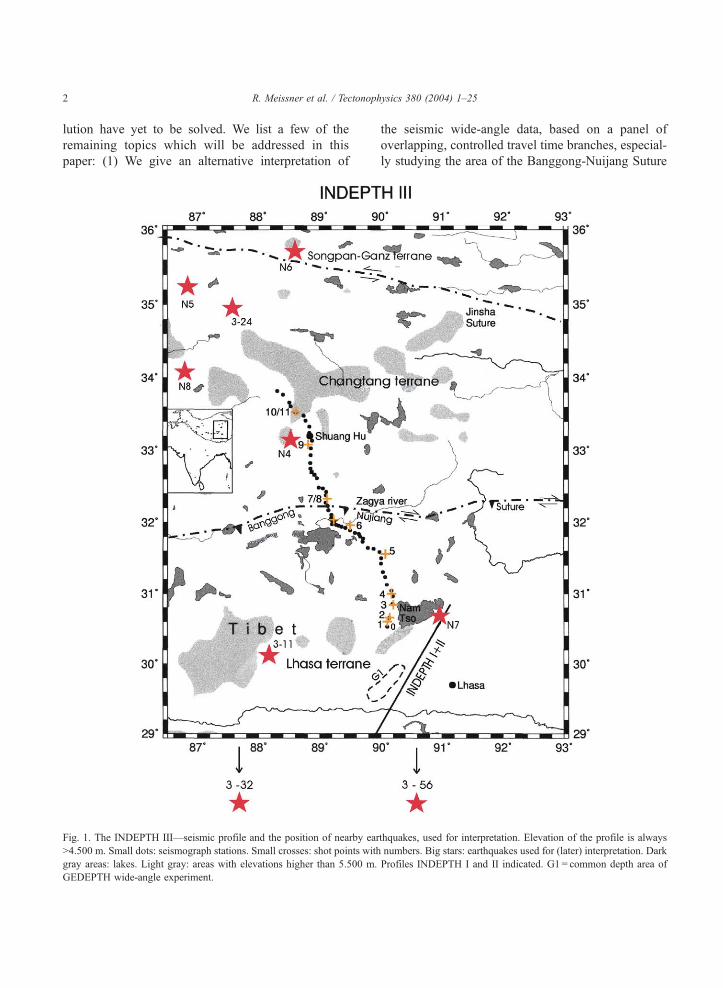
Fig. 1. The INDEPTH III—seismic profile and the position of nearby ear
>4.500 m. Small dots: seismograph stations. Small crosses: shot points with
gray areas: lakes. Light gray: areas with elevations higher than 5.500 m.
GEDEPTH wide-angle experiment.
the seismic wide-angle data, based on a panel of
overlapping, controlled travel time branches, especial-
ly studying the area of the Banggong-Nuijang Suture
thquakes, used for interpretation. Elevation of the profile is always
numbers. Big stars: earthquakes used for (later) interpretation. Dark
Profiles INDEPTH I and II indicated. G1 = common depth area of
R. Meissner et al. / Tectonophysics 380 (2004) 1–25 3
(BNS). (2) We add new seismological data from eight
local earthquakes around INDEPTH III and also use
overlapping travel time branches. (3) We report on the
low crustal velocities in the Changtang Block and the
strange behavior of the mantle phases PMP and Pn. (4)
We study the crust–mantle transition (at a depth of
f 70 km) and argue that a smooth velocity gradient
zone in the south and a heterogeneous zone in the
north seem to characterize the Moho. (5) We interpret
the strong SKS-anisotropy in the Changtang Block as
indicating massive lithospheric (not only crustal)
escape to the east. (6) We discuss the nature of crustal
doubling in Tibet.
The topics (1) to (6) addressed above are rooted in
a huge amount of geophysical, geodetic and geolog-
ical investigations, starting with a tectonic overview
of Argand (1924), later followed by plate tectonic
considerations by Powel and Conaghan (1973),
Dewey and Burke (1973), Molnar and Tapponier
(1975), Tapponnier (1981, 1990), Le Pichon et al.
(1997) and Tapponier et al. (2001). Considerable field
activity started in the 1970s, and seismic/seismolog-
ical studies were carried out in the 1980s and 1990s
(Jia et al., 1981; Barazangi and Ni, 1982; Hirn et al.,
1984; Coward et al., 1988; Beghoul et al., 1993; Hirn
et al., 1995; Sapin and Hirn, 1997), always accompa-
nied by general tectonic and rheological studies (Zhao
and Morgan, 1985, 1987; Beghoul et al., 1993; West-
away, 1995). Regarding the crustal and lithospheric
structure, the International Depth Profiling of Tibet
and the Himalaya (INDEPTH project), starting in
1992, played a special role in collecting new details
(INDEPTH Project Team et al., 1993; Nelson et al.,
1996). In 1998, INDEPTH was continued to central
Tibet (INDEPTH III, see Fig. 1). The project was not
restricted to seismic methods and included also elec-
tromagnetic, geologic mapping and seismologic stud-
ies (Makowski and Klemperer, 1999).
Many hard facts about crustal thickness and litho-
spheric velocity structure were derived from the var-
ious INDEPTH campaigns. The Tibetan Plateau with
an average elevation of between 4 and 5 km and an
area of nearly 2000� 1000 km is not only the highest
and largest plateau on earth but also has turned out to
have the largest regional crustal thickness of f 70 km.
It has become widely accepted that its origin is a
product of the long-time collision between the Indian
subcontinent and the Asian continent, a process which
is still going on today (Dewey and Burke, 1973;
Ratschbacher, 1996). Details of its evolution, however,
are still hotly debated. Beghoul et al. (1993) and Kola-
Ojo and Meissner (2001) discuss the main evolution-
ary models of the Tibetan plateau. It seems that the
hydraulic pump model (Zhao and Morgan, 1985,
1987; Westaway, 1995) forms the basis for other
models, e.g., for the tectonic escape model (Molnar
and Tapponier, 1975; Tapponnier, 1981, 1990) and
especially for the underthrusting (intrusion) model,
going back to Argand (1924), modified by Powel
and Conaghan (1973) and Powel (1986) and supported
by new seismological studies (Beghoul et al., 1993).
The weak rheology of a thick crust dictates that it is
easily compressed and thickened, possibly including
some shear zones in the rigid upper crust and that it is
also easily intruded, especially in the weak lower part,
perhaps by an indentor like the (cold) Indian subcrustal
lithosphere from the south (Kosarev et al., 1999). Both
processes, the overthickening and the indentation, lead
to a tectonic escape of material to the east under the
squeeze of the N–S compression (Tapponnier, 1981,
1990; Meissner et al., 2002). New arguments for the
tectonic escape of central Tibet come from the strong
SKS anisotropy (Huang et al., 2000; McNamara et al.,
1994; Herquel et al., 1995).
2. A new evaluation of the seismic wide-angle data
along INDEPTH III
As mentioned in the Introduction section and
described in detail in Zhao et al. (2001), 11 big shots
were fired and their signals were recorded by the 62
seismometers along the 400-km long line of
INDEPTH III (see Fig. 1). Five record sections of
the vertical components of the geophones with some
correlation are contained in Zhao et al. (2001). All
record sections have been band-passed filtered (2–12
Hz) and normalized. We display one of the record
sections (shot-point 3) in Fig. 2. It is one of the best
sections and contains refracted and reflected crustal
phases, among them a clear PMP wave at a distance
between 180 and 350 km. There are other peculiari-
ties: about 20–30 km south of the BNS at 150 km
offset the Pg wave seems to end. An intra-crustal
phase is observed between 100 and 150 km and also
seems to disappear here. There is a time delay of
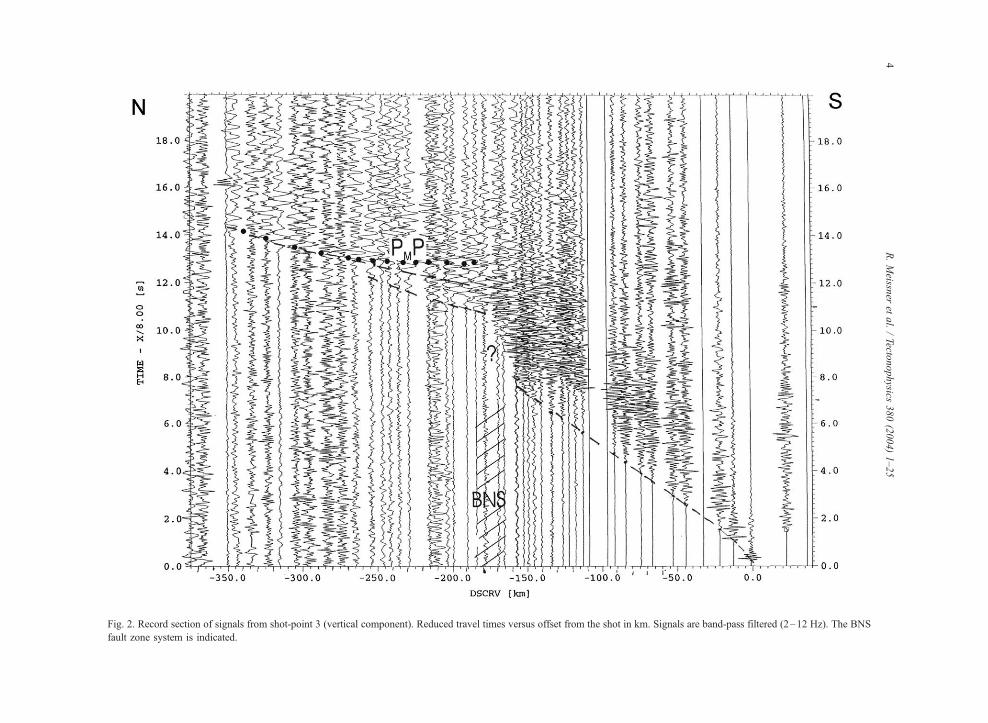
Fig. 2. Record section of signals from shot-point 3 (vertical component). Reduced travel times versus offset from the shot in km. Signals are band-pass filtered (2–12 Hz). The BNS
fault zone system is indicated.
R.Meissn
eret
al./Tecto
nophysics
380(2004)1–25
4
R. Meissner et al. / Tectonophysics 380 (2004) 1–25 5
about 3 s before the next phase starts. In general, such
a big ‘‘jump’’ corresponds to a low velocity zone
(LVZ), with a horizontal or oblique (even vertical)
orientation, but some other possibilities are mentioned
in the Discussion section.
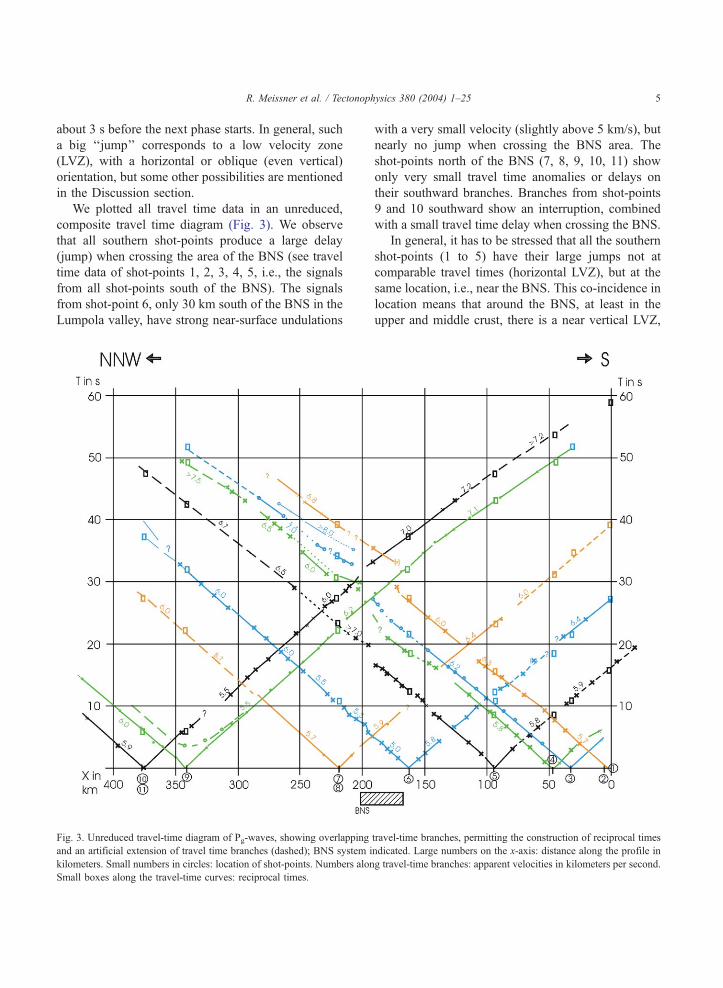
We plotted all travel time data in an unreduced,
composite travel time diagram (Fig. 3). We observe
that all southern shot-points produce a large delay
(jump) when crossing the area of the BNS (see travel
time data of shot-points 1, 2, 3, 4, 5, i.e., the signals
from all shot-points south of the BNS). The signals
from shot-point 6, only 30 km south of the BNS in the
Lumpola valley, have strong near-surface undulations
Fig. 3. Unreduced travel-time diagram of Pg-waves, showing overlapping
and an artificial extension of travel time branches (dashed); BNS system i
kilometers. Small numbers in circles: location of shot-points. Numbers alon
Small boxes along the travel-time curves: reciprocal times.
with a very small velocity (slightly above 5 km/s), but
nearly no jump when crossing the BNS area. The
shot-points north of the BNS (7, 8, 9, 10, 11) show
only very small travel time anomalies or delays on
their southward branches. Branches from shot-points
9 and 10 southward show an interruption, combined
with a small travel time delay when crossing the BNS.
In general, it has to be stressed that all the southern
shot-points (1 to 5) have their large jumps not at
comparable travel times (horizontal LVZ), but at the
same location, i.e., near the BNS. This co-incidence in
location means that around the BNS, at least in the
upper and middle crust, there is a near vertical LVZ,
travel-time branches, permitting the construction of reciprocal times
ndicated. Large numbers on the x-axis: distance along the profile in
g travel-time branches: apparent velocities in kilometers per second.
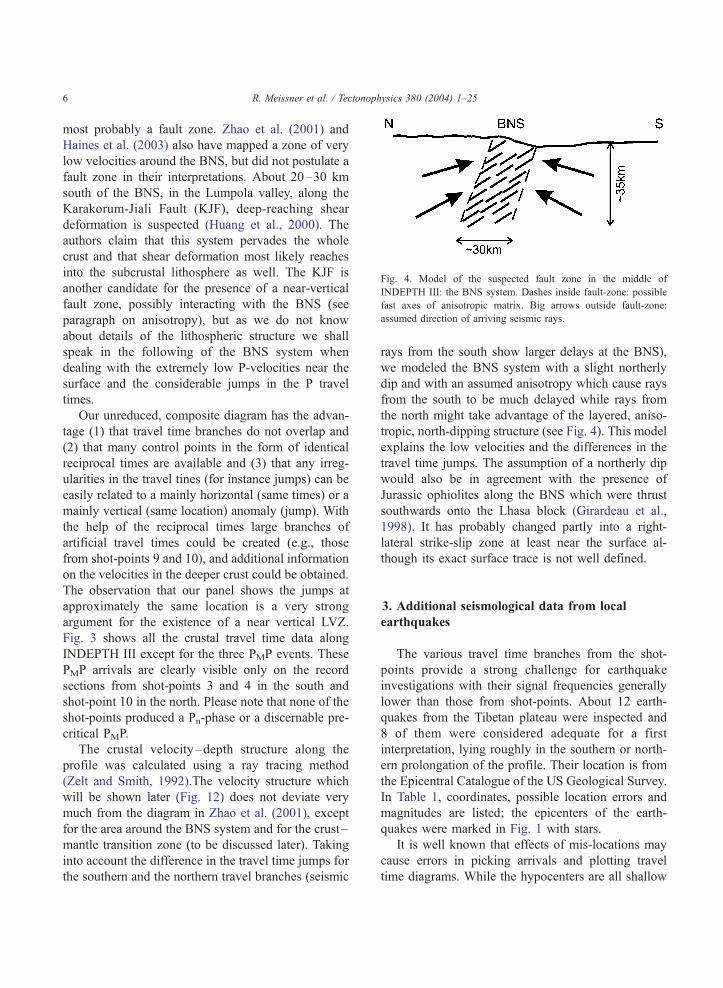
Fig. 4. Model of the suspected fault zone in the middle of
INDEPTH III: the BNS system. Dashes inside fault-zone: possible
fast axes of anisotropic matrix. Big arrows outside fault-zone:
assumed direction of arriving seismic rays.
R. Meissner et al. / Tectonophysics 380 (2004) 1–256
most probably a fault zone. Zhao et al. (2001) and
Haines et al. (2003) also have mapped a zone of very
low velocities around the BNS, but did not postulate a
fault zone in their interpretations. About 20–30 km
south of the BNS, in the Lumpola valley, along the
Karakorum-Jiali Fault (KJF), deep-reaching shear
deformation is suspected (Huang et al., 2000). The
authors claim that this system pervades the whole
crust and that shear deformation most likely reaches
into the subcrustal lithosphere as well. The KJF is
another candidate for the presence of a near-vertical
fault zone, possibly interacting with the BNS (see
paragraph on anisotropy), but as we do not know
about details of the lithospheric structure we shall
speak in the following of the BNS system when
dealing with the extremely low P-velocities near the
surface and the considerable jumps in the P travel
times.
Our unreduced, composite diagram has the advan-
tage (1) that travel time branches do not overlap and
(2) that many control points in the form of identical
reciprocal times are available and (3) that any irreg-
ularities in the travel tines (for instance jumps) can be
easily related to a mainly horizontal (same times) or a
mainly vertical (same location) anomaly (jump). With
the help of the reciprocal times large branches of
artificial travel times could be created (e.g., those
from shot-points 9 and 10), and additional information
on the velocities in the deeper crust could be obtained.
The observation that our panel shows the jumps at
approximately the same location is a very strong
argument for the existence of a near vertical LVZ.
Fig. 3 shows all the crustal travel time data along
INDEPTH III except for the three PMP events. These
PMP arrivals are clearly visible only on the record
sections from shot-points 3 and 4 in the south and
shot-point 10 in the north. Please note that none of the
shot-points produced a Pn-phase or a discernable pre-
critical PMP.
The crustal velocity–depth structure along the
profile was calculated using a ray tracing method
(Zelt and Smith, 1992).The velocity structure which
will be shown later (Fig. 12) does not deviate very
much from the diagram in Zhao et al. (2001), except
for the area around the BNS system and for the crust–
mantle transition zone (to be discussed later). Taking
into account the difference in the travel time jumps for
the southern and the northern travel branches (seismic
rays from the south show larger delays at the BNS),
we modeled the BNS system with a slight northerly
dip and with an assumed anisotropy which cause rays
from the south to be much delayed while rays from
the north might take advantage of the layered, aniso-
tropic, north-dipping structure (see Fig. 4). This model
explains the low velocities and the differences in the
travel time jumps. The assumption of a northerly dip
would also be in agreement with the presence of
Jurassic ophiolites along the BNS which were thrust
southwards onto the Lhasa block (Girardeau et al.,
1998). It has probably changed partly into a right-
lateral strike-slip zone at least near the surface al-
though its exact surface trace is not well defined.
3. Additional seismological data from local
earthquakes
The various travel time branches from the shot-
points provide a strong challenge for earthquake
investigations with their signal frequencies generally
lower than those from shot-points. About 12 earth-
quakes from the Tibetan plateau were inspected and
8 of them were considered adequate for a first
interpretation, lying roughly in the southern or north-
ern prolongation of the profile. Their location is from
the Epicentral Catalogue of the US Geological Survey.
In Table 1, coordinates, possible location errors and
magnitudes are listed; the epicenters of the earth-
quakes were marked in Fig. 1 with stars.
It is well known that effects of mis-locations may
cause errors in picking arrivals and plotting travel
time diagrams. While the hypocenters are all shallow
Table 1
Earthquakes around INDEPTH III
Event Direction
to line
k u Estim. poss.
mis-location
M
New 6 N 88.60 35.27 < 5 km 4.7
New 5 NNW 88.84 35.25 < 30 km 4.4
3–24 NNW 87.57 34.96 < 5 km 4.4
New 8 WNW 86.79 34.09 < 15 km 3.8
Various 1–4 INLINE f 89 f 32 < 3 km ?
3–56 S 90.98 27.56 ? 5.2
3–32 SW 87.73 28.01 ? 5.2
3–11 W 88.17 30.13 < 5 km 5.7
New 7 E 90.93 30.56 < 5 km 4.4
Parameters of earthquakes around INDEPTH III, used for
interpretation.
Table 2
P-velocities of earthquakes used
Event VP in Pn starts at Remarks
upper/lower
crust (km/s)Distance
(km)
Time
(s)
Velocity
(km/s)
New 6 No/6.9 355 53 7.6–7.7 one short Pnbranch;
earthquake in
Songpan Terrane,
late PMP
indicated,
no late PnNew 5 6.0/6.0 300 44 7.7 first Pn very
458 61 7.9 short and weak,
548 82 7.7 other Pn branches
very late, no
crustal vel. >6.0
km/s, some late
PMP indicated
3–24 6.3/6.3 275 44 7.7 very short
340 52 branches Pn, later
PMP indicated
New 8 6.2/6.6 250 44 7.7 short branches Pn;
400 64 7.8 delays at BNS
Various
1–4
5.6, 5.8/
6.4,
6.5
– – – inline, too short
to record mantle
phases
3–56 outside
line
< 350 < 57 8.0–8.2 only one Pn,,
smooth delays
around BNS
3–32 outside
line
< 350 < 55 8.0 only one Pn,smooth delays
around BNS
3–11 6.3/6.3 360 55 8.0 perpendicular to
southern part
of line
New 7 6.3/6.9 295 52 8.1 large delays at
BNS, very low f.,
high vel. in lower
crust
P-velocities in crust and mantle.
Please note that all northern earthquakes with shingling Pn have
strong crustal branches at later travel times.
R. Meissner et al. / Tectonophysics 380 (2004) 1–25 7
and cannot cause serious deviations the possible errors
in epicenters were calculated by simple geometry: It
was found out that even an error of 15 km would be
negligible for all Pn branches and would change Pgbranches slightly only near the sources. From the
parallel branches of the Pg from adjacent earthquakes,
however, we conclude that—at least in the northern
sector—
– lateral errors in location can probably be neglected
and
– all hypocenters seem to be shallow.
After Langin et al., 2003, hypocenters in the north
are generally less than 20 km, but we conclude from
the exact parallelism of the Pg-waves that our four
earthquakes in the north are certainly shallower.
In Table 2, crustal and mantle phases are listed. In
contrast to signals from the shot-points, all earthquake
records show Pn-waves, although they appear weak,
short and shingled in the north and show a different
beginning. Two sections in the north show indications
of PMP, apparently near and behind the critical dis-
tance (see below for a detailed discussion).
As a first example, we take the shallow M = 4.4
earthquake New 7, situated about 70 km east of the
southern end of INDEPTH III. It was recorded with
only 20 samples/s, and except for an anti-alias filter
no further filter was used. Fig. 5 shows the record
section of the vertical components. The section con-
tains much lower frequency ( f ) than any of the
sections from the shot-points. The time jump visible
for all southern shot-points near the BNS system
shows up clearly in this section, too, although with
smaller amplitudes. At larger offsets a velocity of 6.9
km/s (lower crust) is observed, the highest crustal
velocity recorded from any earthquake along
INDEPTH III. It is followed by a clear low f mantle
velocity of >8.1 km/s at distances of >295 km, and at
a travel time of f 52 s. It is a straight and long Pnbranch, similar to record sections from other southern
earthquakes. Signs of PMP signals slightly beyond the

Fig. 5. Record section from the southern earthquake ‘‘New 7’’ (vertical component). Along x-axis: distance from the earthquake epicenter in kilometers. Only anti-alias filter applied;
BNS and P-phases indicated.
R.Meissn
eret
al./Tecto
nophysics
380(2004)1–25
8

Fig. 6. Record section from the northern earthquake 3–24 (vertical component). Distance from earthquake epicenter (in km); band-pass filter 2–8 Hz; location of BNS indicated.
R.Meissn
eret
al./Tecto
nophysics
380(2004)1–25
9
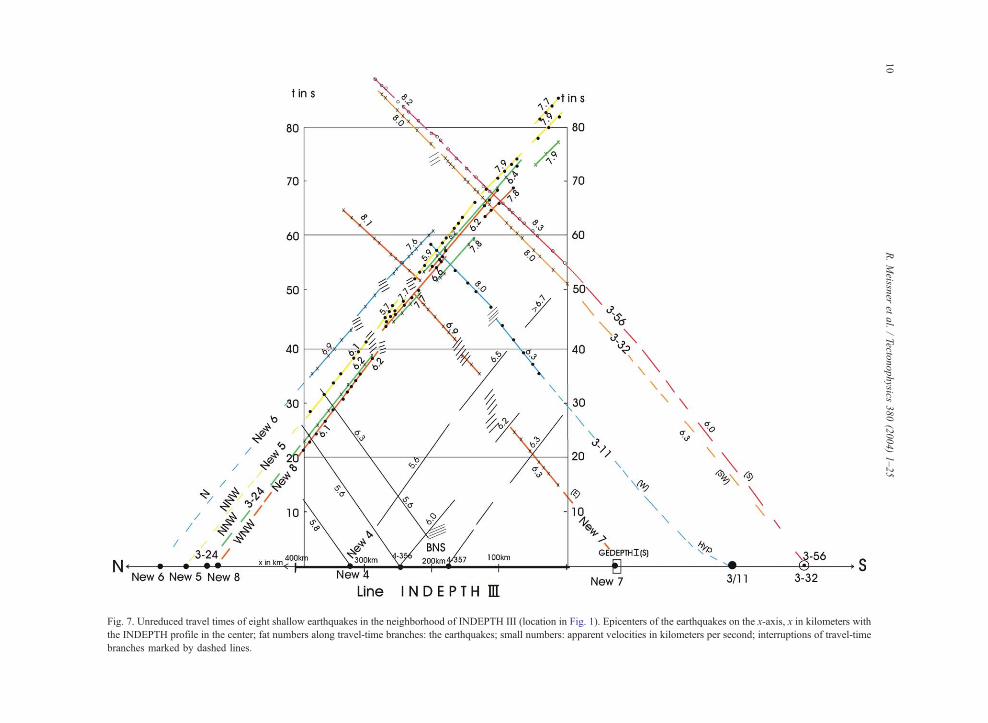
Fig. 7. Unreduced travel times of eight shallow earthquakes in the neighborhood of INDEPTH III (location in Fig. 1). Epicenters of the earthquakes on the x-axis, x in kilometers with
the INDEPTH profile in the center; fat numbers along travel-time branches: the earthquakes; small numbers: apparent velocities in kilometers per second; interruptions of travel-time
branches marked by dashed lines.
R.Meissn
eret
al./Tecto
nophysics
380(2004)1–25
10
R. Meissner et al. / Tectonophysics 380 (2004) 1–25 11
critical angle are indicated in some sections, but they
are too weak to try a correlation. It is interesting to
note that the two horizontal components of the seis-
mometers recorded clear crustal S-wave arrivals from
earthquake New 7, also showing a large jump near the
BNS. At larger distances (>300 km) the horizontal
components of New 7 show arrivals with a velocity of
f4.6 km/s, probably Sn-waves.
An example from the northern earthquakes is
shown in Fig. 6. It is the shallow M= 4.4 earth-
quake 3–24, filtered with 2–8 Hz and situated
about 130 km north of the line. No crustal phases
show any velocities higher than 6.3 km/s. A first
short and weak Pn-branch starts at about 250-km
distance and a reduced travel-time of 9 s. A second
Pn-branch starts at about 350 km Both Pn-waves
have apparent velocities of only 7.7–7.8 km/s.
Various indications of PMP are present, apparently
matching the Pn-branches, but an exact correlation
could not be carried out. Similar observations, i.e.,
short and shingled Pn-branches with velocities be-
low 8 km/s, followed by strong and long crustal
phases, occur at all three northern earthquakes in
the Changtang Block. Earthquake New 5 does not
show any crustal velocity higher than 6.1 km/s and
crustal velocities from the other earthquakes never
reach values higher than 6.4 km/s (including the
‘‘lower’’ crust). We remember that crustal phases
from the northern shot-points (Fig. 3) also showed
such very low P-velocities from normal and reverse
shooting.
The shallow M = 3.8 earthquake New 8 with
nearly the same northerly distance as earthquake
3–24 but different propagation paths shows similar
crustal and mantle phases and similar—but not
identical—travel times, often really intermingling
with each other as seen in the unreduced and
overlapping travel time diagram of the eight earth-
quakes used (Fig. 7). It mainly shows Pg- and Pn-
phases. Velocities typical for the lower crust (6.5–
7.2 km/s) were only detected at three records (New
6, 7, 8), while the remaining four records show
crustal velocities around 6–6.3 km/s. Large parts of
the lower crust have much lower velocities than
usual. The lack of any clear PMP phases and the
appearance of various short and weak Pn-travel time
branches are indications of a complex and unusual
structure of the crust and its bottom. This kind of
scatter is most evident for the signals from the three
earthquakes in the Changtang Block in the north.
These observations support the idea that here the
crust is certainly unusual and the transition zone at
the Moho appears highly complex. The first Pnbranch is possibly only a thin layer within the
transition zone. The low velocities in the whole
northern crust will be discussed again in the Dis-
cussion section.
4. Heterogeneity, layering and Moho-transition
We plotted the Pn-phases symmetrically in a pre-
liminary depth profile and note that all northern
earthquakes show Pn-refractors in the Changtang
Block, and all southern earthquakes have Pn-refractors
in the Lhasa Block (Fig. 8). There is no overlapping of
the Pn-travel times. The pronounced scatter of mantle
phases and their unusually low velocities in the
Changtang Block is certainly larger that in most other
profiles. A large contribution to the complexity of the
lower crust might be effected by a transition from
gabbro to eclogite facies, as generally supposed for a
crustal depth of more than 60 km and moderate
temperatures (Furlong and Fountain, 1986; Le Pichon
et al., 1997).
Since the first experimental investigation of the
gabbro–eclogite transformation (Ringwood and
Green, 1966; Green and Ringwood, 1967), it has
been argued that the crust–mantle transition in
areas of thickened crust may be a velocity gradient
zone. Especially Ito and Kennedy (1971) and Fur-
long and Fountain (1986) studied the petrological
and geophysical consequences. They developed
models with various velocity-gradient zones at the
base of the crust and studied the influence of
temperature, as estimated from surface heat flow.
As a consequence, there would be no first-order
boundary at the base of the crust, no (high f)
reflections and no energy below the critical angle
(i.e., no near-vertical reflections).
It is well known from theoretical and experimental
evidence that in case of a gradient zone a diving wave
is generated (if the seismic wavelength k is small
compared to the thickness d of the gradient zone). A
wave in a strong-gradient zone is also called a
retrograde diving wave, and its hyperbolic travel time
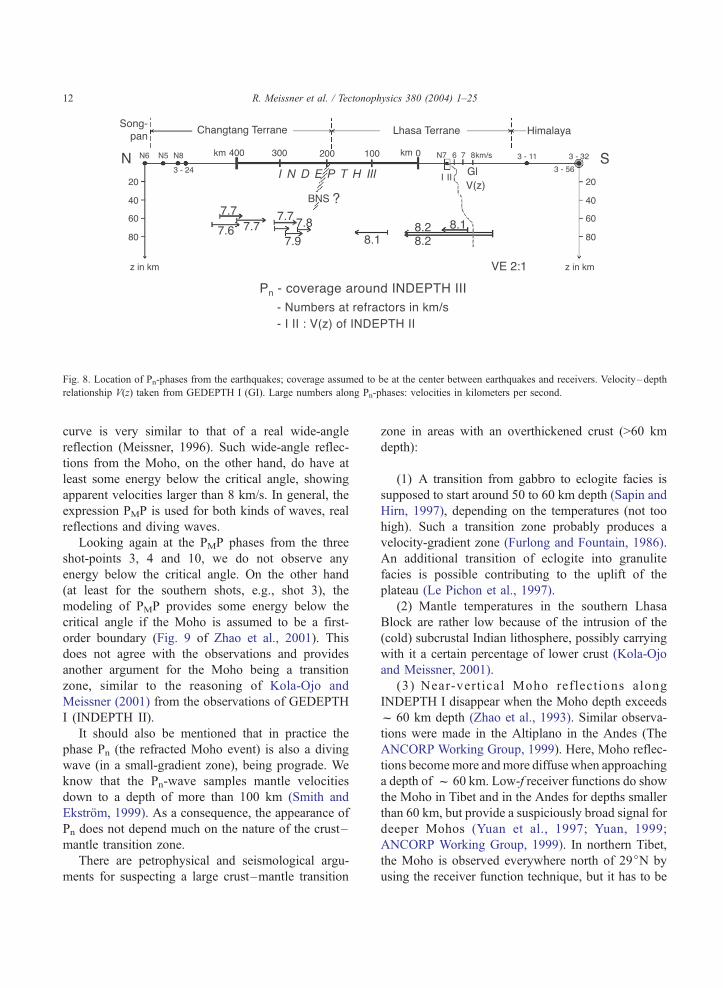
Fig. 8. Location of Pn-phases from the earthquakes; coverage assumed to be at the center between earthquakes and receivers. Velocity–depth
relationship V(z) taken from GEDEPTH I (GI). Large numbers along Pn-phases: velocities in kilometers per second.
R. Meissner et al. / Tectonophysics 380 (2004) 1–2512
curve is very similar to that of a real wide-angle
reflection (Meissner, 1996). Such wide-angle reflec-
tions from the Moho, on the other hand, do have at
least some energy below the critical angle, showing
apparent velocities larger than 8 km/s. In general, the
expression PMP is used for both kinds of waves, real
reflections and diving waves.
Looking again at the PMP phases from the three
shot-points 3, 4 and 10, we do not observe any
energy below the critical angle. On the other hand
(at least for the southern shots, e.g., shot 3), the
modeling of PMP provides some energy below the
critical angle if the Moho is assumed to be a first-
order boundary (Fig. 9 of Zhao et al., 2001). This
does not agree with the observations and provides
another argument for the Moho being a transition
zone, similar to the reasoning of Kola-Ojo and
Meissner (2001) from the observations of GEDEPTH
I (INDEPTH II).
It should also be mentioned that in practice the
phase Pn (the refracted Moho event) is also a diving
wave (in a small-gradient zone), being prograde. We
know that the Pn-wave samples mantle velocities
down to a depth of more than 100 km (Smith and
Ekstrom, 1999). As a consequence, the appearance of
Pn does not depend much on the nature of the crust–
mantle transition zone.
There are petrophysical and seismological argu-
ments for suspecting a large crust–mantle transition
zone in areas with an overthickened crust (>60 km
depth):
(1) A transition from gabbro to eclogite facies is
supposed to start around 50 to 60 km depth (Sapin and
Hirn, 1997), depending on the temperatures (not too
high). Such a transition zone probably produces a
velocity-gradient zone (Furlong and Fountain, 1986).
An additional transition of eclogite into granulite
facies is possible contributing to the uplift of the
plateau (Le Pichon et al., 1997).
(2) Mantle temperatures in the southern Lhasa
Block are rather low because of the intrusion of the
(cold) subcrustal Indian lithosphere, possibly carrying
with it a certain percentage of lower crust (Kola-Ojo
and Meissner, 2001).
(3) Near-vert ical Moho reflect ions along
INDEPTH I disappear when the Moho depth exceeds
f 60 km depth (Zhao et al., 1993). Similar observa-
tions were made in the Altiplano in the Andes (The
ANCORP Working Group, 1999). Here, Moho reflec-
tions becomemore andmore diffuse when approaching
a depth of f 60 km. Low-f receiver functions do show
the Moho in Tibet and in the Andes for depths smaller
than 60 km, but provide a suspiciously broad signal for
deeper Mohos (Yuan et al., 1997; Yuan, 1999;
ANCORP Working Group, 1999). In northern Tibet,
the Moho is observed everywhere north of 29jN by
using the receiver function technique, but it has to be
R. Meissner et al. / Tectonophysics 380 (2004) 1–25 13
remembered that the teleseismic waves have much
reduced frequencies (Kind et al., 2002; Yuan et al.,
1997).
(4) Also wide-angle reflections along INDEPTH II
do not show energy below the critical angle (Makow-
ski and Klemperer, 1999). Near-vertical reflections
could not be observed, presumably because of great
Moho depth (>65 km) and a velocity gradient zone
(Kola-Ojo and Meissner, 2001).
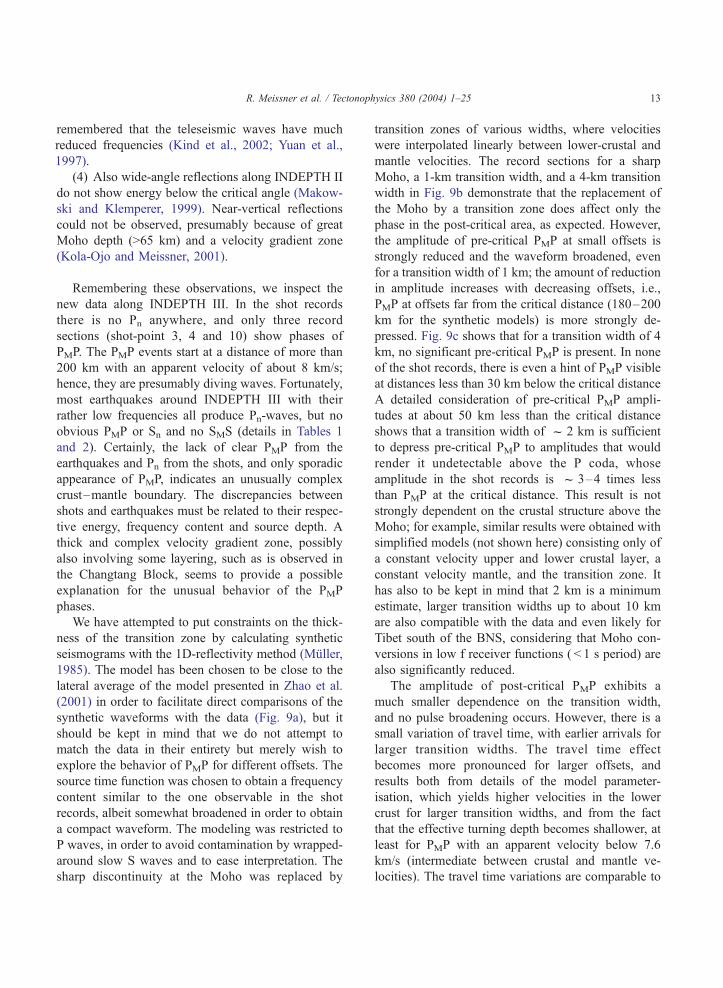
Remembering these observations, we inspect the
new data along INDEPTH III. In the shot records
there is no Pn anywhere, and only three record
sections (shot-point 3, 4 and 10) show phases of
PMP. The PMP events start at a distance of more than
200 km with an apparent velocity of about 8 km/s;
hence, they are presumably diving waves. Fortunately,
most earthquakes around INDEPTH III with their
rather low frequencies all produce Pn-waves, but no
obvious PMP or Sn and no SMS (details in Tables 1
and 2). Certainly, the lack of clear PMP from the
earthquakes and Pn from the shots, and only sporadic
appearance of PMP, indicates an unusually complex
crust–mantle boundary. The discrepancies between
shots and earthquakes must be related to their respec-
tive energy, frequency content and source depth. A
thick and complex velocity gradient zone, possibly
also involving some layering, such as is observed in
the Changtang Block, seems to provide a possible
explanation for the unusual behavior of the PMP
phases.
We have attempted to put constraints on the thick-
ness of the transition zone by calculating synthetic
seismograms with the 1D-reflectivity method (Muller,
1985). The model has been chosen to be close to the
lateral average of the model presented in Zhao et al.
(2001) in order to facilitate direct comparisons of the
synthetic waveforms with the data (Fig. 9a), but it
should be kept in mind that we do not attempt to
match the data in their entirety but merely wish to
explore the behavior of PMP for different offsets. The
source time function was chosen to obtain a frequency
content similar to the one observable in the shot
records, albeit somewhat broadened in order to obtain
a compact waveform. The modeling was restricted to
P waves, in order to avoid contamination by wrapped-
around slow S waves and to ease interpretation. The
sharp discontinuity at the Moho was replaced by
transition zones of various widths, where velocities
were interpolated linearly between lower-crustal and
mantle velocities. The record sections for a sharp
Moho, a 1-km transition width, and a 4-km transition
width in Fig. 9b demonstrate that the replacement of
the Moho by a transition zone does affect only the
phase in the post-critical area, as expected. However,
the amplitude of pre-critical PMP at small offsets is
strongly reduced and the waveform broadened, even
for a transition width of 1 km; the amount of reduction
in amplitude increases with decreasing offsets, i.e.,
PMP at offsets far from the critical distance (180–200
km for the synthetic models) is more strongly de-
pressed. Fig. 9c shows that for a transition width of 4
km, no significant pre-critical PMP is present. In none
of the shot records, there is even a hint of PMP visible
at distances less than 30 km below the critical distance
A detailed consideration of pre-critical PMP ampli-
tudes at about 50 km less than the critical distance
shows that a transition width of f 2 km is sufficient
to depress pre-critical PMP to amplitudes that would
render it undetectable above the P coda, whose
amplitude in the shot records is f 3–4 times less
than PMP at the critical distance. This result is not
strongly dependent on the crustal structure above the
Moho; for example, similar results were obtained with
simplified models (not shown here) consisting only of
a constant velocity upper and lower crustal layer, a
constant velocity mantle, and the transition zone. It
has also to be kept in mind that 2 km is a minimum
estimate, larger transition widths up to about 10 km
are also compatible with the data and even likely for
Tibet south of the BNS, considering that Moho con-
versions in low f receiver functions ( < 1 s period) are
also significantly reduced.
The amplitude of post-critical PMP exhibits a
much smaller dependence on the transition width,
and no pulse broadening occurs. However, there is a
small variation of travel time, with earlier arrivals for
larger transition widths. The travel time effect
becomes more pronounced for larger offsets, and
results both from details of the model parameter-
isation, which yields higher velocities in the lower
crust for larger transition widths, and from the fact
that the effective turning depth becomes shallower, at
least for PMP with an apparent velocity below 7.6
km/s (intermediate between crustal and mantle ve-
locities). The travel time variations are comparable to
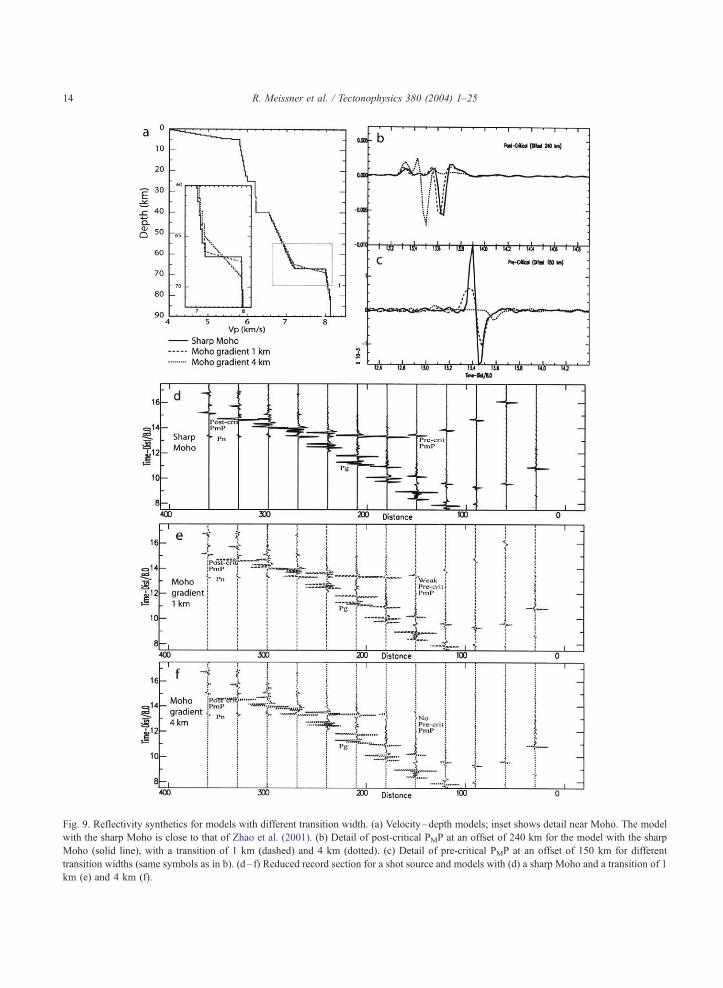
Fig. 9. Reflectivity synthetics for models with different transition width. (a) Velocity–depth models; inset shows detail near Moho. The model
with the sharp Moho is close to that of Zhao et al. (2001). (b) Detail of post-critical PMP at an offset of 240 km for the model with the sharp
Moho (solid line), with a transition of 1 km (dashed) and 4 km (dotted). (c) Detail of pre-critical PMP at an offset of 150 km for different
transition widths (same symbols as in b). (d– f) Reduced record section for a shot source and models with (d) a sharp Moho and a transition of 1
km (e) and 4 km (f).
R. Meissner et al. / Tectonophysics 380 (2004) 1–2514
R. Meissner et al. / Tectonophysics 380 (2004) 1–25 15
the residual RMS for PMP in the Zhao et al. (2001)
model. The amplitude variations of post-critical PMP
at larger offsets are also related to geometrical effects
which in turn are highly dependent on details of the
model, in particular the gradient in the lower crust.
Specifically, no significant amplitude variations oc-
cur in the simplified model described above. Because
of this sensitivity to details of the model we refrain
from making further use of post-critical PMP ampli-
tudes. Fig. 9d–f shows record sections of the sharp
Moho transitions and the two gradient zones.
At first sight, it appears surprising that no obvious
PMP is observed in the earthquake records, as their
lower frequency content should make them less
sensitive to any complexity of the Moho. However,
PMP is also very weak in the synthetic data for a
buried earthquake source and the preferred model
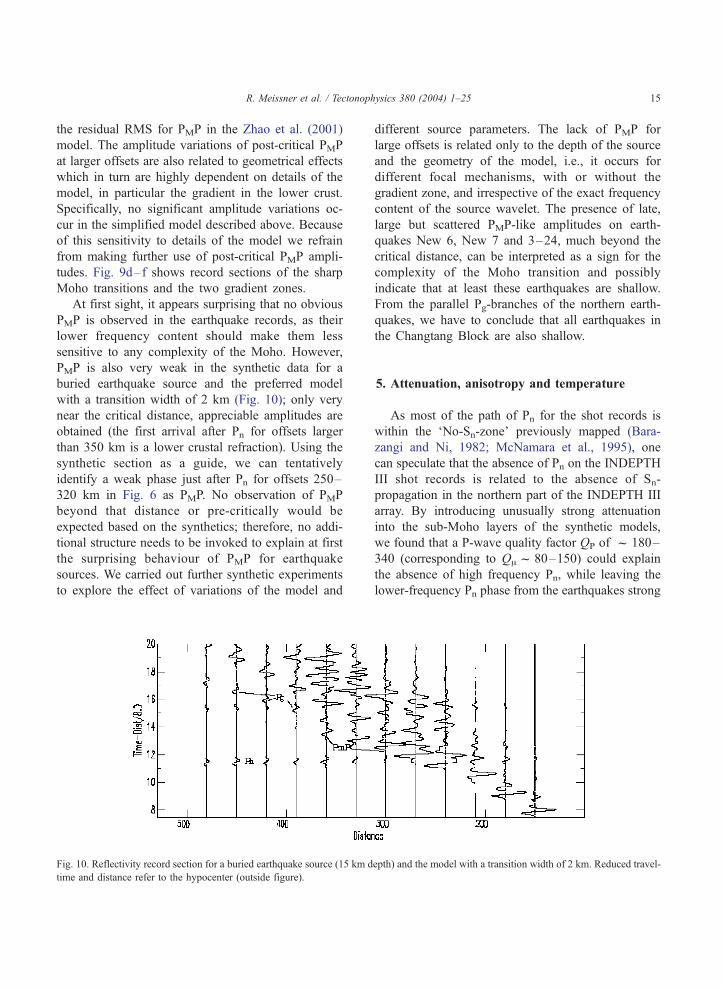
with a transition width of 2 km (Fig. 10); only very
near the critical distance, appreciable amplitudes are
obtained (the first arrival after Pn for offsets larger
than 350 km is a lower crustal refraction). Using the
synthetic section as a guide, we can tentatively
identify a weak phase just after Pn for offsets 250–
320 km in Fig. 6 as PMP. No observation of PMP
beyond that distance or pre-critically would be
expected based on the synthetics; therefore, no addi-
tional structure needs to be invoked to explain at first
the surprising behaviour of PMP for earthquake
sources. We carried out further synthetic experiments
to explore the effect of variations of the model and
Fig. 10. Reflectivity record section for a buried earthquake source (15 km d
time and distance refer to the hypocenter (outside figure).
different source parameters. The lack of PMP for
large offsets is related only to the depth of the source
and the geometry of the model, i.e., it occurs for
different focal mechanisms, with or without the
gradient zone, and irrespective of the exact frequency
content of the source wavelet. The presence of late,
large but scattered PMP-like amplitudes on earth-
quakes New 6, New 7 and 3–24, much beyond the
critical distance, can be interpreted as a sign for the
complexity of the Moho transition and possibly
indicate that at least these earthquakes are shallow.
From the parallel Pg-branches of the northern earth-
quakes, we have to conclude that all earthquakes in
the Changtang Block are also shallow.
5. Attenuation, anisotropy and temperature
As most of the path of Pn for the shot records is
within the ‘No-Sn-zone’ previously mapped (Bara-
zangi and Ni, 1982; McNamara et al., 1995), one
can speculate that the absence of Pn on the INDEPTH
III shot records is related to the absence of Sn-
propagation in the northern part of the INDEPTH III
array. By introducing unusually strong attenuation
into the sub-Moho layers of the synthetic models,
we found that a P-wave quality factor QP of f 180–
340 (corresponding to QAf 80–150) could explain
the absence of high frequency Pn, while leaving the
lower-frequency Pn phase from the earthquakes strong
epth) and the model with a transition width of 2 km. Reduced travel-

R. Meissner et al. / Tectonophysics 380 (2004) 1–2516
enough to be detected over the ranges considered in
this paper. At the same time, Sn would be suppressed,
too. However, previous modeling has shown (Crot-
well et al., 1995) that it is not possible by attenuation
alone to wipe out Sn within the attenuating zone but
let Pn from local earthquakes propagate across the
whole plateau. Additional model studies show that it
is likely that the observations on the efficiency of
mantle phases in Tibet (no efficient propagation of Snand very high frequency Pn; efficient propagation of
intermediate Pn from earthquakes) can only be
explained by both increased attenuation and a differ-
ence in the velocity gradients. Both effects could
result from partial melting of the mantle.
Basaltic volcanism of different age but continuing
until the most recent past (less than 5 Ma) is known to
have occurred in northern Tibet (Yin and Harrison,
2000). The depletion due to partial melting would
result in a gradual increase in olivine content relative
to orthopyroxene and clinopyroxene with depth,
which in turn would cause the P velocity gradient to
be steeper than the S velocity gradient (Fuchs, 1983).
In Fig. 11, we have plotted the average velocity–
depth structure with a crust–mantle transition zone
and Fig. 12 shows the velocity model of INDEPTH III
including the data from GEDEPTH I (Kola-Ojo and
Meissner, 2001). The sudden appearance of strong
SKS anisotropy south of the BNS (Huang et al., 2000)
can only be explained by a considerable contribution
from the crust, while the strong amplitude of the
anisotropy suggests a large contribution from the
mantle (Fig. 13). The whole Changtang Block seems
to be horizontally anisotropic, with the strongest
anisotropy (up to 2.5 s delay time) concentrated near
the fault bounding shear zones; the fast directions
there oriented close to east–west, whereas in the
interior of the block fast directions vary from EW to
NE (McNamara et al., 1994; Herquel et al., 1995;
Huang et al., 2000). The beginning of strong shear
wave splitting anisotropy about 25 km south of the
BNS indicates that parts of the subducting Indian
subcrustal lithosphere (Tilmann et al., 2003) delami-
nates also laterally as suggested by Kola-Ojo and
Meissner (2001).
The supposed lattice preferred orientation (LPO)
seems to be caused by an extrusion or escape tectonics
of the whole lithosphere to the east, as already
suggested by Molnar and Tapponier (1975), Tappon-
nier (1990), Burke and Sengor (1986), Avouac and
Tapponnier (1993), Hirn et al. (1995) and Park and
Levin (2002). East of Tibet, there is an especially
weak lithosphere and the strong north–south com-
pression in Tibet expels the lithosphere eastward. The
sudden appearance and the large amount of anisotropy
suggests that considerable parts (the warm and weak
layers) of the whole lithosphere contribute to the
escape process in the Changtang block.
Unfortunately, the INDEPTH III profile is nearly
perpendicular to the fast axis of anisotropy and will
not display the high values of Pn, suspected in the
west–east direction. A south–north direction (perpen-
dicular to the fast axes) should show only slightly
lower velocities than for isotropic material (Kern et
al., 1996; Vinnik et al., 1992). The rays through the
Changtang block indeed show lower Pn-velocities:
between 7.6 and 7.9 km/s, compared to 8.0–8.2 in
the southern part of the line and 8.2–8.3 km/s in the
southern Lhasa Block (Beghoul et al., 1993). Possibly,
the low velocities in the north are an indication for
anisotropy, but other causes like higher temperatures
and hence attenuation in the north are additional (or
alternative) explanations. Kind et al. (2002) really find
a gradual lowering of the Moho from about 80 km
beneath the Yarlung Tsangpo Suture tof 65 km
under northern Tibet from receiver function studies,
but they do not find a significant change in crustal
thickness north of the BNS. That means that the low
Pn-velocities in the Changtang Block are true and not
effected by a dipping Moho. There was also no rise of
the Moho found by the dispersion studies of Rapine et
al. (2003), but their data would possibly not be able to
resolve a small step ( < 5 km) in the Moho.
Higher temperatures in the mantle of northern
Tibet have long been suggested, mainly based on
S-wave attenuation (Beghoul et al., 1993) and mag-
matism (Tapponier et al., 2001). Also, in the paper of
Kind et al. (2002), a 300 jC hotter lithosphere in the
north is estimated from receiver function studies.
Rapine et al. (2003) find a low lower-crustal S-wave
velocities and the absence of an S velocity gradient in
the mantle beneath northern Tibet from dispersion
studies. McNamara et al. (1995), studying Sn region-
ally, map a large elliptically formed attenuation area
in central Tibet, mainly in the Changtang Block.
Quaternary volcanism and our unusually low P-ve-
locities in the lower crust and upper mantle from

Fig. 11. Velocity–depth V(z) structure in central and southern Tibet, including a crust–mantle transition zone. The transition—compared to a first-order boundary in the two right
figures—is shown schematically.
R.Meissn
eret
al./Tecto
nophysics
380(2004)1–25
17
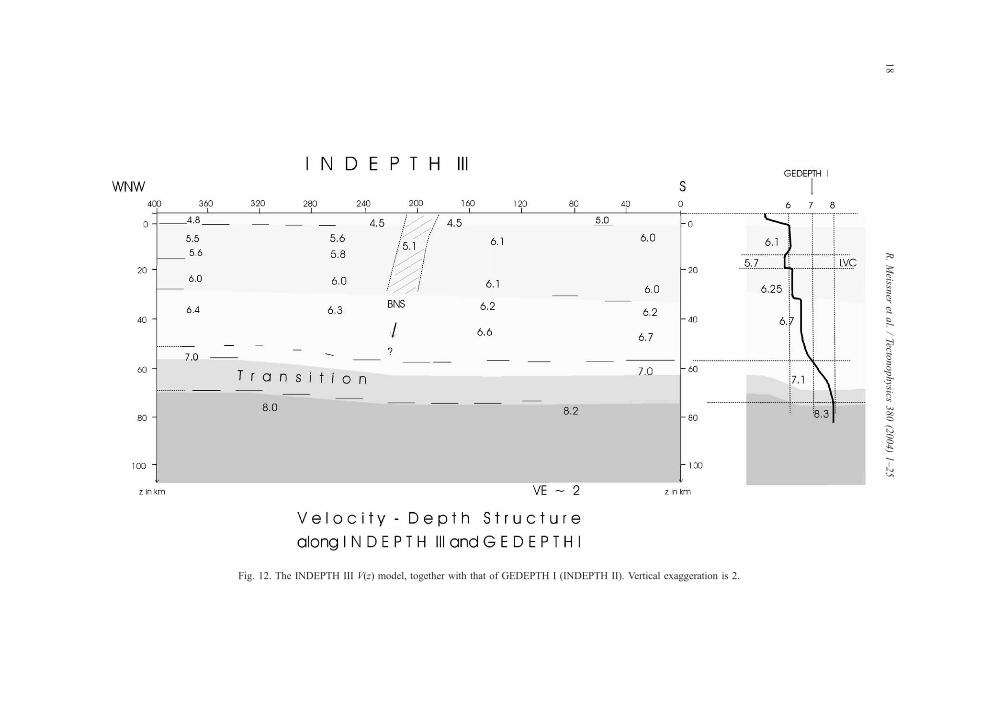
Fig. 12. The INDEPTH III V(z) model, together with that of GEDEPTH I (INDEPTH II). Vertical exaggeration is 2.
R.Meissn
eret
al./Tecto
nophysics
380(2004)1–25
18
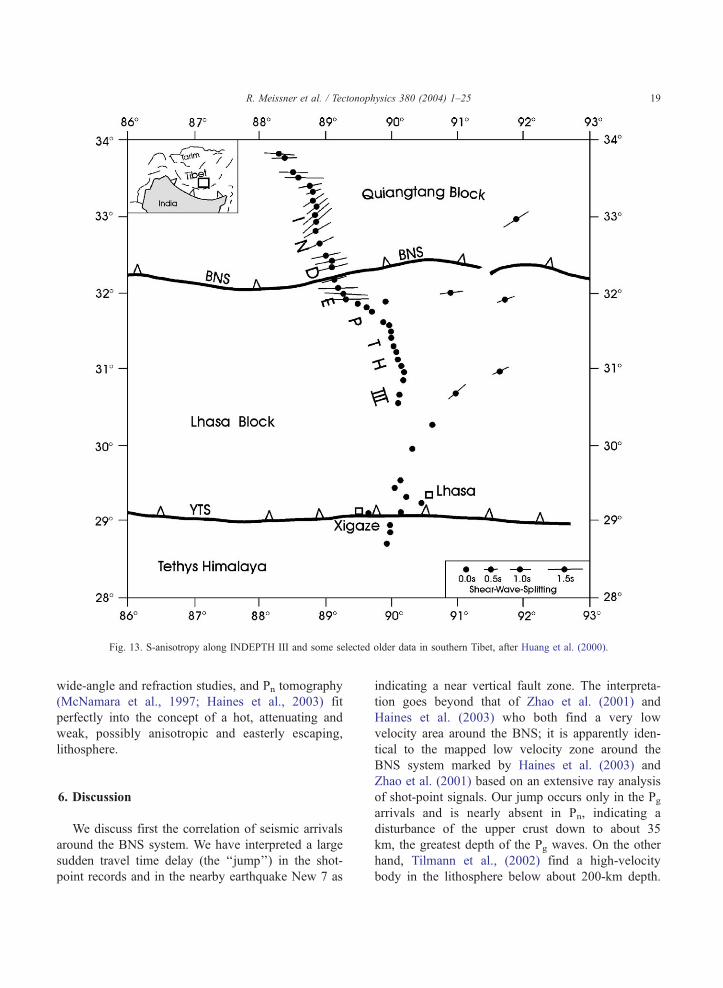
Fig. 13. S-anisotropy along INDEPTH III and some selected older data in southern Tibet, after Huang et al. (2000).
R. Meissner et al. / Tectonophysics 380 (2004) 1–25 19
wide-angle and refraction studies, and Pn tomography
(McNamara et al., 1997; Haines et al., 2003) fit
perfectly into the concept of a hot, attenuating and
weak, possibly anisotropic and easterly escaping,
lithosphere.
6. Discussion
We discuss first the correlation of seismic arrivals
around the BNS system. We have interpreted a large
sudden travel time delay (the ‘‘jump’’) in the shot-
point records and in the nearby earthquake New 7 as
indicating a near vertical fault zone. The interpreta-
tion goes beyond that of Zhao et al. (2001) and
Haines et al. (2003) who both find a very low
velocity area around the BNS; it is apparently iden-
tical to the mapped low velocity zone around the
BNS system marked by Haines et al. (2003) and
Zhao et al. (2001) based on an extensive ray analysis
of shot-point signals. Our jump occurs only in the Pgarrivals and is nearly absent in Pn, indicating a
disturbance of the upper crust down to about 35
km, the greatest depth of the Pg waves. On the other
hand, Tilmann et al., (2002) find a high-velocity
body in the lithosphere below about 200-km depth.
R. Meissner et al. / Tectonophysics 380 (2004) 1–2520
One might speculate that this near-vertical structure
represents the subducting subcrustal Indian litho-
sphere (SCIL) which may have reached this distance
(Kola-Ojo and Meissner, 2001), but a connection to
the low velocity zone near the BNS system at the
surface seems highly speculative.
We next discuss the strange behavior of signals
from the shots and from the earthquakes: only post-
critical PMP and no Pn from the shots; clear Pn from
the earthquakes, although short, weak and shingled in
the Changtang Block, and only indications of PMP,
observable close to and beyond the critical distance.
Such observations have occasionally been made in
other regions (Blumling and Prodehl, 1983). Mostly,
frequency-dependent signals together with thin layers
have been suggested to explain these phenomena. For
Moho-events from deep structures, a large transition
zone has been suggested by Mooney and Prodehl
(1984 and references therein) and Kola-Ojo and
Meissner (2001).
Many researchers have investigated the effects of
the large and continuous convergence rate between
India and Asia which startedf 70 Ma ago (Tappon-
nier, 1981, 1990; Yin and Harrison, 2000; Kola-Ojo
and Meissner, 2001; Galve et al., 2002). Most of
these observations, however, refer to the upper
(rigid) part of the crust. They are supported by focal
plane solutions of shallow earthquakes which show
north–south compression in the Himalaya and south-
ern Tibet, but east–west extensional solutions in
central and northern Tibet (Barazangi, 1989), which
is generally related to a tectonic escape to the east
(Burke and Sengor, 1986). Also new GPS measure-
ments through the central Changtang Block (Wang et
al., 2001) confirm escape rates of 1.0–2.0 cm/year,
showing a maximum at the limiting fault zones, the
Kunlun in the north and the BNS in the south.
According to Dewey et al. (1988) and Ratschbacher
(1996), one third of the Indian–Asia conversion is
accommodated by lateral extrusion. It is suspected
that the upper (rigid) part of the crust moves on the
shoulder of the hot and weak lower crust because
many observations of seismology and heat flow
studies indicate a warm and weak lower crust,
apparently hot and wet in the south, hot and dry in
the north (Henry et al., 1997; Meissner and Mooney,
1998; Kola-Ojo and Meissner, 2001; Kind et al.,
2002). It should be remembered that a temperature of
800 jC does not much weaken the upper mantle, but
it is above the solidus of granitic and even gabbroic
material (Meissner and Strehlau, 1982), causing a
dramatic weakening in a thick crust (e.g., Haines et
al., 2003), generating partial melts, possibly partly
responsible for the low crustal velocities.
From the rheological point of view, the warm area
of central Tibet must have weak layers in the lower
crust and also in the upper mantle, leading neces-
sarily to a differential escape under appropriate
stress. It has been argued that the rather uniform
uplift and high elevation of the Tibetan plateau and
the overthickened crust is caused by a general
compression of ductile crustal material (Zhao and
Morgan, 1985, 1987; Westaway, 1995; Kola-Ojo and
Meissner, 2001). This ‘‘Hydraulic Pump’’ model
provides a possibility for explaining the uniform
thickening of the whole plateau, although an under-
thrust intrusion from the cold subcrustal Indian
lithosphere (SCIL) takes place in the southern part
(Beghoul et al., 1993) and might contribute to the
uplift. The underthrust model was first suggested by
Barazangi and Ni (1982) and was later confirmed by
Beghoul et al. (1993), who measured a rather high
(cold) Pn-velocity of more than 8.2 km/s (like our
data in the Lhasa Block), and calculated a thick
SCIL of more than 135 km. This confirms the
presence of the Indian mantle below southern Tibet
which seems to continue at least up to about the
middle of Tibet (Tilmann et al., 2002). This obser-
vation suggests at least three different shortening
mechanisms:
(1) The upper (rigid) part of the crust is subjected
to orogen-and fault-related processes (crustal short-
ening). There is ample stacking along (lubricated?)
faults (Brown et al., 1996; Nelson et al., 1996) and
possibly even a ‘‘hidden’’ subduction (Tapponier et
al., 2001). The (near-surface) fault in the area of the
BNS system that we observe in the overlapping
travel time diagrams is only one example of a
prominent fault zone, reaching down at least to about
35 km.
(2) The middle and lower parts of the crust expe-
rience ductile shortening mechanisms where the main
tectonic stress comes from the intruding SCIL from
the south. In the Changtang Block, most of the crust
shows velocities typical for the upper crust. No
R. Meissner et al. / Tectonophysics 380 (2004) 1–25 21
stratification is observed any more between upper and
lower crust. Shot-points and earthquakes provide
velocities higher than 6.3 km/s only sporadically,
and a general mixing of (warm) material has to be
assumed, possibly a by-product of escape. At the
bottom of the crust, the shingled Pn seems to represent
thin layers of mantle material being intruded into the
lower crust, forming a complex transition zone, prob-
ably supported by the escape movement. In the
north–east of the Changtang Block, Galve et al.
(2002) observe an apparent ‘‘thickening’’ of the upper
crust from fan observations. This ‘‘thickening’’ agrees
with our measurements of low velocities in the whole
crust of the (western) Changtang Block. Based on VP/
VS ratio, Vergne et al. (2002) infer a thick felsic crust
overlying a relatively thin mafic lower crust in the
same area, again grossly consistent with the scenario
presented here.
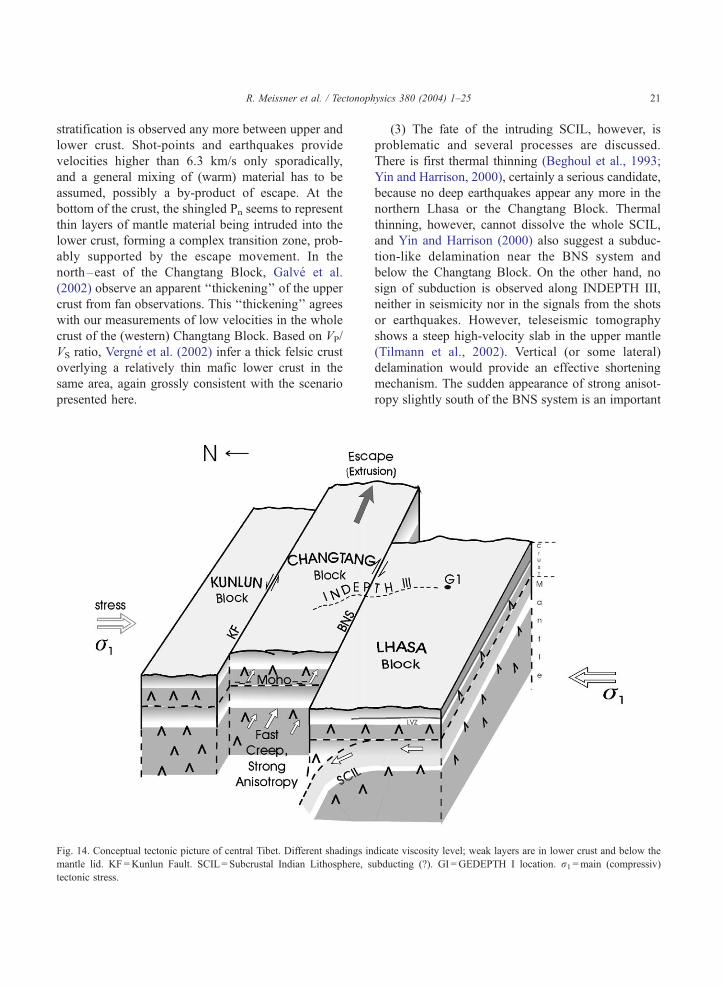
Fig. 14. Conceptual tectonic picture of central Tibet. Different shadings in
mantle lid. KF =Kunlun Fault. SCIL= Subcrustal Indian Lithosphere, s
tectonic stress.
(3) The fate of the intruding SCIL, however, is
problematic and several processes are discussed.
There is first thermal thinning (Beghoul et al., 1993;
Yin and Harrison, 2000), certainly a serious candidate,
because no deep earthquakes appear any more in the
northern Lhasa or the Changtang Block. Thermal
thinning, however, cannot dissolve the whole SCIL,
and Yin and Harrison (2000) also suggest a subduc-
tion-like delamination near the BNS system and
below the Changtang Block. On the other hand, no
sign of subduction is observed along INDEPTH III,
neither in seismicity nor in the signals from the shots
or earthquakes. However, teleseismic tomography
shows a steep high-velocity slab in the upper mantle
(Tilmann et al., 2002). Vertical (or some lateral)
delamination would provide an effective shortening
mechanism. The sudden appearance of strong anisot-
ropy slightly south of the BNS system is an important
dicate viscosity level; weak layers are in lower crust and below the
ubducting (?). GI =GEDEPTH I location. r1 =main (compressiv)
R. Meissner et al. / Tectonophysics 380 (2004) 1–2522
observation and suggests the beginning of a large and
sudden flow (or creep) process in the mantle and
crust.
As mentioned, the crust in central Tibet, especially
in the Changtang Block, is known to move eastward,
from GPS measurements, from tectonic mapping and
fault plane solutions. In the north, there is a well-
known left-lateral movement along the Kunlun Fault
for the last 40,000 years (Van der Voerd et al., 2002),
in the south some right-lateral movement seems to
take place in the vicinity of the BNS system. The
actual surface displacements along the faults are only
1–1.4 or 1–2 cm/year by GPS regionally (Wang et
al., 2001). Meissner et al. (2002) estimate an eastward
movement of central Tibet around 1.6 cm/year. This
figure compares well with the estimate of Ratsch-
bacher (1996) that one third of the current total
convergence of 5 cm/year between India and Asia is
taken up by lateral extrusion. Neither from the shots
nor from the earthquakes a low velocity layer in the
upper or middle crust was detected, in accordance
with the interpretations of Zhao et al. (2001) and
Haines et al. (2003).
It seems from the combination of geological
mapping, fault plane solutions and anisotropy data
that crust and mantle in central Tibet escape to the
east. They seem to separate laterally, contributing to
the strong west–east anisotropy in the Changtang
Block. The movement might start along near-vertical
fault zones (like the BNS system and the Kunlun
Fault), and at deeper levels along a weak zone of
enhanced creep. Part of the SCIL might subduct and
delaminate, possibly partly laterally because of the
beginning of strong anisotropy slightly south oft he
BNS (Huang et al., 2000). At depth, it might
mobilize hot asthenospheric material and contribute
to warming and uplift (England and Houseman,
1986; Meissner and Mooney, 1998). In Fig. 14, we
have tried to combine the suggested pattern of
movement, the SCIL partly delaminating down-
wards, partly laterally.
7. Conclusions
From the combination of seismological and shal-
low geological observations, a number of new struc-
tural and tectonic features of central Tibet was
revealed.
(1) In the middle of INDEPTH III, the Banggong-
Nuijang Fault system (BNS) is characterized by jumps
or delays of travel times from shots and from earth-
quakes. The BNS seems to reach down from the
surface to at least 35-km depth with a steep, probably
northerly, dip. No (near horizontal) low velocity
layer—like in the southern Lahsa Block—was found
along INDEPTH III.
(2) Comparing mantle phases from 11 shots (some
PMP, no Pn) and 8 local earthquakes (always some Pn ,
PMP only observable close to, and beyond, the critical
distance) a complex Moho transition is indicated,
especially in the Changtang Block. From the absence
of subcritical PMP and some unusual Pn-events the
Moho transition is suspected to be a velocity gradient
zone, in accordance with petrophysical reasoning
about a gabbro–eclogite transition. Comparison with
reflectivity yield a minimum of 2 km for the gradient
zone which must be very heterogeneous in the Chang-
tang Block and apparently rather smooth in the Lhasa
Block.
(3) Based on the observed P-velocities the unusu-
ally thick crust in Tibet (f 70 km) is formed in the
south by a doubling of the (rigid) upper crust and a
doubling of the (ductile) lower crust In the Changtang
Block; however, only a doubling of the upper crust or
a general mixing of hot crustal material seems to have
taken place. P-velocities in lower crustal depths re-
semble those of the upper crust. This absence of
typical lower crust velocities and the appearance of
shingled Pn may be related to the tectonic escape and
some indentations of mantle slices plus attenuation
and a suspected P-anisotropy with the fast direction
west–east (like the S-anisotropy) and a slower com-
ponent in the south–north direction, i.e., parallel to
INDEPTH III. Also, the Pn-velocities in the Chang-
tang Block are lower than normal and the Pn-branches
are short and shingled. Our interpretation of travel
times is considered to provide the most reliable
velocity values available in central Tibet.
(4) The intruding subcrustal Indian lithosphere
known to be present in the southern Lhasa Block
may have reached the area of the BNS in the middle
of Tibet where it might delaminate vertically or even
(partly) laterally, as suggested by early beginning of

R. Meissner et al. / Tectonophysics 380 (2004) 1–25 23
S-anisotropy and in accordance with the west–east
escape of the Changtang Block.
Acknowledgements
J. Mechie helped with some technical aspects of
the paper and with encouraging discussions. Dr. Yuan
and two referees critically read and improved the
original manuscript. We acknowledge the support of
the Ministry of Land and Resources, China, the
National, Natural Science Foundation of China, the
US-National Science Foundation, the Deutsche For-
schungsgemeinschaft and the GeoForschungszentrum
in Potsdam. Instruments were provided by IRIS-
PASSCAL and the Potsdam Instrument Pool. We
specially thank the Chinese–US–American–German
INDEPTH III field crew for their extremely hard work
under very unusual conditions. We appreciate the
preliminary determination of the earthquake coordi-
nates by the USGS.
References
ANCORP Working Group, 1999. Seismic reflection image reveal-
ing offset of Andean subduction zone earthquake locations into
oceanic mantle. Nature, 341–344.
Argand, E., 1924. La tectonique de l’Asie. Rep. Sess.-Int. Geol.
Congr. 13, 170–372.
Avouac, J., Tapponnier, P., 1993. Kinematic model of active defor-
mation in Central Asia. Geophys. Res. Lett. 20, 895–898.
Barazangi, M., 1989. Continental collision zones: seismotectonics
and crustal structure. In: James, D.H. (Ed.), The Encyclopedia
of the Solid Earth Geophysics. Van Nostrand-Reinhold, New
York, pp. 58–75.
Barazangi, M., Ni, J., 1982. Velocity and propagation characteristics
of Pn and Sn beneath the Himalayan arc and the Tibetan plateau:
possible evidence for underthrusting of the Indian continental
lithosphere beneath Tibet. Geology 10, 179–185.
Beghoul, N., Barazangi, M., Isacks, B.L., 1993. Lithospheric struc-
ture of Tibet and western North America: mechanisms of uplift
and a comparative study. J. Geophys. Res. 98, 1997–2016.
Blumling, G., Prodehl, C., 1983. Crustal structure beneath the east-
ern part of the Coast Ranges (Diablo Range) of central Califor-
nia from explosion seismics and near-earthquake data. In:
Ansorge, J., Mereu, R.F. (Eds.), Probing the Earth’s Litho-
sphere. Phys. Earth Planet. Inter., vol. 31, pp. 313–326.
Brown, L.D., et al., 1996. Bright spots, structure, and magmatism in
southern Tibet from INDEPTH seismic reflection profiling. Sci-
ence 274, 1688–1690.
Burke, K., Sengor, C., 1986. Tectonic escape in the evolution of the
continental crust. In: Barazangi, M., Brown, L.D. (Eds.), Re-
flection Seismology: the Continental Crust. AGU, Washington,
DC, Geodynamic Series, vol. 14, pp. 41–53.
Coward, M.P., Kidd, W.S.F., Yun, P., Shackelton, R.M., Hu, Z.,
1988. The structure of the 1985 Tibet geotraverse, Lhasa to
Golmud. Philos. Trans. R. Soc. Lond. Ser. A: Math. Phys.
Sci. 327, 327–336.
Crotwell, P., Randall, G.R., McNamara, D.E., Owens, T.J., 1995.
Frequency dependent propagation of regional Sn within the Ti-
betan Plateau. EOS Trans. AGU 76 (17), S201 (Spring Meeting
Suppl.).
Dewey, J.F., Burke, K.C., 1973. Tibet, Variscan and Precambrian
reactivation: products of continental collision. J. Geol. 81,
683–692.
Dewey, J.F., Shackleton, R.M., Chang, C., Sun, Y., 1988. The
tectonic evolution of the Tibetan Plateau. Philos. Trans. R.
Soc. Lond. A327, 379–413.
England, P., Houseman, G., 1986. Finite strain calculations of con-
tinental deformation: 2. Comparison with the India–Asia colli-
sion zone. J. Geophys. Res. 91, 3664–3676.
Fuchs, K., 1983. Recently formed elastic anisotropy and petrolog-
ical models for the continental subcrustal lithosphere in southern
Germany. Phys. Earth Planet. Int. 31, 93–118.
Furlong, K.P., Fountain, D.M., 1986. Continental crustal underplat-
ing: thermal considerations and seismic–petrologic consequen-
ces. J. Geophys. Res. 91, 8285–8294.
Galve, A., et al., 2002. Modes of raising northeastern Tibet probed
by explosion seismology. Earth Planet. Sci. Lett. 203, 35–43.
Girardeau, J., Marcoux, J., Allegre, C.J., Bassoullet, J.P., Tang,
Y., Xiao, Y., Wang, X., 1998. Tectonic environment and
geodynamic significance of the Neo-Cimmarian Donquiao
Ophiolite, Banggong-Nujiang Suture zone, Tibet. Nature 307,
27–31.
Green, D.H., Ringwood, A.E., 1967. An experimental investigation
of the gabbro to eclogite transformation and its petrological
applications. Geochim. Cosmochim. Acta 31, 767–833.
Haines, S.S., Klemperer, S.L., Brown, L.D., Jingru, G., Mechie, J.,
Meissner, R., Ross, A.,Wenjin, Z., 2003. INDEPTH III seismic
data: From surface observations to deep crustal process in Tibet.
Tectonics 22 (1), 1001, 1–20.
Henry, P., Le Pichon, X., Goffe, B., 1997. Kinematic, thermal and
petrological model of the Himalaya: constraints related to meta-
morphism within the underthrust Indian crust and topographic
elevation. Tectonophysics 273, 31–56.
Herquel, G., Wittlinger, G., Guilbert, J., 1995. Anisotropy and
crustal thickness of northern Tibet: new constraints for tectonic
modeling. Geophys. Res. Lett. 22, 1925–1928.
Hirn, A., Nercessian, A., Sapin, M., Jobert, G., Xin, X.Z., Yuan,
G.E., Yuan, L.D., Wen, T.J., 1984. Lhasa Block and bordering
sutures—a continuation of a 500 km Moho traverse through
Tibet. Nature 307, 25–27.
Hirn, A., et al., 1995. Seismic anisotropy as an indicator of mantle
flow beneath the Himalaya and Tibet. Nature 375, 571–574.
Huang, W.-Ch., et al., 2000. Seismic polarization anisotropy be-
neath the central Tibetan Plateau. J. Geophys. Res. 105,
27979–27989.
INDEPTH Project Team, Zhao, W., Nelson, K.D., 1993. Deep seis-

R. Meissner et al. / Tectonophysics 380 (2004) 1–2524
mic reflection evidence for continental underthrusting beneath
southern Tibet. Nature 366, 557–559.
Ito, K., Kennedy, G.C., 1971. An experimental study of the basalt–
garnet–eclogite transition. In: Peakock, Y.G. (Ed.), The Struc-
ture and Physical Properties of the Earth’s Crust. Geophys.
Mono. Series, vol. 14. AGU, Washington, DC, pp. 303–314.
Jia, S., Cao, X., Jia, J., 1981. The P wave travel times and upper
mantle structure of the Tibetan Plateau. N.W. Seism. J. 3, 27–34.
Kern, H., Burlini, L., Ashchepko, I.V., 1996. Fabric-related aniso-
tropy in upper mantle xenoliths: evidence from measurements
and calculations. Phys. Earth Planet. Inter. 95, 195–209.
Kind, R., et al., 2002. Comprehensive seismic images o the crust
and upper mantle beneath Tibet. Science 298, 1219–1221.
Kola-Ojo, O., Meissner, R., 2001. Southern Tibet: its deep structure
and some tectonic implications. J. Asian Earth, 240–256.
Kosarev, G., Kind, R., Sobolev, S., Yuan, X., Hanka, W., Oreshin,
S., 1999. Seismic evidence for a detached Indian lithospheric
mantle beneath Tibet. Science 5406 (283), 1306–1309.
Langin, W.R., Brown, L.D., Sandvol, E.A., 2003. Seismicity of
central Tibet from Project INDEPTH III seismic recordings.
Bull. Seismol. Soc. Am. 93 (5), 2146–2159.
Le Pichon, X., Henry, P., Goffe, B., 1997. Uplift of Tibet: from
eclogites to granulites—implications for the Andean Plateau and
the Variscan belt. Tectonophysics 273, 57–76.
Makowski, Y., Klemperer, S., 1999. Measuring the seismic proper-
ties of Tibetan bright spots: evidence for free aqueous fluids in
the Tibetan middle crust. J. Geophys. Res. 104, 10795–10825.
McNamara, D.E., Ovens, T.J., Silver, P., Wu, F., 1994. Shear wave
anisotropy beneath the Tibetan Plateau. J. Geophys. Res. 99,
13655–13665.
McNamara, D.E., Owens, T.J., Walter, W.R., 1995. Observations of
regional phase propagation across the Tibetan Plateau. J. Geo-
phys. Res. 100, 22215–22229.
McNamara, D.E., Walter, W.R., Owens, T.J., Ammon, C.J., 1997.
Upper mantle velocity structure beneath the Tibetan Plateau
from Pn travel time tomography. J. Geophys. Res. 102,
483–505.
Meissner, R., 1996. Faults and folds, fact and fiction. Tectonophy-
sics 264, 279–293.
Meissner, R., Mooney, W.D., 1998. Weakness of the lower conti-
nental crust: a condition for delamination, uplift, and escape.
Tectonophysics 296, 47–60.
Meissner, R., Strehlau, J., 1982. Limits of stresses in continental
crusts and their relation to depth– frequency distribution of shal-
low earthquakes. Tectonics 1, 73–89.
Meissner, R., Mooney, W.D., Artemieva, I., 2002. Seismic aniso-
tropy and mantle creep in young orogens. Geophys. J. Int. 148,
1–17.
Molnar, P., Tapponier, P., 1975. Cenozoic tectonics of Asia: effects
of a continental collision. Science 189, 419–426.
Mooney, W.D., Prodehl, C. (Eds.), 1984. Proceedings of the 1980
workshop of the International Ass. of Seismology and Physics
of he Earth’s interior on the seismic modeling of laterally vary-
ing structures. U.S. Geol. Surv. Circ., vol. 937. 158 pp.
Muller, G., 1985. The reflectivity method: a tutorial. J. Geophys.
Res. 58, 153–174.
Nelson, K.D., et al., 1996. Partially molten middle crust beneath
southern Tibet: synthesis of project INDEPTH results. Science
274, 1684–1688.
Park, J., Levin, V., 2002. Seismic anisotropy: tracing plate dynam-
ics in the mantle. Science 296, 485–489.
Powel, C.M., 1986. Continental underplating model for the rise of
the Tibetan Plateau. Earth Planet. Sci. Lett. 81, 79–94.
Powel, C.M., Conaghan, P.J., 1973. Plate tectonics and the Hima-
laya. Earth Planet. Sci. Lett. 20, 1–12.
Rapine, R., Tilmann, F., West, M., Ni, J., Rodgers, A., 2003. Crus-
tal structure of northern and western Tibet from surface wave
dispersion analysis. J. Geophys. Res. 108 (B2), 2120–2129.
Ratschbacher, L., 1996. Kinematics of Tibet. Z. Dtsch. Geol. Ges.
147, 427–434.
Ringwood, A.E., Green, D.H., 1966. An experimental investigation
of the gabbro–eclogite transformation and some geophysical
applications. Tectonophysics 3, 383–427.
Sapin, M., Hirn, A., 1997. Seismic structure and evidence for eclo-
gitization during the Himalayan convergence. Tectonophysics
273, 17–30.
Smith, G.P., Ekstrom, G., 1999. A global study of Pn anisotropy
beneath continents. J. Geophys. Res. 104, 963–980.
Tapponnier, P., 1981. The Tibetan side of the India–Eurasia colli-
sion. Nature 294, 405–410.
Tapponnier, P., 1990. The Ailao Shan-Red River metamorphic belt:
tertiary left-lateral shear between Indochina and South China.
Nature 294, 405–410.
Tapponier, O., Zhiqin, X., Roger, F., Meyer, B., Arnaud, N., Witt-
linger, G., Jinsul, Y., 2001. Oblique stepwise rise and growth of
the Tibet Plateau. Science 294, 1671–1677.
Tilmann, F., Ni, J., INDEPTH III team, 2002. The India Asia
collision zone in the mantle beneath central Tibet revealed by
P wave tomography. Geophys. Res. Abstr., 2th EGS, Nice,
p. 86.
Tilmann, F.J., Ni, J. INDEPTH III Seismic Team, 2003. Seismic
imaging of the downwelling Indian lithosphere beneath central
Tibet. Science 300, 1424–1427.
Van der Voerd, J., et al., 2002. Uniform postglacial slip-rate along
the central 600 km of the Kunlun Fault (Tibet), from 2-l, 10 Be,
and 1-dating of riser offsets, and climatic origin of he regional
morphology. Geophys. J. Int. 148, 356–388.
Vergne, J., Wittlinger, G., Hui, Q., Tapponier, P., Poupinet, G., Mei,
J., Herquel, G., Paul, A., 2002. Seismic evidence for stepwise
thickening of the crust across the NE Tibetan Plateau. Earth
Planet. Sci. Lett. 203, 25–33.
Vinnik, L.P., Makeyeva, L.I., Milev, A., Usenko, A.Y., 1992. Glob-
al pattern of azimuthal anisotropy and deformations in the con-
tinental mantle. Geophys. J. Int. 111, 433–447.
Wang, Q., et al., 2001. Present-day crustal deformation in China
constrained by global positioning system measurements. Sci-
ence 294, 574–577.
Westaway, R., 1995. Crustal volume balance during the India–
Eurasia collision and altitude of the Tibetan Plateau: a working
hypothesis. J. Geophys. Res. 100, 15173–15192.
Yin, A., Harrison, T.M., 2000. Geologic evolution of the Hima-
layan–Tibetan orogen. Annu. Rev. Earth Planet. Sci. Lett. 28,
211–280.
Yuan, X., 1999. Teleseismic receiver functuin study and its appli-

R. Meissner et al. / Tectonophysics 380 (2004) 1–25 25
cation in Tibet and the Central Andes; Ph.D. thesis. GeoCenter
Potsdam, Sci. Technical Report STR00/10. 146 pp.
Yuan, X., Ni, J., Kind, R., Mechie, J., Sandvol, E., 1997. Litho-
spheric and upper mantle structure of southern Tibet from a
seismological passive source experiment. J. Geophys. Res.
102, 27491–27500.
Zelt, C.A., Smith, R.B., 1992. Seismic travel time inversion for 2-D
crustal velocity structure. Geophys. J. Int. 108, 16–34.
Zhao, W.L., Morgan, W.J., 1985. Uplift of the Tibetan Plateau.
Tectonics 4, 359–559.
Zhao, W.L., Morgan, W.J., 1987. Injection of Indian crust into
Tibetan lower crust: a two-dimensional finite element model
study. Tectonics 6, 489–504.
Zhao, W., Nelson, K.D., and then INDEPTH Team, 1993. Deep
seismic-reflection evidence of continental underthrusting be-
neath southern Tibet. Nature 366, 557–559.
Zhao, W., et al., 2001. Crustal structure of central Tibet as derived
from project INDEPTH III wide angle data. Geophys. J. Int.
145, 486–498.