DANDOT CEMENT COMPANY LIMITED CEMENT... · 1980 1983 1972 1992


About the CompanyKohat Cement Company Limited was incorporated in 1980 and is one of the leading cement manufacturing
company of Pakistan. It is an ISO 9001-2008 certified company, with an annual capacity of 2.8 Million tons of
Grey Cement and 148.5 thousand tons of White Cement. The Registered office and the Factory are located at
Kohat, whereas the Head Office is located in Lahore.
K O H A T C E M E N T C O M P A N Y L I M I T E D 01

Contents
K O H A T C E M E N T C O M P A N Y L I M I T E D02
Vision, Mission & Corporate Strategy
Corporate information
Organogram
20 year history at a glance
Notice of Annual General Meeting
Director’s Report
Statement of compliance with CCG
Review Report on Statement of
Compliance with CCG
Auditor’s Report to members
Financial Statements
Pattern of shareholding
Additional information on Pattern of Shareholding as required by CCG
Form of Proxy
03
04
05
06
08
09
16
18
19
20
58
59
61

VISION
Be the best in the eyes of all stakeholders
OUR MISSION IS TO PROVIDE
Our Customers with quality cement at competitive pricingOur Shareholders with good returns and sustainable growth
Our Employees with care and career development opportunities
CORPORATE STRATEGY
Stay ahead of competition by adopting latest technology with efficient and progressive teamwork in an environment of
good governance and professionalism
K O H A T C E M E N T C O M P A N Y L I M I T E D 03

Corporate Information
Board of Directors
Chief Executive Mr. Aizaz Mansoor SheikhExecutive Directors Mr. Nadeem Atta Sheikh Mr. Omer Aizaz Sheikh
Non-Executive Directors Mrs. Ghazala Amjad Mrs. Hafsa Nadeem Mr. Ibrahim Tanseer Sheikh Mr. M. Atta Tanseer Sheikh
Audit Committee Mr. Ibrahim Tanseer Sheikh Chairman Mr. Omer Aizaz Sheikh Mr. M. Atta Tanseer Sheikh
HR&R Committee
Mr. M. Atta Tanseer Sheikh Chairman Mr. Aizaz Mansoor Sheikh Mr. Ibrahim Tanseer Sheikh
Company Secretary Mr. Usman Khalil
Legal Advisor Qazi Waheed-ud-Din
Auditors KPMG Taseer Hadi & Co. Chartered Accountants
Share Registrar AZM Computers (Pvt.) Limited 24- Ferozepur Road, Mozang Chungi, Lahore. Tel: (042) 37500131 Fax: (042) 37500030
Registered Office and Works Kohat Cement Company Limited Rawalpindi Road, Kohat. Tel: (0922) 560990 Fax: (0922) 560405 Email: [email protected]
Head Office 37- P Gulberg - II, Lahore. Tel: (042) 11 111 5225 Fax: (042) 3575 4990 Email: [email protected]
Bankers of the Company Standard Charted Bank (Pak) Ltd The Bank of Khyber Askari Bank Limited Soneri Bank Limited National Bank of Pakistan KASB Bank Limited The Bank of Punjab Bank Alfalah Limited MCB Bank Limited Allied Bank Limited United Bank Limited
KCCL Head Office Lahore
K O H A T C E M E N T C O M P A N Y L I M I T E D04

Bo
ard
of
Dir
ect
ors
K O H A T C E M E N T C O M P A N Y L I M I T E D 05

20 Years History At A Glance
Acquisition of Kohat Cement Company Limited
(KCCL) by present management from Privatiza-
tion Commission of Pakistan. (Capacity 1,000 tpd
ranking 14th in the industry).
Listed on stock exchanges of Pakistan.
BMR of Grey Cement Line to 1,800 tpd.
Entry into Export market.
Conversion from Furnace Oil to Coal firing.
New White Cement Line of 450 tpd.
K O H A T C E M E N T C O M P A N Y L I M I T E D06

New Grey Cement Line of 6,700 tpd.
Standby power plant of 22.4 MW.
Grey Cement Line of 1,800 tpd.
Grey Cement Line of 6,700 tpd.
White Cement Line of 450 tpd.
Power Plant of 22.4 MW.
6th largest Cement manufacturer
in the industry.
07

Notice of annual general meetingNotice of annual general meeting
NOTICE is hereby given that 33rd Annual General Meeting of the shareholders of Kohat Cement Company
Limited will be held on Saturday, October 20, 2012 at 11:00 A.M., at its registered office, Kohat Cement Factory,
Rawalpindi Road, Kohat, to transact the following business:
ORDINARY BUSINESS
1. To receive, consider and adopt the audited accounts of the Company for the year ended June 30, 2012
together with Auditors’ and Directors’ Reports thereon.
2. To approve final cash dividend @ 30% i.e. Rs.3/- per ordinary share for the year ended June 30,
2012 as recommended by the Board of Directors.
3. To appoint Auditors for the year 2012-2013 and to fix their remuneration.
(By Order of the Board)
(USMAN KHALIL)
Lahore: September 29, 2012 COMPANY SECRETARY
Notes:
1. The register of members and the share transfer books of the Company will be closed from Saturday, October 13, 2012
to Saturday, October 20, 2012 (both days inclusive). Physical transfers / CDS transactions IDs received in order at the
share department of the Company, AZM Computer Services (Pvt.) Limited, 24-Ferozepur Road, Mozang Chungi, Lahore,
upto the close of business on Friday, October 12, 2012 will be treated in time for the purpose of entitlement of aforesaid
final cash dividend and to attend and vote at Annual General Meeting.
2. A member entitled to attend and vote at the Meeting may appoint another member as his/her proxy to attend and
vote on his/her behalf. Proxies, in order to be effective, must be received at the Registered Office of the Company 48
hours before the time of the holding of the Meeting. Form of proxy is enclosed herewith.
3. CDC shareholders are requested to bring their Computerized National Identity Card, Account and Participant’s
Number and will further have to follow the guidelines as laid down in the Securities & Exchange Commission of
Pakistan’s Circular No. 1 dated 26th January 2000 while attending the Meeting for identification.
4. The members should quote their folio number / CDS IDs in all correspondence with the Company and should bring
at the time of attending the Annual General Meeting.
5. The members are requested to notify immediately changes, if any, in their registered addresses.
6. Members who have not yet submitted photocopies of their CNIC to the Company are requested to send the same at
the earliest at the Company’s Share Registrar office to mention the same on the dividend warrants.
K O H A T C E M E N T C O M P A N Y L I M I T E D08
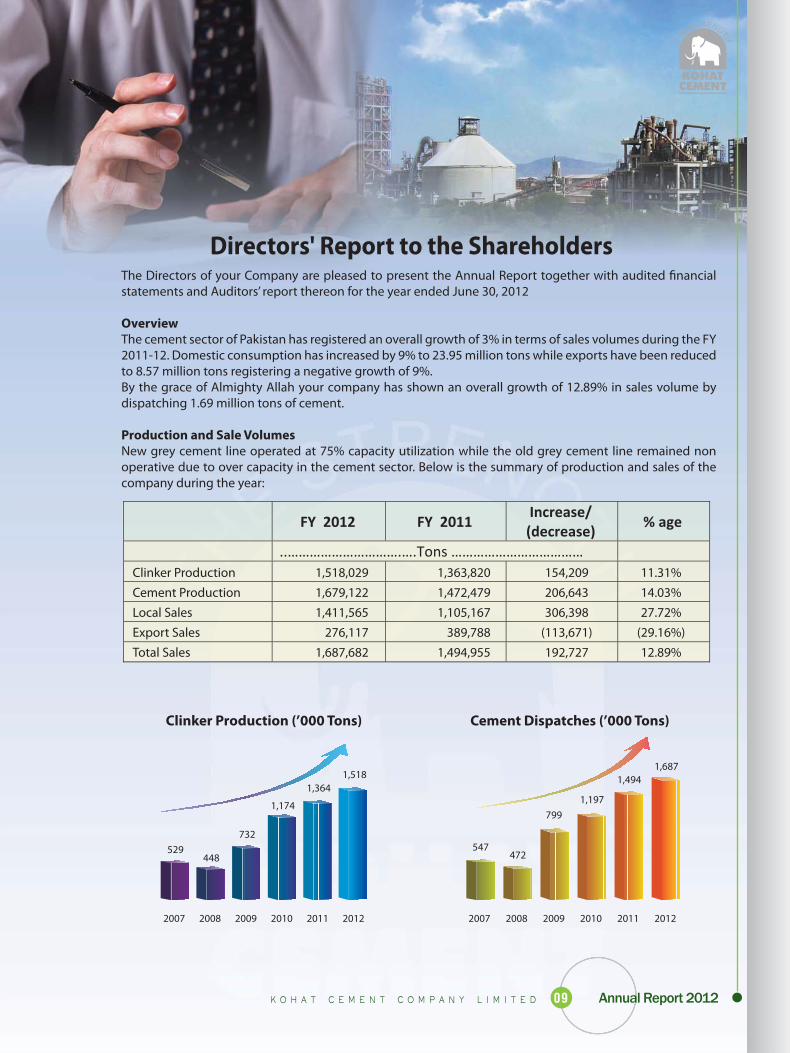
The Directors of your Company are pleased to present the Annual Report together with audited financial
statements and Auditors’ report thereon for the year ended June 30, 2012
Overview
The cement sector of Pakistan has registered an overall growth of 3% in terms of sales volumes during the FY
2011-12. Domestic consumption has increased by 9% to 23.95 million tons while exports have been reduced
to 8.57 million tons registering a negative growth of 9%.
By the grace of Almighty Allah your company has shown an overall growth of 12.89% in sales volume by
dispatching 1.69 million tons of cement.
Production and Sale Volumes
New grey cement line operated at 75% capacity utilization while the old grey cement line remained non
operative due to over capacity in the cement sector. Below is the summary of production and sales of the
company during the year:
Directors' Report to the Shareholders
2007 2008 2009 2010 2011 2012
547472
799
1,197
1,494
1,687
2007 2008 2009 2010 2011 2012
529448
732
1,174
1,364
1,518
Clinker Production
Cement Production
Local Sales
Export Sales
Total Sales
1,518,029
1,679,122
1,411,565
276,117
1,687,682
1,363,820
1,472,479
1,105,167
389,788
1,494,955
154,209
206,643
306,398
(113,671)
192,727
11.31%
14.03%
27.72%
(29.16%)
12.89%
Clinker Production (’000 Tons) Cement Dispatches (’000 Tons)
K O H A T C E M E N T C O M P A N Y L I M I T E D 09
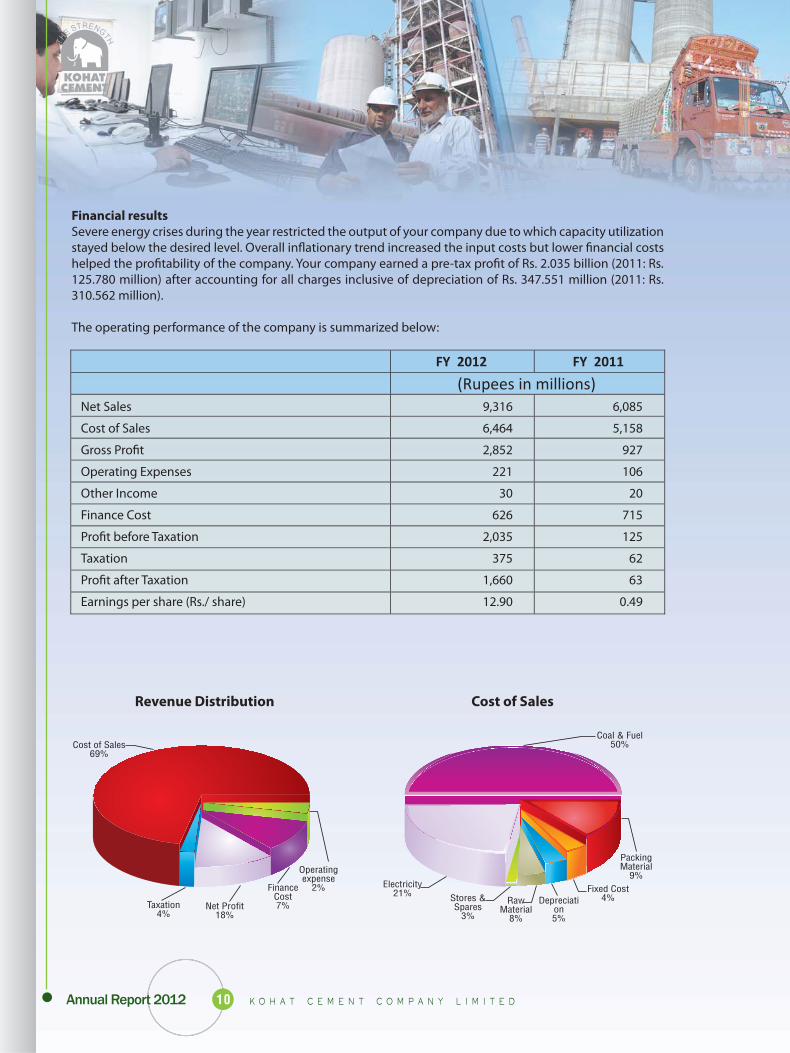
Financial results
Severe energy crises during the year restricted the output of your company due to which capacity utilization
stayed below the desired level. Overall inflationary trend increased the input costs but lower financial costs
helped the profitability of the company. Your company earned a pre-tax profit of Rs. 2.035 billion (2011: Rs.
125.780 million) after accounting for all charges inclusive of depreciation of Rs. 347.551 million (2011: Rs.
310.562 million).
The operating performance of the company is summarized below:
Net Sales
Cost of Sales
Gross Profit
Operating Expenses
Other Income
Finance Cost
Profit before Taxation
Taxation
Profit after Taxation
Earnings per share (Rs./ share)
9,316
6,464
2,852
221
30
626
2,035
375
1,660
12.90
6,085
5,158
927
106
20
715
125
62
63
0.49
Revenue Distribution Cost of Sales
K O H A T C E M E N T C O M P A N Y L I M I T E D10

Future prospects
The growth in demand of cement in local market is expected to continue because of increase in Government
spending during the election year.
Profitability of the company is likely to grow during the current financial year due to reduced financial costs.
Debt Obligations – The Company is not only current with its debt obligations but has prepaid Rs. 1.1 billion
of long term debt in addition to scheduled payments of Rs.822.6 million during the year under review.
Appropriations
The Board of Directors of your company is pleased to propose a 30% final cash dividend of Rs.3/- per ordinary
share for Financial Year ended June 30, 2012.
Appropriations approved by directors are as under:
The financial statements prepared by the management present fairly the Company's state of affairs, the
results of its operations, cash flows and changes in equity.
The Company has maintained proper books of account.
Appropriate accounting policies have been consistently applied in preparation of financial statements
and accounting estimates are based on reasonable and prudent judgment.
International Financial Reporting Standards, as applicable in Pakistan, have been followed in preparation
of the financial statements to ensure the true and fair view of the Company’s financial position.
The system of internal control is sound in design and has been effectively implemented and is being
monitored continuously. The review will continue in future for the improvement in controls.
There are no significant doubts upon the Company's ability to continue as a going concern.
Compliance with code of corporate governance
The management is fully aware of the Company's obligations for compliance with the Code of Corporate
Governance as incorporated in the Listing Regulations of all Stock Exchanges of Pakistan and steps are being
taken for its effective implementation within the allowed time frame. The various statements, as required by
the Code, are given below:
386, 272
1,960,074
K O H A T C E M E N T C O M P A N Y L I M I T E D 11

The Directors who could not attend the Board & Committee Meetings and requested for leave were duly
granted leave of absence from the meeting by the Board/Committees in accordance with the law.
Training program by Board of Directors
The Board has arranged Board Development Series Certificate Program of Pakistan Institute of Corporate
Governance (“PICG”) for two of its directors who have completed the training successfully during the year.
Trading In Company’s shares
Movement in Directors, CEO and their spouses and minor children’s shareholding is given as under:
Financial highlights
Key operating & financial data of last eight years is included in this report.
Outstanding statutory dues
The outstanding statutory dues on account of taxes, duties, levies and charges are disclosed in note no. 10.
Statement on value of staff retirement funds
The value of investments of provident fund based on its unaudited accounts as at June 30, 2012 is Rs.55.184
million (2011: 42.801 million)
Board & its committee meetings
Attendance by each director at the Board of Directors (BOD) and Board Audit Committee (BAC) meetings are
as under:
There has been no material departure from the Best Practices of Corporate Governance, as detailed in
the Listing Regulations wherever applicable to the Company for the year ended June 30, 2012.
No. of meetings held
Mr. Aizaz Mansoor Sheikh
Mr. Nadeem Atta Sheikh
Mrs. Ghazala Amjad
Mrs. Hafsa Nadeem
Mr. Omer Aizaz Sheikh
Mr. Ibrahim Tanseer
Mr. Muhammad Atta Tanseer Sheikh
6
6 / 6
6 / 6
3 / 6
- / 6
6 / 6
6 / 6
6 / 6
6
-
-
-
-
5 / 6
6 / 6
6 / 6
Meetings attended
BOD BAC
K O H A T C E M E N T C O M P A N Y L I M I T E D12

Above data is based on information as provided by the Directors.
Pattern of shareholding
The Pattern of Shareholding alongwith additional information as required by the Code of Corporate
Governance is included in this report.
External auditors
The present auditors, M/s. KPMG Taseer Hadi and Co., Chartered Accountants, retire and being eligible, offer
themselves for re-appointment. As suggested by the Audit Committee, the Board of Directors has recom-
mended the re-appointment of present auditors of the Company for the ensuing year.
Corporate Social Responsibility
Disclosure as required by the Companies (Corporate Social Responsibility) General Order, 2009 is annexed.
Management and employees relations
The Board would like to record its appreciation for the valuable contribution made by all its employees. The
management is quite confident that these cordial relations and cooperation will continue in the years to
come.
For and on behalf of the Board
Lahore: September 12, 2012
* Gift to sons
** Gift from father
Aizaz SheikhChief Executive
K O H A T C E M E N T C O M P A N Y L I M I T E D 13

Being a socially responsible organisation, KCCL sponsors projects of education
and medical assistance. We also support development of nearby communities
and continuously strive to increase energy conservation and environment
friendly business practices.
Corporate philanthropy
The company plays its role in giving back to the society by sponsoring the Kohat
Cement Education Trust, which operates a school within the factory premises for
the children of the employees and local residents. In FY 2011-12, the student
strength was 263 and faculty strength was 18.
Energy conservation
Some measures taken for energy conservation during the financial year 2011-12
are as hereunder:
Replacement of Electric bulbs, energy savers and tube light
with LED’s.
Energy audit of the factory for replacing all conventional
light fixtures with LED technology.
Switching off all air conditioners and lights during lunch hours.
Community investment and welfare schemes
The company is continuously working for the welfare of the neighboring commu-
nities as well as the society at large.
KCCL operates a hospital within factory premises to provide medical treatment to
staff and their family members.
KCCL has paid Rs. 2.8 million to Qaumi committee of local residents during the
financial year under review. The Qaumi committee utilizes these funds for
infrastructure projects in the nearby villages.
Corporate Social Responsibility
Mosque Award ceremony at Hotel Sunfort
K O H A T C E M E N T C O M P A N Y L I M I T E D14

Industrial relations
The company recognizes that a cordial relation between management and
employees is one of the key factors for corporate success.
The company conducts a yearly Hajj ballot for those employees who have
completed 3 years of service with the company. To date 79 employees have
performed Hajj under this scheme.
Lifetime Service award
Subsequent to the financial year end, an award ceremony was held at Hotel
Sunfort Lahore, to honour the long and dedicated affiliation of some of the
KCCL ex- employees with the company.
Occupational safety and health
The Health and Safety team carries out monthly audits at the factory and
consequently educates the employees regarding the fundamentals of a safe
working environment.
Business ethics and anti-corruption measures
The management is committed to conduct all business activities with integrity,
honesty and in full compliance with the current laws and regulations. A code of
conduct has been developed and approved by the Board, which is signed by all
the employees.
Contribution to national exchequer
To meet our legal and social obligation towards the development of the
economy of the country, the company has contributed Rs. 2.2 billion in the FY
2011-12 into Government exchequer on account of taxes, levies, excise duty
and sales tax. Moreover, foreign exchange of amount USD $15.2 million was
also earned for the Country from export of cement during the financial year.
KCET School Hospital
K O H A T C E M E N T C O M P A N Y L I M I T E D 15
16
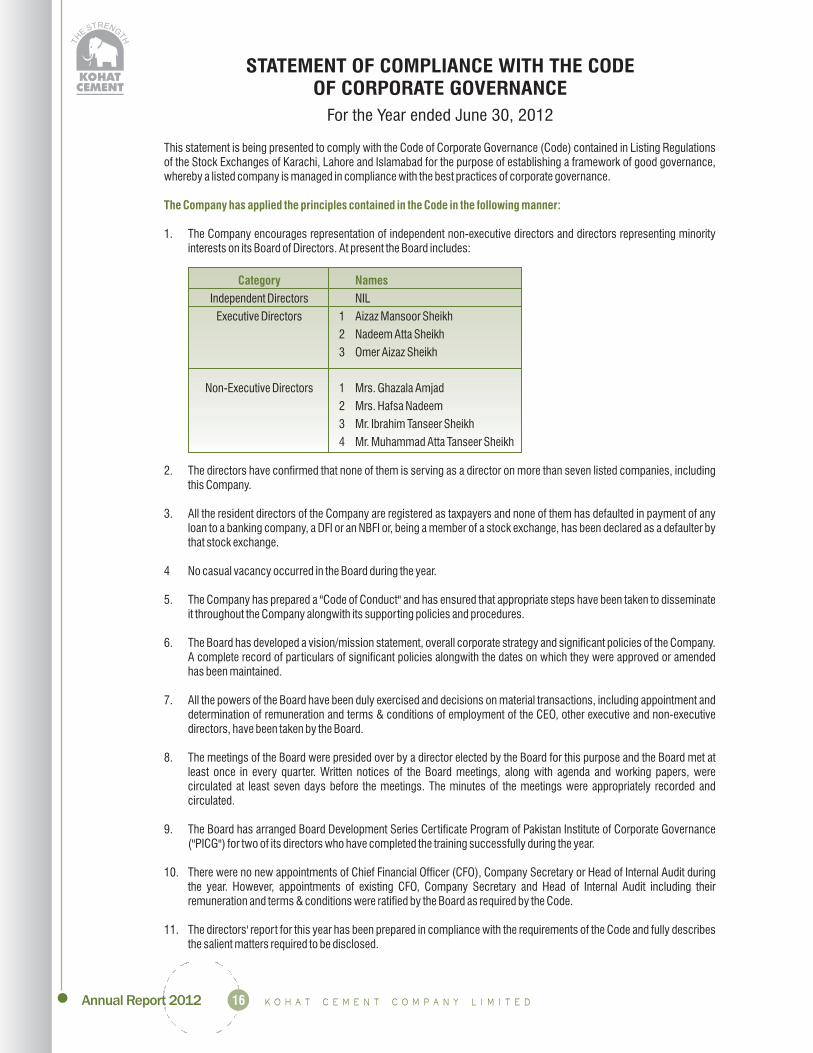
This statement is being presented to comply with the Code of Corporate Governance (Code) contained in Listing Regulationsof the Stock Exchanges of Karachi, Lahore and Islamabad for the purpose of establishing a framework of good governance,whereby a listed company is managed in compliance with the best practices of corporate governance.
1. The Company encourages representation of independent non-executive directors and directors representing minorityinterests on its Board of Directors. At present the Board includes:
Independent Directors NIL
Executive Directors 1 Aizaz Mansoor Sheikh
2 Nadeem Atta Sheikh
3 Omer Aizaz Sheikh
Non-Executive Directors 1 Mrs. Ghazala Amjad
2 Mrs. Hafsa Nadeem
3 Mr. Ibrahim Tanseer Sheikh
4 Mr. Muhammad Atta Tanseer Sheikh
2. The directors have confirmed that none of them is serving as a director on more than seven listed companies, includingthis Company.
3. All the resident directors of the Company are registered as taxpayers and none of them has defaulted in payment of anyloan to a banking company, a DFI or an NBFI or, being a member of a stock exchange, has been declared as a defaulter bythat stock exchange.
4 No casual vacancy occurred in the Board during the year.
5. The Company has prepared a "Code of Conduct" and has ensured that appropriate steps have been taken to disseminateit throughout the Company alongwith its supporting policies and procedures.
6. The Board has developed a vision/mission statement, overall corporate strategy and significant policies of the Company.A complete record of particulars of significant policies alongwith the dates on which they were approved or amendedhas been maintained.
7. All the powers of the Board have been duly exercised and decisions on material transactions, including appointment anddetermination of remuneration and terms & conditions of employment of the CEO, other executive and non-executivedirectors, have been taken by the Board.
8. The meetings of the Board were presided over by a director elected by the Board for this purpose and the Board met atleast once in every quarter. Written notices of the Board meetings, along with agenda and working papers, werecirculated at least seven days before the meetings. The minutes of the meetings were appropriately recorded andcirculated.
9. The Board has arranged Board Development Series Certificate Program of Pakistan Institute of Corporate Governance("PICG") for two of its directors who have completed the training successfully during the year.
10. There were no new appointments of Chief Financial Officer (CFO), Company Secretary or Head of Internal Audit duringthe year. However, appointments of existing CFO, Company Secretary and Head of Internal Audit including theirremuneration and terms & conditions were ratified by the Board as required by the Code.
11. The directors' report for this year has been prepared in compliance with the requirements of the Code and fully describesthe salient matters required to be disclosed.
The Company has applied the principles contained in the Code in the following manner:
Category Names
STATEMENT OF COMPLIANCE WITH THE CODEOF CORPORATE GOVERNANCE
For the Year ended June 30, 2012

17
12. The financial statements of the Company were duly endorsed by the CEO and the CFO before approval of the Board.
13. The directors, CEO and executives do not hold any interest in the shares of the Company other than that disclosed in thepattern of shareholding.
14. The Company has complied with all the corporate and financial reporting requirements of the Code.
15. The Board has formed an audit committee. It comprises three members, of whom two are non-executive directorsincluding the chairman of the committee.
16. The meetings of the audit committee were held at least once every quarter prior to approval of interim and final results ofthe Company and as required by the Code. The terms of reference of the committee have been formed and advised to thecommittee for compliance.
17. Subsequent to the year end, the Board has formed an HR and Remuneration Committee. It comprises three members, ofwhom two are non-executive directors including the chairman of the Committee.
18. The Board has set-up an effective internal audit function and personnel involved are considered suitably qualified andexperienced for the purpose and are conversant with the policies and procedures of the company.
19. The statutory auditors of the Company have confirmed that they have been given a satisfactory rating under the qualitycontrol review programme of the Institute of Chartered Accountants of Pakistan, that they or any of the partners of thefirm, their spouses and minor children do not hold shares of the Company and that the firm and all its partners are incompliance with International Federation of Accountants (IFAC) guidelines on code of ethics as adopted by Institute ofChartered Accountants of Pakistan. .
20. The statutory auditors or the persons associated with them have not been appointed to provide other services except inaccordance with the listing regulations and the auditors have confirmed that they have observed IFAC guidelines in thisregard.
21. The 'close period', prior to the announcement of interim/ final results and business decisions, which may materiallyaffect the market price of Company's securities, was determined and intimated to directors, employees and stockexchanges.
22. Material/ price sensitive information has been disseminated among all market participants at once through stockexchanges.
23. We confirm that all other material principles enshrined in the Code have been complied.
AIZAZ MANSOOR SHEIKHLahore: September 12, 2012 Chief Executive

18
We have reviewed the Statement of Compliance with the best practices contained in the Code of Corporate Governanceprepared by the Board of Directors of to comply with the ListingRegulations of Karachi, Lahore and Islamabad Stock Exchanges.
The responsibility for compliance with the Code of Corporate Governance is that of the Board of Directors of the Company. Ourresponsibility is to review, to the extent where such compliance can be objectively verified, whether the Statement ofCompliance reflects the status of the Company's compliance with the provisions of the Code of Corporate Governance andreport if it does not. A review is limited primarily to inquiries of the Company personnel and review of various documentsprepared by the Company to comply with the Code. As part of our audit of financial statements we are required to obtain anunderstanding of the accounting and internal control systems sufficient to plan the audit and develop an effective auditapproach. We have not carried out any special review of the internal control system to enable us to express an opinion as towhether the Board's statement on internal control covers all controls and the effectiveness of such internal controls.
Further, Sub- Regulation (xiii a) of Listing Regulation No. 35 (previously Regulation No. 37) notified by The Karachi StockExchange (Guarantee) Limited vide circular KSE/N-269 dated 19 January 2009 requires the Company to place before theBoard of Directors for their consideration and approval related party transactions distinguishing between transactions carriedout on terms equivalent to those that prevail in arm's length transactions and transactions which are not executed at arm'slength price recording proper justification for using such alternate pricing mechanism. Further, all such transactions are alsorequired to be separately placed before the audit committee.
We are only required and have ensured compliance of requirement to the extent of approval of related party transactions by theBoard of Directors and placement of such transactions before the audit committee. We have not carried out any procedures todetermine whether the related party transactions were under taken at arm's length price.
Based on our review, nothing has come to our attention which causes us to believe that the Statement of Compliance does notappropriately reflect the Company's compliance, in all material respects, with the best practices contained in the Code ofCorporate Governance as applicable to the Company for the year ended 30 June 2012.
KPMG Taseer Hadi &Co.Lahore: September 12, 2012 Chartered Accountants
(Bilal Ali)
Kohat Cement Company Limited ("the Company")
REVIEW REPORT TO THE MEMBERS ON STATEMENT OFCOMPLIANCE WITH BEST PRACTICES OF CODE OF
CORPORATE GOVERNANCE

19
AUDITORS' REPORT TO THE MEMBERS
We have audited the annexed balance sheet of as at 30 June 2012 and therelated profit and loss account, statement of comprehensive income, cash flow statement and statement of changes in equitytogether with the notes forming part thereof, for the year then ended and we state that we have obtained all the information andexplanations which, to the best of our knowledge and belief, were necessary for the purposes of our audit.
It is the responsibility of the Company's management to establish and maintain a system of internal control, and prepare andpresent the above said statements in conformity with the approved accounting standards and the requirements of theCompanies Ordinance, 1984. Our responsibility is to express an opinion on these statements based on our audit.
We conducted our audit in accordance with the auditing standards as applicable in Pakistan. These standards require that weplan and perform the audit to obtain reasonable assurance about whether the above said statements are free of any materialmisstatement. An audit includes examining, on a test basis, evidence supporting the amounts and disclosures in the abovesaid statements. An audit also includes assessing the accounting policies and significant estimates made by management, aswell as, evaluating the overall presentation of the above said statements. We believe that our audit provides a reasonable basisfor our opinion and, after due verification, we report that:
a) in our opinion, proper books of account have been kept by the Company as required by the Companies Ordinance, 1984;
b) in our opinion:
i) the balance sheet and profit and loss account together with the notes thereon have been drawn up in conformitywith the Companies Ordinance, 1984, and are in agreement with the books of account and are further inaccordance with accounting policies consistently applied;
ii) the expenditure incurred during the year was for the purpose of the Company's business; and
iii) the business conducted, investments made and the expenditure incurred during the year were in accordance withthe objects of the Company;
c) in our opinion and to the best of our information and according to the explanations given to us, the balance sheet, profitand loss account, statement of comprehensive income, cash flow statement and statement of changes in equitytogether with the notes forming part thereof conform with approved accounting standards as applicable in Pakistan, and,give the information required by the Companies Ordinance, 1984, in the manner so required and respectively give a trueand fair view of the state of the Company's affairs as at 30 June 2012 and of the profit, its comprehensive income, cashflows and changes in equity for the year then ended; and
d) in our opinion no Zakat was deductible at source under the Zakat and Ushr Ordinance, 1980 (XVIII of 1980).
Kohat Cement Company Limited (“the Company”)
Lahore: September 12, 2012
KPMG Taseer Hadi & Co.Chartered Accountants
(Bilal Ali)

20
BALANCE SHEETas at 30 June 2012
EQUITY AND LIABILITIES
Authorised share capital
Non-current liabilities
Current liabilities
Contingencies and commitments
1,500,000,000
1,287,572,410122,536,851
2,346,346,095
3,756,455,356
1,162,700,000165,735,153
1,228,691,186-
2,557,126,339
1,147,023,60299,014,642
1,160,957,469492,300,000
2,899,295,713
9,212,877,408
Issued, subscribed and paid up capitalReservesAccumulated profit
150,000,000 (2011: 150,000,000) ordinary sharesof Rs. 10 each 1,500,000,000
4 1,287,572,4105 129,409,009
685,834,718
2,102,816,137
Long term finances - secured 6 3,536,870,000Long term security deposits and retention money 7 163,656,829Deferred liabilities 8 323,097,976Derivative financial liabilities 9 187,420,429
4,211,045,234
Trade and other payables 10 973,628,527Interest and markup accrued 11 433,182,170Short term borrowings - secured 12 1,363,678,773Current portion of non-current liabilities 13 40,050,000
2,810,539,470
14
9,124,400,841
The annexed notes from 1 to 42 form an integral part of these financial statements.
2012Rupees
2011RupeesNote

21
BALANCE SHEETas at 30 June 2012
ASSETS
Non Current Assets
Current assets
6,789,893,19478,546,638
6,868,439,832
2,042,76520,133,6783,879,440
6,894,495,715
1,191,004,172500,326,860
4,491,82923,000,000
471,353,236128,205,596
2,318,381,693
9,212,877,408
Operating fixed assets 15 7,140,840,908Capital work-in-progress 16 -
7,140,840,908
17 2,355,96318 23,706,05419 3,879,440
7,170,782,365
Stores, spares and loose tools 20 850,571,198Stock in trade 21 507,527,333Trade debts 22 12,567,298Investments 23 36,156,000Advances, deposits, prepayments
and other receivables 24 506,114,913Cash and bank balances 25 40,681,734
1,953,618,476
9,124,400,841
Property, plant and equipment
Intangible assetsLong term loans and advancesLong term deposits
2012Rupees
2011RupeesNote
CHIEF EXECUTIVE DIRECTOR
22
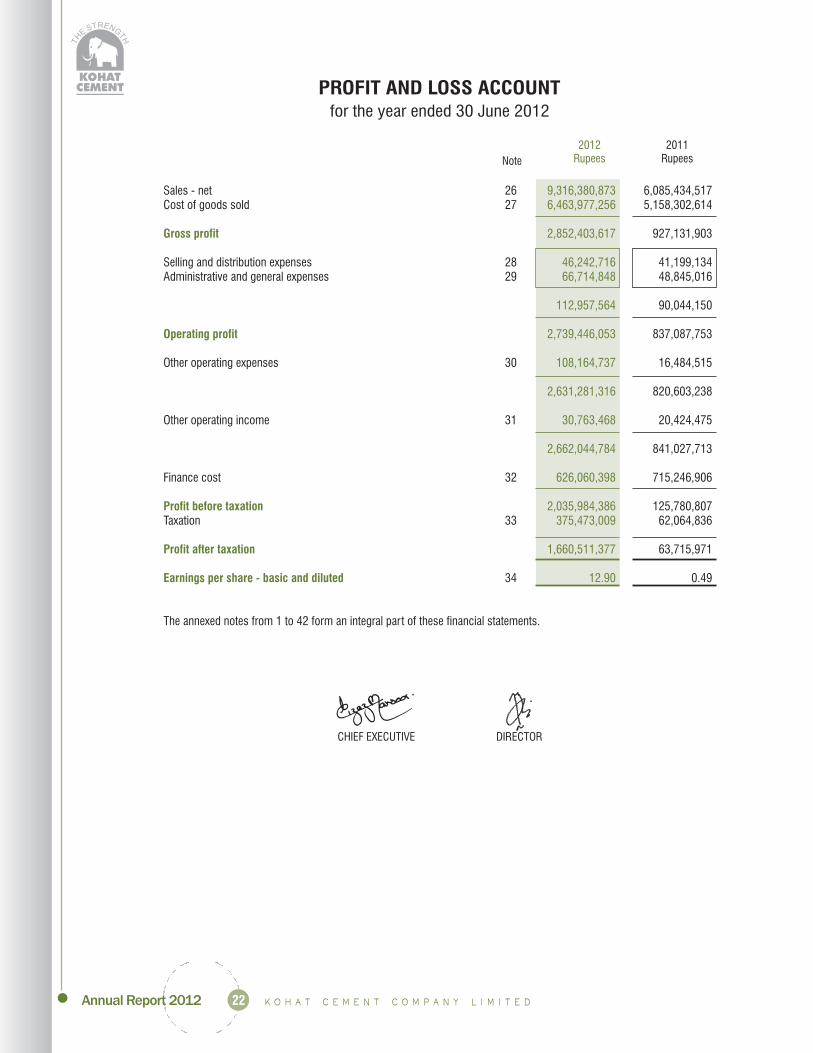
PROFIT AND LOSS ACCOUNTfor the year ended 30 June 2012
Sales - net 26 6,085,434,517Cost of goods sold 27 5,158,302,614
927,131,903
Selling and distribution expenses 28 41,199,134Administrative and general expenses 29 48,845,016
90,044,150
837,087,753
Other operating expenses 30 16,484,515
820,603,238
Other operating income 31 20,424,475
841,027,713
Finance cost 32 715,246,906
125,780,807Taxation 33 62,064,836
63,715,971
34 0.49
The annexed notes from 1 to 42 form an integral part of these financial statements.
9,316,380,8736,463,977,256
2,852,403,617
46,242,71666,714,848
112,957,564
2,739,446,053
108,164,737
2,631,281,316
30,763,468
2,662,044,784
626,060,398
2,035,984,386375,473,009
1,660,511,377
12.90
Gross profit
Operating profit
Profit before taxation
Profit after taxation
Earnings per share - basic and diluted
2012Rupees
2011RupeesNote
CHIEF EXECUTIVE DIRECTOR

23
STATEMENT OF COMPREHENSIVE INCOME
for the year ended 30 June 2012
Profit after taxation 63,715,971
Change in fair value 15,987,900
Fair value adjustment of cash flow hedge 14,603,618Re-pricing settlement received from cash flow hedge 51,055,679Deferred taxation of hedging movements (3,516,902)
62,142,395
78,130,295
Total comprehensive income for the year 141,846,266
The annexed notes from 1 to 42 form an integral part of these financial statements.
Available for sale financial assets
Cash flow hedge
1,660,511,377
(13,156,000)
---
-
(13,156,000)
1,647,355,377
Other comprehensive income
Other comprehensive income for theyear - net of taxes
2012Rupees
2011Rupees
CHIEF EXECUTIVE DIRECTOR

24
CASH FLOW STATEMENTfor the year ended 30 June 2012
Cash flow from operating activities
Net cash inflow from operating activities
Cash flow from investing activities
Net cash used in investing activities
Cash flow from financing activities
Net cash (outflow)/ inflow from financing activities
Net Increase in cash and cash equivalents
Cash and cash equivalents at the end of the year
2,035,984,386
347,551,645825,244
(2,255,644)(14,012,085)
8,684,0424,172,196
(4,865,351)61,703,160
564,357,238
966,160,445
3,002,144,831
(326,746,755)7,200,4738,075,469
58,709,010
173,395,075
(79,366,728)
2,922,778,103
(321,164,701)(15,414,974)
(678,472)(96,579,676)
(433,837,823)
2,488,940,280
(95,478,738)3,729,1344,865,3513,572,376
-(1,113,676)
(84,425,553)
(202,822,355)200,000,000
(1,921,920,000)-
(247,193,600)54,844,039
(2,117,091,916)
287,422,811
(722,174,684)
(434,751,873)
Profit before taxation 125,780,807Adjustments for non cash expenses and other items:
Depreciation on property, plant and equipment 310,562,802Amortization 687,984Profit on sale of property, plant and equipment (1,018,152)Exchange (gain)/ loss - net 6,526,472Provision for staff retirement benefits 3,181,557Provision for compensated absences 677,954Profit/mark-up on bank deposits and advances (2,917,754)Loss realized on winding up of financial derivative instrument -Finance cost 715,246,906
1,032,947,769
1,158,728,576
Stores, spares and loose tools (212,570,771)Stock in trade (217,094,276)Trade debts 7,442,835Advances, deposits, prepayments and other receivables (158,511,339)
Trade and other payables 239,316,040
(341,417,511)
817,311,065
Finance cost paid (574,832,364)Contribution to staff retirement benefit - net (795,340)Compensated absences paid (409,199)Income tax paid (17,447,982)
(593,484,885)
223,826,180
Fixed capital expenditure (145,440,202)Sale proceeds of property, plant and equipment 5,811,072Profit/mark-up on bank deposits 2,917,754Decrease in long term loans and advances 5,126,232(Increase) in short term investments (20,168,100)(Increase)/ Decrease in long term deposits 1,518,000
(150,235,244)
Repayment of import finance 136,435,362Proceeds from export refinance -Repayments of long term finances (66,733,425)Payment of finance lease liabilities (2,036,713)Repayment of derivative financial instrument -Proceeds from derivative financial instrument 51,055,679
118,720,903
192,311,839
(914,486,523)
35 (722,174,684)
The annexed notes from 1 to 42 form an integral part of these financial statements.
Operating profit before working capital changes
(Increase)/decrease in current assets
Increase in current liabilities
Cash generated from operations
Cash and cash equivalents at the beginning of the year
2012Rupees
2011RupeesNote
CHIEF EXECUTIVE DIRECTOR

25
STATEMENT OF CHANGES IN EQUITYfor the year ended 30 June 2012
Balance as at 30 June 2010
Balance as at 30 June 2011
1,287,572,410 49,704,951 - (68,426,237) 70,000,000 622,118,747 1,960,969,871
Total comprehensive incomefor the year - - 15,987,900 62,142,395 - 63,715,971 141,846,266
1,287,572,410 49,704,951 15,987,900 (6,283,842) 70,000,000 685,834,718 2,102,816,137
Loss realized on cash flow hedge - - - 6,283,842 - - 6,283,842Total comprehensive income
for the year - - (13,156,000) - - 1,660,511,377 1,647,355,377
The annexed notes from 1 to 42 form an integral part of these financial statements.
Balance as at 30 June 2012 1,287,572,410 49,704,951 2,831,900 - 70,000,000 2,346,346,095 3,756,455,356
ShareCapital
SharePremium
Fair valueReserve
HedgingReserve
GeneralReserve
AccumulatedProfit
Total
( )Rupees
CHIEF EXECUTIVE DIRECTOR

26
NOTES TO THE FINANCIAL STATEMENTSfor the year ended 30 June 2012
1 Status and nature of the business
2 Basis of preparation2.1 Statement of compliance
2.2 New Standards and amendments to published approved accounting standards that are relevant but not yeteffective
Kohat Cement Company Limited ("the Company") is a public limited company incorporated in Pakistan under theCompanies Act, 1913 (now Companies Ordinance, 1984) and is listed on Karachi, Lahore and Islamabad StockExchanges. The Company is engaged in the production and sale of cement. The registered office is situated atRawalpindi Road, Kohat, Pakistan.
These financial statements have been prepared in accordance with approved accounting standards as applicablein Pakistan and the requirements of Companies Ordinance, 1984. Approved accounting standards comprise ofsuch International Financial Reporting Standards (IFRSs) issued by the International Accounting Standard Boardand Islamic Financial Reporting Standards (IFAs) issued by the Institute of Chartered Accountants of Pakistan asare notified under the provisions of the Companies Ordinance, 1984. Wherever, the requirements of the CompaniesOrdinance, 1984 or directives issued by the Securities and Exchange Commission of Pakistan differ with therequirements of these standards, the requirements of Companies Ordinance, 1984 or the requirements of the saiddirectives shall prevail.
The following standards, amendments and interpretations of approved accounting standards will be effective foraccounting periods beginning on or after 01 July 2012:
- Amendments to IAS 12 – deferred tax on investment property (effective for annual periods beginning on or after 1January 2012). The 2010 amendment provides an exception to the measurement principle in respect of investmentproperty measured using the fair value model in accordance with IAS 40 Investment Property. The measurement ofdeferred tax assets and liabilities, in this limited circumstance, is based on a rebuttable presumption that thecarrying amount of the investment property will be recovered entirely through sale. The presumption can berebutted only if the investment property is depreciable and held within a business model whose objective is toconsume substantially all of the asset's economic benefits over the life of the asset. The amendment has no impacton financial statements of the Company.
- IAS 19 Employee Benefits (amended 2011) - (effective for annual periods beginning on or after 1 January 2013).The amended IAS 19 includes the amendments that require actuarial gains and losses to be recognizedimmediately in other comprehensive income; this change will remove the corridor method and eliminate the abilityfor entities to recognize all changes in the defined benefit obligation and in plan assets in profit or loss, whichcurrently is allowed under IAS 19; and that the expected return on plan assets recognized in profit or loss iscalculated based on the rate used to discount the defined benefit obligation. Since the Company does not have anydefined benefit plan, this change has no impact on the Company's financial statements.
- Presentation of Items of Other Comprehensive Income (Amendments to IAS 1) - (effective for annual periodsbeginning on or after 1 July 2012). The amendments require that an entity present separately the items of othercomprehensive income that would be reclassified to profit or loss in the future if certain conditions are met fromthose that would never be reclassified to profit or loss. The amendments do not address which items are presentedin other comprehensive income or which items need to be reclassified. The requirements of other IFRSs continue toapply in this regard. The amendments have no impact on financial statements of the Company.
- Offsetting Financial Assets and Financial Liabilities (Amendments to IAS 32) – (effective for annual periodsbeginning on or after 1 January 2014). The amendments address inconsistencies in current practice whenapplying the offsetting criteria in IAS 32 Financial Instruments: Presentation. The amendments clarify the meaningof 'currently has a legally enforceable right of set-off'; and that some gross settlement systems may be consideredequivalent to net settlement.
- Offsetting Financial Assets and Financial Liabilities (Amendments to IFRS 7) – (effective for annual periodsbeginning on or after 1 January 2013). The amendments to IFRS 7 contain new disclosure requirements forfinancial assets and liabilities that are offset in the statement of financial position or subject to master nettingagreement or similar arrangement.
Annual Improvements 2009–2011 (effective for annual periods beginning on or after 1 January 2013). The newcycle of improvements contains amendments to the following five standards, with consequential amendments to

27
other standards and interpretations:
- IAS 1 Presentation of Financial Statements is amended to clarify that only one comparative period – which is thepreceding period – is required for a complete set of financial statements. If an entity presents additionalcomparative information, then that additional information need not be in the form of a complete set of financialstatements. However, such information should be accompanied by related notes and should be in accordance withIFRS. Furthermore, it clarifies that the 'third statement of financial position', when required, is only required if theeffect of restatement is material to statement of financial position.
- IAS 16 Property, Plant and Equipment is amended to clarify the accounting of spare parts, stand-by equipment andservicing equipment. The definition of 'property, plant and equipment' in IAS 16 is now considered in determiningwhether these items should be accounted for under that standard. If these items do not meet the definition, thenthey are accounted for using IAS 2 Inventories.
- IAS 32 Financial Instruments: Presentation - is amended to clarify that IAS 12 Income Taxes applies to theaccounting for income taxes relating to distributions to holders of an equity instrument and transaction costs of anequity transaction. The amendment removes a perceived inconsistency between IAS 32 and IAS 12.
- IAS 34 Interim Financial Reporting is amended to align the disclosure requirements for segment assets andsegment liabilities in interim financial reports with those in IFRS 8 Operating Segments. IAS 34 now requires thedisclosure of a measure of total assets and liabilities for a particular reportable segment. In addition, suchdisclosure is only required when the amount is regularly provided to the chief operating decision maker and therehas been a material change from the amount disclosed in the last annual financial statements for that reportablesegment.
- IFRIC 20 - Stripping cost in the production phase of a surface mining (effective for annual periods beginning on orafter 1 January 2013). The interpretation requires production stripping cost in a surface mine to be capitalized ifcertain criteria are met. The amendments have no impact on financial statements of the Company.
These financial statements have been prepared on the basis of historical cost convention, except for revaluation ofcertain financial instruments at fair value and recognition of certain employee retirement benefits at present value.
The preparation of financial statements in conformity with approved accounting standards requires managementto make judgments, estimates and assumptions that affect the application of policies and reported amounts ofassets and liabilities, income and expenses. The estimates and associated assumptions and judgments are basedon historical experience and various other factors that are believed to be reasonable under the circumstances, theresult of which form the basis of making the judgments about carrying values of assets and liabilities that are notreadily apparent from other sources. Actual results may differ from these estimates.
The estimates and underlying assumptions are reviewed on an ongoing basis. Revision to accounting estimatesare recognized in the period in which the estimate is revised if the revision affects only that period, or in the period ofrevision and future periods if the revision affects both current and future periods. The areas where variousassumptions and estimates are significant to Company's financial statements or where judgments were exercisedin application of accounting policies are:
- Taxation note 3.3- Staff retirement benefits note 3.4- Derivative financial instruments note 3.5- Depreciation method, residual values
and useful lives of depreciable assets note 3.8- Amortization method and useful life
for intangible asset note 3.10- Provisions and contingencies note 3.20
Income tax expense comprises current and deferred tax. Income tax is recognized in the profit and loss accountexcept to the extent that it relates to items recognized directly in equity, in which case it is recognized in equity.
3 Summary of significant accounting policies3.1 Basis of measurement
3.2 Use of judgments and estimates
3.3 Taxation

28
Provision of current tax is based on the taxable income for the year determined in accordance with the prevailinglaw for taxation of income. The charge for current tax is calculated using prevailing tax rates or tax rates expected toapply to the profit for the year if enacted after taking into account tax credits, rebates and exemptions, if any. Thecharge for current tax also includes adjustments, where considered necessary, to provision for tax made inprevious years arising from assessments framed during the year for such years.
Deferred tax is accounted for using the balance sheet liability method in respect of all temporary differences arisingfrom differences between the carrying amount of assets and liabilities in the financial statements and thecorresponding tax bases used in the computation of the taxable profit. Deferred tax liabilities are generallyrecognised for all taxable temporary differences and deferred tax assets are recognised to the extent that it isprobable that taxable profits will be available against which the deductible temporary differences, unused taxlosses and tax credits can be utilised.
Deferred tax assets and liabilities are calculated at the rates that are expected to apply to the period when the assetis realized or the liability is settled, based on the tax rates (and tax laws) that have been enacted or substantivelyenacted by the balance sheet date.
Upto 30 June 2011, the Company operated a funded gratuity scheme for all its permanent employees subject tocompletion of a prescribed qualifying period of service. Contribution to the fund was being made annually on thebasis of actuarial recommendation to cover obligation under the scheme.
The gratuity scheme has been terminated w.e.f. 30 June 2011 and all amounts due to employees under the gratuityscheme has been paid off during the year.
The Company operates a defined contributory provident fund scheme for all employees. Equal monthlycontributions are made by the Company and the employees to the fund at the rate of 10% of basic salary.
Provisions are made annually to cover the obligation for accumulating compensated absences and are charged toprofit.
All financial assets and liabilities are initially measured at cost, which is the fair value of the consideration given andreceived respectively. These financial assets and liabilities are subsequently measured at fair value or cost, as thecase may be. Financial assets and financial liabilities are recognized when the Company becomes a party to thecontractual provisions of the instrument. The particular measurement methods adopted are disclosed in theindividual policy statements associated with each item.
Financial assets are de-recognized when the Company loses control of contractual rights that comprise thefinancial asset. Whereas financial liabilities are de-recognized when the obligation specified in the contract isdischarged, cancelled, or expires.
These are initially recorded at fair value on the date a derivative contract is entered into and are subsequently re-measured to fair value at subsequent reporting dates. The method of recognizing the resulting gain or loss dependson whether the derivative is designated as a hedging instrument, and if so, the nature of the item being hedged. TheCompany designates certain derivatives as cash flow hedge. Derivatives are carried as assets when the fair value ispositive and as liabilities when the fair value is negative. Any gains or losses arising from changes in the fair value ofderivatives that do not qualify for hedge accounting are recorded in the profit and loss account for the year.
At the inception of a hedge relationship, the Company formally designates and documents the hedge relationship towhich the Company wishes to apply hedge accounting. Such hedges are expected to be highly effective inachieving the task of offsetting changes in fair values or cash flows and are assessed on an ongoing basis to
Current
Deferred
3.4 Employee benefitsDefined benefit plan
Defined contribution plan
Compensated absences
3.5 Financial instruments
Derivative financial instruments and hedging activities

29
determine that they have been highly effective throughout the financial reporting period for which they weredesignated.
For the purposes of hedge accounting, cash flow hedges refer to hedges against exposure to variability in cashflows that is either attributable to a particular risk associated with a recognized asset or liability, a firm commitment,or a forecast transaction. In relation to cash flow hedges which meet the conditions for hedge accounting, theportion of the gain or loss on the hedging instrument that is determined to be an effective hedge is recognized inequity and the ineffective portion is recognized in the profit and loss account immediately.
Hedge accounting is discontinued when the hedging instrument expires or is sold, terminated or exercised, or nolonger qualifies for hedge accounting. At that point in time, any cumulative gain or loss on the hedging instrumentrecognized in equity is kept in equity until the forecast transactions occurs. If a hedged transaction is no longerexpected to occur, the net cumulative gain or loss recognized in equity is transferred to the profit and loss accountfor the year.
Borrowings are recognized initially at fair value, net of transaction costs incurred. Borrowings are subsequentlystated at amortized cost, any difference between the proceeds (net of transaction costs) and the redemption valueis recognized in the profit and loss account over the period of the borrowings using the effective interest method.
Borrowings are classified as current liabilities unless the company has an unconditional right to defer settlement ofthe liability for at least twelve months after the balance sheet date.
Liabilities for trade and other payable are carried at cost which is the fair value of the consideration to be paid in thefuture for the goods and / or services received, whether or not billed to the Company.
Property, plant and equipment except land and capital work in progress are stated at cost less accumulateddepreciation. Land and capital work in progress are stated at cost. Cost of certain fixed assets consists of historicalcost and directly attributable cost of bringing the assets to working condition.
Depreciation on property, plant and equipment except for items mentioned below is charged by applying reducingbalance method.
- building of white cement and new grey cement line is charged by applying straight line method.- plant and machinery of white and new grey cement line is charged by applying unit of production method.- power plant building and machinery is charged by applying straight line method.
Depreciation rates are given in note 15.
Depreciation is charged from the month in which assets are put to use upto the month before the disposal of asset.
The depreciation method, assets residual values and useful lives are reviewed at each financial year end, andadjusted if impact on depreciation is significant.
The Company assesses at each balance sheet date whether there is any indication that property, plant andequipment may be impaired. If such indication exists, the carrying amounts of such assets are reviewed to assesswhether they are recorded in excess of their recoverable amounts. Where carrying value exceeds recoverableamount, assets are written down to the recoverable amount.
Normal repairs and maintenance are charged to profit & loss account as and when incurred. Major improvementsand modifications are capitalized and the assets so replaced, if any, are retired.
Profit or loss on disposal of operating fixed assets represented by the difference between the sale proceeds and thecarrying amount of the asset is included in profit & loss account.
Assets subject to finance lease are stated at the lower of present value of minimum lease payments under the lease
3.6 Borrowings
3.7 Trade and other payables
3.8 Property, plant and equipment
3.9 Leases

30
agreements and the fair value of the assets at the inception of the lease. The related rental obligations, net of financecost, are included in liabilities against assets subject to finance lease. The liabilities are classified as current andlong term depending upon the timing of the payment.
Assets acquired under a finance lease are depreciated over the estimated useful life of the assets on reducingbalance method. Depreciation of leased assets is charged to profit & loss account.
Depreciation methods, residual values and the useful lives of the assets are reviewed at least at each financial year-end and adjusted if impact of depreciation is significant.
Depreciation on additions to leased assets is charged from the month in which an asset is acquired while nodepreciation is charged for the month in which the asset is disposed off.
Costs that are directly associated with identifiable and unique software products controlled by the Company andwhich will probably generate economic benefits beyond one year are recognized as intangible assets. Expenditureswhich enhance or extend the performance of computer software programs beyond their original specifications arecapitalized and added to the original cost of the software.
Computer software costs recognized as intangible assets are amortized using the straight-line method over aperiod of five years.
Other costs associated with developing and maintaining computer software programs are recognized as anexpense as incurred.
Usable stores and spares are valued principally at moving average cost, while items considered obsolete arecarried at nil value. Items in transit are valued at cost comprising invoice plus other charges paid thereon.
Stock in trade is valued at lower of weighted average cost and estimated NRV except for goods in transit which arestated at cost.
Cost signifies in relation to:
Raw and packing material Purchased cost on average basis
Finished goods and work in process Cost of direct material, labor and proportion ofmanufacturing overheads.
Stock in transit Invoice value plus other charges paid thereon
Net realizable value signifies the estimated selling prices in the ordinary course of business less estimated costs ofcompletion and the estimated cost necessary to make a sale.
Trade debts are carried at original invoice amount less an estimate made for doubtful debts based on a review of alloutstanding amounts at the year end. Bad debts are written off when identified.
Investments which are intended to be held for an indefinite period of time but may be sold in response to the needfor liquidity are classified as available for sale. Available for sale investments are recognized initially at fair valueplus any directly attributable transaction costs. After initial recognition, these are stated at fair values unless fairvalues can not be measured reliably, with any resulting gains and losses being taken directly to equity until theinvestment is disposed off or impaired. At each reporting date, these investments are remeasured at fair value,unless fair value cannot be reliably measured. At the time of disposal, the respective surplus or deficit is transferred
3.10 Intangible assets
3.11 Stores, spares and loose tools
3.12 Stock in trade
3.13 Trade debts
3.14 Investments
Available for sale

31
to profit and loss account. Fair value of quoted investments is their bid price on Karachi Stock Exchange at thebalance sheet date. Unquoted investments, where active market does not exist, are carried at cost as it is notpossible to apply any other valuation methodology.
Investments intended to be held for less than twelve months from the balance sheet date or to be sold to raiseoperating capital, are included in current assets, all other investments are classified as non-current. Managementdetermines the appropriate classification of its investments at the time of the purchase and re-evaluates suchdesignation on a regular basis.
All purchases and sales of investments are recognized on the trade date which is the date that the companycommits to purchase or sell the investment.
At subsequent reporting dates, the company reviews the carrying amounts of the investments to assess whetherthere is any indication that such investments have suffered an impairment loss. If any such indication exists, therecoverable amount is estimated in order to determine the extent of the impairment loss, if any. Impairment lossesare recognized as expense. Where an impairment loss subsequently reverses, the carrying amount of theinvestment is increased to the revised recoverable amount.
A financial asset and financial liability is set off and the net amount is reported in the balance sheet if the Companyhas legally enforceable right to set-off the recognised amounts and intends either to settle on a net basis or to realizethe asset and liability simultaneously.
Cash and cash equivalents are carried in the balance sheet at cost. For the purpose of cash flow statement, cashand cash equivalent comprises of cash in hand, balances with banks and short term running finances. In thebalance sheet, short term running finances are included in the current liabilities.
Revenue represents the fair value of the consideration received or receivable for goods sold, net of discounts andsales tax. Revenue is recognized when it is probable that the economic benefits associated with the transaction willflow to the Company and the amount of revenue, and the associated cost incurred, or to be incurred, can bemeasured reliably.
Revenue from sale of goods is recognised when the significant risks and rewards of ownership of the goods aretransferred to buyer i.e. on the dispatch of goods to the customers. Return on deposits is accrued on a timeproportion basis by reference to the principal outstanding and the applicable rate of return.
Assets and liabilities in foreign currencies are translated into Pak rupees at exchange rates prevailing at the balancesheet date. Transactions in foreign currencies are translated into rupees at spot rate. The Company charges allexchange differences to profit and loss account.
Borrowings and other related costs directly attributable to the acquisition, construction or production of qualifyingassets, which are assets that necessarily take substantial period of time to get ready for their intended use, areadded to the cost of those assets, until such time as the assets are ready for their intended use. All other borrowingcosts are recognised as an expense in the period in which they are incurred.
Provisions are recognized when the Company has a present legal or constructive obligation as a result of pastevents and it is probable that an outflow of resources embodying economic benefits will be required to settle theobligation and a reliable estimate of the amount can be made. However, provisions are reviewed at each balancesheet date and adjusted to reflect current best estimate.
Dividend distribution to the Company's shareholders is recognized as a liability in the period in which it is approved.
3.15 Off setting of financial assets and liabilities
3.16 Cash and cash equivalents
3.17 Revenue recognition
3.18 Foreign currency translation
3.19 Borrowing costs
3.20 Provisions
3.21 Dividend

32
5 ReservesCapital Reserves
Revenue reserves
5.1
5.2
5.3
6 Long term finances - secured
6.1
6.2
49,704,9512,831,900
-
52,536,851
70,000,000
122,536,851
2012Rupees
-755,000,000
900,000,000
1,655,000,000
492,300,000
1,162,700,000
- Share premium 5.1 49,704,951- Fair value reserve 5.2 15,987,900- Hedging reserve 5.3 (6,283,842)
59,409,009
- General reserves 70,000,000
129,409,009
This reserve can be utilized by the Company only for the purpose specified in section 83(2) of the CompaniesOrdinance, 1984.
This represents fair value adjustment on revaluation of available for sale investments.
As referred in note 9, this represents the effect of change in fair value of cross currency swap as at balance sheetdate and is net of deferred tax impact amounting to Rs. Nil (2011: Rs. 54.490 million).
Limit 2011Note (Rupees in Rupees
million)
Standard Chartered Bank (Pakistan) Limited 6.1 108.5 62,600,000Redeemable capital - Sukuk Certificates 6.2 2,500 2,414,320,000Consortium of financial institutions led by
Standard Chartered Bank (Pakistan) Limited 6.3 1,140 1,100,000,000
3,576,920,000Less: Current maturity shown under
current liabilities 40,050,000
3,536,870,000
The facility was fully paid during the period.
This facility is re-profiled on 16 December 2011 effective from 20 June 2011. According to the revised terms, fourquarterly installments starting 20 September 2011 and ending on 20 June 2012 aggregating to Rs. 760 millionhave been adjusted towards repayment of principal only and further the Company has also prepaid Rs. 900 millionon account of principal payments by exercising call option as allowed by the amended Trust Deed. Now theoutstanding facility as of the balance sheet date is due in eight quarterly installments commencing 20 September2012. Mark up rate has also been reduced from 3-month KIBOR + 1.8% p.a. to 3-month KIBOR + 1.5% p.a.
4 Issued, subscribed and paid up capital
207,495,850
112,300,000
967,776,560
1,287,572,410
20,749,585 (2011: 20,749,585) ordinary shares of Rs. 10each fully paid-up in cash 207,495,850
11,230,000 (2011: 11,230,000) ordinary shares of Rs. 10 eachissued against consideration other than cash 112,300,000
96,777,656 (2011: 96,777,656) ordinary shares of Rs. 10each issued as bonus shares 967,776,560
128,757,241 1,287,572,410
34,438 (2011: 34,438) ordinary shares of the Company are heldby Tariq Motors (Private) Limited - related party.
2012Rupees
2011RupeesNote

33
Moreover, mark-up amounting to Rs. 263.801 million for the said period along with outstanding mark-up of Rs.401.228 million as of 20 June 2011 have been deferred. This aggregate deferred mark-up of Rs. 665.029 millionoutstanding as of balance sheet date is repayable in eight quarterly installments commencing from 20 September2014 and ending on 20 June 2016. All mark-up payments are payable on quarterly basis.
The facility is secured by way of first joint pari passu hypothecation/equitable mortgage charge over all present andfuture fixed assets and immovable properties of the Company to the extent of Rs. 3,334 million (2011: Rs. 3,334million).
The facility was re-scheduled on 22 February 2011. As per revised terms, a grace period of three years starting
December 2009 has been allowed in principal payments. Principal amount will now be repaid by June 2016 in 15
quarterly installments starting December 2012. Mark up is charged at the rate of three months KIBOR plus 1.8%
(2011: three month KIBOR plus 1.8%) payable quarterly in arrears. Payment of outstanding mark-up of Rs. 81.126
million as of 20 December 2009 has been deferred and further company has been allowed to make partial
payments against the quarterly mark-up payments due for the period March 2010 to September 2011. Out of total
deferred mark-up of Rs. 223.827 million as at 30 June 2012, Rs. 63 million is due within next financial year
whereas balance deferred markup of Rs. 160.827 million is repayable in twelve quarterly installments. All mark-up
payments are payable on quarterly basis. The facility is secured by way of first joint pari passu hypothecation/
equitable mortgage charge over all present and future fixed assets and immovable properties of the Company to
the extent of Rs. 1,520 million (2011: Rs. 1,520 million).
Security deposits - interest freeFrom cement dealers 7.1 1,711,100From cement transporters 7.2 400,000
2,111,100
Retention money - interest free 7.3 161,545,729
163,656,829
These deposits are repayable on the termination of the relationship and are being utilized by the Company in
accordance with the terms of the contract.
These deposits are held for providing guarantee of safe delivery of cement to customers. These are being utilized by
the Company in accordance with the terms of the contract.
These amounts have been retained from the invoices / bills of the expansion project's suppliers / contractors and
are repayable after one year from the satisfactory fulfillment of terms and conditions of the supply / services
contracts. This includes Rs 158.674 million (2011: 150.826 million) equivalent to USD 1,240,000 and Euro
353,300 (2011: USD 1,240,000 and Euro 353,300) retained from invoices of TCDRI, plant supplier as per terms of
the agreement. (also refer note 24.3)
Deferred taxation 8.1 2,750,638Staff retirement benefits 8.2 6,730,932Compensated absences 8.3 2,120,361Deferred mark-up payments 11 311,496,045
323,097,976
6.3
7 Long term security deposits and retention money
7.1
7.2
7.3
8 Deferred liabilities
1,661,100400,000
2,061,100
163,674,053
165,735,153
334,220,989-
5,614,085888,856,112
1,228,691,186
2012Rupees
2011RupeesNote
2012Rupees
2011RupeesNote

34
Liability as at 30 June
Liability as at 30 June
The liability for deferred taxation comprises oftemporary differences relating to:
Accelerated tax depreciation 1,222,466,219Minimum tax paid under section 113 -Unrealized loss on derivative financial instrument (50,490,186)Unused tax losses (1,169,225,395)
2,750,638
Defined benefit plan funded - Gratuity 8.2.1 6,730,932
Amount recognized in the balance sheet is as follows:
Present value of defined benefit obligation 8.2.2 11,319,105Benefits payable to outgoing members 218,080Fair value of plan assets 8.2.3 (4,806,253)Un-recognized actuarial losses 8.2.5 -
6,730,932
Net liability as at 01 July 4,344,715Charge to profit and loss account 8.2.4 3,181,557Contribution by the Company (795,340)Fair value of Planned assets realized -
6,730,932
Present value of defined benefit obligation as at 01 July 9,012,400Current service cost 1,103,543Interest cost 1,081,488Loss on settlement of defined benefit plan 116,870Benefit payments due, but not paid (76,270)Benefits paid during the year (144,020)Actuarial loss on present value of defined benefit obligation 225,094
Present value of defined benefit obligation as at 30 June 11,319,105
Fair value of plan assets as at 01 July 4,579,881Loss realized on plan assets -Expected return on plan assets 261,000Contribution paid during the year 789,840Benefits paid during the year (789,840)Actuarial (loss) / gain on plan assets (34,628)Fair value of planned assets (realized) -
Fair value of plan assets as at 30 June 4,806,253
Plan assets consist of the following:Term deposit - The Bank of Khyber 4,350,000Cash at Bank 456,253
4,806,253
Current service cost 1,103,543Interest cost 1,081,488Expected return on plan assets (261,000)Loss realized on plan assets -Loss on settlement of defined benefit plan 116,870Actuarial loss recognized on settlement of plan 1,140,656
3,181,557
8.1 Deferred taxation
8.2 Staff retirement benefits
8.2.1Defined benefit plan funded - Gratuity
8.2.2Movement in liability for defined benefit obligation
8.2.3Movement in fair value of plan assets
8.2.4Charge to profit and loss account
1,232,130,719(128,363,458)
-(769,546,272)
334,220,989
-
----
-
6,730,9328,684,042
(20,077,425)4,662,451
-
11,319,105--
8,540,240-
(19,859,345)-
-
4,806,253(143,802)
----
(4,662,451)
-
--
-
---
143,8028,540,240
-
8,684,042
2012Rupees
2011RupeesNote

35
Un recognized actuarial losses as at 30 June
Deficit in the plan
Un-recognized actuarial losses as at 01 July 880,934
Actuarial loss arising during the year 259,722
Actuarial losses charged to profit during the
year on settlement of plan (1,140,656)
-
Actual return on plan assets of funded gratuity scheme
was nil. (2011: Rs. 0.456 million).
2011 2010 2009 2008
Rupees Rupees Rupees Rupees
Present value of
defined benefit
obligation 11,319,105 9,012,400 9,791,602 8,535,002
Fair value of plan
assets (4,806,253) (4,579,881) (4,175,907) (3,726,968)
6,512,852 4,432,519 5,615,695 4,808,034
Experience
adjustment arising
on plan liabilities 225,094 (807,901) 57,046 (837,542)
Experience
adjustment arising
on plan assets 34,628 (97,135) 1,703 (1,893,335)
2011
% per annum
Discount rate N/A
Expected rate of return on plan assets N/A
Expected rate of increase in salary N/A
2011
Rupees
Balance as at 01 July 1,851,606
Expense recognized during the year 677,954
Payments made during the year (409,199)
Balance as at 30 June 2,120,361
8.2.5Movement in un-recognized actuarial losses
8.2.6
8.2.7Historical information
8.2.8Assumptions used for valuation of the defined benefit scheme for employees are as under:
8.3 Compensated absences
-
-
-
-
2012
Rupees
-
-
-
-
-
2012
% per annum
N/A
N/A
N/A
2012
Rupees
2,120,361
4,172,196
(678,472)
5,614,085
2012Rupees
2011RupeesNote

36
9 Derivative financial liabilities
9.1
10 Trade and other payables
10.1
2012Company Company Notional Fairreceives pays Amount Value
Rupees Rupees
Cross Currency Swap 9.1 - - - - -Exchange USD 8.4 million
2012Rupees
504,783,23414,817,909
211,659,019113,814,036107,176,672
1,550,405
953,801,275
1,754,78946,983,16861,614,50043,134,973
153,487,430
5,349,1851,660,026
32,725,686
39,734,897
1,147,023,602
Note
The Company had entered into an interest rate cross currency swap agreement with Standard Chartered Bank (Pakistan)Limited, repriced semi-annually, to hedge the possible adverse movements in KIBOR being charged on its long termfinances detailed as under:
2011Company Company Notional Fairreceives pays Amount Value
Rupees Rupees
Cross Currency SwapExchange USD 8.4 million 6 months
6 month LIBOR plus SeptemberKIBOR 1.25% 2012 500,000,000 187,420,429
The cross currency swap agreement with Standard Chartered Bank (Pakistan) Limited has been unwound beforematurity for USD 2.7 million equivalent to Rs. 247.194 million by the company in May, 2012.
2011Note Rupees
Trade Creditors 10.1 551,857,844Contractors' bills payable 10,436,016Accrued liabilities 173,973,827Advances from cement customers 35,106,208Workers' profit participation fund 10.2 6,620,043Workers' welfare fund 1,550,405
779,544,343Payable to Government on account of:
Income tax deducted at source 7,499,433Sales Tax payable 18,914,132Excise duty 92,708,497Royalty and excise duty 32,100,888
151,222,950
Securities and retention money payable 10.3 22,449,274Unclaimed dividend 1,660,026Other payables 18,751,934
42,861,234
973,628,527
Trade creditors do not include any amount due to related parties (2011: Rs. Nil).
Maturity
Maturity

37
Balance as at 01 July -Allocation for the year 30 6,620,043Interest accrued 32 -
6,620,043
Paid during the year -
Balance as at 30 June 6,620,043
This represents interest free security deposits and retentionmoney received from contractors and are repayable aftersatisfactory completion of contracts.
Long term finances 696,948,087Deferred mark-up payments 11.1 (311,496,045)
385,452,042
Short term borrowings 47,689,439Liabilities against assets subject to finance lease 40,689
433,182,170
This includes deferred markup amounting Rs. 665.029million (2011: Rs. 52.140 million) and Rs. 223.827 million(2011: Rs. 259.356 million) relating to Sukuk certificates(refer to note 6.2) and debt from Consortium of financialinstitutions led by Standard Chartered Bank (Pakistan)Limited (refer to note 6.3) respectively.
Short term running finances 12.1 762,856,418Import finances 12.2 202,822,355Export refinance 12.3 398,000,000
1,363,678,773
Limit(Rupees in 2011
million) Note Rupees
The Bank of Khyber 165 12.1.1 163,794,820KASB Bank Limited 100 12.1.2 99,175,980Askari Bank Limited 300 12.1.3 299,894,203Soneri Bank Limited 200 12.1.4 199,991,415
762,856,418
10.2 Workers' profit participation fund
10.3 Security and retention money
11 Interest and markup accrued
11.1
12 Short term borrowings - secured
12.1 Short term running finances
6,620,043107,176,672
372,377
114,169,092
6,992,420
107,176,672
958,655,877(888,856,112)
69,799,765
29,214,877-
99,014,642
562,957,469-
598,000,000
1,160,957,469
2012Rupees
161,800,40199,872,839
301,284,229-
562,957,469
2012Rupees
2011RupeesNote
38
The finance carries mark up at three months KIBOR plus 3% (2011: three months KIBOR plus 3%) payablequarterly. The facility is secured by way of first joint pari passu hypothecation charge of Rs. 80 million (2011: Rs.80 million) on Company's present and future current assets, first joint pari passu charge of Rs. 153.846 million(2011: Rs. 153.846 million) on Company's existing and future fixed assets duly registered with SECP and personalguarantees of two directors of the Company.
The finance carries mark up at three months KIBOR plus 2.5% (2011: three months KIBOR plus 2.5%), payablequarterly. The facility is secured by way of first joint pari passu hypothecation charge over current assets of theCompany of Rs. 267 million (2011: Rs. 267 million) and personal guarantees of four directors of the Company.
The finance carries mark up at three months KIBOR plus 2.5% (2011: three months KIBOR plus 2.5%), payablequarterly. The facility is secured by way of first joint pari passu hypothecation charge over current assets of theCompany of Rs. 400 million (2011: Rs. 400 million), ranking charge on all present and future fixed assets of theCompany of Rs. 162.67 million (2011: 162.67 million), equitable mortgage over immovable properties ofassociated companies to the extent of Rs. 400 million (2011: Rs. 400 million) and personal guarantees of fourdirectors of the Company.
This facility is fully adjusted during the period.
These finances are fully paid off during the period.
2011Note Rupees
Standard Chartered Bank (Pakistan) Limited 12.3.1 398,000,000Soneri Bank Limited 12.3.2 -
398,000,000
This facility is obtained from Standard Chartered Bank (Pakistan) Limited, which carries mark-up at SBP rate plus1% per annum (2011: SBP rate plus 1%). The facility is for a period of 180 days and can be rolled over for a furtherperiod of 180 days. It is secured against first joint pari passu charge on all present and future current assets of theCompany of Rs. 315 million (2011: Rs. 315 million) and personal guarantees of all Directors of the Company.
This facility is obtained from Soneri Bank Limited, which carries mark-up at SBP rate plus 1%. The facility is for aperiod of 180 days and can be rolled over for a further period of 180 days. It is secured against first joint pari passucharge on current assets of the Company including inventory/receivables to the extent of Rs. 267 million.
2011Note Rupees
Long term finances 6 40,050,000
40,050,000
12.1.1
12.1.2
12.1.3
12.1.4
12.2
12.3 Export refinance
12.3.1
12.3.2
13 Current portion of non-current liabilities
2012Rupees
398,000,000200,000,000
598,000,000
2012Rupees
492,300,000
492,300,000

39
14 Contingencies and commitments
14.1 Contingencies(i)
(ii)
(iii)
(iv)
(v)
The Engineering Services International (Pakistan) Limited raised a claim of Rs 5,449,000 (2011: Rs5,449,000) against the Company on account of Mechanical Installation/Erection. A counter claim ofRs 1,307,962 (2011: Rs 1,307,962) was lodged by the Company. The case is pending with theSenior Civil Judge, Lahore. The management of the Company expects a favorable outcome of the case;therefore, no provision has been made in the financial statements.
The State Cement Corporation of Pakistan (Private) Limited, the previous sole owner of the Company,raised a claim of Rs 5,640,000 (2011: Rs 5,640,000) against the Company on account of the interimdividend pertaining to the year ended 30 June 1993 declared by the previous Board of Directors. Thesubsequent Board of Directors rescinded the declaration of interim dividend on various grounds. Thematter is pending for arbitration before Honorable Lahore High Court.
The Company has initiated proceedings for the recovery of Rs. 14,100,000 (2011: Rs. 14,100,000)being an interim dividend pertaining to the year ended 30 June 1992 paid by the previous managementto the State Cement Corporation of Pakistan (Private) Limited. The said dividend has been rescinded bythe Board and rescission confirmed at the Annual General Meeting. As a consequence, the Companyhas withheld Rs. 14,100,000 (2011: Rs. 14,100,000) interim dividend pertaining to the period ended31 December 1994 payable to the State Cement Corporation of Pakistan (Private) Limited. Intimationshave been made to the State Cement Corporation of Pakistan (Private) Limited and the Securities andExchange Commission of Pakistan. This amount has been withheld on legal advice obtained from thecorporate lawyers. Currently the matter is pending for arbitration with the Secretary of Finance,Government of Pakistan.
The Competition Commission of Pakistan (CCP) took suo moto action under Competition Ordinance,2007 and issued Show Cause Notice on 28 October 2008 inquiring for increase in prices of cementacross the country. The similar notice were also issued to All Pakistan Cement ManufacturerAssociation (APCMA) and its member cement manufacturers. The Company has filed Writ Petition inLahore High Court (LHC), vide its order dated 24 August 2009 LHC allowed the CCP to issue its finalorder. The CCP accordingly passed an order on 28 August 2009 and imposed a penalty of Rs. 103million on the Company. The Lahore High Court vide its order dated 31 August 2009 restricted the CCPfrom enforcing its order against the Company for the time being.
The vires of the Competition Commission of Pakistan, 2007 have been challenged by a number ofpetitioners and all have been advised by their legal counsel that prima facie the CompetitionCommission Ordinance, 2007 is ultra vires the Constitution. A large number of grounds have beenraised by these petitioners and the matter is currently being adjudicated by the Lahore High Court,Sindh High Court and Supreme Court of Pakistan. In all these cases stay orders have been granted bythe Courts. Based on the legal opinion, management is confident that the Company has a good caseand there are reasonable chances of success in the pending petition in the Supreme Court of Pakistan.
Guarantees issued by Commercial Banks on behalf of the Company are of Rs. 118.730 million (2011:Rs. 118.730 million) in favor of Sui Northern Gas Pipelines Limited (SNGPL) in accordance with theterms of agreement between the Company and SNGPL and Rs. 1.68 million (2011: Rs. 1.68 million) infavor of government institutions for supply of cement.
An application has been filed by some shareholders and one director of the Company before theSecurities and Exchange Commission of Pakistan (the "Commission") praying for investigation into theaffairs of the Company and the Commission has issued a show cause notice dated 27 July 2011, to theCompany and all its directors. Responding to the notice, the management has strongly denied all thebaseless, false and frivolous allegations leveled in the application and has further challenged the saidnotice before the Honorable Lahore High Court, Lahore (LHC). The LHC has stayed the proceedings tillthe next date of hearing. As per legal counsel of the Company, the application has no financial exposureto the Company.

40
Peshawar Electric Supply Company (PESCO) has charged an amount of Rs. 48.419 million as arrearson account of fuel price adjustment in the electricity bills of January 2012 and February 2012pertaining to the period January 2011 to May 2011. The Company has challenged this levy in thehonorable Islamabad High Court whereby a stay has been granted in its favor. Furthermore, fuel priceadjustment for the period June 2011 to June 2012 has not been billed by PESCO. Based on the opnionof the legal council the management is hopeful for a favorable outcome, therefore no provision againstthe above demand has been made in these financial statements.
Further Peshawar Electric Supply Company (PESCO) has issued electricity bills with an increased EQSurcharge from 2% to 4% amounting to Rs. 12.826 million from December 2011 to May 2012. TheCompany has challenged this levy in the honorable Islamabad High Court whereby a stay has beengranted in its favor. As the management is hopeful for a favorable outcome, therefore no provisionagainst the above demand has been made in these financial statements.
The Appellate Tribunal Inland Revenue (ATIR) while disposing of the Company's appeal against theorder passed by the Taxation Officer (TO) pertaining to the assessment year 1995-96, set aside theorder of TO and the TO while giving effect to the order of ATIR levied additional tax of Rs. 7.8 millionunder section 89 of the Income Tax Ordinance, 1979. The Commissioner of Inland Revenue (Appeals)has turned down the appeal filed by the Company against the aforesaid order. However, themanagement disputes the ATIR as well as CIR (Appeals) decision and has filed a reference applicationwith the Honorable High Court, Lahore against the order of ATIR and has also filed appeal with ATIRagainst order of CIR (Appeals) which are pending adjudication.
The Additional Commissioner of Inland Revenue (ACIR) while amending assessment under section122 (5A) of the Income Tax Ordinance, 2001 related to tax year 2005, has created a demand of Rs.14.76 million, by making various profit and loss account additions and changing the basis forapportionment of expenses between normal and presumptive tax regime. The Company has filed anappeal before Commissioner of Inland Revenue (Appeals), which is pending adjudication.
The DCIR has created a demand of Rs. 13.76 million by passing an Ex-parte order under section 221 ofthe Income Tax Ordinance, 2001 for tax year 2010 which is against the explicit provisions of section113 of the Income Tax Ordinance, 2001. The Company being aggrieved has filed an appeal beforeCommissioner Inland Revenue (Appeals) which was decided against the Company. The Company hasfiled an appeal before Appellate Tribunal Inland Revenue which is pending adjudicated.
Company is contingently liable for Rs. 9.18 million along with default surcharge of Rs. 3.72 on accountof alleged inadmissible adjustment of input sales tax in contravention of SRO 389(I)/2006 dated 27April 2006. Based on legal opinion management of the Company is hopeful for a favorable outcome ofthis appeal. Refer to note 24.2.1
Company is contingently liable for an amount of Rs. 68.332 million charged by Customs Departmentby increasing the value of consignment of plant and machinery imported by the Company during 2008.Company has filed petition before Honorable Sindh High Court and is hopeful for a favorable outcomeof this petition. Refer to note 24.2.2
Company is contingently liable for input tax claims and Federal Excise Duty Claims made by FederalBoard of Revenue amounting to Rs. 12.716 million and Rs. 14.022 million respectively. The Companyhas filed an appeal against order passed by department, which is pending adjudication. Refer to note24.2.3.
2011Rupees
78,603,606In respect of :
Letters of credit other than capital expenditure
(vi)
(vii)
(viii)
(ix)
(x)
(xi)
(xii)
14.2 Commitments
2012Rupees
51,376,410

41
15
Pro
per
ty, pla
nt
and e
quip
men
t
15.1
Rec
onci
liati
on o
f net
boo
k va
lue
Cos
t
as
at
30 J
une
2011
Addit
ions
/
* A
dju
stm
ents
Transf
ers
Dis
pos
als
Cos
t
as
at
30 J
une
2012
Acc
um
ula
ted
dep
reci
ati
on
as
at
30 J
une
2011
Dep
reci
ati
on
charg
e /
* A
dju
stm
ents
Dis
pos
al
Transf
ers
Acc
um
ula
ted
dep
reci
ati
on
as
at
30 J
une
2012
Net
boo
k va
lue
as
at
30 J
une
2012
Dep
reci
ati
on r
ate
(% p
er a
nnum
)
Ow
ned
Free
hold
land
35,1
71,1
58
--
-35,1
71,1
58
--
--
-35,1
71,1
58
-
Fact
ory
build
ing
2,7
58,3
60,9
23
--
-2,7
53,7
04,5
10
470,9
26,6
38
121,2
22,2
38
--
592,1
48,8
76
2,1
62,0
07,8
80
5%
**
(4,6
56,4
13)
--
(452,2
46)
--
(452,2
46)
Off
ice
and
othe
r bu
ildin
g42,1
67,5
29
--
-42,1
67,5
29
13,5
66,7
63
1,4
30,0
38
--
14,9
96,8
01
27,1
70,7
28
5%
Hou
sing
col
ony
48,1
08,9
04
--
-48,1
08,9
04
28,3
70,7
82
986,9
06
--
29,3
57,6
88
18,7
51,2
16
5%
Pla
nt,
mac
hine
ry a
nd e
quip
men
t6,1
41,8
94,6
05
8,2
25,7
55
(15,6
67,2
87)
(3,9
72,0
00)
6,1
30,4
81,0
73
1,4
72,7
38,0
06
209,1
42,7
74
(3,2
45,5
17)
(1,9
81,0
68)
1,6
76,6
54,1
95
4,4
53,8
26,8
78
5%
/ u
nits
of
prod
uctio
n
Sto
rage
tan
ks a
nd p
ipel
ines
30,1
48,2
52
--
-30,1
48,2
52
16,6
66,1
97
1,3
48,2
06
--
18,0
14,4
03
12,1
33,8
49
10%
Pow
er in
stal
latio
ns96,7
82,5
24
--
-96,7
82,5
24
80,8
58,7
61
1,5
92,3
76
--
82,4
51,1
37
14,3
31,3
87
10%
Furn
iture
, fix
ture
s an
d ot
her
offic
e eq
uipm
ent
37,8
77,9
54
1,9
79,0
03
-(1
7,3
50)
39,8
39,6
07
19,2
64,1
99
1,9
98,8
58
(12,2
77)
-21,2
50,7
80
18,5
88,8
27
10%
Com
pute
r an
d pr
inte
rs14,2
97,7
70
3,1
58,8
31
--
17,4
56,6
01
8,8
21,2
53
2,0
84,7
06
--
10,9
05,9
59
6,5
50,6
42
30%
Wei
ghin
g sc
ale
5,7
89,0
15
51,0
00
--
5,8
40,0
15
2,2
76,3
99
355,0
95
--
2,6
31,4
94
3,2
08,5
21
10%
Ligh
t ve
hicl
es65,9
04,8
66
1,9
55,8
00
-(1
,902,5
00)
65,9
58,1
66
38,2
70,0
88
5,6
37,6
12
(1,6
80,6
12)
-42,2
27,0
88
23,7
31,0
78
20%
Hea
vy v
ehic
les
62,7
83,0
88
--
(2,1
56,0
00)
60,6
27,0
88
55,5
51,7
73
1,4
25,4
62
(1,6
35,9
54)
-55,3
41,2
81
5,2
85,8
07
20%
Rai
lway
sid
ings
9,8
53,4
76
--
-9,8
53,4
76
7,5
00,1
87
117,6
64
--
7,6
17,8
51
2,2
35,6
25
5%
Labo
rato
ry e
quip
men
ts24,3
45,8
60
1,0
49,6
64
--
25,3
95,5
24
17,8
48,3
93
660,5
14
--
18,5
08,9
07
6,8
86,6
17
10%
Libr
ary
book
s94,2
17
--
-94,2
17
79,7
94
1,4
42
--
81,2
36
12,9
81
10%
9,3
73,5
80,1
41
11,7
63,6
40
(15,6
67,2
87)
(8,0
47,8
50)
9,3
61,6
28,6
44
2,2
32,7
39,2
33
347,5
51,6
45
(6,5
74,3
60)
(1,9
81,0
68)
2,5
71,7
35,4
50
6,7
89,8
93,1
94
Leas
ed
Hea
vy v
ehic
les
--
--
--
--
--
-20%
2012
9,3
73,5
80,1
41
11,7
63,6
40
(15,6
67,2
87)
(8,0
47,8
50)
9,3
61,6
28,6
44
2,2
32,7
39,2
33
347,5
51,6
45
(6,5
74,3
60)
(1,9
81,0
68)
2,5
71,7
35,4
50
6,7
89,8
93,1
94
Cos
t
t 30 J
2010
Addit
ions
Transf
ers
Dis
pos
als
Cos
t
t 30 J
2011
Acc
um
ula
ted
dep
reci
ati
onD
epre
ciati
on
hD
ispos
al
Transf
ers
Acc
um
ula
ted
dep
reci
ati
onN
et b
ook
valu
e
t 30 J
2011
Dep
reci
ati
on r
ate
(%)
Cos
t
(---
----
----
----
----
----
----
----
----
----
----
--R
upee
s---
----
----
----
----
----
----
----
----
----
----
--)
(--
----
----
----
----
----
---
----
----
----
----
----
----
----
----
Rupee
s---
----
----
----
----
----
----
----
----
----
----
----
----
----
--)
Cos
t
Dep
reci
ati
on
Dep
reci
ati
on
as
at
30 J
une
2010
Addit
ions
Transf
ers
Dis
pos
als
as
at
30 J
une
2011
dep
reci
ati
on
as
at
30 J
une
2010
charg
eD
ispos
al
Transf
ers
dep
reci
ati
on
as
at
30 J
une
2011
as
at
30 J
une
2011
(% p
er a
nnum
)
Ow
ned
Free
hold
land
35,1
71,1
58
--
-35,1
71,1
58
--
--
-35,1
71,1
58
-
Fact
ory
build
ing
2,4
29,4
96,4
22
328,8
64,5
01
--
2,7
58,3
60,9
23
351,3
58,9
78
119,5
67,6
60
--
470,9
26,6
38
2,2
87,4
34,2
85
5%
Off
ice
and
othe
r bu
ildin
g41,9
39,0
89
228,4
40
--
42,1
67,5
29
12,0
61,4
60
1,5
05,3
03
--
13,5
66,7
63
28,6
00,7
66
5%
Hou
sing
col
ony
48,1
08,9
04
--
-48,1
08,9
04
27,3
31,9
33
1,0
38,8
49
--
28,3
70,7
82
19,7
38,1
22
5%
Pla
nt,
mac
hine
ry a
nd e
quip
men
t5,4
09,7
94,8
67
732,7
58,2
68
-(6
58,5
30)
6,1
41,8
94,6
05
1,2
99,7
53,9
26
173,1
88,2
47
(204,1
67)
-1,4
72,7
38,0
06
4,6
69,1
56,5
99
5%
/ u
nits
of
prod
uctio
n
Sto
rage
tan
ks a
nd p
ipel
ines
17,1
87,0
50
12,9
61,2
02
--
30,1
48,2
52
16,1
28,2
80
537,9
17
--
16,6
66,1
97
13,4
82,0
55
10%
Pow
er in
stal
latio
ns96,0
40,1
24
742,4
00
--
96,7
82,5
24
79,1
61,4
63
1,6
97,2
98
--
80,8
58,7
61
15,9
23,7
63
10%
Furn
iture
, fix
ture
s an
d ot
her
offic
e eq
uipm
ent
35,6
29,5
96
2,2
48,3
58
--
37,8
77,9
54
17,2
98,0
86
1,9
66,1
13
--
19,2
64,1
99
18,6
13,7
55
10%
Com
pute
r an
d pr
inte
rs11,4
92,6
94
2,8
05,0
76
--
14,2
97,7
70
7,1
39,1
21
1,6
82,1
32
--
8,8
21,2
53
5,4
76,5
17
30%
Wei
ghin
g sc
ale
5,7
89,0
15
--
-5,7
89,0
15
1,8
86,1
08
390,2
91
--
2,2
76,3
99
3,5
12,6
16
10%
Ligh
t ve
hicl
es67,4
64,0
93
5,7
13,2
01
-(7
,272,4
28)
65,9
04,8
66
37,1
26,7
84
6,1
63,3
73
(5,0
20,0
69)
-38,2
70,0
88
27,6
34,7
78
20%
Hea
vy v
ehic
les
98,7
23,3
47
155,4
40
5,5
00,0
00
(41,5
95,6
99)
62,7
83,0
88
90,6
88,3
04
1,4
54,3
04
(39,5
09,5
01)
2,9
18,6
66
55,5
51,7
73
7,2
31,3
15
20%
Rai
lway
sid
ings
9,8
53,4
76
--
-9,8
53,4
76
7,3
76,3
30
123,8
57
--
7,5
00,1
87
2,3
53,2
89
5%
Labo
rato
ry e
quip
men
ts22,6
56,5
62
1,6
89,2
98
--
24,3
45,8
60
17,2
47,8
71
600,5
22
--
17,8
48,3
93
6,4
97,4
67
10%
Libr
ary
book
s94,2
17
--
-94,2
17
78,1
91
1,6
03
--
79,7
94
14,4
23
10%
8,3
29,4
40,6
14
1,0
88,1
66,1
84
5,5
00,0
00
(49,5
26,6
57)
9,3
73,5
80,1
41
1,9
64,6
36,8
35
309,9
17,4
69
(44,7
33,7
37)
2,9
18,6
66
2,2
32,7
39,2
33
7,1
40,8
40,9
08
Leas
ed
Hea
vy v
ehic
les
5,5
00,0
00
-(5
,500,0
00)
--
2,2
73,3
33
645,3
33
-(2
,918,6
66)
--
20%
2011
8,3
34,9
40,6
14
1,0
88,1
66,1
84
-(4
9,5
26,6
57)
9,3
73,5
80,1
41
1,9
66,9
10,1
68
310,5
62,8
02
(44,7
33,7
37)
-2,2
32,7
39,2
33
7,1
40,8
40,9
08
(---
----
----
----
----
----
----
----
----
----
----
--R
upee
s---
----
----
----
----
----
----
----
----
----
----
--)
(--
----
----
----
----
----
---
----
----
----
----
----
----
----
----
Rupee
s---
----
----
----
----
----
----
----
----
----
----
----
----
----
--)

42
2012
2011
Not
eR
upee
sR
upee
s
15.2
Dep
reci
atio
nch
arge
for
the
year
has
been
allo
cate
das
follo
ws:
Cos
t of g
oods
sold
2734
5,02
0,15
730
7,95
4,04
7
Selli
ngan
ddi
strib
utio
nex
pens
es28
691,
604
616,
837
Adm
inis
trativ
ean
dge
nera
l exp
ense
s29
1,83
9,88
41,
991,
919
347,
551,
645
310,
562,
803
15.3
Dis
posa
l of
oper
atin
gfi
xed
asse
ts
Acc
umul
ated
Boo
kS
ale
Pro
fit/(
loss
)
Par
ticul
ars
ofas
sets
Cos
tde
prec
iatio
nva
lue
proc
eeds
ondi
spos
alM
ode
ofdi
spos
alP
artic
ular
sof
purc
hase
r
Ligh
t Veh
icle
s
KIA
Cla
ssic
544,
000
470,
985
73,0
1525
0,00
017
6,98
5N
egot
iatio
nN
oush
adA
li
Kia
Cla
ssic
NG
V51
4,00
044
0,70
073
,300
250,
000
176,
700
Neg
otia
tion
Ch.
Ars
had
Meh
moo
d
Pla
ntan
dM
achi
nery
Air
com
pres
sors
351
300
02
813
145
699
855
750
000
5014
5A
uctio
nPi
rS
hary
ar
(---
----
----
----
----
----
----
----
----
----
----
---R
upee
s---
----
----
----
----
----
----
----
----
----
----
----
----
-)
Air
com
pres
sors
3,51
3,00
02,
813,
145
699,
855
750,
000
50,1
45A
uctio
nPi
rSh
arya
r
Cem
ent b
ulke
r2,
156,
000
1,63
5,95
452
0,04
61,
610,
000
1,08
9,95
4N
egot
iatio
nPi
r&
Com
pany
Oth
ers
Ass
ets
with
book
valu
e
ofle
ssth
anR
s.50
,000
1,32
0,85
01,
213,
575
107,
275
869,
134
761,
859
Neg
otia
tion
2012
8,04
7,85
06,
574,
359
1,47
3,49
13,
729,
134
2,25
5,64
3
2011
49,5
26,6
5744
,733
,737
4,79
2,92
05,
811,
072
1,01
8,15
2
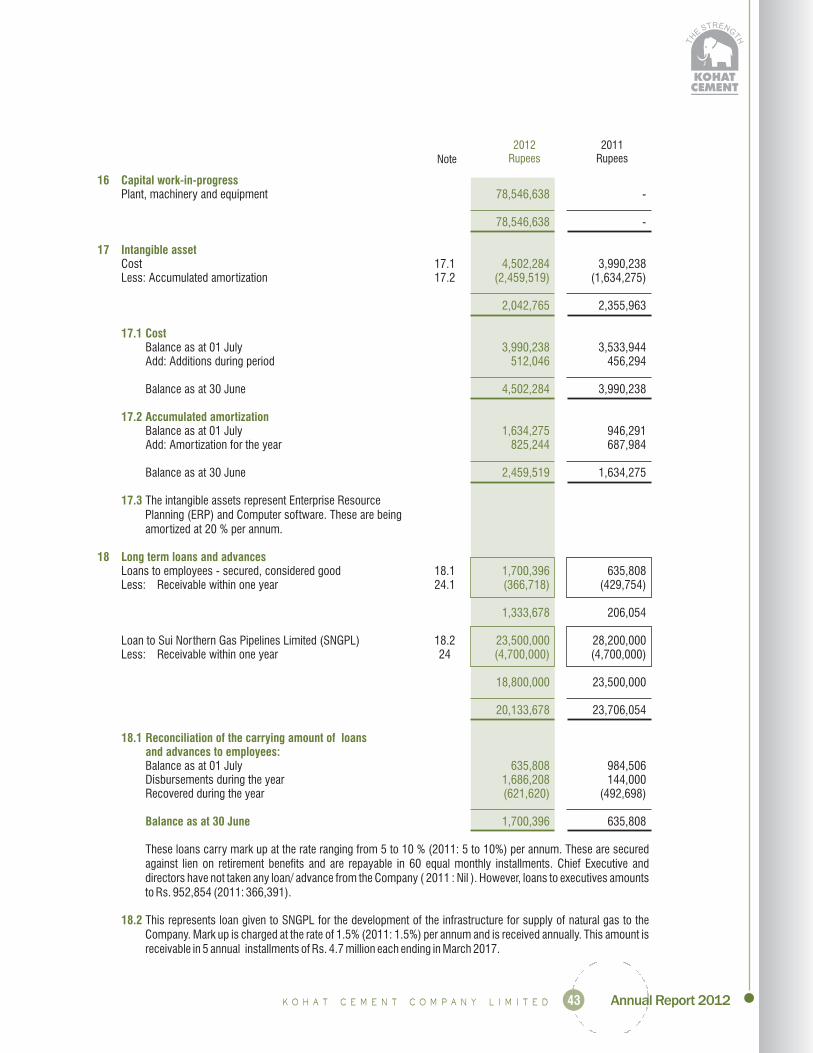
43
16 Capital work-in-progress
17 Intangible asset
17.1 Cost
17.2 Accumulated amortization
17.3
18 Long term loans and advances
18.1 Reconciliation of the carrying amount of loansand advances to employees:
Balance as at 30 June
18.2
78,546,638
78,546,638
4,502,284(2,459,519)
2,042,765
3,990,238512,046
4,502,284
1,634,275825,244
2,459,519
1,700,396(366,718)
1,333,678
23,500,000(4,700,000)
18,800,000
20,133,678
635,8081,686,208(621,620)
1,700,396
Plant, machinery and equipment -
-
Cost 17.1 3,990,238Less: Accumulated amortization 17.2 (1,634,275)
2,355,963
Balance as at 01 July 3,533,944Add: Additions during period 456,294
Balance as at 30 June 3,990,238
Balance as at 01 July 946,291Add: Amortization for the year 687,984
Balance as at 30 June 1,634,275
The intangible assets represent Enterprise ResourcePlanning (ERP) and Computer software. These are beingamortized at 20 % per annum.
Loans to employees - secured, considered good 18.1 635,808Less: Receivable within one year 24.1 (429,754)
206,054
Loan to Sui Northern Gas Pipelines Limited (SNGPL) 18.2 28,200,000Less: Receivable within one year 24 (4,700,000)
23,500,000
23,706,054
Balance as at 01 July 984,506Disbursements during the year 144,000Recovered during the year (492,698)
635,808
These loans carry mark up at the rate ranging from 5 to 10 % (2011: 5 to 10%) per annum. These are securedagainst lien on retirement benefits and are repayable in 60 equal monthly installments. Chief Executive anddirectors have not taken any loan/ advance from the Company ( 2011 : Nil ). However, loans to executives amountsto Rs. 952,854 (2011: 366,391).
This represents loan given to SNGPL for the development of the infrastructure for supply of natural gas to theCompany. Mark up is charged at the rate of 1.5% (2011: 1.5%) per annum and is received annually. This amount isreceivable in 5 annual installments of Rs. 4.7 million each ending in March 2017.
2012Rupees
2011RupeesNote

44
19 Long term deposits
20 Stores, spares and loose tools
20.1
20.2
21 Stock in trade
22 Trade debts
22.1
23 Investments
Available-for-sale
Gharibwal Cement Limited
3,879,440
3,879,440
869,528,645317,799,823
3,675,704
1,191,004,172
15,898,892387,191,89631,499,61665,736,456
500,326,860
-4,491,829
4,491,829
20,168,100478,234
2,831,900
23,000,000
Long term deposits 3,879,440
3,879,440
Stores 20.1 639,240,488Spares 208,806,245Loose tools 2,524,465
850,571,198
These includes stores in transit valuingRs. 632.59 million (2011: Rs.415.3 million)
Stores and spares include items which may result infixed capital expenditure but are not distinguishable.
Raw materials 8,759,981Work in process 315,358,799Finished goods 51,815,710Packing material 131,592,843
507,527,333
Considered good- Secured -- Un-secured 22.1 12,567,298
12,567,298
No amount is receivable from related partiesduring the current year (2011: Nil).
4,600,000 (2011: 4,600,000) fully paid 20,168,100ordinary shares of Rs 10 each
Market value Rs. 23 million (2011: Rs. 36.156 million)
Add: fair value adjustment 15,987,900
36,156,000
2012Rupees
2011RupeesNote
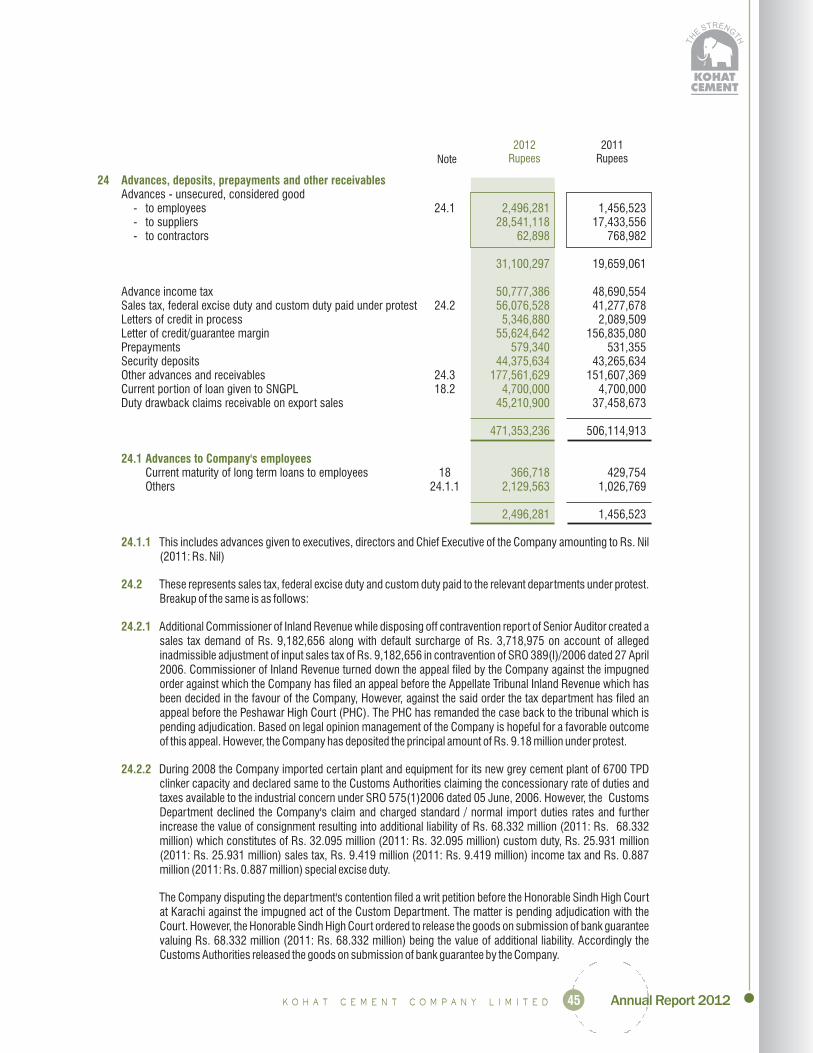
45
24 Advances, deposits, prepayments and other receivables
24.1 Advances to Company's employees
24.1.1
24.2
24.2.1
24.2.2
2,496,28128,541,118
62,898
31,100,297
50,777,38656,076,5285,346,880
55,624,642579,340
44,375,634177,561,629
4,700,00045,210,900
471,353,236
366,7182,129,563
2,496,281
Advances - unsecured, considered good- to employees 24.1 1,456,523- to suppliers 17,433,556- to contractors 768,982
19,659,061
Advance income tax 48,690,554Sales tax, federal excise duty and custom duty paid under protest 24.2 41,277,678Letters of credit in process 2,089,509Letter of credit/guarantee margin 156,835,080Prepayments 531,355Security deposits 43,265,634Other advances and receivables 24.3 151,607,369Current portion of loan given to SNGPL 18.2 4,700,000Duty drawback claims receivable on export sales 37,458,673
506,114,913
Current maturity of long term loans to employees 18 429,754Others 24.1.1 1,026,769
1,456,523
This includes advances given to executives, directors and Chief Executive of the Company amounting to Rs. Nil(2011: Rs. Nil)
These represents sales tax, federal excise duty and custom duty paid to the relevant departments under protest.Breakup of the same is as follows:
Additional Commissioner of Inland Revenue while disposing off contravention report of Senior Auditor created asales tax demand of Rs. 9,182,656 along with default surcharge of Rs. 3,718,975 on account of allegedinadmissible adjustment of input sales tax of Rs. 9,182,656 in contravention of SRO 389(I)/2006 dated 27 April2006. Commissioner of Inland Revenue turned down the appeal filed by the Company against the impugnedorder against which the Company has filed an appeal before the Appellate Tribunal Inland Revenue which hasbeen decided in the favour of the Company, However, against the said order the tax department has filed anappeal before the Peshawar High Court (PHC). The PHC has remanded the case back to the tribunal which ispending adjudication. Based on legal opinion management of the Company is hopeful for a favorable outcomeof this appeal. However, the Company has deposited the principal amount of Rs. 9.18 million under protest.
During 2008 the Company imported certain plant and equipment for its new grey cement plant of 6700 TPDclinker capacity and declared same to the Customs Authorities claiming the concessionary rate of duties andtaxes available to the industrial concern under SRO 575(1)2006 dated 05 June, 2006. However, the CustomsDepartment declined the Company's claim and charged standard / normal import duties rates and furtherincrease the value of consignment resulting into additional liability of Rs. 68.332 million (2011: Rs. 68.332million) which constitutes of Rs. 32.095 million (2011: Rs. 32.095 million) custom duty, Rs. 25.931 million(2011: Rs. 25.931 million) sales tax, Rs. 9.419 million (2011: Rs. 9.419 million) income tax and Rs. 0.887million (2011: Rs. 0.887 million) special excise duty.
The Company disputing the department's contention filed a writ petition before the Honorable Sindh High Courtat Karachi against the impugned act of the Custom Department. The matter is pending adjudication with theCourt. However, the Honorable Sindh High Court ordered to release the goods on submission of bank guaranteevaluing Rs. 68.332 million (2011: Rs. 68.332 million) being the value of additional liability. Accordingly theCustoms Authorities released the goods on submission of bank guarantee by the Company.
2012Rupees
2011RupeesNote
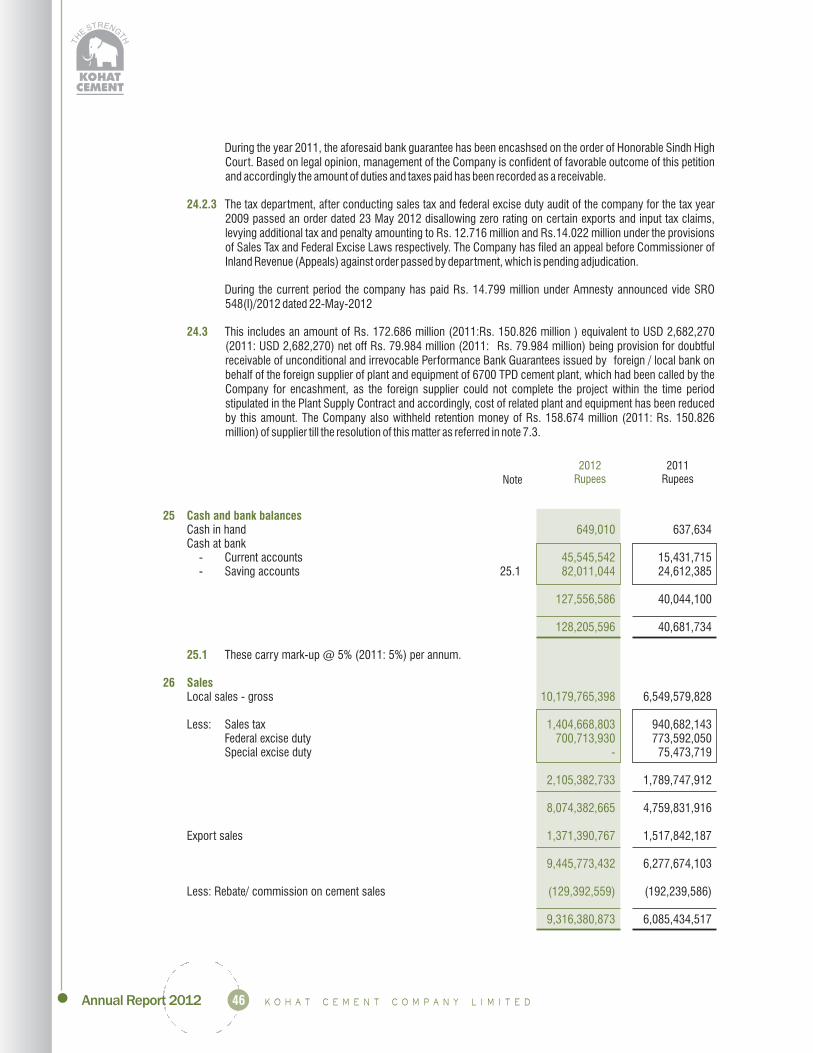
46
During the year 2011, the aforesaid bank guarantee has been encashsed on the order of Honorable Sindh HighCourt. Based on legal opinion, management of the Company is confident of favorable outcome of this petitionand accordingly the amount of duties and taxes paid has been recorded as a receivable.
The tax department, after conducting sales tax and federal excise duty audit of the company for the tax year2009 passed an order dated 23 May 2012 disallowing zero rating on certain exports and input tax claims,levying additional tax and penalty amounting to Rs. 12.716 million and Rs.14.022 million under the provisionsof Sales Tax and Federal Excise Laws respectively. The Company has filed an appeal before Commissioner ofInland Revenue (Appeals) against order passed by department, which is pending adjudication.
During the current period the company has paid Rs. 14.799 million under Amnesty announced vide SRO548(I)/2012 dated 22-May-2012
This includes an amount of Rs. 172.686 million (2011:Rs. 150.826 million ) equivalent to USD 2,682,270(2011: USD 2,682,270) net off Rs. 79.984 million (2011: Rs. 79.984 million) being provision for doubtfulreceivable of unconditional and irrevocable Performance Bank Guarantees issued by foreign / local bank onbehalf of the foreign supplier of plant and equipment of 6700 TPD cement plant, which had been called by theCompany for encashment, as the foreign supplier could not complete the project within the time periodstipulated in the Plant Supply Contract and accordingly, cost of related plant and equipment has been reducedby this amount. The Company also withheld retention money of Rs. 158.674 million (2011: Rs. 150.826million) of supplier till the resolution of this matter as referred in note 7.3.
Cash in hand 637,634Cash at bank
- Current accounts 15,431,715- Saving accounts 25.1 24,612,385
40,044,100
40,681,734
These carry mark-up @ 5% (2011: 5%) per annum.
Local sales - gross 6,549,579,828
Less: Sales tax 940,682,143Federal excise duty 773,592,050Special excise duty 75,473,719
1,789,747,912
4,759,831,916
Export sales 1,517,842,187
6,277,674,103
Less: Rebate/ commission on cement sales (192,239,586)
6,085,434,517
24.2.3
24.3
25 Cash and bank balances
25.1
26 Sales
649,010
45,545,54282,011,044
127,556,586
128,205,596
10,179,765,398
1,404,668,803700,713,930
-
2,105,382,733
8,074,382,665
1,371,390,767
9,445,773,432
(129,392,559)
9,316,380,873
2012Rupees
2011RupeesNote

47
27 Cost of goods sold
27.1
27.2
28 Selling and distribution expenses
438,689,669578,550,554
1,339,112,6413,294,091,669
3,630,055190,471,623128,738,45177,422,29015,741,45251,706,96113,493,955
345,020,15739,034,072
6,515,703,549315,358,799
(387,191,896)
6,443,870,45251,815,710
6,495,686,162(31,499,616)
6,464,186,546(209,290)
6,463,977,256
18,804,3321,678,9401,650,384
962,565946,850822,839783,663268,351
3,211,807691,604
14,035,9572,066,710
318,714
46,242,716
Raw materials consumed 303,570,149Packing materials consumed 27.1 503,545,932Power and fuel 1,039,326,848Coal, gas and furnace oil 2,556,698,188Coal unloading and feeding charges 3,392,671Stores and spares consumed 295,319,405Salaries, wages and other benefits 27.2 85,763,651Royalty and excise duty 72,694,281Rent, rates and taxes 9,135,849Repairs and maintenance 43,583,024Insurance 15,118,504Depreciation 15.2 307,954,047Other expenses 35,655,426
5,271,757,975Opening work-in-process 159,419,277Less: Closing work-in-process (315,358,799)
Cost of goods manufactured 5,115,818,453Opening stock of finished goods 94,624,070
5,210,442,523Closing stock of finished goods (51,815,710)
5,158,626,813Less: Cost attributable to own cement consumption (324,199)
5,158,302,614
This amount is exclusive of duty draw back on exports of Rs.8.632 million (2011: Rs. 12.2 million).
Salaries, wages and other benefits include Rs. 2.705 million andRs. 8.591 million (2011: Rs. 0.708 million and Rs. 2.277 million )in respect of provident fund contribution and employees' gratuityrespectively.
Salaries, wages and other benefits 28.1 13,182,791Vehicle running 1,543,718Travelling and conveyance 1,507,598Printing and stationery 804,454Postage, telephone and telegrams 931,429Entertainment 526,189Rent, rates and taxes 734,390Electricity, water and gas 218,135Sales promotion 2,333,229Depreciation 15.2 616,837Cement loading charges 10,472,548Freight and handling charges on exports 8,167,032Miscellaneous 160,784
41,199,134
2012Rupees
2011RupeesNote

48
Salaries, wages and other benefits include Rs. 0.481
million and Rs. 0.037 million (2011: Rs. 0.146 million
and Rs. 0.347 million ) in respect of provident fund
contribution and employees' gratuity respectively.
Salaries, wages and other benefits 29.1 22,147,411
Vehicle running 718,049
Traveling and conveyance 536,387
Printing and stationery 1,778,906
Legal and professional 29.2 4,617,088
Postage, telephone and telegrams 1,267,446
Repairs and maintenance 7,801,229
Rent, rates and taxes 1,056,268
Electricity, water and gas 2,457,195
Entertainment 1,567,014
Auditor's remuneration 29.3 695,000
Depreciation 15.2 1,991,919
Amortization 687,984
Advertisement 219,690
Miscellaneous 1,303,430
48,845,016
Salaries, wages and other benefits include Rs. 0.913
million and Rs.0.057 million (2011: Rs. 0.222 million
and Rs. 0.557 million) in respect of provident fund
contribution and employees' gratuity respectively
Legal and professional charges include remuneration
to cost auditor 2012: 0.060 million (2011: Rs. 0.065
million).
Statutory audit 550,000
Half year review 100,000
Out of pocket expenses 45,000
695,000
28.1
29 Administrative and general expenses
29.1
29.2
29.3 Auditor's remuneration
34,823,858
505,278
772,654
1,828,635
6,736,052
1,540,075
8,826,994
2,015,456
3,361,919
1,800,205
710,000
1,839,884
825,244
193,235
935,359
66,714,848
550,000
115,000
45,000
710,000
2012Rupees
2011RupeesNote

49
30 Other operating expenses
30.1
31 Other operating income
32 Finance cost
32.1
33 Taxation
33.1 Current
33.2
988,065107,176,672
-
108,164,737
4,865,351406,582
1,513,3892,255,644
14,012,0851,499,8415,750,000
460,576
30,763,468
-139,605,192412,018,738
372,377628,051
61,703,16011,732,880
626,060,398
94,492,844233,371,768
47,608,397
375,473,009
Donations 30.1 3,338,000Workers' profit participation fund 6,620,043Exchange fluctuation loss - net 6,526,472
16,484,515
None of the directors of the Company or any of theirspouse have any interest in donee's fund.
Profit/mark-up on bank deposits 2,917,754Profit/mark-up on SNGPL Loan 475,926
Income from sale of scrap 1,007,768Gain on disposal of property, plant and equipment 1,018,152Exchange fluctuation gain - net -Insurance claim 13,200,000Bad Debt recovered -Miscellaneous 1,804,875
20,424,475
Interest/mark-up on:Liabilities against assets subject to finance lease 154,403Short term borrowings 32.1 141,187,125Long term finances 536,417,971Workers' profit participation fund -
Default surcharge on FED and sales tax liability 23,383,149Loss on winding up of financial derivative instrument -Bank charges, commission and others 14,104,258
715,246,906Finance cost amounting to Rs. nil (2011:Rs. 45.359 million)has been capitalized during the year using weighted averagecapitalization rate of nil (2011: 13.93%).
For the yearCurrent 33.1 65,294,366Deferred (3,229,530)
Prior YearDeferred -
62,064,836
The provision for current taxation represents minimum tax under section 113 of the Income Tax Ordinance, 2001 atthe rate of 1% (2011: 1%) of turnover from local sales. In addition to this, it also includes tax on exports which is fulland final discharge of Company's tax liability in respect of income arising from such source.
Since the Company is liable to pay minimum tax, therefore, no numerical tax reconciliation is given.
Income from financial assets
Income from non-financial assets
2012Rupees
2011RupeesNote

50
34 Earnings per share - basic and diluted
34.1 Earnings per share - Basic
Earnings per share - basic
34.2 Earnings per share - Diluted
35 Cash and cash equivalents
36 Operating segments
36.1
36.2
36.3
1,660,511,377
128,757,241
12.90
128,205,596
(562,957,469)
(434,751,873)
2012
%
83.64
16.30
0.06
100
Earnings for the year after taxation Rupees 63,715,971
Weighted average number of ordinary shares
in issue during the year Numbers 128,757,241
Rupees 0.49
There is no dilution effect on the basic earnings/ (loss)
per share as the Company does not have any
convertible instruments in issue as at 30 June 2012
and 30 June 2011.
Cash and bank balances 25 40,681,734
Short term running finances 12.1 (762,856,418)
(722,174,684)
The financial information has been prepared on the basis
of a single reportable segment.
Sale from grey cement, white cement and clinker
represents 99.1% , 0.84% and 0.04% (2011: 100%,
0% and 0%) of total revenue of the Company respectively.
The net sales percentage by geographic region is as follows:
2011
%
Pakistan 78.22
Afghanistan 21.44
Others 0.34
100
All assets of the Company as at 30 June 2012 are located in Pakistan.
2012Rupees
2011RupeesNote

51
37 Financial instruments
37.1 Credit risk
2012Rupees
20,133,6783,879,4404,491,829
363,919,982127,556,586
519,981,515
1,262,6193,229,209
4,491,828
2,556,839338,349773,454
-823,186
4,491,828
The Company has exposure to the following risks from its use of financial instruments.:
- Credit risk- Liquidity risk- Market risk
The Board of Directors have the overall responsibility for the establishment and oversight of Company's riskmanagement framework. The Board is also responsible for developing and monitoring the Company's risk managementpolicies.
This note presents information about the Company's exposure to each of the above risks, the Company's objectives,policies and processes for measuring and managing risk, and the Company's management of capital.
The Company's risk management policies are established to identify and analyse the risks faced by the Company, to setappropriate risk limits and controls, and to monitor risks and adherence to limits. Risk management policies andsystems are reviewed regularly to react to changes in market conditions and the Company's activities.
Credit risk is the risk of financial loss to the Company if a customer or counterparty to a financial instrument fails tomeet its contractual obligations, and arises principally from the Company's receivables from customers and loansto/due from related parties. Out of the total financial assets of Rs. 520.630 million (2011: Rs. 496.45 million)financial assets which are subject to credit risk amount to Rs. 519.982 million (2011: Rs. 495.812 million).
The Company's exposure to credit risk is influenced mainly by the individual characteristics of each customer. Tomanage exposure to credit risk in respect of trade receivables, management reviews credit worthiness, references,establish purchase limits taking into account the customer's financial position, past experience and other factors.Export sales are secured through letters of credit. The management has set a maximum credit period of 30 days toreduce the credit risk. Limits are reviewed periodically and the customers that fail to meet the Company'sbenchmark creditworthiness may transact with the Company only on a prepayment basis.
Concentration of credit risk arises when a number of counter parties are engaged in similar business activities orhave similar economic features that would cause their abilities to meet contractual obligation to be similarlyeffected by the changes in economic, political or other conditions. The Company believes that it is not exposed tomajor concentration of credit risk.
The carrying amount of financial assets represents the maximum credit exposure before any credit enhancements.The maximum exposure to credit risk at the reporting date is:
2011Rupees
Long term loans, advances 23,706,054Long term deposits 3,879,440Trade debts 12,567,298Advances, deposits and other receivables 415,615,326Bank balances 40,044,100
495,812,218The trade debts as at the balance sheet date are classified as follows:
Foreign -Domestic 12,567,298
12,567,298The aging of trade receivables at the reporting date is:
Past due 1 - 3 Months 3,973,547Past due 4 - 6 Months -Past due 7 - 10 Months 5,822,056Past due 11 - 12 Months -Past due above one year 2,771,695
12,567,298
Based on past experience the management believes that no impairment allowance is necessary in respect of tradereceivables past due as some receivables have been recovered subsequent to the year end and for otherreceivables there are reasonable grounds to believe that the amounts will be recovered in short course of time.

52
The credit quality of cash and bank balances that are neither past due nor impaired can be assessed by reference toexternal credit ratings or to historical information about counterparty default rate:
Rating RatingShort term Long term Agency
Allied Bank A1+ AA PACRAAskari Bank Limited A1+ AA PACRABank Alfalah Limited A1+ AA PACRAThe Bank of Khyber A2 A- PACRAThe Bank of Punjab A1+ AA- PACRADubai Islamic Bank (Pakistan) Limited A-1 A JCR-VISHabib Metropolitan Bank Limited A1+ AA+ PACRAJS Bank Limited A1 A PACRAMCB Bank Limited A1+ AA+ PACRANational Bank of Pakistan A-1+ AAA JCR-VISSoneri Bank Limited A1+ AA - PACRAStandard Chartered Bank Limited A1+ AAA PACRAUnited Bank Limited A-1+ AA+ JCR-VISHabib Bank Limited A-1+ AA+ JCR-VIS
Due to the Company's long standing business relationships with these counterparties and after giving due considerationto their strong financial standing, management does not expect non-performance by these counter parties on theirobligations to the Company. Accordingly, the credit risk is minimal.
Liquidity risk is the risk that the Company will encouter difficuilty in meeting its obligations arising from financial liabilitiesthat are setelled by delivering cash or another financial asset or that such obligation will have to be settled in a mannerdisadvantages to the Company. For this purpose the Company has sufficient running finance facilities available fromvarious commercial banks to meet its liquidity requirements. Further liquidity position of the Company is closelymonitored through budgets, cash flow projections and comparison with actual results by the Board.
The following are the contractual maturities of financial liabilities as at June 30, 2012:
Carrying Less than Between 6 Between 1 to Between 6 Over 10amount 6 months to 12 months to 5 years to 10 years years
------------------------------------- Rupees -------------------------------------
Long term finances - secured 1,655,000,000 215,324,588 276,975,412 1,162,700,000 - -Security deposits and retention money 171,084,338 - 5,349,185 165,735,153 - -Trade and other payables 879,459,910 879,459,910 - - - -Mark up payable 987,870,754 62,014,642 37,000,000 888,856,112 - -Short Term Borrowings 1,160,957,469 1,160,957,469 - - - -
Interest rate swaps - - - - - -
Carrying Less than Between 6 Between 1 to Between 6 Over 10amount 6 months to 12 months to 5 years to 10 years years
------------------------------------- Rupees -------------------------------------
Long term finances - secured 3,576,920,000 15,050,000 25,000,000 3,536,870,000 - -Security deposits and retention money 186,106,103 - 22,449,274 163,656,829 - -Trade and other payables 791,785,855 791,785,855 - - - -Mark up payable 744,678,215 433,182,170 - 311,496,045 - -Short Term Borrowings 1,363,678,773 1,363,678,773 - - - -
Interest rate swaps 187,420,429 - - 187,420,429 - -
2010-2011 6,850,589,375 2,603,696,798 47,449,274 4,199,443,303 - -
37.2 Liquidity risk
Non derivative financial liabilities
Derivative financial liabilities
2011-2012
Non derivative financial liabilities
Derivative financial liabilities
4,854,372,471 2,317,756,609 319,324,597 2,217,291,265 - -

53
USD
Euro
Market risk is the risk that changes in market prices, such as foreign exchange rates, interest rates and equity priceswill affect the Company's income or the value of its holdings of financial instruments. The objective of market riskmanagement is to manage and control market risk exposures within acceptable parameters, while optimising thereturn.
The Company is exposed to currency risk on sales and purchases that are denominated in a currency other than thefunctional currency primarily U.S. Dollars (USD). The Company uses forward exchange and derivative contracts tohedge its currency risks. The Company's exposure to foreign currency risk for US Dollars is as follows:
2011Rupees
Foreign debtors -Compensation receivable from TCDRI (150,825,637)Foreign creditors 371,193,678Long term retention money 106,702,000Derivative financial instruments - liability 187,420,429Outstanding import letters of credit 32,415,207
Net exposure 546,905,677
Company's exposure to foreign currency risk for Euro is as follows:
Long term retention money 44,123,637Outstanding import letters of credit 44,195,200
Net exposure 88,318,837
The following significant exchange rates have been applied:
Reporting date rate2011
USD to PKR - Buy 86.05USD to PKR - Sell 85.85Euro to PKR- Buy 124.89Euro to PKR- Sell 124.60
Average rate2011
USD to PKR 86.23Euro to PKR 124.09
At reporting date, if the PKR had strengthened by Rupee one against the US Dollar and Euro with all other variablesheld constant, post-tax profit for the year would have been increased/ (decreased) by Rs. 4.192 million (2011: Rs.7.063 million).
The sensitivity analysis prepared is not necessarily indicative of the effects on (loss) / profit for the year and assets /liabilities of the Company.
37.3 Market risk
(i) Currency risk
Sensitivity analysis:
2012Rupees
(1,262,619)(172,686,167)
374,513,400116,808,003
-16,517,028
333,889,645
41,866,05034,859,382
76,725,432
2012
94.2094.00
118.50118.25
2012
90.53118.52

54
Interest rate risk is the risk that the value of financial instrument will fluctuate due to changes in market interestrates. Significant interest rate risk exposures are primarily managed by a mix of borrowings at fixed and variableinterest rates and entering into interest rate swap contracts. At the reporting date the interest rate profile of theCompany's significant interest bearing financial instruments was as follows:
2011 2011Effective rate Carrying amount
(in Percentage)
Variable rate instrumentsLong term finances - PKR 14.85% 3,576,920,000Short term borrowings - PKR 13.93% 1,363,678,773
A change of 100 basis points in interest rates will have an impact on income of Rs. 28.16 million (2011: Rs. 49.406million) worked out on the outstanding debt amount at the reporting date. This analysis assumes that all othervariables remain constant.
Other price risk is the risk that the fair value or future cash flows of a financial instrument will fluctuate because ofchanges in market prices (other than those arising from interest rate risk or currency risk). Equity price risk arisesfrom available-for-sale equity securities held.
The carrying values of the financial assets and financial liabilities approximate their fair values. Fair value is theamount for which an asset could be exchanged, or a liability settled, between knowledgeable, willing parties in anarm’s length transaction.
Available for sale2011
Rupees
Investments 36,156,000
Loans and receivables2011
Rupees
Long term deposits 3,879,440Long term loans and advances 23,706,054Trade debts 12,567,298Advances, deposits, prepayments and other receivables- Advances to employees 1,456,523- Advances to suppliers 17,433,556- Advances to contractors 768,982- Others receivables 395,956,265Cash and bank balances 40,681,734
496,449,852
(ii) Interest rate risk
Financial liabilities
(iii) Other price risk
37.4 Fair value of financial instruments
37.5 Financial instruments by categories
2012 2012
14.36% 1,655,000,00013.26% 1,160,957,469
2012Rupees
23,000,000
2012Rupees
3,879,44020,133,6784,491,829
2,496,28128,541,118
62,898332,819,685128,205,596
520,630,525
Cash flow sensitivity analysis for variable rate instruments
Financial assets as per balance sheet

55
Financial liabilities
at amortized cost
2011
Rupees
Long term loans - secured 3,576,920,000
Long term security deposits and retention money 163,656,829
Deferred markup 311,496,045
Trade and other payables 814,235,129
Accrued markup 433,182,170
Short term borrowings - secured 1,363,678,773
6,663,168,946
Financial liabilities
at fair value
2011
Rupees
Derivative financial liabilities 187,420,429
The Board's policy is to maintain an efficient capital base so as to maintain investor, creditor and market confidence and
to sustain the future development of its business. The Board of Directors monitors the return on capital employed, which
the Company defines as operating income divided by total capital employed. The Board of Directors also monitors the
level of dividends to ordinary shareholders.
The Company's objectives when managing capital are:
to safeguard the entity's ability to continue as a going concern, so that it can continue to provide returns for
shareholders and benefits for other stakeholders, and
to provide an adequate return to shareholders.
The Company manages the capital structure in the context of economic conditions and the risk characteristics of the
underlying assets. In order to maintain or adjust the capital structure, the Company may, for example, adjust the amount
of dividends paid to shareholders, issue new shares, or sell assets to reduce debt.
The Company monitors capital on the basis of the debt-to-equity ratio - calculated as a ratio of total debt to equity.
The debt-to-equity ratios as at 30 June 2012 and at 30 June 2011 were as follows:
2011
Total debt Rupees 4,940,598,773
Total equity and debt Rupees 7,043,414,910
Debt-to-equity ratio 70%
Neither there were any changes in the Company's approach to capital management during the year nor the Company is
subject to externally imposed capital requirements.
2012
Rupees
1,655,000,000
165,735,153
888,856,112
884,809,095
99,014,642
1,160,957,469
4,854,372,471
2012
Rupees
-
(i)
(ii)
2012
2,815,957,469
6,572,412,825
43%
Financial liabilities as per balance sheet
37.6 Capital management
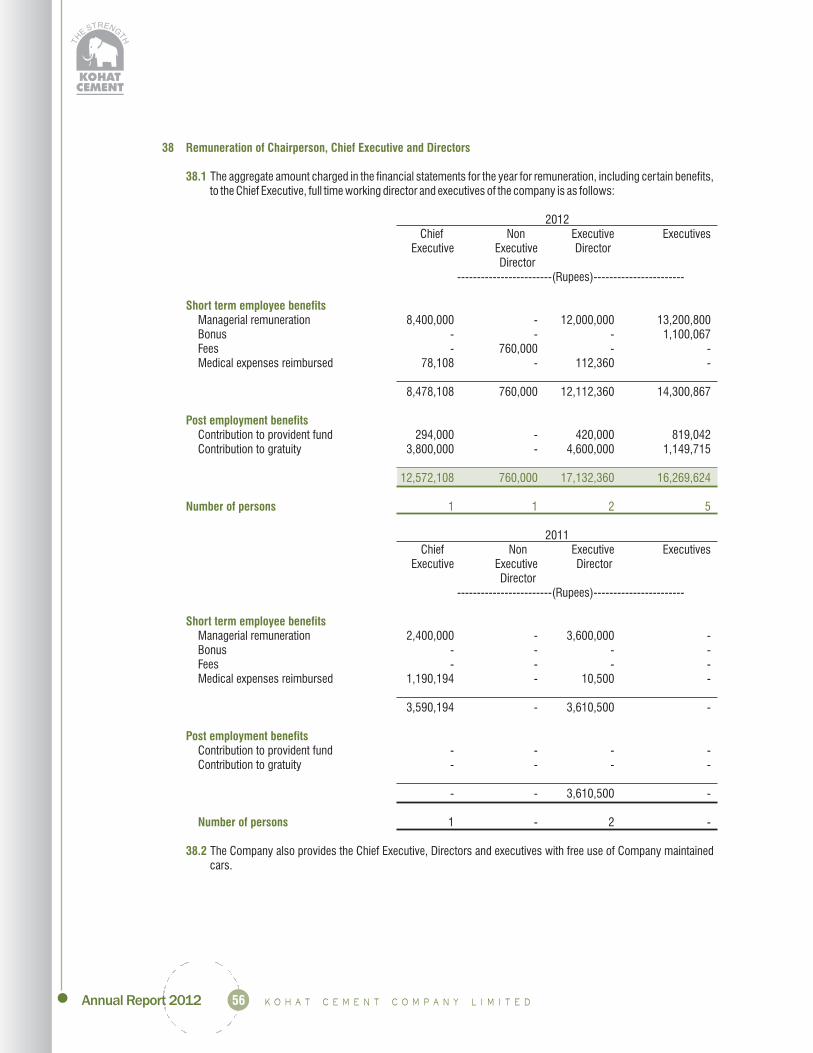
56
38 Remuneration of Chairperson, Chief Executive and Directors
38.1
Short term employee benefits
Post employment benefits
Number of persons
Short term employee benefits
Post employment benefits
Number of persons
38.2
12,572,108 760,000 17,132,360 16,269,624
1 1 2 5
The aggregate amount charged in the financial statements for the year for remuneration, including certain benefits,to the Chief Executive, full time working director and executives of the company is as follows:
2012Chief Non Executive Executives
Executive Executive DirectorDirector
------------------------(Rupees)-----------------------
Managerial remuneration 8,400,000 - 12,000,000 13,200,800Bonus - - - 1,100,067Fees - 760,000 - -Medical expenses reimbursed 78,108 - 112,360 -
8,478,108 760,000 12,112,360 14,300,867
Contribution to provident fund 294,000 - 420,000 819,042Contribution to gratuity 3,800,000 - 4,600,000 1,149,715
2011Chief Non Executive Executives
Executive Executive DirectorDirector
------------------------(Rupees)-----------------------
Managerial remuneration 2,400,000 - 3,600,000 -Bonus - - - -Fees - - - -Medical expenses reimbursed 1,190,194 - 10,500 -
3,590,194 - 3,610,500 -
Contribution to provident fund - - - -Contribution to gratuity - - - -
- - 3,610,500 -
1 - 2 -
The Company also provides the Chief Executive, Directors and executives with free use of Company maintainedcars.
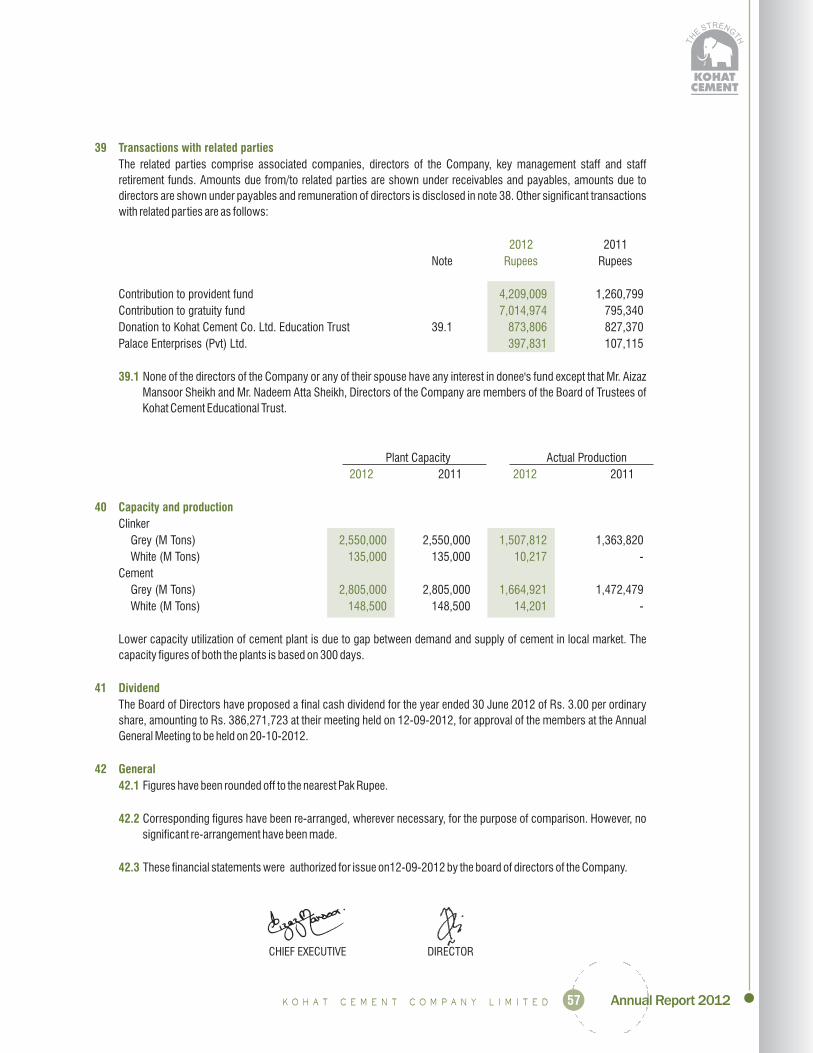
57
39 Transactions with related parties
39.1
40 Capacity and production
41 Dividend
42 General
42.1
42.2
42.3
2012
Rupees
4,209,009
7,014,974
873,806
397,831
2012 2012
2,550,000 1,507,812
135,000 10,217
2,805,000 1,664,921
148,500 14,201
The related parties comprise associated companies, directors of the Company, key management staff and staff
retirement funds. Amounts due from/to related parties are shown under receivables and payables, amounts due to
directors are shown under payables and remuneration of directors is disclosed in note 38. Other significant transactions
with related parties are as follows:
2011
Note Rupees
Contribution to provident fund 1,260,799
Contribution to gratuity fund 795,340
Donation to Kohat Cement Co. Ltd. Education Trust 39.1 827,370
Palace Enterprises (Pvt) Ltd. 107,115
None of the directors of the Company or any of their spouse have any interest in donee's fund except that Mr. Aizaz
Mansoor Sheikh and Mr. Nadeem Atta Sheikh, Directors of the Company are members of the Board of Trustees of
Kohat Cement Educational Trust.
Plant Capacity Actual Production
2011 2011
Clinker
Grey (M Tons) 2,550,000 1,363,820
White (M Tons) 135,000 -
Cement
Grey (M Tons) 2,805,000 1,472,479
White (M Tons) 148,500 -
Lower capacity utilization of cement plant is due to gap between demand and supply of cement in local market. The
capacity figures of both the plants is based on 300 days.
The Board of Directors have proposed a final cash dividend for the year ended 30 June 2012 of Rs. 3.00 per ordinary
share, amounting to Rs. 386,271,723 at their meeting held on 12-09-2012, for approval of the members at the Annual
General Meeting to be held on 20-10-2012.
Figures have been rounded off to the nearest Pak Rupee.
Corresponding figures have been re-arranged, wherever necessary, for the purpose of comparison. However, no
significant re-arrangement have been made.
These financial statements were authorized for issue on12-09-2012 by the board of directors of the Company.
CHIEF EXECUTIVE DIRECTOR

58
2011 2010 2009 2008 2007 2006 2005
Clinker:- Grey 2,550 2550 1880 540 540 540 540- White 135 135 135 135 135 135 -Cement:- Grey 2,805 2805 1974 567 567 567 567- White 149 149 142 142 142 142 -
Clinker:- Grey 1,364 1,174 713 429 506 554 531- White - - 19 19 23 16 -Cement:- Grey 1,472 1,225 782 450 529 555 562- White - 4 20 21 22 15 -
- Grey 1,494 1,192 778 452 524 557 560- White - 5 21 20 23 14 -
Turnover ,085,435 3,692,038 3,395,581 1,371,792 1,553,733 2,327,238 1,715,427Gross profit 927,132 357,021 804,559 87,402 343,267 1,199,662 664,223Operating profit 837,088 264,831 662,974 21,629 278,226 1,145,849 615,203Profit before tax, interest & VSS 841,028 283,206 693,901 36,649 346,210 1,093,522 584,153Profit/(loss) before tax 125,781 (382,238) 21,184 (279,573) 327,841 1,039,424 560,949Profit/(loss) after tax 63,716 (327,777) 27,093 (222,439) 248,368 789,867 386,501
Shareholders equity ,102,816 1,960,970 2,271,547 2,329,129 2,339,656 2,283,940 1,081,732Fixed capital expenditure ,140,841 7,229,394 6,937,818 6,248,720 5,258,260 2,079,393 1,119,880Net current assets/(liabilities) (856,921) (1,835,304) (1,300,717) (683,869) 642 556,588 164,551Long term liabilities ,887,947 3,407,267 3,305,756 3,122,560 2,810,116 245,309 119,242Deferred liabilities 323,098 62,670 101,198 155,733 158,740 161,268 104,240
Gross profit ratio % 15.24 9.67 23.69 6.37 22.09 51.55 38.72Profit before tax ratio % 2.07 (10.35) 0.62 (20.38) 21.10 44.66 32.70Profit after tax ratio % 1.05 (8.88) 0.80 (16.22) 15.99 33.94 22.53Operating fixed assets turnover ratio % 85.22 57.98 53.45 145.71 151.80 269.01 295.25Return on capital employed % 12.34 6.22 12.32 (3.09) 6.21 31.37 58.12Debt : equity ratio 70 : 30 72 : 28 69 : 31 67 : 33 55 : 45 10 : 90 10 : 90Current ratio 0.70 0.43 0.56 0.66 1.00 2.44 1.47Interest coverage ratio 1.18 0.42 1.26 (4.71) 1.23 20.21 25.17
16.33 15.23 17.64 19.90 22.99 24.68 21.92
0.49 (2.55) 0.21 (1.73) 2.12 9.06 4.50
Cash (Rs. 000) - - - - - - -%age - - - - - - -Bonus Shares%age - - - 10 15 10 50
2012
2,550135
2,805149
1,50810
1,66514
1,67314
9,316,381 62,852,4042,739,4462,662,0452,035,9841,660,511
3,756,455 26,868,440 7(580,914)1,328,435 31,228,691
30.6221.8517.82
137.2142.16
43: 570.804.25
29.17
12.90
386,27230%
-
TRADING RESULTS
Quantitative data (000 M.Tonnes):
Capacity:
Production:
Dispatches - cement:
Financial data (Rs. 000):
BALANCE SHEET (Rs. 000)
RATIO ANALYSIS
BREAK UP VALUE PER SHARE
OF RS. 10 EACH (Rs.)
EARNING/ (LOSS) PER SHARE (Rs.)
DIVIDENDS
KEY FINANCIAL DATA FOR LAST 8 YEARS

59
No. ofShareholders
295594537690120421312139932231322115322312411111112121111111111111111111111212111111
2421
1101501
1,0015,001
10,00115,00120,00125,00130,00135,00140,00145,00150,00155,00160,00165,00170,00175,00180,00190,00195,001
100,001120,001130,001135,001140,001145,001155,001175,001180,001185,001190,001195,001205,001240,001245,001250,001260,001265,001270,001285,001305,001320,001340,001370,001375,001395,001460,001470,001495,001530,001535,001545,001610,001675,001840,001
1,075,0011,260,0011,895,0012,095,0012,195,0012,445,0012,775,0013,720,0016,370,0017,075,001
21,420,00122,970,00128,535,001
100500
1,0005,000
10,00015,00020,00025,00030,00035,00040,00045,00050,00055,00060,00065,00070,00075,00080,00085,00095,000
100,000105,000125,000135,000140,000145,000150,000160,000180,000185,000190,000195,000200,000210,000245,000250,000255,000265,000270,000275,000290,000310,000325,000345,000375,000380,000400,000465,000475,000500,000535,000540,000550,000615,000680,000845,000
1,080,0001,265,0001,900,0002,100,0002,200,0002,450,0002,780,0003,725,0006,375,0007,080,000
21,425,00022,975,00028,540,000
No. of ShareholdersHeld
13,097180,935447,257
1,524,995888,896501,404258,257268,715368,249291,354342,741126,80495,515
104,301175,62465,000
197,622150,000153,70081,98294,999
490,781306,226245,327261,652415,634142,725294,361628,926176,000183,360187,013191,725200,000208,725245,000490,811253,050525,007267,675275,000290,000310,000325,000345,000374,400376,357395,945462,940471,912500,000531,500539,560547,362614,627675,768840,117
1,076,2361,261,0201,896,1122,100,0004,400,0002,449,9235,550,0783,721,6276,371,3507,078,005
21,421,91322,971,50528,538,539
128,757,241
ShareholdingsFrom To
PATTERN OF SHAREHOLDINGSas at 30 June 2012

60
Categories of Shareholders Shares Held Percentage
Directors, Chief Executive Officer, their Spouse and Minor Children
Associated Companies, Undertakings & Related Parties
NIT & ICP
Banks, Development Finance Institution, and Non-Banking Finance Institutions
Modarbas and Mutual Funds
Insurance Companies
Share holders holding 10%
General Public
Others
75,105,589 58.33%
131,903 0.10%
247,317 0.19%
24,311 0.02%
1,457,110 1.13%
- 0.00%
72,931,957 56.64%
a) Local 50,100,578 38.91%
b) Foreign 7,873 0.01%
i) Joint Stock Companies 802,710 0.62%
ii) KCCL Employees Trust 851,768 0.66%
iii) Al-Bader Welfare Trust 21,125 0.02%
iv) Wah Nobel P. Ltd, Management Staff Provident Fund 6,957 0.01%
CHIEF EXECUTIVELahore: September 12, 2012

61
ADDITIONAL INFORMATION AS REQUIREDBY THE CODE OF CORPORATE GOVERNANCE
Tariq Motors (Private) limited 1 34,438
Kohat Cement Education Trust 1 97,465
National Bank of Pakistan-Trustee Department, NI(U)T FUND 1 245,503
CDC - Trustee Pakistan Stock Market Fund 1 245,308
CDC - Trustee Atlas Stock Market Fund 1 200,000
CDC - Trustee United Stock Advantage Fund 1 100,000
CDC - Trustee United Composite Islamic Fund 1 245,000
CDC - Trustee MCB Dynamic Stock Fund 1 187,013
CDC - Trustee KASB Stock Market Fund 1 145,536
CDC - Trustee KASB Asset Allocation Fund 1 18,500
CDC - Trustee Crosby Dragon Fund 1 156,379
CDC - Trustee Pakistan Premier Fund 1 131,374
Trustee - Pakistan Pension Fund - Equity Sub Fund 1 28,000
Mr. Aizaz Mansoor Sheikh 1 22,971,505
Mr. Nadeem Atta Sheikh 1 28,538,539
Mr. Omer Aizaz Sheikh 1 2,100,000
Mr. Ibrahim Tanseer Sheikh 1 2,775,039
Mr. Muhammad Atta Tanseer Sheikh 1 2,775,039
Mrs. Ghazala Amjad 1 7,078,005
Mrs. Hafsa Nadeem Sheikh 1 1,896,112
Mr. Capt. Amjad Latif Sheikh H/o Mrs. Ghazala Amjad 1 6,371,350
Mrs. Shahnaz Aizaz W/o Mr. Aizaz Mansoor Sheikh 1 500,000
Mrs. Mahnum Omer W/o Mr. Omer Aizaz Sheikh 1 100,000
Mr. Aizaz Mansoor Sheikh 1 22,971,505
Mr. Nadeem Atta Sheikh 1 28,538,539
Mrs. Hijab Tariq 1 21,421,913
Mrs. Ghazala Amjad 1 7,078,005
Categories Of Number Of Number Of
Shareholders Shareholders Shares Held
I Associated Companies, Undertakings & Related Parties 2 131,903
II Mutual Funds 11 1,702,613
III Directors, their Spouse and Minor Children 10 75,105,589
Directors 7 68,134,239
Director's Spouse 3 6,971,350
IV Executives - NIL
V Public Sector Companies and Corporations - NIL
VI Banks, Development Finance Institutions, Non-Banking Finance
Companies, Insurance Companies, Takaful, Modarbas and Pension Funds 3 25,725
VII Shareholders Holding Five Percent or More Voting Interests 4 80,009,962
CHIEF EXECUTIVE

62
This page has been
intentionally left blank

FORM OF PROXY33rd Annual General Meeting 2012
Signature:
Note:
Pleaseaffix
Rupees fiverevenue stamp
1.
2.
3.
Proxies in order to be effective must be duly stamped and received by the company not less than 48 hours before the
time of holding the meeting. No person shall be appointed as a proxy who is not a member of the company qualified to
vote except that a company/ corporation being a member may appoint as proxy a person who is not a member.
CDC account holders and their proxies are requested to attach an attested photocopy of their Computerized National
Identity Card or Passport with this proxy form before submission to the company.
Signature should agree with the specimen signature registered with the company.
I / We
of being a member of
and holder of (No. of shares) Ordinary shares as per
and / or and
hereby appoint
of another member of the company (or failing
him of )
as my/ our proxy to attend and vote for me / us and on my / our behalf at the Annual General Meeting of the
Company to be held on at the registered office of the company
and at any adjournment thereof.
Signed this day of 2012.
Share Register Folio No. CDC Participant I.D. No.
Sub Account No.
Kohat Cement Company Limited
Saturday, 20 October 2012 at 11:00 A.M.
Kohat Cement Factory, Rawalpindi Road, Kohat
Witnesses:
1. 2.Signature:
Name:
Address:
CNIC or
Passport No.
Signature:
Name:
Address:
CNIC or
Passport No.

AFFIXCORRECTPOSTAGE
The Company Secretary,
Rawalpindi Road, Kohat.Tel: 0922-560-990Fax: 0922-560-405
Kohat Cement Company Limited,
Fold Here Fold Here
Fold
Her
eFold H
ere