About Cruise Lines International Association (CLIA · About Cruise Lines International Association...
48
Transcript of About Cruise Lines International Association (CLIA · About Cruise Lines International Association...
About Cruise Lines International Association (CLIA) – One Industry, One Voice
Cruise Lines International Association (CLIA) is the unified voice and leading authority of the global cruise community. As the largest cruise industry trade association with 15 offices globally, CLIA has representation in North and South America, Europe, Asia and Australasia. CLIA's mission is to support policies and practices that foster a safe, secure and healthy cruise ship environment for the more than 23 million passengers who cruise annually, as well as to promote the value, desirability and affordability of the cruise vacation experience. Members are comprised of the world's most prestigious ocean, river and specialty cruise lines; a highly trained and certified travel agent community; and cruise line suppliers and partners, including ports & destinations, ship development, suppliers and business services, committed to the sustained success of the cruise industry. For more information, visit www.cruising.org or follow Cruise Lines International Association on CLIA Facebook and Twitter pages.
Contact Information:
CLIA Headquarters
1201 F Street, Suite 250
Washington, D.C. 20004
+1- (202)759-9370
About CHART Management Consultants
CHART assists senior management to understand complex issues, to develop strategic solutions to problems and to devise innovative approaches to capitalizing on the growth of the cruise industry. The firm brings unique experience, analytical rigor, strong communication and implementation skills and exceptional client service to every project. In recent years, the firm’s focus has moved more to Asia and the Pacific. CHART Principal, Ted Blamey, a former cruise line President/CEO, Port Authority Chair and Retail Travel Group CEO founded CHART in 1997. CHART’s Associates have all held senior executive positions in cruise lines. Visit www.CHARTmgmtconsultants.com for more information.
Contact Information:
CHART Management Consultants Pty. Ltd.
P O Box 545, Neutral Bay, NSW 2089,
Australia.
+61-2-9909-1142
2
TABLE OF CONTENTS
3
SECTION PAGE
INTRODUCTION 4
KEY FINDINGS 5
CAPACITY 7
DESTINATIONS 10
SOURCE MARKETS 26
APPENDIX 41
INTRODUCTION
The cruise industry in Asia is growing rapidly. As many cruise lines deploy more capacity to the region, including brand new, large cruise ships purpose-built for Asian consumers, cruise lines and industry stakeholders need to understand the trends, the overall potential for cruise tourism growth and associated infrastructure needs and to monitor guest source markets.
To achieve these goals, Cruise Lines International Association commissioned CHART Management Consultants to undertake its second in-depth Asia Cruise Trends analysis.
With the collaboration of 26 international and regional cruise brands, which account for over 95 percent of regional capacity, this project set out to update and extend the 2014 study of Asia’s ocean cruise segment (2+ nights) and accomplish key objectives:
• Provide industry stakeholders with actionable, meaningful information, in particular
– Trends in the key drivers of cruise activity: capacity, deployment, and destinations
– Accurate data on the size and growth of Asia passenger source markets.
• Provide a tool to work with governments and the private sector to structure long-term benefits for local economies and specifically to
– Assist authorities in forming cruise industry-specific policies and regulations
– Provide analyses to inform investment and infrastructure decisions.
• Generate detailed destination volume data to underpin economic impact assessments.
The following report outlines capacity and destination trends between 2013 and 2016, based on analysis of detailed itinerary information obtained from the cruise lines that are operating in Asia. Key capacity metrics, like ship counts, cruises, operating days and passenger capacity, are analyzed. Additional destination metrics such as port calls and passenger destination days describe the deployment trends.
It also provides an historical overview of passenger source volume from the twelve main Asian markets between the 2013 and 2015 calendar years, reviewing metrics such as passenger source volume, types of cruises and ship segments selected, length of cruises taken, destinations visited, and passenger ages.
As Asia is a rapidly growing and dynamic market, three-year trends are typically analyzed using a compound annual growth rate to identify underlying trends against the year over year variability in markets.
Throughout this report, and consistent with CHART’s Asia Cruise Association 2013 White Paper, all analyses and information exclude one-night cruises.
4
KEY FINDINGS
THE TRENDS
Cruise tourism in Asia is still growing at double-digit rates – both in capacity deployed in the region and as a series of 12 passenger source markets.
Between 2013 and 2016, cruise capacity has increased across all metrics.
• The number of ships deployed in Asia grew at a 12 percent compound annual growth rate
• Similarly, the number of cruises and voyages within and through Asia increased at a 22 percent CAGR
• Operating days expanded 13.6 percent annually
• Passenger capacity in Asia increased 29.3 percent annually.
The cruise industry is bringing more cruise visits to destinations in Asia. • There will be 5,570 Asian cruise calls in 2016, an increase of 43 percent in absolute volume from 2015’s 3,896
calls. The number of port calls in 2016 is almost double that of 2013.• Destinations with the greatest growth in total port calls this year are Japan, China and South Korea with 880, 550
and 368 additional calls, respectively. Other destinations with any port call growth are Vietnam (150), Taiwan (59) and Singapore (17).
As a source market for cruise tourism worldwide, the absolute volume of cruise travelers sourced from Asia has nearly tripled since 2012.
• Between 2012 and 2015, passenger volume grew from 775,000 to nearly 2.1 million passengers, a 39 percent compound annual growth rate.
• China is a main driver of passenger growth in Asia, adding 770,000 more cruise travelers since 2012 – a 66 percent compound annual growth rate.
• Four of the five other major markets also saw double-digit 3-year compound growth: Taiwan (29 percent), Japan (30 percent), Hong Kong (69 percent) and India (37 percent).
Among the nearly 2.1 million cruise passengers from Asia, China accounted for almost half of the regional passenger volume in 2015.
• 986,000 passengers came from mainland China compared to 1.1M sourced from the rest of Asia
• Other leading source markets include Taiwan (228,700), Singapore (182,700), and Japan (179,900).
• Hong Kong (126,800) and India (125,900) are the other two markets with over 100,000 passengers in 2015.
5
KEY FINDINGS (continued)
Asian cruise passengers predominantly cruise only within Asia on short sailings.• The majority (80 percent) of Asian cruisers sailed within the region in 2015.• Europe (74 percent) was the leading destination among the long-haul cruisers that sailed outside of Asia,
followed by Caribbean/Western U.S./Hawaii (12 percent) and Alaska/Canada/New England (8 percent) destinations.
• Shorter sailings were by far the most popular, with the greatest share of passengers sailing 4 to 6 nights (50 percent) followed by 2 to 3 nights (30 percent) and 7 to 13 nights (19 percent).
THE 2016 PICTURE
The momentum of cruise tourism continues with 31 brands active in Asia in 2016.• 60 ships will be deployed.• More than 1,560 cruises and voyages are scheduled, up from 1,095 in 2015.• Passenger capacity is estimated at more than 3.1 million, up from just over 2 million in 2015
In 2016, there will be increasing variation in the ship product mix.
• Most capacity will be on the mega and large ships with 2 and 15 of them deployed in Asia this year respectively
• 21 mid-size ships are also deployed in 2016.
• Small upscale ships will be active in the region with 16 deployed seasonally.
• The Expedition niche will have 6 ships deployed on limited seasons.
Asia to Asia cruises and short sailings will dominate itineraries in 2016.• 1,473 cruises are scheduled • A further 87 voyages (beginning or ending outside of Asia) will pass through the region.• The majority of cruises will be 4-6 night (49.5 percent) and 2-3 night (33.7 percent)
The cruise industry will have a potential to bring 10.9 million passenger destination days across local communities in the region this year.
• With over 5,500 port calls scheduled, itineraries will touch 204 destinations across 17 countries.
• Japan, China and South Korea will welcome the most port calls (1526, 850 and 745 respectively).
• Top ports with over 300 total calls in 2016 include Jeju Island, South Korea (460), Baoshan/Shanghai, China (437) and Singapore (391).
• In terms of potential for tourist visits, Japan, China and South Korea will host the most passenger destination days with capacity for nearly 3 million passengers arriving in Japanese destinations and approximately 2 million passengers arriving in the other two countries by cruise ship.
6
CAPACITY
Deployment and number of sailings
Asia continues to see rapid growth in deployment and cruise capacity.
In 2016, 31 cruise brands are active in Asian waters, deploying a total of 60 ships of which 14 are year-round and another 12 operate for 5 or more months. Two of these are mega ships (over 3,500 passenger capacity) and 17 are large (2,000 to 3,500). In 2013 there were but 43 ships cruising in Asia.
These ships are providing 1,473 cruises and a further 87 voyages in 2016, 43% more sailings than in 2015. The 3-year compound annual growth in number of cruises since 2013 is 22.5% (excluding voyages).
The operators fall into four distinct tiers:
1. Four cruise lines operate over 100 sailings, 71% of the industry total in 2016
2. Six lines offer over 20 sailings, 17% of the total
3. Eleven lines offer between 9 and 20 (9%)
4. And the remaining ten, 8 sailings or less (2%).
Passenger capacity
The industry is generating capacity for 3.2 million passengers to cruise in Asia in 2016 (3.1 m on Asia cruises, 124,360 on voyages passing through Asia).
The 3.1m passenger capacity on Asian cruises is 54% more than in 2015 and represents a 3-year CAGR of 29% since 2013.
7
Capacity: 2016 Picture
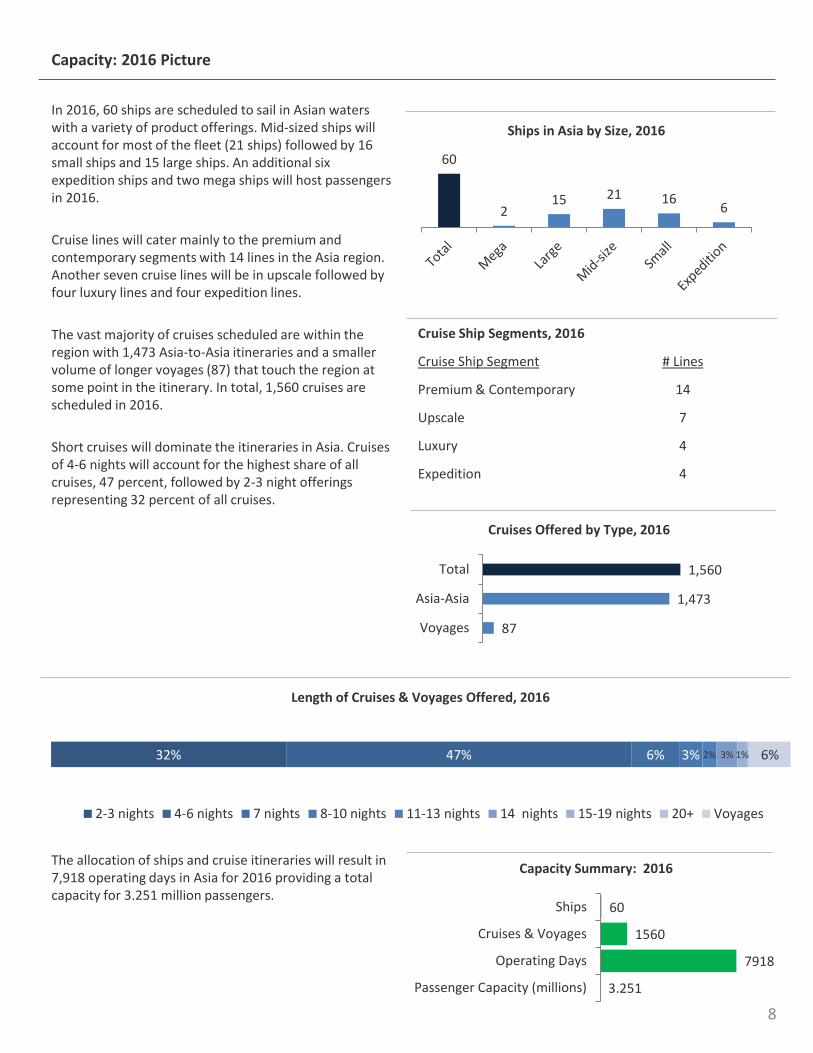
In 2016, 60 ships are scheduled to sail in Asian waters with a variety of product offerings. Mid-sized ships will account for most of the fleet (21 ships) followed by 16 small ships and 15 large ships. An additional six expedition ships and two mega ships will host passengers in 2016.
Cruise lines will cater mainly to the premium and contemporary segments with 14 lines in the Asia region. Another seven cruise lines will be in upscale followed by four luxury lines and four expedition lines.
The vast majority of cruises scheduled are within the region with 1,473 Asia-to-Asia itineraries and a smaller volume of longer voyages (87) that touch the region at some point in the itinerary. In total, 1,560 cruises are scheduled in 2016.
Short cruises will dominate the itineraries in Asia. Cruises of 4-6 nights will account for the highest share of all cruises, 47 percent, followed by 2-3 night offerings representing 32 percent of all cruises.
Cruise Ship Segments, 2016
Cruise Ship Segment # Lines
Premium & Contemporary 14
Upscale 7
Luxury 4
Expedition 4
60
215 21 16
6
Ships in Asia by Size, 2016
87
1,473
1,560
Voyages
Asia-Asia
Total
Cruises Offered by Type, 2016
32% 47% 6% 3% 2% 3% 1% 6%
Length of Cruises & Voyages Offered, 2016
2-3 nights 4-6 nights 7 nights 8-10 nights 11-13 nights 14 nights 15-19 nights 20+ Voyages
The allocation of ships and cruise itineraries will result in 7,918 operating days in Asia for 2016 providing a total capacity for 3.251 million passengers.
8
60
1560
7918
3.251
Ships
Cruises & Voyages
Operating Days
Passenger Capacity (millions)
Capacity Summary: 2016
Capacity: Trends
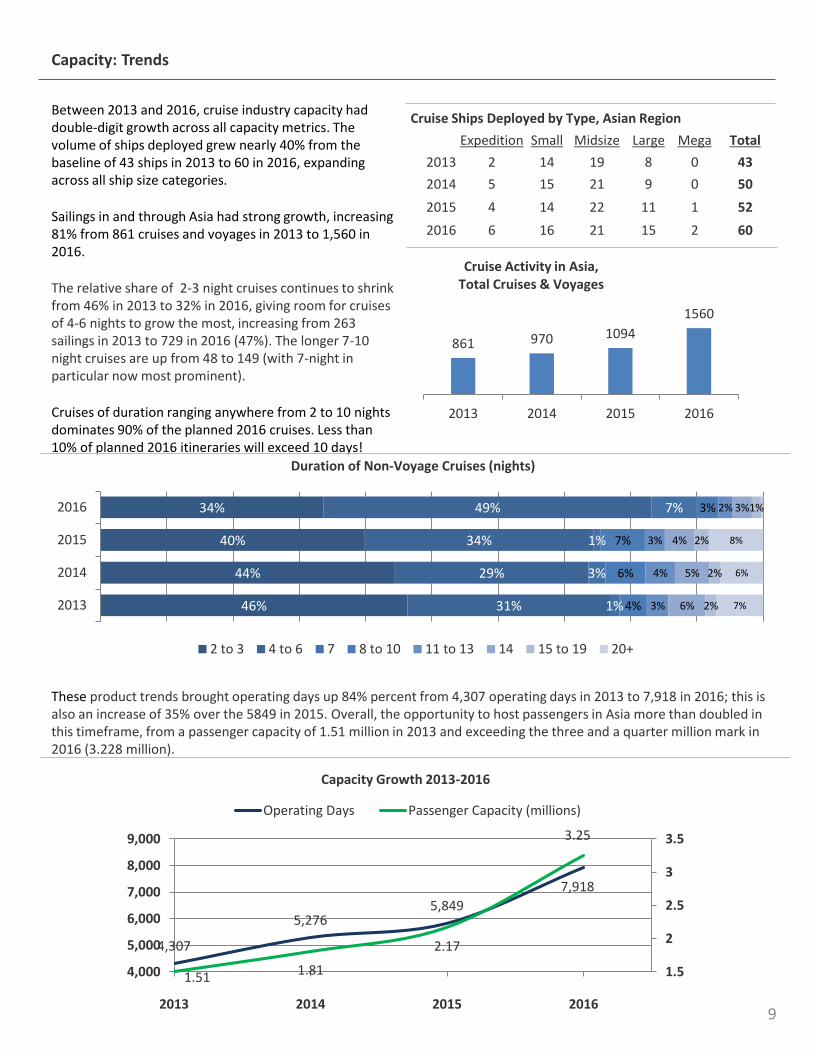
Between 2013 and 2016, cruise industry capacity had double-digit growth across all capacity metrics. The volume of ships deployed grew nearly 40% from the baseline of 43 ships in 2013 to 60 in 2016, expanding across all ship size categories.
Sailings in and through Asia had strong growth, increasing 81% from 861 cruises and voyages in 2013 to 1,560 in 2016.
The relative share of 2-3 night cruises continues to shrink from 46% in 2013 to 32% in 2016, giving room for cruises of 4-6 nights to grow the most, increasing from 263 sailings in 2013 to 729 in 2016 (47%). The longer 7-10 night cruises are up from 48 to 149 (with 7-night in particular now most prominent).
Cruises of duration ranging anywhere from 2 to 10 nights dominates 90% of the planned 2016 cruises. Less than 10% of planned 2016 itineraries will exceed 10 days!
These product trends brought operating days up 84% percent from 4,307 operating days in 2013 to 7,918 in 2016; this is also an increase of 35% over the 5849 in 2015. Overall, the opportunity to host passengers in Asia more than doubled in this timeframe, from a passenger capacity of 1.51 million in 2013 and exceeding the three and a quarter million mark in 2016 (3.228 million).
Cruise Ships Deployed by Type, Asian Region
Expedition Small Midsize Large Mega Total
2013 2 14 19 8 0 43
2014 5 15 21 9 0 50
2015 4 14 22 11 1 52
2016 6 16 21 15 2 60
861 970 1094
1560
2013 2014 2015 2016
Cruise Activity in Asia, Total Cruises & Voyages
46%
44%
40%
34%
31%
29%
34%
49%
1%
3%
1%
7%
4%
6%
7%
3%
3%
4%
3%
2%
6%
5%
4%
3%
2%
2%
2%
1%
7%
6%
8%
2013
2014
2015
2016
Duration of Non-Voyage Cruises (nights)
2 to 3 4 to 6 7 8 to 10 11 to 13 14 15 to 19 20+
9
4,307
5,2765,849
7,918
1.51 1.81
2.17
3.25
1.5
2
2.5
3
3.5
4,000
5,000
6,000
7,000
8,000
9,000
2013 2014 2015 2016
Capacity Growth 2013-2016
Operating Days Passenger Capacity (millions)
CRUISE DESTINATIONS
The expansion of cruise capacity naturally impacts the volume of visits across destinations in Asia. In 2016, 5,570 port calls are being made in the region, 1,674 or 43% more than last year.
Destinations especially benefiting from this trend are three in East Asia: Japan, with 880 more calls, mainland China with 550 more and South Korea with an increase of 368 over 2015 levels. In Southeast Asia there is good growth in Vietnam with 150 more calls this year.
Sixteen Asian ports will host over 100 calls each in 2016.
In fact, 204 different destinations in Asia will receive cruise ships in 2016; 116 in East Asia, 75 in Southeast Asia and 13 in South Asia.
All this activity in 2016 will naturally have a powerful tourism impact, bringing passengers to destinations across the region. With the combination of more and larger ships, added cruises and multiple port call visits, the cruise industry will bring 10.9 million passenger destination days to localities across Asia. This will be 3.9 million or 55% more than in 2015.
10
Cruise Destinations: Regional Overview, Continued
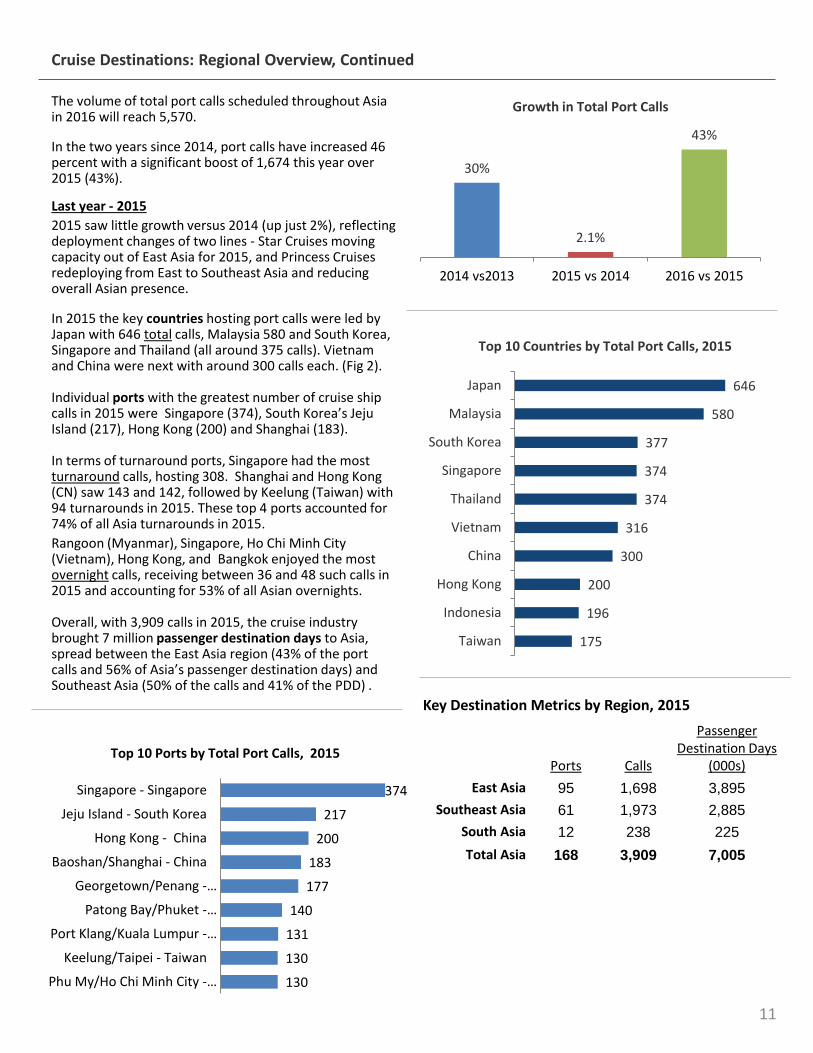
The volume of total port calls scheduled throughout Asia in 2016 will reach 5,570.
In the two years since 2014, port calls have increased 46 percent with a significant boost of 1,674 this year over 2015 (43%).
Last year - 2015
2015 saw little growth versus 2014 (up just 2%), reflecting deployment changes of two lines - Star Cruises moving capacity out of East Asia for 2015, and Princess Cruises redeploying from East to Southeast Asia and reducing overall Asian presence.
In 2015 the key countries hosting port calls were led by Japan with 646 total calls, Malaysia 580 and South Korea, Singapore and Thailand (all around 375 calls). Vietnam and China were next with around 300 calls each. (Fig 2).
Individual ports with the greatest number of cruise ship calls in 2015 were Singapore (374), South Korea’s Jeju Island (217), Hong Kong (200) and Shanghai (183).
In terms of turnaround ports, Singapore had the most turnaround calls, hosting 308. Shanghai and Hong Kong (CN) saw 143 and 142, followed by Keelung (Taiwan) with 94 turnarounds in 2015. These top 4 ports accounted for 74% of all Asia turnarounds in 2015.
Rangoon (Myanmar), Singapore, Ho Chi Minh City (Vietnam), Hong Kong, and Bangkok enjoyed the most overnight calls, receiving between 36 and 48 such calls in 2015 and accounting for 53% of all Asian overnights.
Overall, with 3,909 calls in 2015, the cruise industry brought 7 million passenger destination days to Asia, spread between the East Asia region (43% of the port calls and 56% of Asia’s passenger destination days) and Southeast Asia (50% of the calls and 41% of the PDD) .
30%
2.1%
43%
2014 vs2013 2015 vs 2014 2016 vs 2015
Growth in Total Port Calls
Key Destination Metrics by Region, 2015
Ports Calls
Passenger Destination Days
(000s)
East Asia 95 1,698 3,895
Southeast Asia 61 1,973 2,885
South Asia 12 238 225
Total Asia 168 3,909 7,005
11
175
196
200
300
316
374
374
377
580
646
Taiwan
Indonesia
Hong Kong
China
Vietnam
Thailand
Singapore
South Korea
Malaysia
Japan
Top 10 Countries by Total Port Calls, 2015
130
130
131
140
177
183
200
217
374
Phu My/Ho Chi Minh City -…
Keelung/Taipei - Taiwan
Port Klang/Kuala Lumpur -…
Patong Bay/Phuket -…
Georgetown/Penang -…
Baoshan/Shanghai - China
Hong Kong - China
Jeju Island - South Korea
Singapore - Singapore
Top 10 Ports by Total Port Calls, 2015
Cruise Destinations: Regional Overview
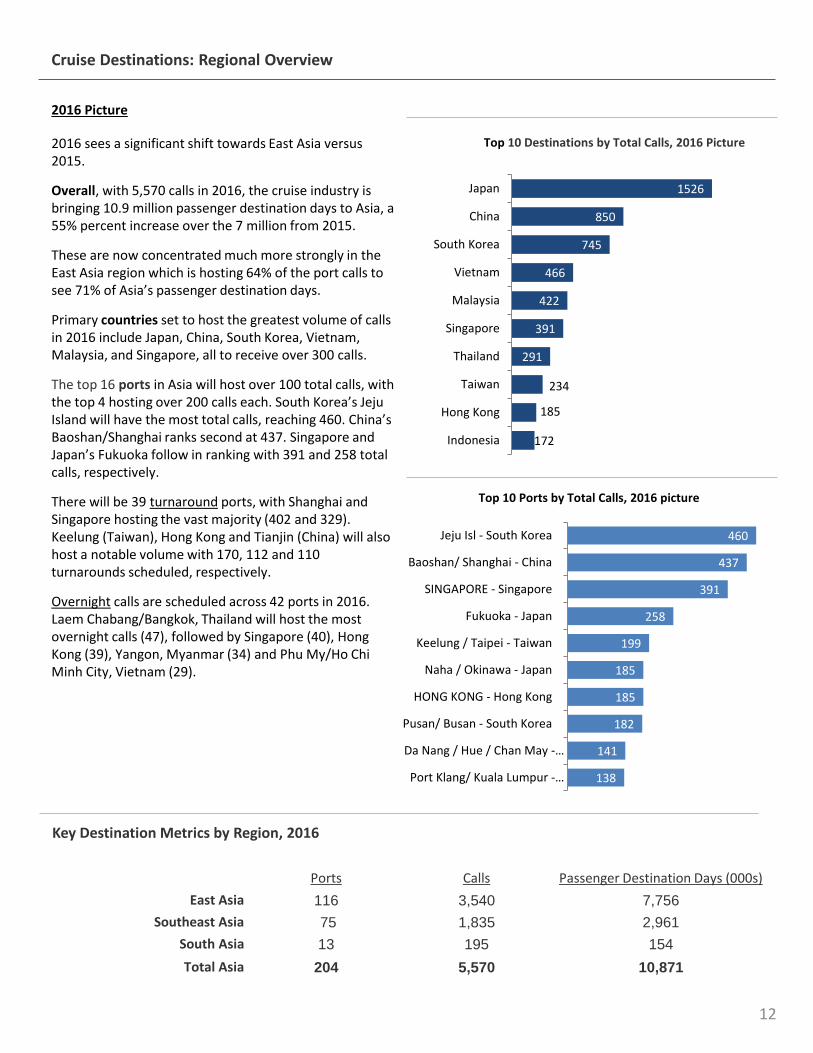
2016 Picture
2016 sees a significant shift towards East Asia versus 2015.
Overall, with 5,570 calls in 2016, the cruise industry is bringing 10.9 million passenger destination days to Asia, a 55% percent increase over the 7 million from 2015.
These are now concentrated much more strongly in the East Asia region which is hosting 64% of the port calls to see 71% of Asia’s passenger destination days.
Primary countries set to host the greatest volume of calls in 2016 include Japan, China, South Korea, Vietnam, Malaysia, and Singapore, all to receive over 300 calls.
The top 16 ports in Asia will host over 100 total calls, with the top 4 hosting over 200 calls each. South Korea’s JejuIsland will have the most total calls, reaching 460. China’s Baoshan/Shanghai ranks second at 437. Singapore and Japan’s Fukuoka follow in ranking with 391 and 258 total calls, respectively.
There will be 39 turnaround ports, with Shanghai and Singapore hosting the vast majority (402 and 329). Keelung (Taiwan), Hong Kong and Tianjin (China) will also host a notable volume with 170, 112 and 110 turnarounds scheduled, respectively.
Overnight calls are scheduled across 42 ports in 2016. Laem Chabang/Bangkok, Thailand will host the most overnight calls (47), followed by Singapore (40), Hong Kong (39), Yangon, Myanmar (34) and Phu My/Ho Chi Minh City, Vietnam (29).
Key Destination Metrics by Region, 2016
Ports Calls Passenger Destination Days (000s)
East Asia 116 3,540 7,756
Southeast Asia 75 1,835 2,961
South Asia 13 195 154
Total Asia 204 5,570 10,871
12
460
437
391
258
199
185
185
182
141
138
Jeju Isl - South Korea
Baoshan/ Shanghai - China
SINGAPORE - Singapore
Fukuoka - Japan
Keelung / Taipei - Taiwan
Naha / Okinawa - Japan
HONG KONG - Hong Kong
Pusan/ Busan - South Korea
Da Nang / Hue / Chan May -…
Port Klang/ Kuala Lumpur -…
Top 10 Ports by Total Calls, 2016 picture
1526
850
745
466
422
391
291
234
185
172
Japan
China
South Korea
Vietnam
Malaysia
Singapore
Thailand
Taiwan
Hong Kong
Indonesia
Top 10 Destinations by Total Calls, 2016 Picture
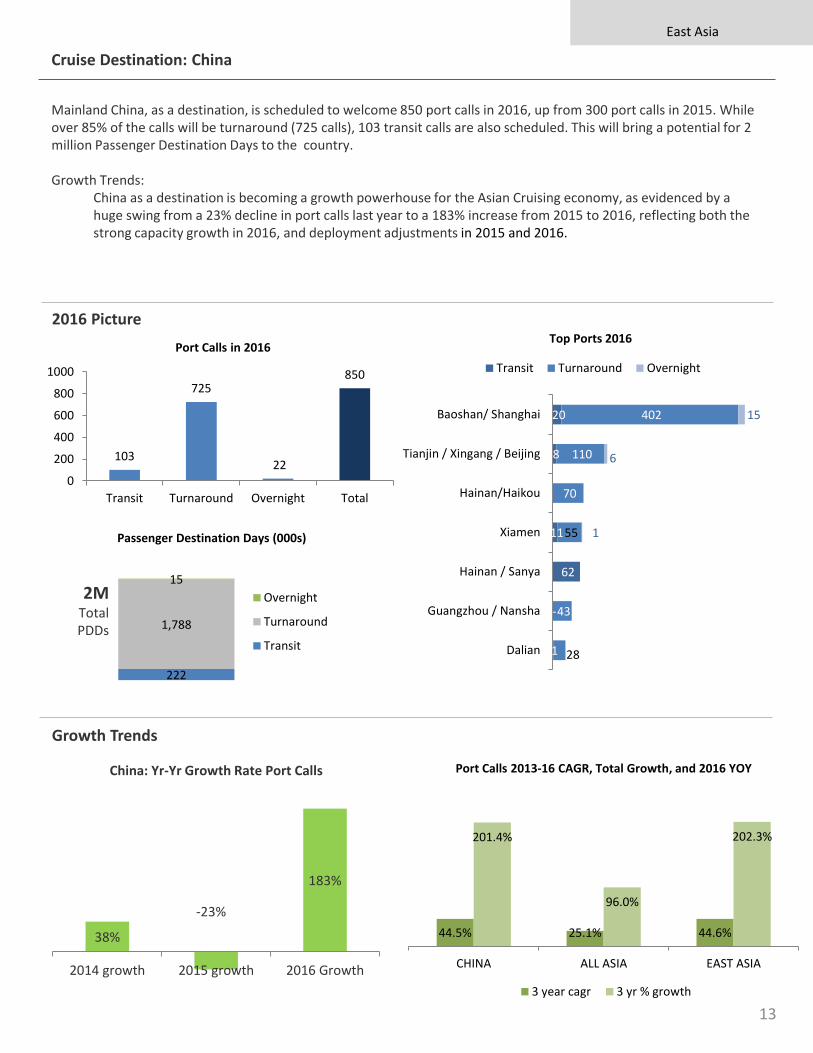
Mainland China, as a destination, is scheduled to welcome 850 port calls in 2016, up from 300 port calls in 2015. While over 85% of the calls will be turnaround (725 calls), 103 transit calls are also scheduled. This will bring a potential for 2million Passenger Destination Days to the country.
Growth Trends:China as a destination is becoming a growth powerhouse for the Asian Cruising economy, as evidenced by a huge swing from a 23% decline in port calls last year to a 183% increase from 2015 to 2016, reflecting both the strong capacity growth in 2016, and deployment adjustments in 2015 and 2016.
38%
-23%
183%
2014 growth 2015 growth 2016 Growth
China: Yr-Yr Growth Rate Port Calls
Cruise Destination: China
East Asia
Growth Trends
2016 Picture
13
20
8
11
62
-
1
402
110
70
55
-
43
28
15
6
1
Baoshan/ Shanghai
Tianjin / Xingang / Beijing
Hainan/Haikou
Xiamen
Hainan / Sanya
Guangzhou / Nansha
Dalian
Top Ports 2016
Transit Turnaround Overnight
44.5% 25.1% 44.6%
201.4%
96.0%
202.3%
CHINA ALL ASIA EAST ASIA
Port Calls 2013-16 CAGR, Total Growth, and 2016 YOY
3 year cagr 3 yr % growth
2MTotal PDDs
103
725
22
850
0
200
400
600
800
1000
Transit Turnaround Overnight Total
Port Calls in 2016
222
1,788
15
Passenger Destination Days (000s)
Overnight
Turnaround
Transit
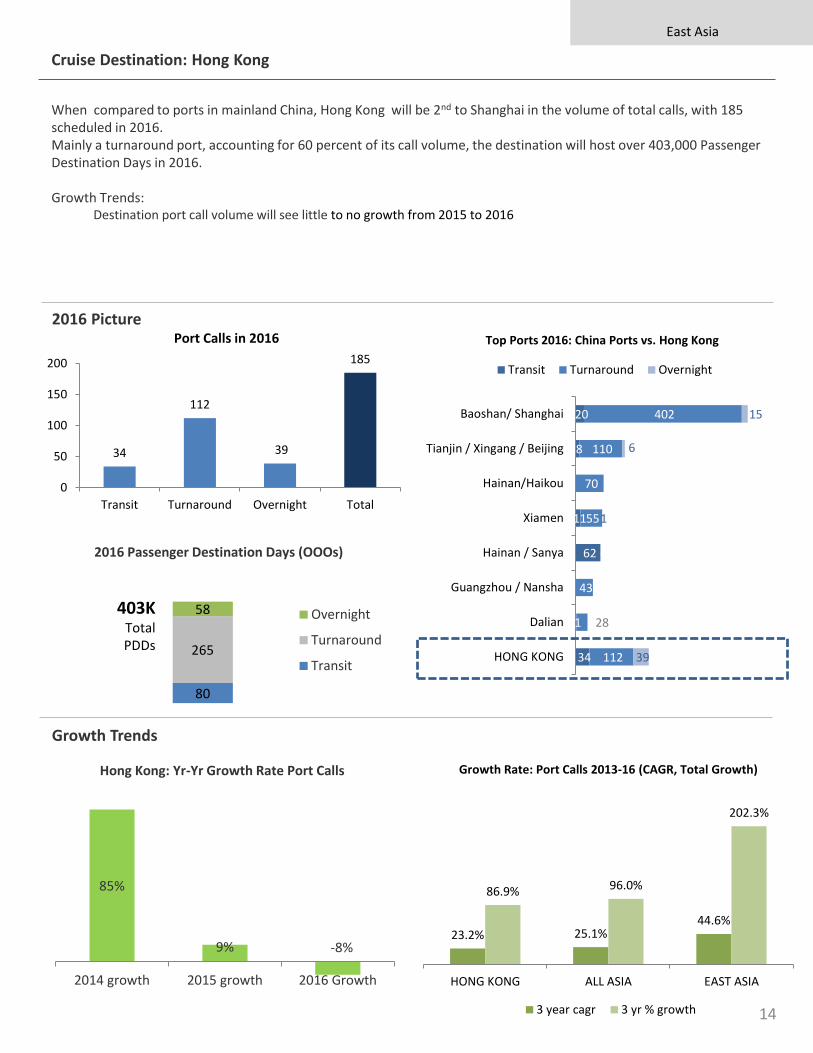
When compared to ports in mainland China, Hong Kong will be 2nd to Shanghai in the volume of total calls, with 185 scheduled in 2016.Mainly a turnaround port, accounting for 60 percent of its call volume, the destination will host over 403,000 Passenger Destination Days in 2016.
Growth Trends:Destination port call volume will see little to no growth from 2015 to 2016
80
265
58
2016 Passenger Destination Days (OOOs)
Overnight
Turnaround
Transit
403KTotal PDDs
East Asia
85%
9% -8%
2014 growth 2015 growth 2016 Growth
Hong Kong: Yr-Yr Growth Rate Port Calls
Cruise Destination: Hong Kong
Growth Trends
2016 Picture
14
34
112
39
185
0
50
100
150
200
Transit Turnaround Overnight Total
Port Calls in 2016
20
8
11
62
1
34
402
110
70
55
-
43
28
112
15
6
1
39
Baoshan/ Shanghai
Tianjin / Xingang / Beijing
Hainan/Haikou
Xiamen
Hainan / Sanya
Guangzhou / Nansha
Dalian
HONG KONG
Top Ports 2016: China Ports vs. Hong Kong
Transit Turnaround Overnight
23.2% 25.1%44.6%
86.9% 96.0%
202.3%
HONG KONG ALL ASIA EAST ASIA
Growth Rate: Port Calls 2013-16 (CAGR, Total Growth)
3 year cagr 3 yr % growth
Cruise Destination: Japan
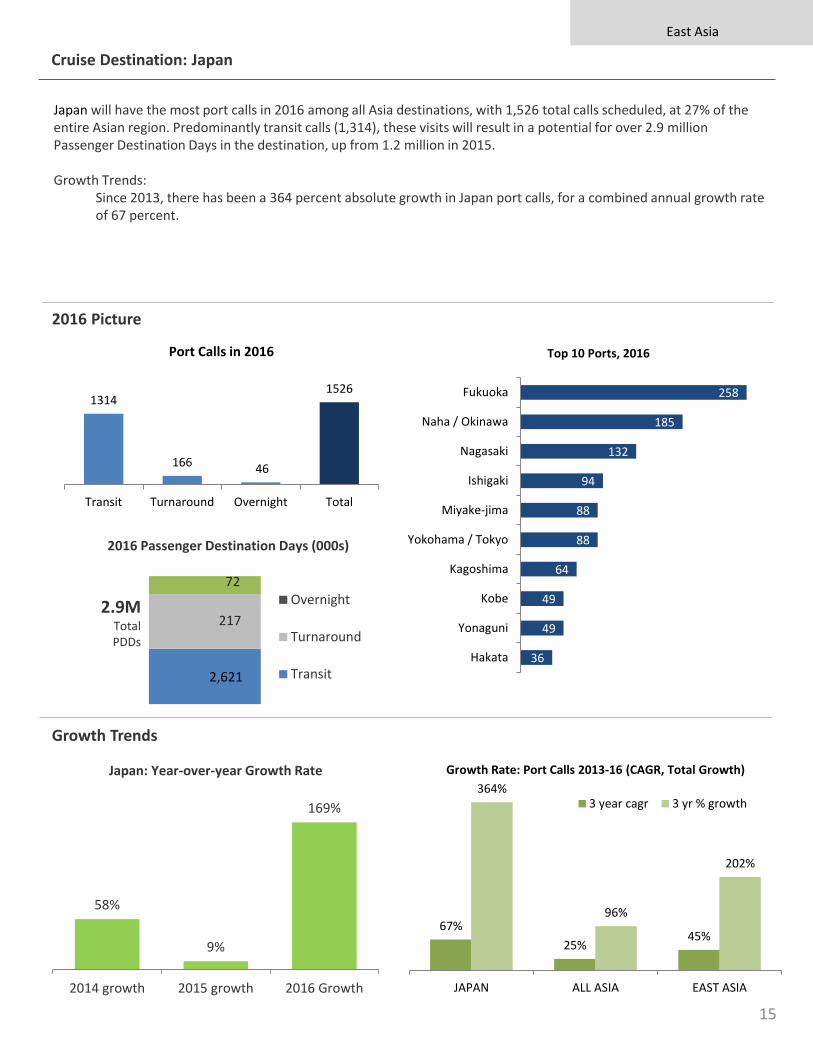
Japan will have the most port calls in 2016 among all Asia destinations, with 1,526 total calls scheduled, at 27% of the entire Asian region. Predominantly transit calls (1,314), these visits will result in a potential for over 2.9 million Passenger Destination Days in the destination, up from 1.2 million in 2015.
Growth Trends:Since 2013, there has been a 364 percent absolute growth in Japan port calls, for a combined annual growth rate of 67 percent.
2,621
217
72
2016 Passenger Destination Days (000s)
Overnight
Turnaround
Transit
2.9MTotal PDDs
58%
9%
169%
2014 growth 2015 growth 2016 Growth
Japan: Year-over-year Growth Rate
Growth Trends
2016 Picture
East Asia
15
1314
166 46
1526
Transit Turnaround Overnight Total
Port Calls in 2016
67%
25%45%
364%
96%
202%
JAPAN ALL ASIA EAST ASIA
Growth Rate: Port Calls 2013-16 (CAGR, Total Growth)
3 year cagr 3 yr % growth
258
185
132
94
88
88
64
49
49
36
Fukuoka
Naha / Okinawa
Nagasaki
Ishigaki
Miyake-jima
Yokohama / Tokyo
Kagoshima
Kobe
Yonaguni
Hakata
Top 10 Ports, 2016
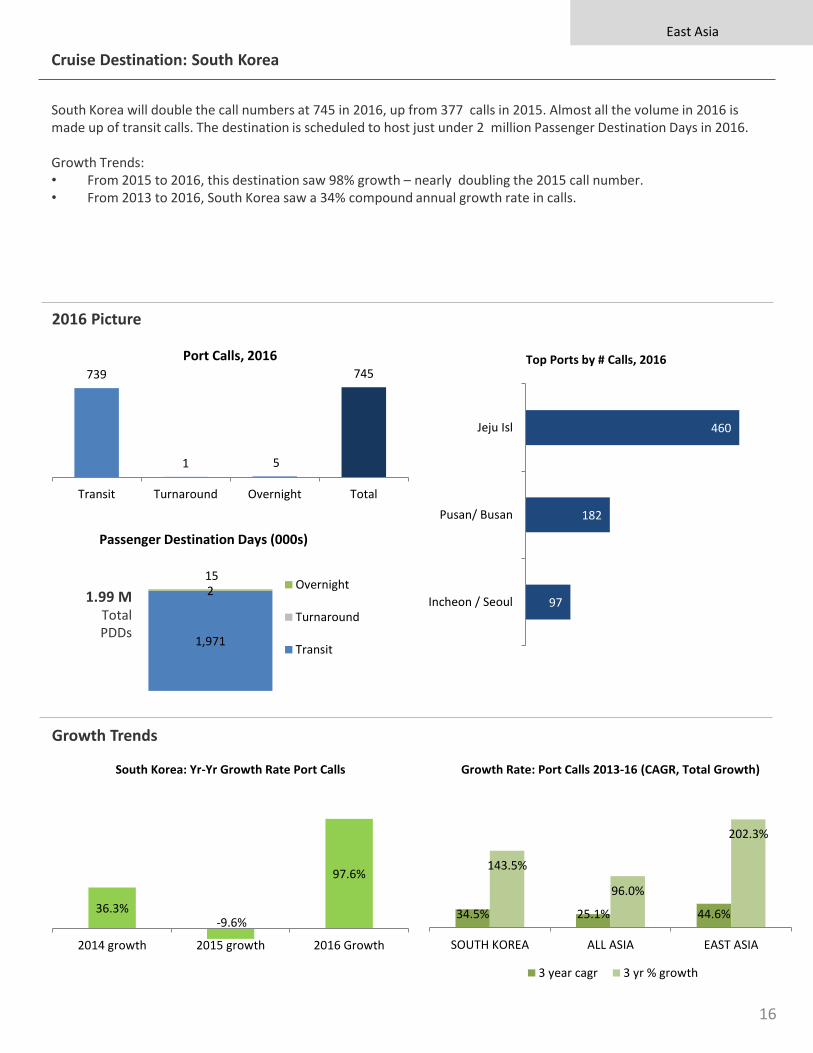
South Korea will double the call numbers at 745 in 2016, up from 377 calls in 2015. Almost all the volume in 2016 is made up of transit calls. The destination is scheduled to host just under 2 million Passenger Destination Days in 2016.
Growth Trends:• From 2015 to 2016, this destination saw 98% growth – nearly doubling the 2015 call number. • From 2013 to 2016, South Korea saw a 34% compound annual growth rate in calls.
Cruise Destination: South Korea
East Asia
Growth Trends
2016 Picture
16
739
1 5
745
Transit Turnaround Overnight Total
Port Calls, 2016
460
182
97
Jeju Isl
Pusan/ Busan
Incheon / Seoul
Top Ports by # Calls, 2016
1,971
215
Passenger Destination Days (000s)
Overnight
Turnaround
Transit
1.99 MTotal PDDs
34.5% 25.1% 44.6%
143.5%
96.0%
202.3%
SOUTH KOREA ALL ASIA EAST ASIA
Growth Rate: Port Calls 2013-16 (CAGR, Total Growth)
3 year cagr 3 yr % growth
36.3%-9.6%
97.6%
2014 growth 2015 growth 2016 Growth
South Korea: Yr-Yr Growth Rate Port Calls
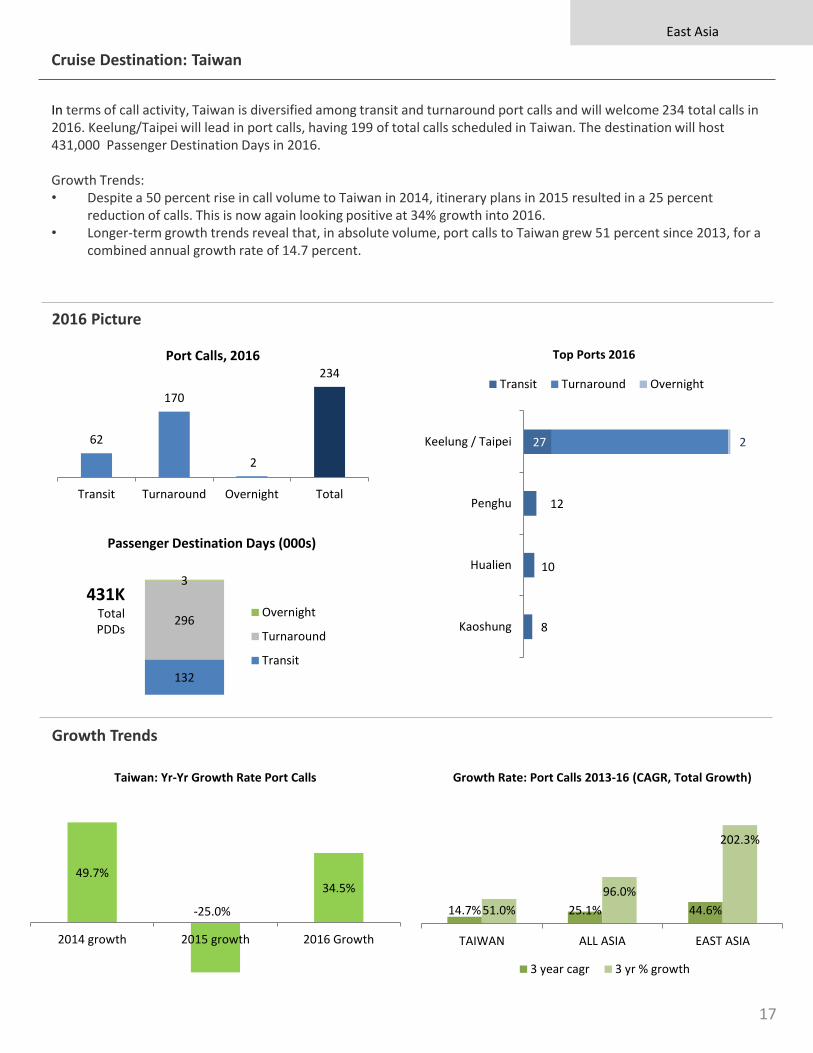
In terms of call activity, Taiwan is diversified among transit and turnaround port calls and will welcome 234 total calls in 2016. Keelung/Taipei will lead in port calls, having 199 of total calls scheduled in Taiwan. The destination will host 431,000 Passenger Destination Days in 2016.
Growth Trends:• Despite a 50 percent rise in call volume to Taiwan in 2014, itinerary plans in 2015 resulted in a 25 percent
reduction of calls. This is now again looking positive at 34% growth into 2016.• Longer-term growth trends reveal that, in absolute volume, port calls to Taiwan grew 51 percent since 2013, for a
combined annual growth rate of 14.7 percent.
Cruise Destination: Taiwan
East Asia
Growth Trends
2016 Picture
17
62
170
2
234
Transit Turnaround Overnight Total
Port Calls, 2016
27
12
10
8
2 Keelung / Taipei
Penghu
Hualien
Kaoshung
Top Ports 2016
Transit Turnaround Overnight
132
296
3
Passenger Destination Days (000s)
Overnight
Turnaround
Transit
431KTotal PDDs
49.7%
-25.0%
34.5%
2014 growth 2015 growth 2016 Growth
Taiwan: Yr-Yr Growth Rate Port Calls
14.7% 25.1% 44.6%51.0%
96.0%
202.3%
TAIWAN ALL ASIA EAST ASIA
Growth Rate: Port Calls 2013-16 (CAGR, Total Growth)
3 year cagr 3 yr % growth
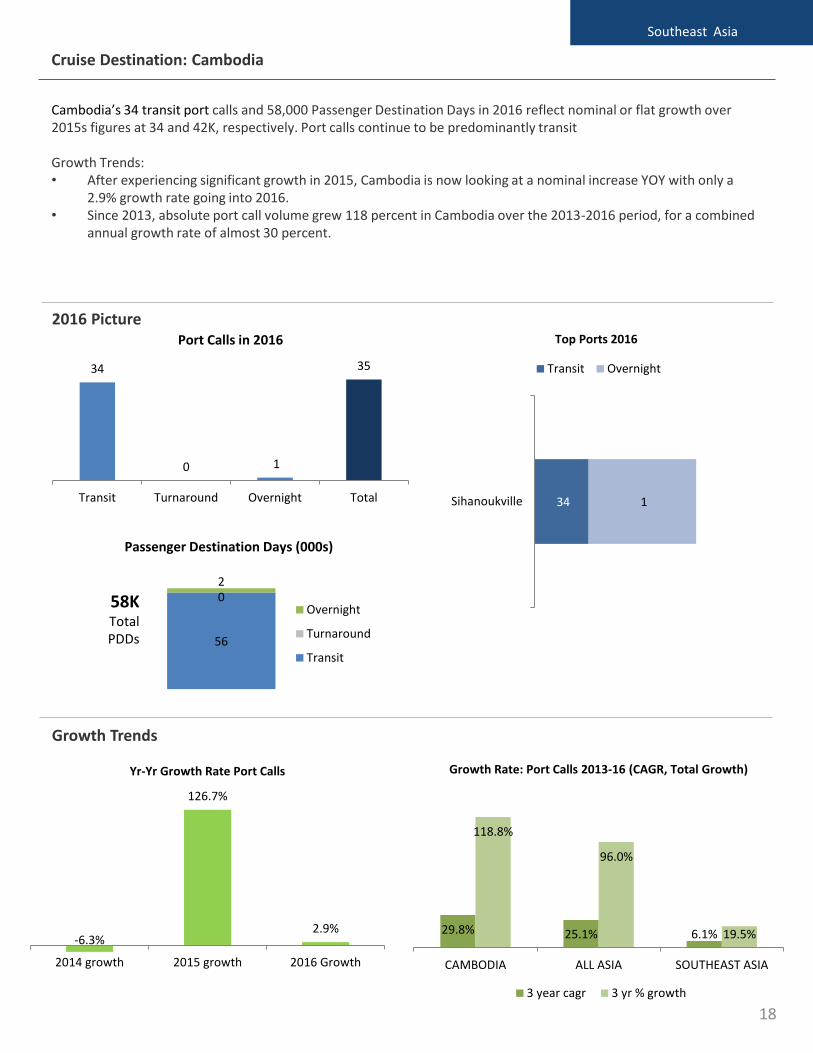
Cambodia’s 34 transit port calls and 58,000 Passenger Destination Days in 2016 reflect nominal or flat growth over 2015s figures at 34 and 42K, respectively. Port calls continue to be predominantly transit
Growth Trends:• After experiencing significant growth in 2015, Cambodia is now looking at a nominal increase YOY with only a
2.9% growth rate going into 2016.• Since 2013, absolute port call volume grew 118 percent in Cambodia over the 2013-2016 period, for a combined
annual growth rate of almost 30 percent.
Cruise Destination: Cambodia
Southeast Asia
Growth Trends
2016 Picture
18
-6.3%
126.7%
2.9%
2014 growth 2015 growth 2016 Growth
Yr-Yr Growth Rate Port Calls
29.8% 25.1% 6.1%
118.8%
96.0%
19.5%
CAMBODIA ALL ASIA SOUTHEAST ASIA
Growth Rate: Port Calls 2013-16 (CAGR, Total Growth)
3 year cagr 3 yr % growth
34
0 1
35
Transit Turnaround Overnight Total
Port Calls in 2016
34 1 Sihanoukville
Top Ports 2016
Transit Overnight
56
02
Passenger Destination Days (000s)
Overnight
Turnaround
Transit
58KTotal PDDs
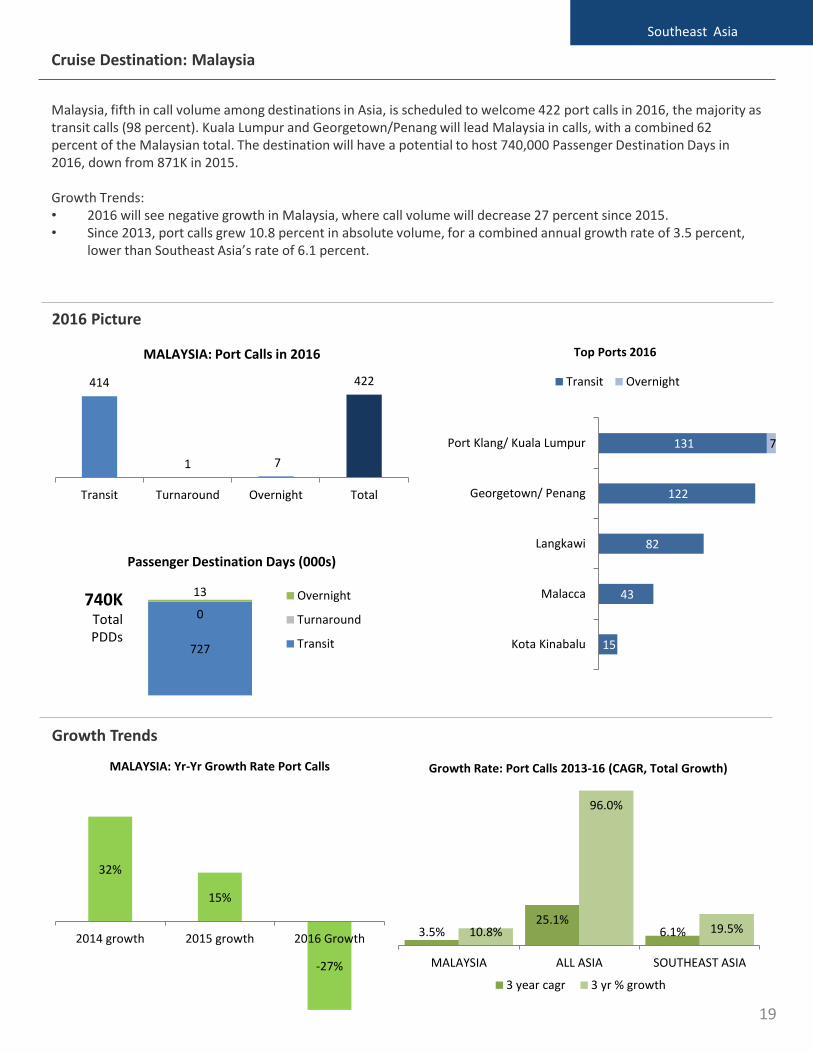
Malaysia, fifth in call volume among destinations in Asia, is scheduled to welcome 422 port calls in 2016, the majority as transit calls (98 percent). Kuala Lumpur and Georgetown/Penang will lead Malaysia in calls, with a combined 62 percent of the Malaysian total. The destination will have a potential to host 740,000 Passenger Destination Days in 2016, down from 871K in 2015.
Growth Trends:• 2016 will see negative growth in Malaysia, where call volume will decrease 27 percent since 2015.• Since 2013, port calls grew 10.8 percent in absolute volume, for a combined annual growth rate of 3.5 percent,
lower than Southeast Asia’s rate of 6.1 percent.
Cruise Destination: Malaysia
Southeast Asia
Growth Trends
2016 Picture
19
414
1 7
422
Transit Turnaround Overnight Total
MALAYSIA: Port Calls in 2016
131
122
82
43
15
7 Port Klang/ Kuala Lumpur
Georgetown/ Penang
Langkawi
Malacca
Kota Kinabalu
Top Ports 2016
Transit Overnight
727
0
13
Passenger Destination Days (000s)
Overnight
Turnaround
Transit
740KTotal PDDs
3.5%25.1%
6.1%10.8%
96.0%
19.5%
MALAYSIA ALL ASIA SOUTHEAST ASIA
Growth Rate: Port Calls 2013-16 (CAGR, Total Growth)
3 year cagr 3 yr % growth
32%
15%
-27%
2014 growth 2015 growth 2016 Growth
MALAYSIA: Yr-Yr Growth Rate Port Calls
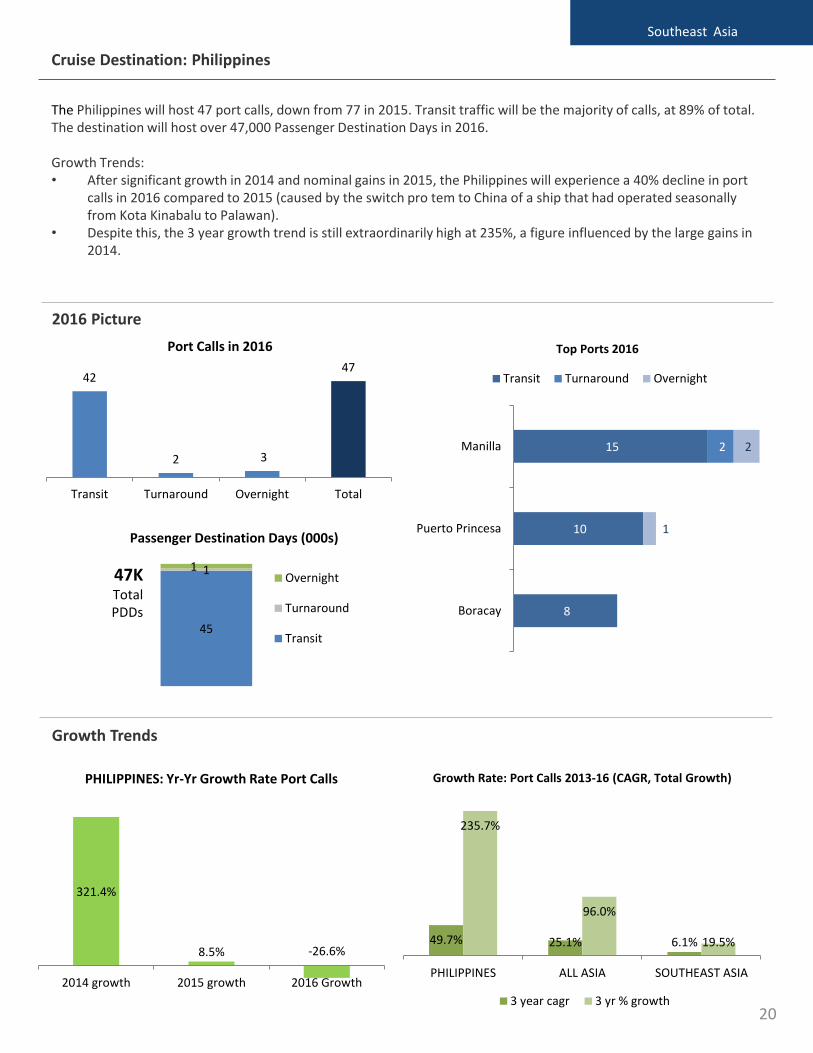
The Philippines will host 47 port calls, down from 77 in 2015. Transit traffic will be the majority of calls, at 89% of total. The destination will host over 47,000 Passenger Destination Days in 2016.
Growth Trends:• After significant growth in 2014 and nominal gains in 2015, the Philippines will experience a 40% decline in port
calls in 2016 compared to 2015 (caused by the switch pro tem to China of a ship that had operated seasonally from Kota Kinabalu to Palawan).
• Despite this, the 3 year growth trend is still extraordinarily high at 235%, a figure influenced by the large gains in 2014.
Cruise Destination: Philippines
Southeast Asia
Growth Trends
2016 Picture
20
42
2 3
47
Transit Turnaround Overnight Total
Port Calls in 2016
15
10
8
2 2
1
Manilla
Puerto Princesa
Boracay
Top Ports 2016
Transit Turnaround Overnight
45
11
Passenger Destination Days (000s)
Overnight
Turnaround
Transit
47KTotalPDDs
321.4%
8.5% -26.6%
2014 growth 2015 growth 2016 Growth
PHILIPPINES: Yr-Yr Growth Rate Port Calls
49.7% 25.1% 6.1%
235.7%
96.0%
19.5%
PHILIPPINES ALL ASIA SOUTHEAST ASIA
Growth Rate: Port Calls 2013-16 (CAGR, Total Growth)
3 year cagr 3 yr % growth
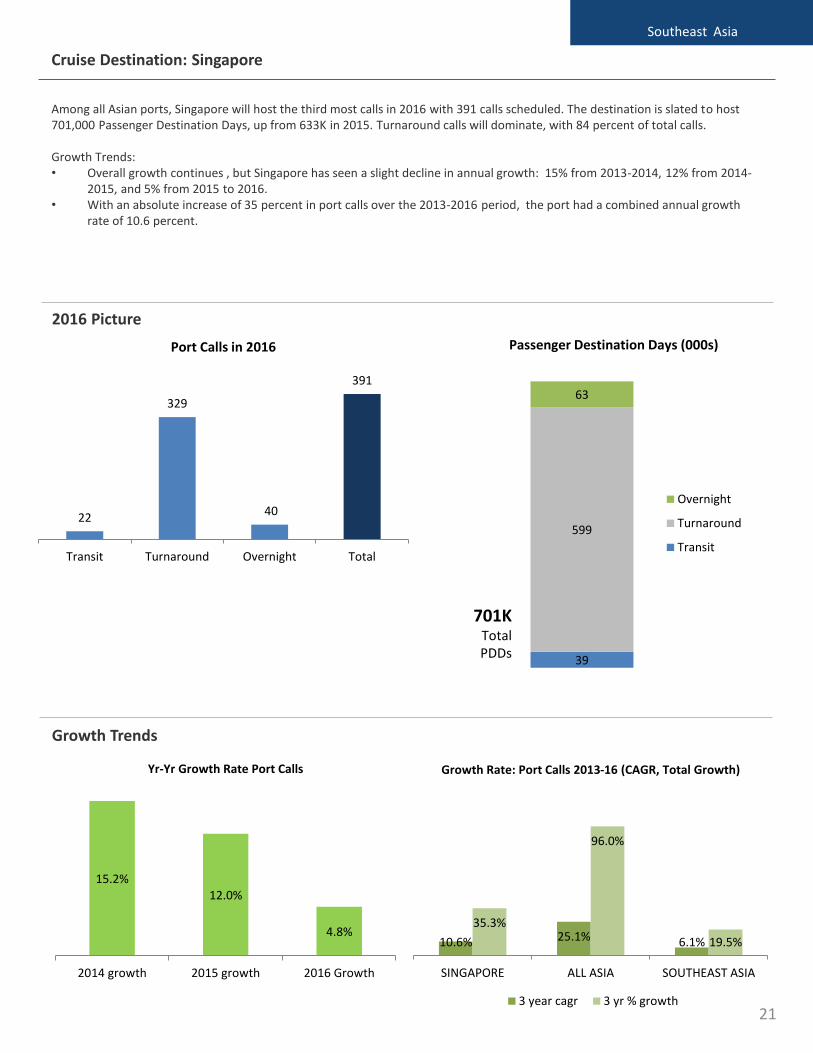
Among all Asian ports, Singapore will host the third most calls in 2016 with 391 calls scheduled. The destination is slated to host 701,000 Passenger Destination Days, up from 633K in 2015. Turnaround calls will dominate, with 84 percent of total calls.
Growth Trends:• Overall growth continues , but Singapore has seen a slight decline in annual growth: 15% from 2013-2014, 12% from 2014-
2015, and 5% from 2015 to 2016.• With an absolute increase of 35 percent in port calls over the 2013-2016 period, the port had a combined annual growth
rate of 10.6 percent.
701KTotal PDDs
Cruise Destination: Singapore
Southeast Asia
Growth Trends
2016 Picture
21
22
329
40
391
Transit Turnaround Overnight Total
Port Calls in 2016
39
599
63
Passenger Destination Days (000s)
Overnight
Turnaround
Transit
15.2%12.0%
4.8%
2014 growth 2015 growth 2016 Growth
Yr-Yr Growth Rate Port Calls
10.6% 25.1% 6.1%
35.3%
96.0%
19.5%
SINGAPORE ALL ASIA SOUTHEAST ASIA
Growth Rate: Port Calls 2013-16 (CAGR, Total Growth)
3 year cagr 3 yr % growth
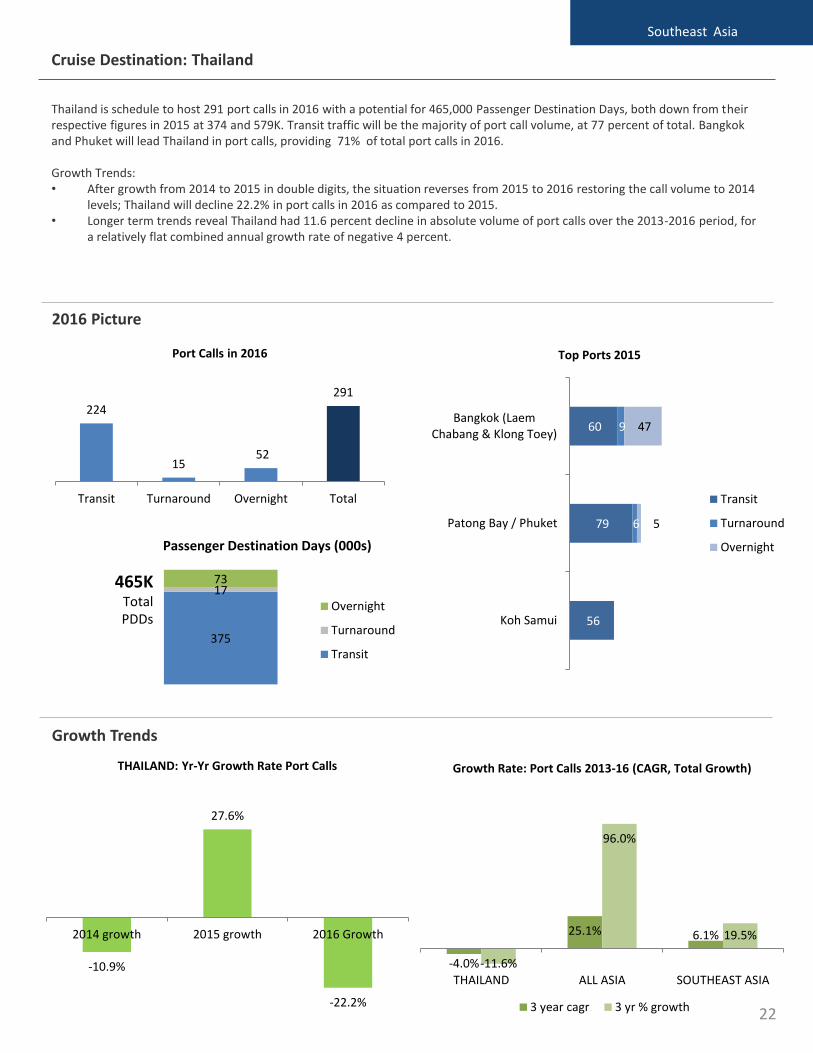
Thailand is schedule to host 291 port calls in 2016 with a potential for 465,000 Passenger Destination Days, both down from their respective figures in 2015 at 374 and 579K. Transit traffic will be the majority of port call volume, at 77 percent of total. Bangkok and Phuket will lead Thailand in port calls, providing 71% of total port calls in 2016.
Growth Trends:• After growth from 2014 to 2015 in double digits, the situation reverses from 2015 to 2016 restoring the call volume to 2014
levels; Thailand will decline 22.2% in port calls in 2016 as compared to 2015.• Longer term trends reveal Thailand had 11.6 percent decline in absolute volume of port calls over the 2013-2016 period, for
a relatively flat combined annual growth rate of negative 4 percent.
Cruise Destination: Thailand
Southeast Asia
Growth Trends
2016 Picture
22
224
1552
291
Transit Turnaround Overnight Total
Port Calls in 2016
375
1773
Passenger Destination Days (000s)
Overnight
Turnaround
Transit
465KTotal PDDs
-4.0%
25.1% 6.1%
-11.6%
96.0%
19.5%
THAILAND ALL ASIA SOUTHEAST ASIA
Growth Rate: Port Calls 2013-16 (CAGR, Total Growth)
3 year cagr 3 yr % growth
-10.9%
27.6%
-22.2%
2014 growth 2015 growth 2016 Growth
THAILAND: Yr-Yr Growth Rate Port Calls
60
79
56
9
6
47
5
Bangkok (LaemChabang & Klong Toey)
Patong Bay / Phuket
Koh Samui
Top Ports 2015
Transit
Turnaround
Overnight
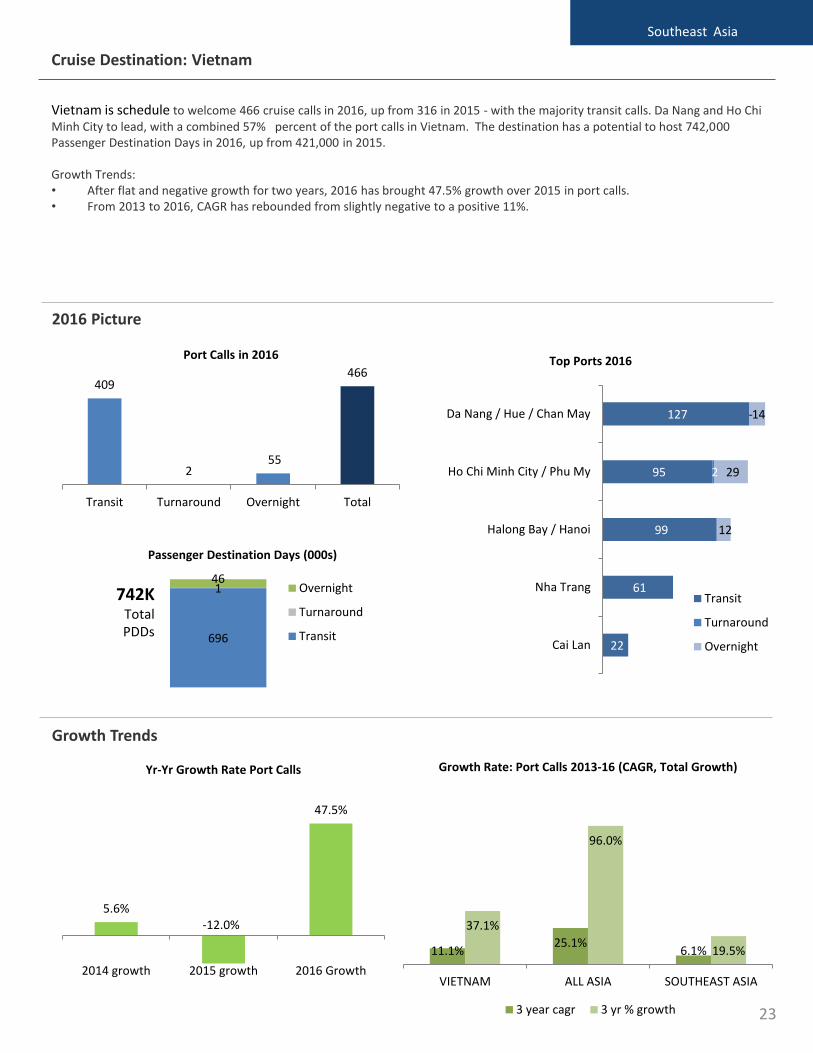
Vietnam is schedule to welcome 466 cruise calls in 2016, up from 316 in 2015 - with the majority transit calls. Da Nang and Ho Chi Minh City to lead, with a combined 57% percent of the port calls in Vietnam. The destination has a potential to host 742,000 Passenger Destination Days in 2016, up from 421,000 in 2015.
Growth Trends:• After flat and negative growth for two years, 2016 has brought 47.5% growth over 2015 in port calls.• From 2013 to 2016, CAGR has rebounded from slightly negative to a positive 11%.
Cruise Destination: Vietnam
Southeast Asia
Growth Trends
2016 Picture
23
409
255
466
Transit Turnaround Overnight Total
Port Calls in 2016
127
95
99
61
22
-
2
14
29
12
Da Nang / Hue / Chan May
Ho Chi Minh City / Phu My
Halong Bay / Hanoi
Nha Trang
Cai Lan
Top Ports 2016
Transit
Turnaround
Overnight696
146
Passenger Destination Days (000s)
Overnight
Turnaround
Transit
742KTotal PDDs
5.6%-12.0%
47.5%
2014 growth 2015 growth 2016 Growth
Yr-Yr Growth Rate Port Calls
11.1%25.1%
6.1%
37.1%
96.0%
19.5%
VIETNAM ALL ASIA SOUTHEAST ASIA
Growth Rate: Port Calls 2013-16 (CAGR, Total Growth)
3 year cagr 3 yr % growth
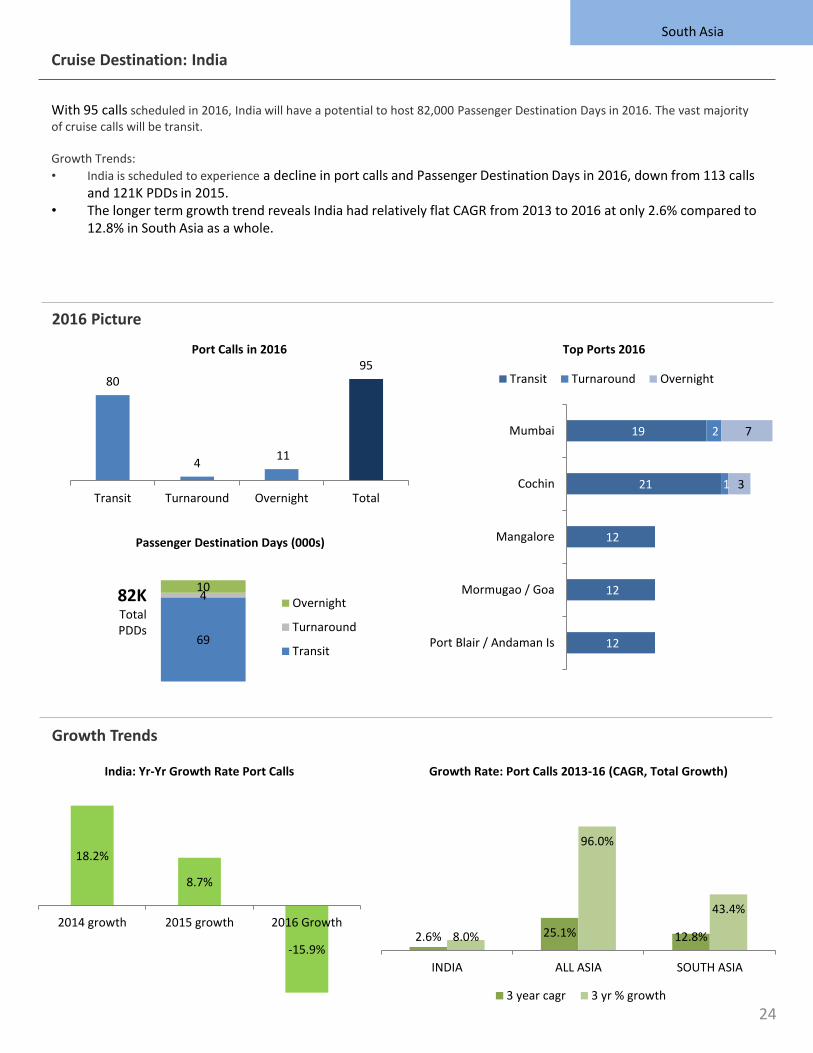
With 95 calls scheduled in 2016, India will have a potential to host 82,000 Passenger Destination Days in 2016. The vast majority of cruise calls will be transit.
Growth Trends:
• India is scheduled to experience a decline in port calls and Passenger Destination Days in 2016, down from 113 calls and 121K PDDs in 2015.
• The longer term growth trend reveals India had relatively flat CAGR from 2013 to 2016 at only 2.6% compared to 12.8% in South Asia as a whole.
Cruise Destination: India
South Asia
Growth Trends
2016 Picture
24
80
411
95
Transit Turnaround Overnight Total
Port Calls in 2016
19
21
12
12
12
2
1
-
-
-
7
3
Mumbai
Cochin
Mangalore
Mormugao / Goa
Port Blair / Andaman Is
Top Ports 2016
Transit Turnaround Overnight
69
410
Passenger Destination Days (000s)
Overnight
Turnaround
Transit
82KTotal PDDs
18.2%
8.7%
-15.9%
2014 growth 2015 growth 2016 Growth
India: Yr-Yr Growth Rate Port Calls
2.6% 25.1% 12.8%8.0%
96.0%
43.4%
INDIA ALL ASIA SOUTH ASIA
Growth Rate: Port Calls 2013-16 (CAGR, Total Growth)
3 year cagr 3 yr % growth
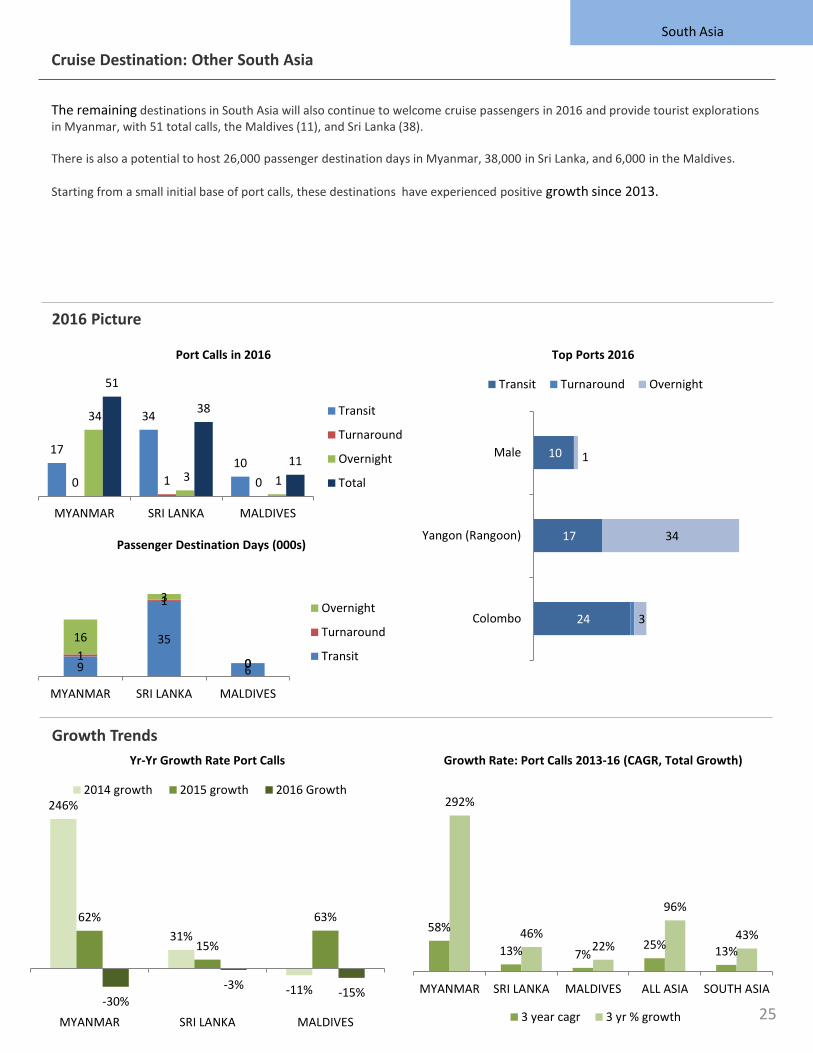
The remaining destinations in South Asia will also continue to welcome cruise passengers in 2016 and provide tourist explorations in Myanmar, with 51 total calls, the Maldives (11), and Sri Lanka (38).
There is also a potential to host 26,000 passenger destination days in Myanmar, 38,000 in Sri Lanka, and 6,000 in the Maldives.
Starting from a small initial base of port calls, these destinations have experienced positive growth since 2013.
Cruise Destination: Other South Asia
South Asia
Growth Trends
2016 Picture
25
17
34
10
0 1 0
34
3 1
51
38
11
MYANMAR SRI LANKA MALDIVES
Port Calls in 2016
Transit
Turnaround
Overnight
Total
9
35
61
1
0
16
3
0
MYANMAR SRI LANKA MALDIVES
Passenger Destination Days (000s)
Overnight
Turnaround
Transit
10
17
24
1
34
3
Male
Yangon (Rangoon)
Colombo
Top Ports 2016
Transit Turnaround Overnight
58%
13% 7%25% 13%
292%
46%22%
96%
43%
MYANMAR SRI LANKA MALDIVES ALL ASIA SOUTH ASIA
Growth Rate: Port Calls 2013-16 (CAGR, Total Growth)
3 year cagr 3 yr % growth
246%
31%
-11%
62%
15%
63%
-30%
-3%-15%
MYANMAR SRI LANKA MALDIVES
Yr-Yr Growth Rate Port Calls
2014 growth 2015 growth 2016 Growth
SOURCE MARKETS
Asian source markets are becoming the new growth engine of the global cruise industry demonstrating an exceptional 39% compound annual growth in passengers over the three years from 2012 (when CHART/CLIA’s accurate measurements began) to 2015.
A total of 2,081,000 Asians took cruises in 2015, 23.5% more than in 2014.
Of these, 47% or 987,000 were from mainland China, a market which grew 40% last year and at a 3-year CAGR of 65.7%, confirming China as the world’s fastest growing major source of passengers.
Asia’s other major passenger source markets were Taiwan (229,000), Singapore (183,000), and Japan (180,000 passengers). Hong Kong (127,000) and India (126,000) were the fifth and sixth largest Asian markets.
Asian travelers predominantly take cruises within the region. In 2015, 84 percent of Asian cruisers sailed in Asian waters. Among the minority cruising outside Asia (341,000 in 2015), most chose European destinations (74 percent) followed by the Caribbean (12%) and Alaska/Canada/New England (8%).
Aligned with the capacity offerings, Asian passengers mainly sailed on Contemporary ships (80 percent). Asian passengers overwhelmingly selected shorter sailings between 2-3 nights (30 percent) and 4-6 nights (50 percent). 7-13 night cruises accounted for a further 19 percent. We calculate the weighted average cruise duration for Asians as 5.3 nights.
Asian cruise passengers are found across the age spectrum. We calculate the weighted average age as 45.0 years, with only two markets showing real divergence: India, a young 37 year average and Japan an older 58 years.
All Asian age cohorts show strong growth since 2012. Fastest gains in 2015 over 2014 were passengers between 40 and 59 (up 71%).
26
774,536
1,205,138
1,685,455
2,080,998
2012 2013 2014 2015
Asia Source Passenger Volume Trend
Source Markets: Regional Overview
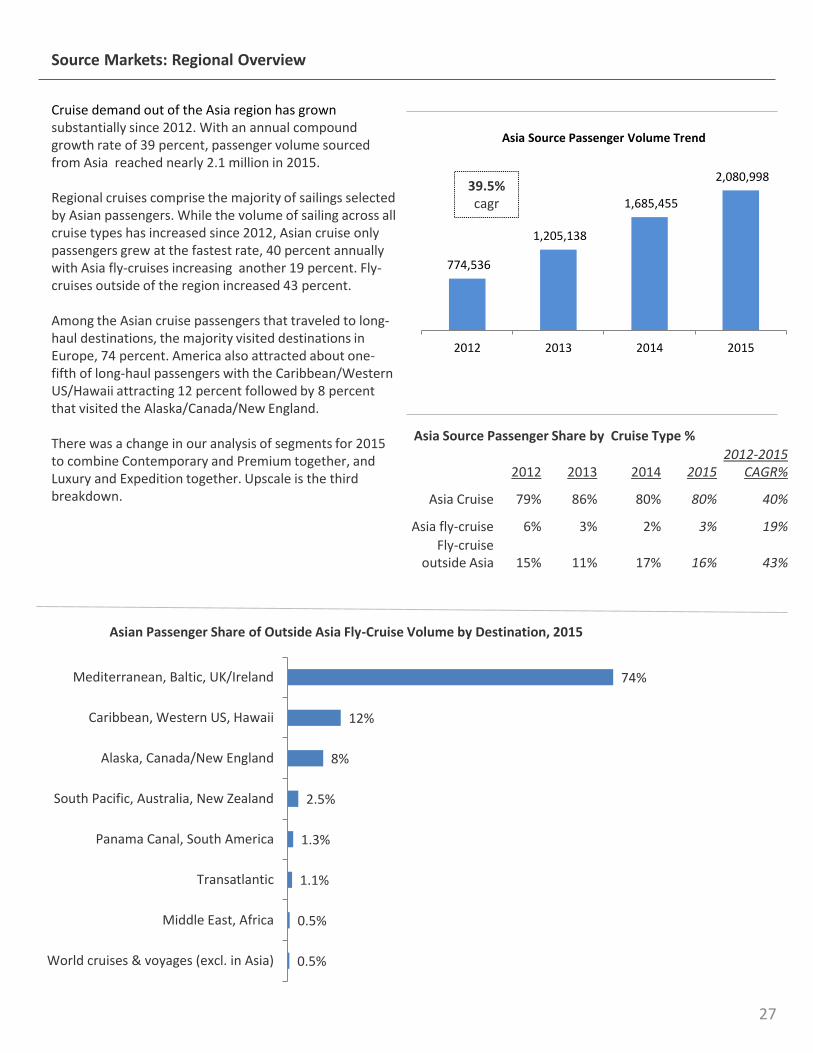
Cruise demand out of the Asia region has grown substantially since 2012. With an annual compound growth rate of 39 percent, passenger volume sourced from Asia reached nearly 2.1 million in 2015.
Regional cruises comprise the majority of sailings selected by Asian passengers. While the volume of sailing across all cruise types has increased since 2012, Asian cruise only passengers grew at the fastest rate, 40 percent annually with Asia fly-cruises increasing another 19 percent. Fly-cruises outside of the region increased 43 percent.
Among the Asian cruise passengers that traveled to long-haul destinations, the majority visited destinations in Europe, 74 percent. America also attracted about one-fifth of long-haul passengers with the Caribbean/Western US/Hawaii attracting 12 percent followed by 8 percent that visited the Alaska/Canada/New England.
There was a change in our analysis of segments for 2015 to combine Contemporary and Premium together, and Luxury and Expedition together. Upscale is the third breakdown.
39.5%cagr
Asia Source Passenger Share by Cruise Type %
2012 2013 2014 20152012-2015
CAGR%
Asia Cruise 79% 86% 80% 80% 40%
Asia fly-cruise 6% 3% 2% 3% 19%
Fly-cruise outside Asia 15% 11% 17% 16% 43%
0.5%
0.5%
1.1%
1.3%
2.5%
8%
12%
74%
World cruises & voyages (excl. in Asia)
Middle East, Africa
Transatlantic
Panama Canal, South America
South Pacific, Australia, New Zealand
Alaska, Canada/New England
Caribbean, Western US, Hawaii
Mediterranean, Baltic, UK/Ireland
Asian Passenger Share of Outside Asia Fly-Cruise Volume by Destination, 2015
27
Source Markets: Regional Overview
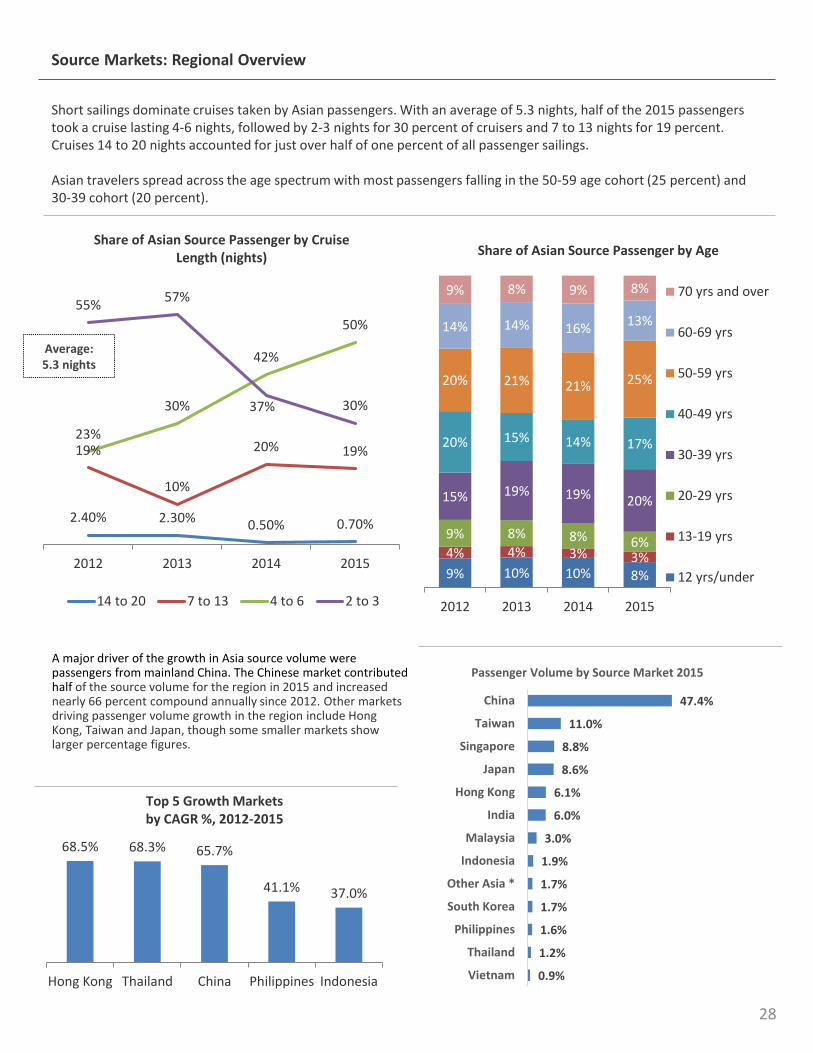
Short sailings dominate cruises taken by Asian passengers. With an average of 5.3 nights, half of the 2015 passengers took a cruise lasting 4-6 nights, followed by 2-3 nights for 30 percent of cruisers and 7 to 13 nights for 19 percent.Cruises 14 to 20 nights accounted for just over half of one percent of all passenger sailings.
Asian travelers spread across the age spectrum with most passengers falling in the 50-59 age cohort (25 percent) and 30-39 cohort (20 percent).
68.5% 68.3% 65.7%
41.1% 37.0%
Hong Kong Thailand China Philippines Indonesia
Top 5 Growth Markets by CAGR %, 2012-2015
2.40% 2.30% 0.50% 0.70%
19%
10%
20% 19%23%
30%
42%
50%
55%57%
37% 30%
2012 2013 2014 2015
Share of Asian Source Passenger by Cruise Length (nights)
14 to 20 7 to 13 4 to 6 2 to 3
Average:5.3 nights
9% 10% 10% 8%
4% 4% 3% 3%
9% 8% 8% 6%
15% 19% 19% 20%
20% 15% 14% 17%
20% 21% 21% 25%
14% 14% 16%13%
9% 8% 9% 8%
2012 2013 2014 2015
Share of Asian Source Passenger by Age
70 yrs and over
60-69 yrs
50-59 yrs
40-49 yrs
30-39 yrs
20-29 yrs
13-19 yrs
12 yrs/under
A major driver of the growth in Asia source volume were passengers from mainland China. The Chinese market contributed half of the source volume for the region in 2015 and increased nearly 66 percent compound annually since 2012. Other markets driving passenger volume growth in the region include Hong Kong, Taiwan and Japan, though some smaller markets show larger percentage figures.
28
47.4%
11.0%
8.8%
8.6%
6.1%
6.0%
3.0%
1.9%
1.7%
1.7%
1.6%
1.2%
0.9%
China
Taiwan
Singapore
Japan
Hong Kong
India
Malaysia
Indonesia
Other Asia *
South Korea
Philippines
Thailand
Vietnam
Passenger Volume by Source Market 2015
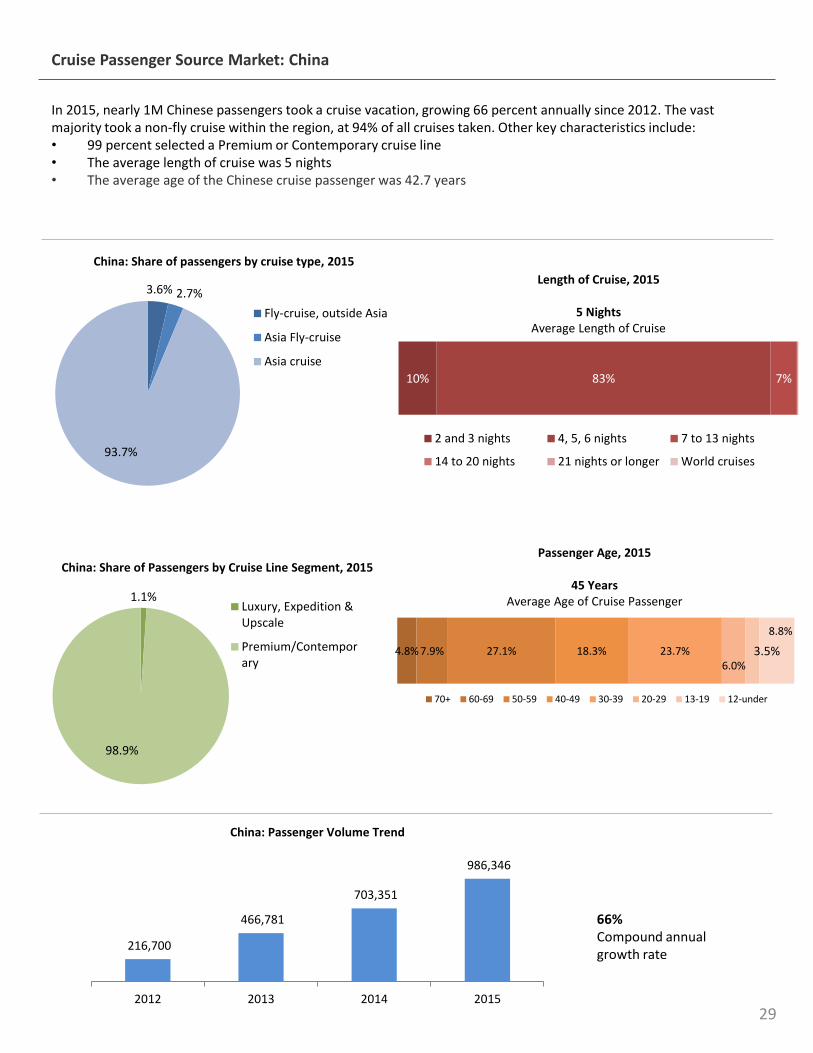
In 2015, nearly 1M Chinese passengers took a cruise vacation, growing 66 percent annually since 2012. The vast majority took a non-fly cruise within the region, at 94% of all cruises taken. Other key characteristics include:• 99 percent selected a Premium or Contemporary cruise line• The average length of cruise was 5 nights• The average age of the Chinese cruise passenger was 42.7 years
66%Compound annual growth rate
Cruise Passenger Source Market: China
29
3.6% 2.7%
93.7%
China: Share of passengers by cruise type, 2015
Fly-cruise, outside Asia
Asia Fly-cruise
Asia cruise
4.8% 7.9% 27.1% 18.3% 23.7%6.0%
3.5%
8.8%
Passenger Age, 2015
45 YearsAverage Age of Cruise Passenger
70+ 60-69 50-59 40-49 30-39 20-29 13-19 12-under
10% 83% 7%
Length of Cruise, 2015
5 NightsAverage Length of Cruise
2 and 3 nights 4, 5, 6 nights 7 to 13 nights
14 to 20 nights 21 nights or longer World cruises
1.1%
98.9%
China: Share of Passengers by Cruise Line Segment, 2015
Luxury, Expedition &Upscale
Premium/Contemporary
216,700
466,781
703,351
986,346
2012 2013 2014 2015
China: Passenger Volume Trend
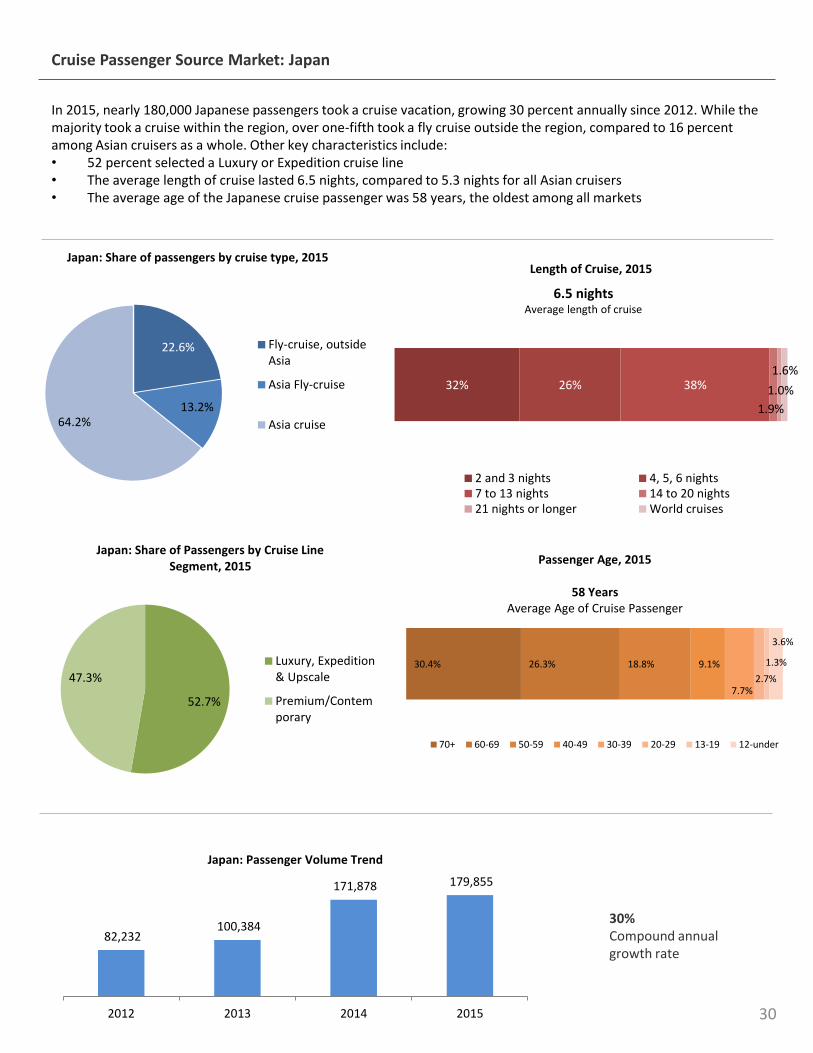
In 2015, nearly 180,000 Japanese passengers took a cruise vacation, growing 30 percent annually since 2012. While the majority took a cruise within the region, over one-fifth took a fly cruise outside the region, compared to 16 percent among Asian cruisers as a whole. Other key characteristics include:• 52 percent selected a Luxury or Expedition cruise line• The average length of cruise lasted 6.5 nights, compared to 5.3 nights for all Asian cruisers• The average age of the Japanese cruise passenger was 58 years, the oldest among all markets
30%Compound annual growth rate
6.5 nightsAverage length of cruise
Cruise Passenger Source Market: Japan
30
82,232 100,384
171,878 179,855
2012 2013 2014 2015
Japan: Passenger Volume Trend
30.4% 26.3% 18.8% 9.1%
7.7%2.7%
1.3%
3.6%
Passenger Age, 2015
58 YearsAverage Age of Cruise Passenger
70+ 60-69 50-59 40-49 30-39 20-29 13-19 12-under
52.7%
47.3%
Japan: Share of Passengers by Cruise Line Segment, 2015
Luxury, Expedition& Upscale
Premium/Contemporary
22.6%
13.2%64.2%
Japan: Share of passengers by cruise type, 2015
Fly-cruise, outsideAsia
Asia Fly-cruise
Asia cruise
32% 26% 38%
1.9%
1.0%
1.6%
Length of Cruise, 2015
2 and 3 nights 4, 5, 6 nights7 to 13 nights 14 to 20 nights21 nights or longer World cruises
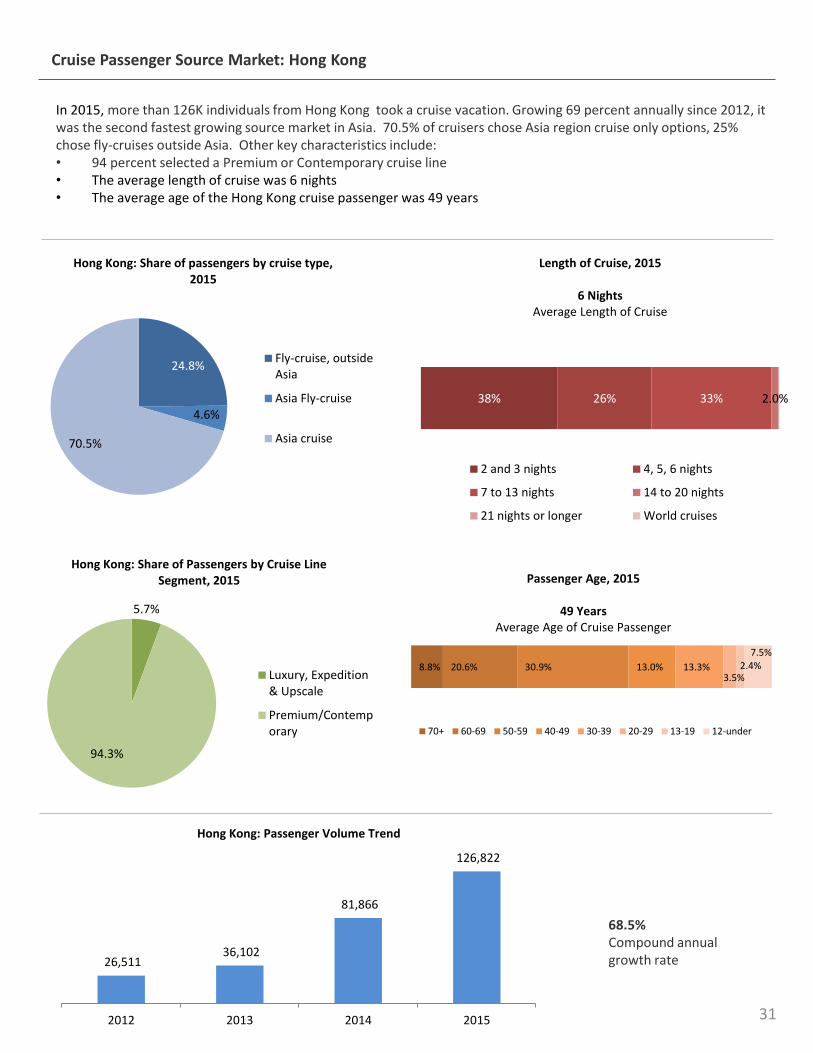
In 2015, more than 126K individuals from Hong Kong took a cruise vacation. Growing 69 percent annually since 2012, it was the second fastest growing source market in Asia. 70.5% of cruisers chose Asia region cruise only options, 25% chose fly-cruises outside Asia. Other key characteristics include:• 94 percent selected a Premium or Contemporary cruise line• The average length of cruise was 6 nights• The average age of the Hong Kong cruise passenger was 49 years
68.5%Compound annual growth rate
Cruise Passenger Source Market: Hong Kong
31
26,511 36,102
81,866
126,822
2012 2013 2014 2015
Hong Kong: Passenger Volume Trend
8.8% 20.6% 30.9% 13.0% 13.3%3.5%
2.4%7.5%
Passenger Age, 2015
49 YearsAverage Age of Cruise Passenger
70+ 60-69 50-59 40-49 30-39 20-29 13-19 12-under
5.7%
94.3%
Hong Kong: Share of Passengers by Cruise Line Segment, 2015
Luxury, Expedition& Upscale
Premium/Contemporary
24.8%
4.6%
70.5%
Hong Kong: Share of passengers by cruise type, 2015
Fly-cruise, outsideAsia
Asia Fly-cruise
Asia cruise
38% 26% 33% 2.0%
Length of Cruise, 2015
6 NightsAverage Length of Cruise
2 and 3 nights 4, 5, 6 nights
7 to 13 nights 14 to 20 nights
21 nights or longer World cruises
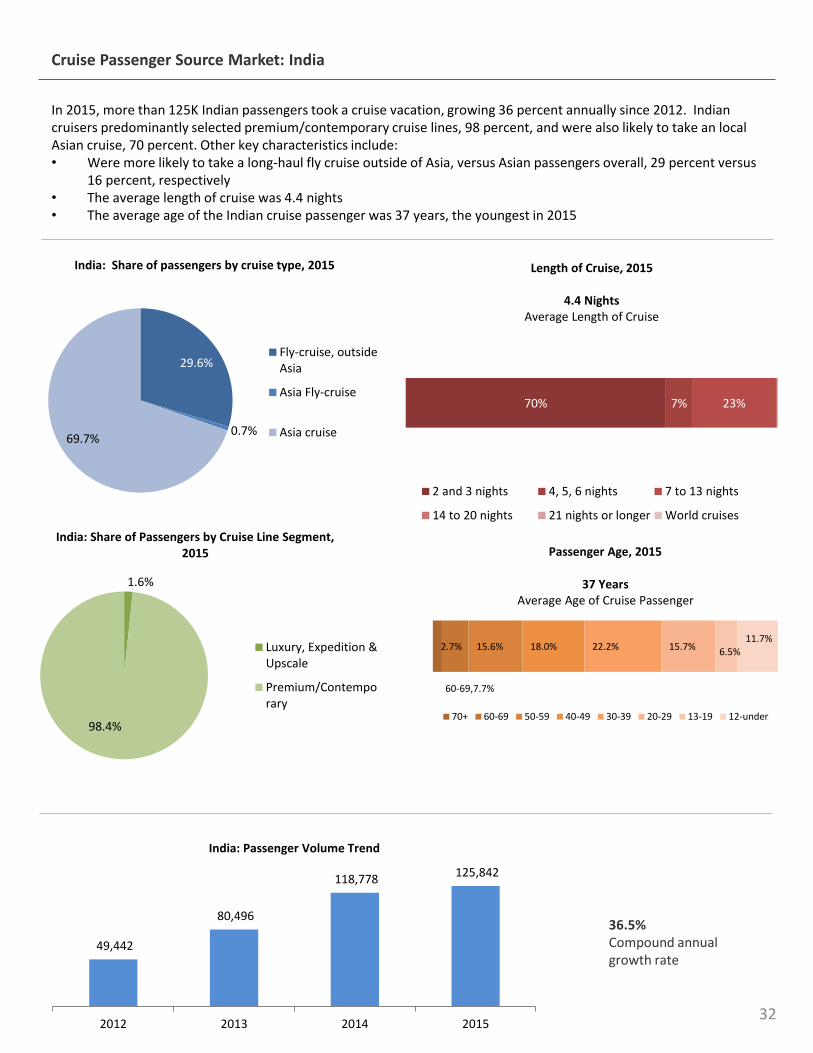
In 2015, more than 125K Indian passengers took a cruise vacation, growing 36 percent annually since 2012. Indian cruisers predominantly selected premium/contemporary cruise lines, 98 percent, and were also likely to take an local Asian cruise, 70 percent. Other key characteristics include:• Were more likely to take a long-haul fly cruise outside of Asia, versus Asian passengers overall, 29 percent versus
16 percent, respectively• The average length of cruise was 4.4 nights• The average age of the Indian cruise passenger was 37 years, the youngest in 2015
36.5%Compound annual growth rate
Cruise Passenger Source Market: India
32
49,442
80,496
118,778 125,842
2012 2013 2014 2015
India: Passenger Volume Trend
2.7%
60-69,7.7%
15.6% 18.0% 22.2% 15.7% 6.5%11.7%
Passenger Age, 2015
37 YearsAverage Age of Cruise Passenger
70+ 60-69 50-59 40-49 30-39 20-29 13-19 12-under
29.6%
0.7%69.7%
India: Share of passengers by cruise type, 2015
Fly-cruise, outsideAsia
Asia Fly-cruise
Asia cruise
1.6%
98.4%
India: Share of Passengers by Cruise Line Segment, 2015
Luxury, Expedition &Upscale
Premium/Contemporary
70% 7% 23%
Length of Cruise, 2015
4.4 NightsAverage Length of Cruise
2 and 3 nights 4, 5, 6 nights 7 to 13 nights
14 to 20 nights 21 nights or longer World cruises
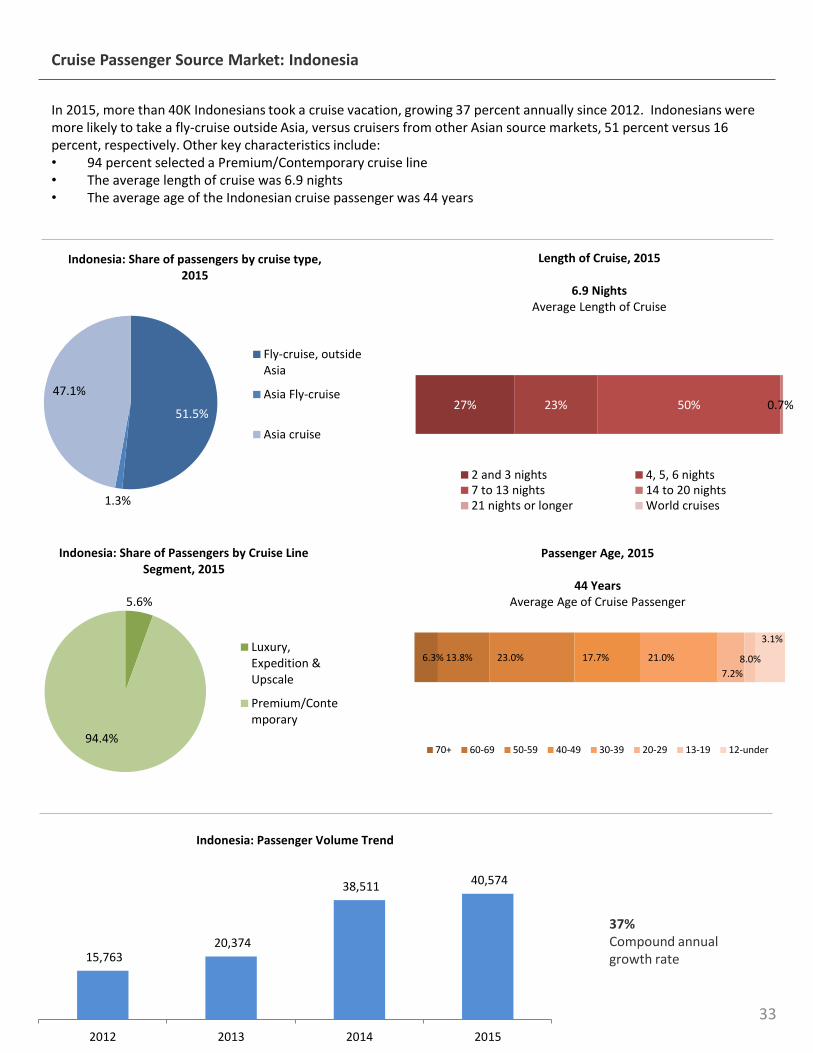
In 2015, more than 40K Indonesians took a cruise vacation, growing 37 percent annually since 2012. Indonesians were more likely to take a fly-cruise outside Asia, versus cruisers from other Asian source markets, 51 percent versus 16 percent, respectively. Other key characteristics include:• 94 percent selected a Premium/Contemporary cruise line• The average length of cruise was 6.9 nights• The average age of the Indonesian cruise passenger was 44 years
37%Compound annual growth rate
Cruise Passenger Source Market: Indonesia
33
15,763 20,374
38,511 40,574
2012 2013 2014 2015
Indonesia: Passenger Volume Trend
6.3% 13.8% 23.0% 17.7% 21.0%
7.2%
3.1%
8.0%
Passenger Age, 2015
44 YearsAverage Age of Cruise Passenger
70+ 60-69 50-59 40-49 30-39 20-29 13-19 12-under
5.6%
94.4%
Indonesia: Share of Passengers by Cruise Line Segment, 2015
Luxury,Expedition &Upscale
Premium/Contemporary
51.5%
1.3%
47.1%
Indonesia: Share of passengers by cruise type, 2015
Fly-cruise, outsideAsia
Asia Fly-cruise
Asia cruise
27% 23% 50% 0.7%
Length of Cruise, 2015
6.9 NightsAverage Length of Cruise
2 and 3 nights 4, 5, 6 nights7 to 13 nights 14 to 20 nights21 nights or longer World cruises
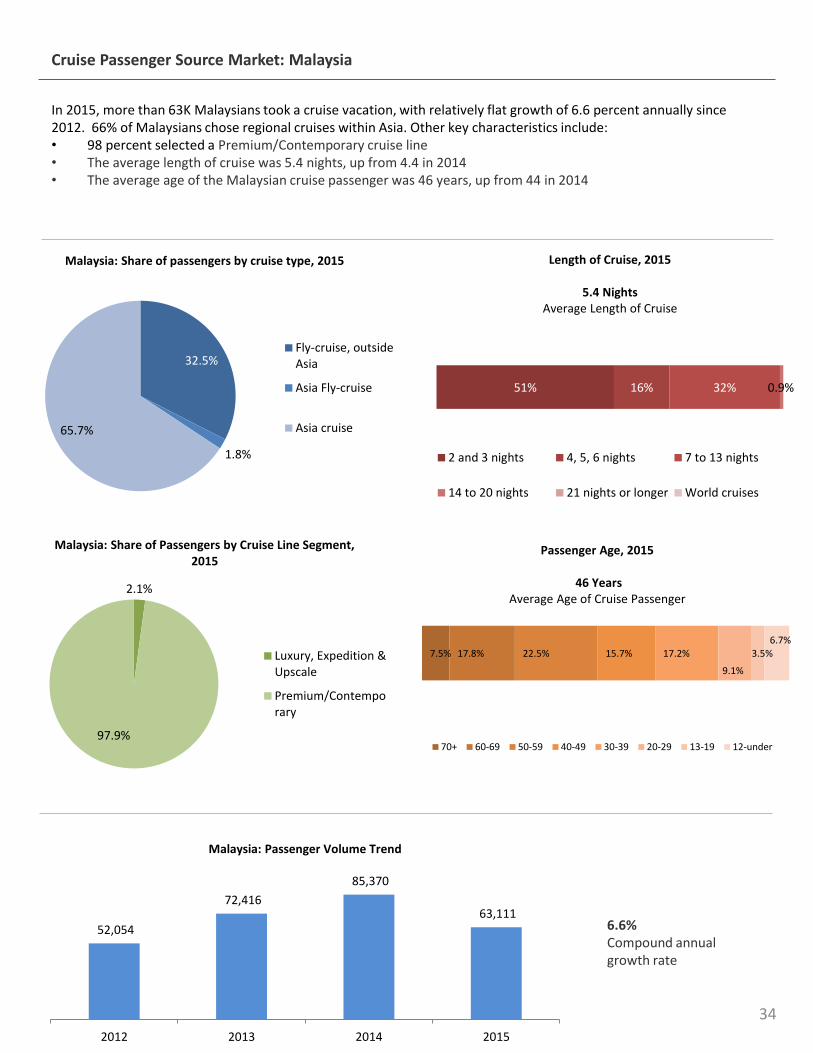
In 2015, more than 63K Malaysians took a cruise vacation, with relatively flat growth of 6.6 percent annually since 2012. 66% of Malaysians chose regional cruises within Asia. Other key characteristics include:• 98 percent selected a Premium/Contemporary cruise line• The average length of cruise was 5.4 nights, up from 4.4 in 2014• The average age of the Malaysian cruise passenger was 46 years, up from 44 in 2014
6.6%Compound annual growth rate
Cruise Passenger Source Market: Malaysia
34
52,054
72,416
85,370
63,111
2012 2013 2014 2015
Malaysia: Passenger Volume Trend
7.5% 17.8% 22.5% 15.7% 17.2%
9.1%
3.5%6.7%
Passenger Age, 2015
46 YearsAverage Age of Cruise Passenger
70+ 60-69 50-59 40-49 30-39 20-29 13-19 12-under
32.5%
1.8%
65.7%
Malaysia: Share of passengers by cruise type, 2015
Fly-cruise, outsideAsia
Asia Fly-cruise
Asia cruise
2.1%
97.9%
Malaysia: Share of Passengers by Cruise Line Segment, 2015
Luxury, Expedition &Upscale
Premium/Contemporary
51% 16% 32% 0.9%
Length of Cruise, 2015
5.4 NightsAverage Length of Cruise
2 and 3 nights 4, 5, 6 nights 7 to 13 nights
14 to 20 nights 21 nights or longer World cruises
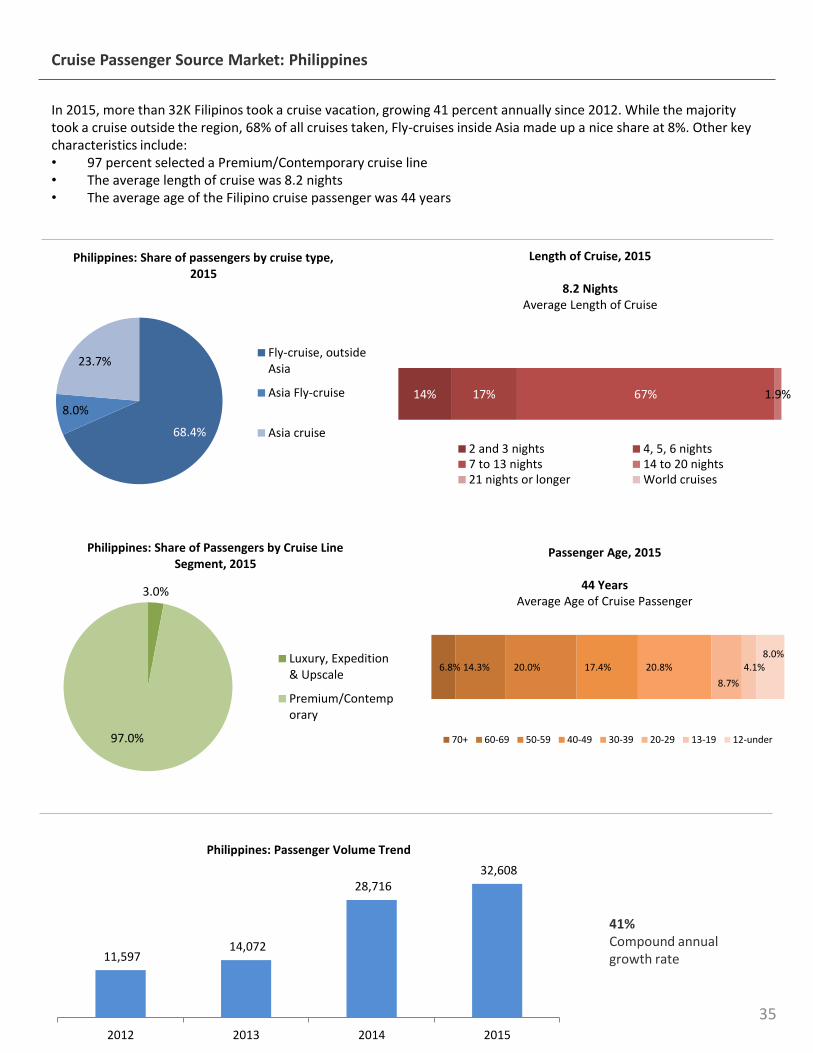
In 2015, more than 32K Filipinos took a cruise vacation, growing 41 percent annually since 2012. While the majority took a cruise outside the region, 68% of all cruises taken, Fly-cruises inside Asia made up a nice share at 8%. Other key characteristics include:• 97 percent selected a Premium/Contemporary cruise line• The average length of cruise was 8.2 nights• The average age of the Filipino cruise passenger was 44 years
41%Compound annual growth rate
Cruise Passenger Source Market: Philippines
35
11,597 14,072
28,716 32,608
2012 2013 2014 2015
Philippines: Passenger Volume Trend
6.8% 14.3% 20.0% 17.4% 20.8%
8.7%
4.1%8.0%
Passenger Age, 2015
44 YearsAverage Age of Cruise Passenger
70+ 60-69 50-59 40-49 30-39 20-29 13-19 12-under
3.0%
97.0%
Philippines: Share of Passengers by Cruise Line Segment, 2015
Luxury, Expedition& Upscale
Premium/Contemporary
68.4%
8.0%
23.7%
Philippines: Share of passengers by cruise type, 2015
Fly-cruise, outsideAsia
Asia Fly-cruise
Asia cruise
14% 17% 67% 1.9%
Length of Cruise, 2015
8.2 NightsAverage Length of Cruise
2 and 3 nights 4, 5, 6 nights7 to 13 nights 14 to 20 nights21 nights or longer World cruises
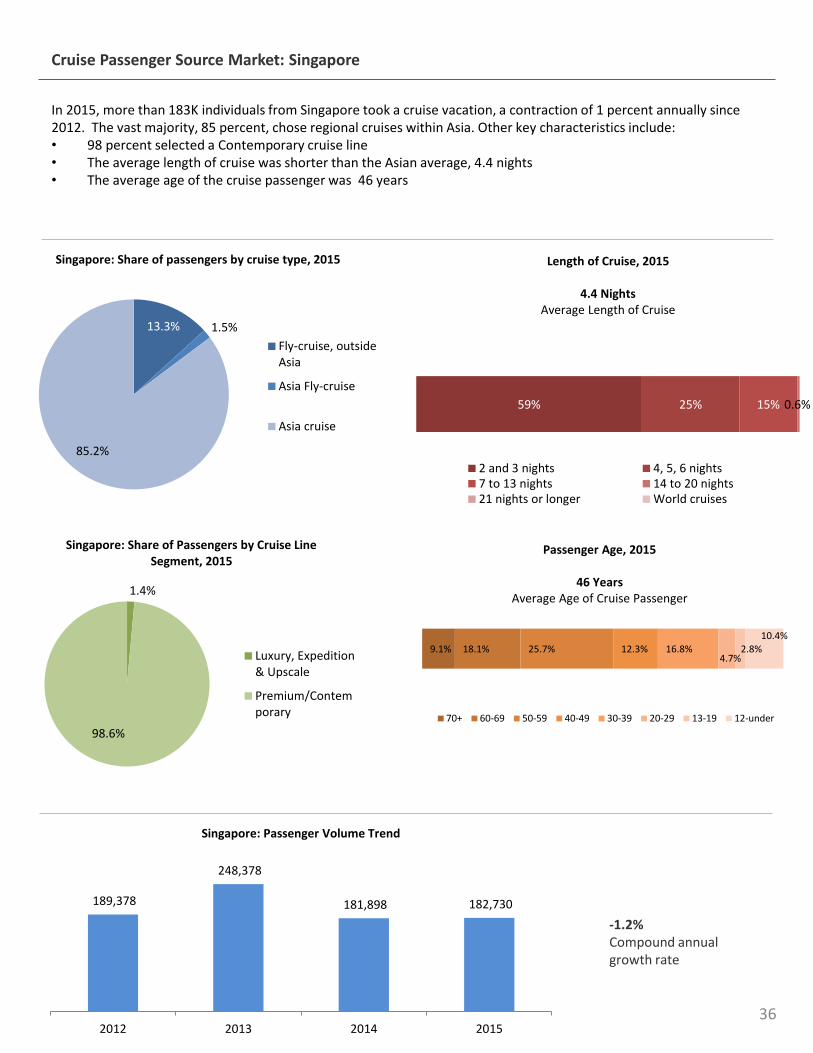
In 2015, more than 183K individuals from Singapore took a cruise vacation, a contraction of 1 percent annually since 2012. The vast majority, 85 percent, chose regional cruises within Asia. Other key characteristics include:• 98 percent selected a Contemporary cruise line• The average length of cruise was shorter than the Asian average, 4.4 nights• The average age of the cruise passenger was 46 years
-1.2%Compound annual growth rate
Cruise Passenger Source Market: Singapore
36
189,378
248,378
181,898 182,730
2012 2013 2014 2015
Singapore: Passenger Volume Trend
9.1% 18.1% 25.7% 12.3% 16.8%4.7%
2.8%10.4%
Passenger Age, 2015
46 YearsAverage Age of Cruise Passenger
70+ 60-69 50-59 40-49 30-39 20-29 13-19 12-under
13.3% 1.5%
85.2%
Singapore: Share of passengers by cruise type, 2015
Fly-cruise, outsideAsia
Asia Fly-cruise
Asia cruise
1.4%
98.6%
Singapore: Share of Passengers by Cruise Line Segment, 2015
Luxury, Expedition& Upscale
Premium/Contemporary
59% 25% 15% 0.6%
Length of Cruise, 2015
4.4 NightsAverage Length of Cruise
2 and 3 nights 4, 5, 6 nights7 to 13 nights 14 to 20 nights21 nights or longer World cruises
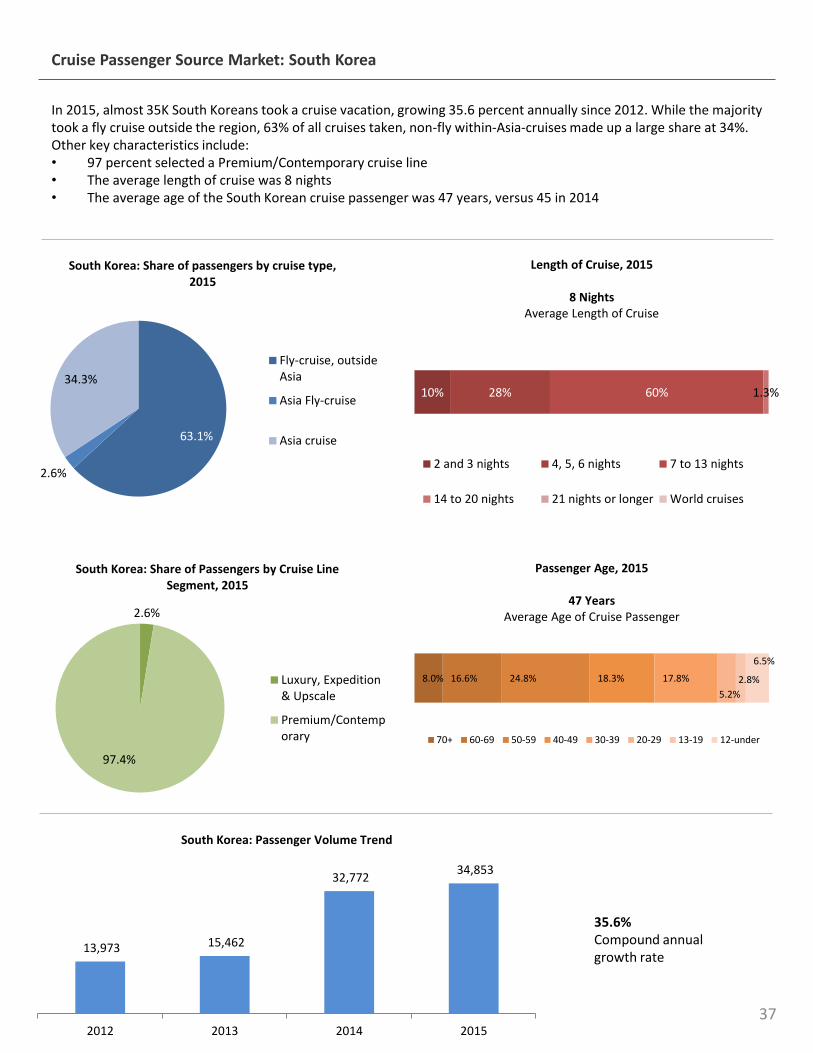
In 2015, almost 35K South Koreans took a cruise vacation, growing 35.6 percent annually since 2012. While the majority took a fly cruise outside the region, 63% of all cruises taken, non-fly within-Asia-cruises made up a large share at 34%. Other key characteristics include:• 97 percent selected a Premium/Contemporary cruise line• The average length of cruise was 8 nights• The average age of the South Korean cruise passenger was 47 years, versus 45 in 2014
35.6%Compound annual growth rate
Cruise Passenger Source Market: South Korea
37
13,973 15,462
32,772 34,853
2012 2013 2014 2015
South Korea: Passenger Volume Trend
8.0% 16.6% 24.8% 18.3% 17.8%
5.2%
2.8%
6.5%
Passenger Age, 2015
47 YearsAverage Age of Cruise Passenger
70+ 60-69 50-59 40-49 30-39 20-29 13-19 12-under
2.6%
97.4%
South Korea: Share of Passengers by Cruise Line Segment, 2015
Luxury, Expedition& Upscale
Premium/Contemporary
63.1%
2.6%
34.3%
South Korea: Share of passengers by cruise type, 2015
Fly-cruise, outsideAsia
Asia Fly-cruise
Asia cruise
10% 28% 60% 1.3%
Length of Cruise, 2015
8 NightsAverage Length of Cruise
2 and 3 nights 4, 5, 6 nights 7 to 13 nights
14 to 20 nights 21 nights or longer World cruises
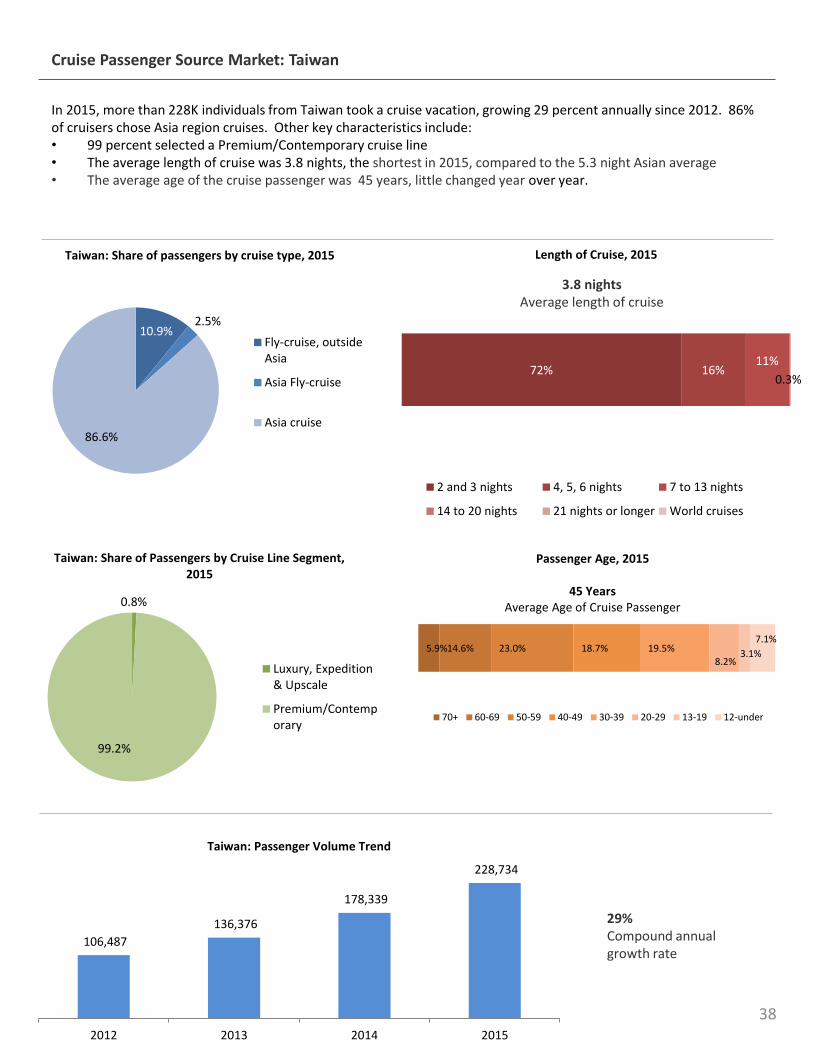
In 2015, more than 228K individuals from Taiwan took a cruise vacation, growing 29 percent annually since 2012. 86% of cruisers chose Asia region cruises. Other key characteristics include:• 99 percent selected a Premium/Contemporary cruise line• The average length of cruise was 3.8 nights, the shortest in 2015, compared to the 5.3 night Asian average• The average age of the cruise passenger was 45 years, little changed year over year.
29%Compound annual growth rate
3.8 nightsAverage length of cruise
Cruise Passenger Source Market: Taiwan
38
106,487
136,376
178,339
228,734
2012 2013 2014 2015
Taiwan: Passenger Volume Trend
5.9%14.6% 23.0% 18.7% 19.5%8.2%
3.1%
7.1%
Passenger Age, 2015
45 YearsAverage Age of Cruise Passenger
70+ 60-69 50-59 40-49 30-39 20-29 13-19 12-under
10.9%2.5%
86.6%
Taiwan: Share of passengers by cruise type, 2015
Fly-cruise, outsideAsia
Asia Fly-cruise
Asia cruise
0.8%
99.2%
Taiwan: Share of Passengers by Cruise Line Segment, 2015
Luxury, Expedition& Upscale
Premium/Contemporary
72% 16%11%
0.3%
Length of Cruise, 2015
2 and 3 nights 4, 5, 6 nights 7 to 13 nights
14 to 20 nights 21 nights or longer World cruises
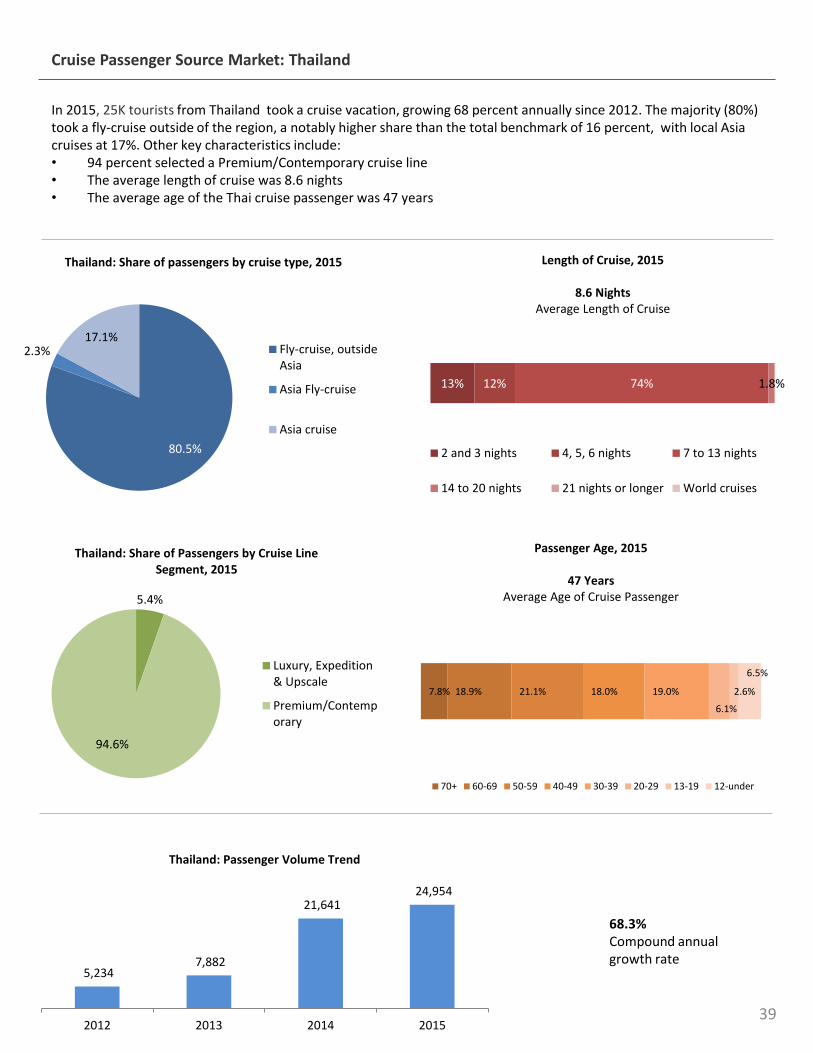
In 2015, 25K tourists from Thailand took a cruise vacation, growing 68 percent annually since 2012. The majority (80%) took a fly-cruise outside of the region, a notably higher share than the total benchmark of 16 percent, with local Asia cruises at 17%. Other key characteristics include:• 94 percent selected a Premium/Contemporary cruise line• The average length of cruise was 8.6 nights• The average age of the Thai cruise passenger was 47 years
68.3%Compound annual growth rate
Cruise Passenger Source Market: Thailand
39
5,234 7,882
21,641 24,954
2012 2013 2014 2015
Thailand: Passenger Volume Trend
7.8% 18.9% 21.1% 18.0% 19.0%
6.1%
2.6%
6.5%
Passenger Age, 2015
47 YearsAverage Age of Cruise Passenger
70+ 60-69 50-59 40-49 30-39 20-29 13-19 12-under
5.4%
94.6%
Thailand: Share of Passengers by Cruise Line Segment, 2015
Luxury, Expedition& Upscale
Premium/Contemporary
80.5%
2.3%17.1%
Thailand: Share of passengers by cruise type, 2015
Fly-cruise, outsideAsia
Asia Fly-cruise
Asia cruise
13% 12% 74% 1.8%
Length of Cruise, 2015
8.6 NightsAverage Length of Cruise
2 and 3 nights 4, 5, 6 nights 7 to 13 nights
14 to 20 nights 21 nights or longer World cruises
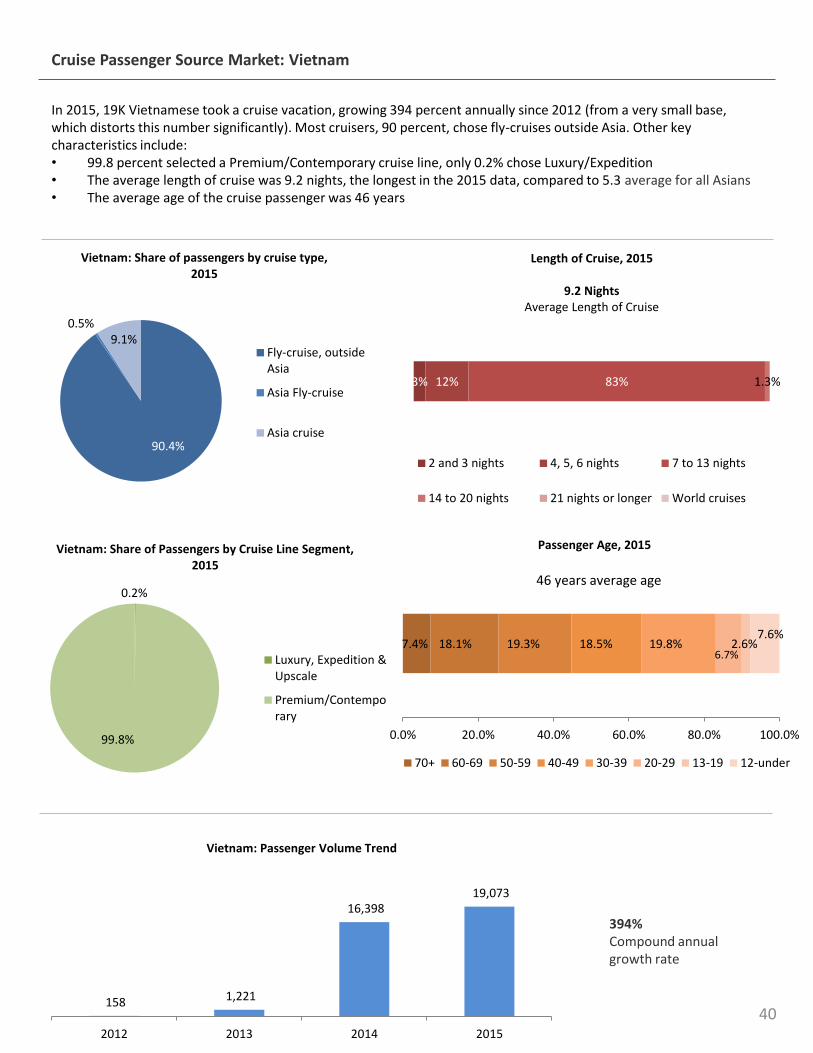
In 2015, 19K Vietnamese took a cruise vacation, growing 394 percent annually since 2012 (from a very small base, which distorts this number significantly). Most cruisers, 90 percent, chose fly-cruises outside Asia. Other key characteristics include:• 99.8 percent selected a Premium/Contemporary cruise line, only 0.2% chose Luxury/Expedition• The average length of cruise was 9.2 nights, the longest in the 2015 data, compared to 5.3 average for all Asians• The average age of the cruise passenger was 46 years
394%Compound annual growth rate
Cruise Passenger Source Market: Vietnam
40158 1,221
16,398 19,073
2012 2013 2014 2015
Vietnam: Passenger Volume Trend
90.4%
0.5%9.1%
Vietnam: Share of passengers by cruise type, 2015
Fly-cruise, outsideAsia
Asia Fly-cruise
Asia cruise
0.2%
99.8%
Vietnam: Share of Passengers by Cruise Line Segment, 2015
Luxury, Expedition &Upscale
Premium/Contemporary
3% 12% 83% 1.3%
Length of Cruise, 2015
9.2 NightsAverage Length of Cruise
2 and 3 nights 4, 5, 6 nights 7 to 13 nights
14 to 20 nights 21 nights or longer World cruises
7.4% 18.1% 19.3% 18.5% 19.8%6.7%
2.6%7.6%
0.0% 20.0% 40.0% 60.0% 80.0% 100.0%
Passenger Age, 2015
70+ 60-69 50-59 40-49 30-39 20-29 13-19 12-under
46 years average age

APPENDIX
41
Appendix - Methodology
The study entails a comprehensive and detailed analysis of trends in ocean cruise capacity, destinations visited, and passenger source markets among 26 international and regional brands over a four-year timeframe. It should be noted that all figures exclude one-night cruises.
The participants of the study represent over 95 percent of the capacity identified in Asia.
Four small brands did not participate, for which deployment and capacity data was obtained from published sources.Due to the lack of publicly available source market information for those four brands, some market size figures will be slightly under-reported, notably in China.
Study participants: International & Regional Cruise Lines
42
1 AIDA 14 NYK
2 Azamara 15 Oceania
3 Celebrity 16 P&O Australasia
4 Costa 17 P&O UK
5 Crystal 18 Ponant
6 Cunard 19 Princess
7 Fred.Olsen 20 RCI
8 Hapag-Lloyd 21 Regent Seven Seas
9 Holland America 22 Seabourn
10 Lindblad Natlional Geographic 23 Silversea
11 Mitsui OSK 24 SkySea
12 MSC 25 Star
13 NCL 26 TUI
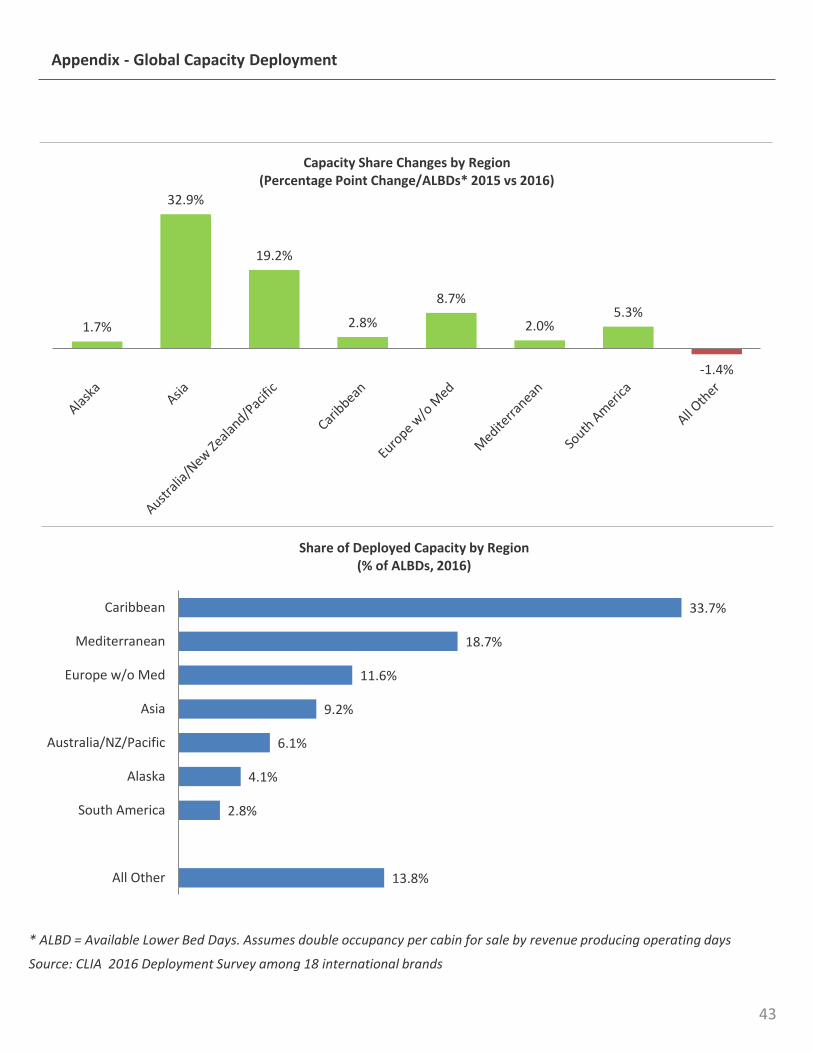
Appendix - Global Capacity Deployment
13.8%
2.8%
4.1%
6.1%
9.2%
11.6%
18.7%
33.7%
All Other
South America
Alaska
Australia/NZ/Pacific
Asia
Europe w/o Med
Mediterranean
Caribbean
Share of Deployed Capacity by Region(% of ALBDs, 2016)
1.7%
32.9%
19.2%
2.8%
8.7%
2.0%5.3%
-1.4%
Capacity Share Changes by Region(Percentage Point Change/ALBDs* 2015 vs 2016)
Source: CLIA 2016 Deployment Survey among 18 international brands
* ALBD = Available Lower Bed Days. Assumes double occupancy per cabin for sale by revenue producing operating days
43
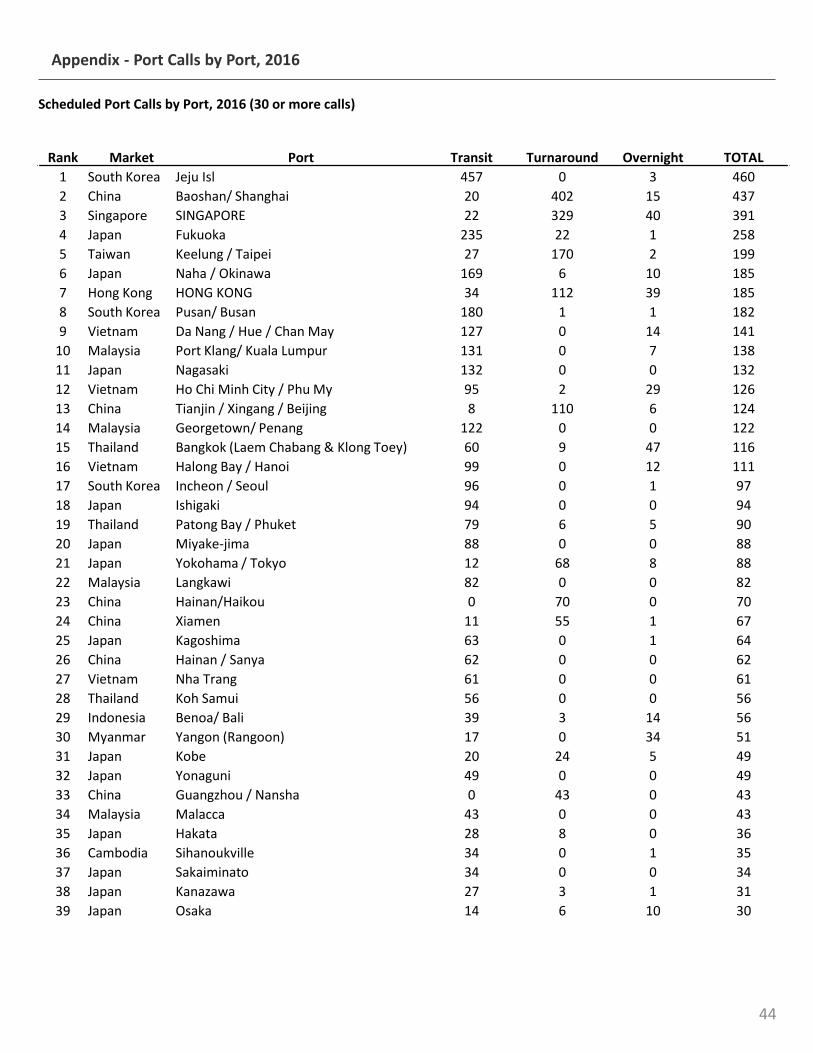
Scheduled Port Calls by Port, 2016 (30 or more calls)
Rank Market Port Transit Turnaround Overnight TOTAL
1 South Korea Jeju Isl 457 0 3 460
2 China Baoshan/ Shanghai 20 402 15 437
3 Singapore SINGAPORE 22 329 40 391
4 Japan Fukuoka 235 22 1 258
5 Taiwan Keelung / Taipei 27 170 2 199
6 Japan Naha / Okinawa 169 6 10 185
7 Hong Kong HONG KONG 34 112 39 185
8 South Korea Pusan/ Busan 180 1 1 182
9 Vietnam Da Nang / Hue / Chan May 127 0 14 141
10 Malaysia Port Klang/ Kuala Lumpur 131 0 7 138
11 Japan Nagasaki 132 0 0 132
12 Vietnam Ho Chi Minh City / Phu My 95 2 29 126
13 China Tianjin / Xingang / Beijing 8 110 6 124
14 Malaysia Georgetown/ Penang 122 0 0 122
15 Thailand Bangkok (Laem Chabang & Klong Toey) 60 9 47 116
16 Vietnam Halong Bay / Hanoi 99 0 12 111
17 South Korea Incheon / Seoul 96 0 1 97
18 Japan Ishigaki 94 0 0 94
19 Thailand Patong Bay / Phuket 79 6 5 90
20 Japan Miyake-jima 88 0 0 88
21 Japan Yokohama / Tokyo 12 68 8 88
22 Malaysia Langkawi 82 0 0 82
23 China Hainan/Haikou 0 70 0 70
24 China Xiamen 11 55 1 67
25 Japan Kagoshima 63 0 1 64
26 China Hainan / Sanya 62 0 0 62
27 Vietnam Nha Trang 61 0 0 61
28 Thailand Koh Samui 56 0 0 56
29 Indonesia Benoa/ Bali 39 3 14 56
30 Myanmar Yangon (Rangoon) 17 0 34 51
31 Japan Kobe 20 24 5 49
32 Japan Yonaguni 49 0 0 49
33 China Guangzhou / Nansha 0 43 0 43
34 Malaysia Malacca 43 0 0 43
35 Japan Hakata 28 8 0 36
36 Cambodia Sihanoukville 34 0 1 35
37 Japan Sakaiminato 34 0 0 34
38 Japan Kanazawa 27 3 1 31
39 Japan Osaka 14 6 10 30
Appendix - Port Calls by Port, 2016
44
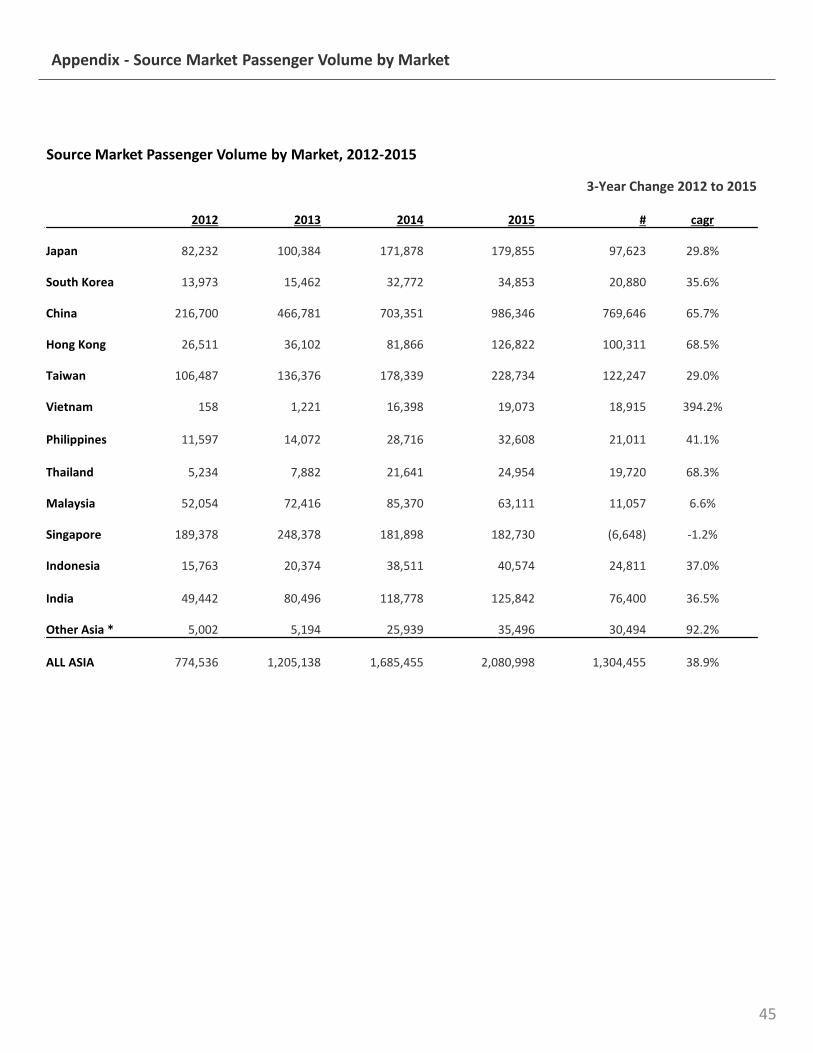
Appendix - Source Market Passenger Volume by Market
Source Market Passenger Volume by Market, 2012-2015
3-Year Change 2012 to 2015
2012 2013 2014 2015 # cagr
Japan 82,232 100,384 171,878 179,855 97,623 29.8%
South Korea 13,973 15,462 32,772 34,853 20,880 35.6%
China 216,700 466,781 703,351 986,346 769,646 65.7%
Hong Kong 26,511 36,102 81,866 126,822 100,311 68.5%
Taiwan 106,487 136,376 178,339 228,734 122,247 29.0%
Vietnam 158 1,221 16,398 19,073 18,915 394.2%
Philippines 11,597 14,072 28,716 32,608 21,011 41.1%
Thailand 5,234 7,882 21,641 24,954 19,720 68.3%
Malaysia 52,054 72,416 85,370 63,111 11,057 6.6%
Singapore 189,378 248,378 181,898 182,730 (6,648) -1.2%
Indonesia 15,763 20,374 38,511 40,574 24,811 37.0%
India 49,442 80,496 118,778 125,842 76,400 36.5%
Other Asia * 5,002 5,194 25,939 35,496 30,494 92.2%
ALL ASIA 774,536 1,205,138 1,685,455 2,080,998 1,304,455 38.9%
45
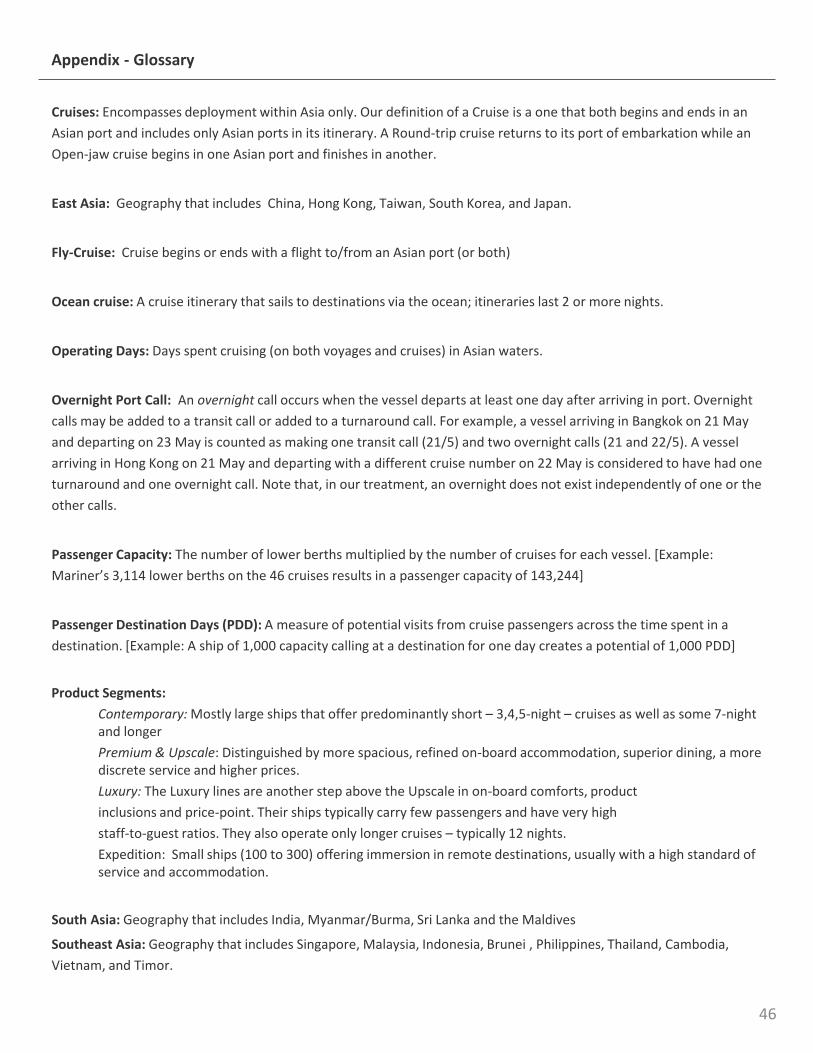
Appendix - Glossary
Cruises: Encompasses deployment within Asia only. Our definition of a Cruise is a one that both begins and ends in an
Asian port and includes only Asian ports in its itinerary. A Round-trip cruise returns to its port of embarkation while an
Open-jaw cruise begins in one Asian port and finishes in another.
East Asia: Geography that includes China, Hong Kong, Taiwan, South Korea, and Japan.
Fly-Cruise: Cruise begins or ends with a flight to/from an Asian port (or both)
Ocean cruise: A cruise itinerary that sails to destinations via the ocean; itineraries last 2 or more nights.
Operating Days: Days spent cruising (on both voyages and cruises) in Asian waters.
Overnight Port Call: An overnight call occurs when the vessel departs at least one day after arriving in port. Overnight
calls may be added to a transit call or added to a turnaround call. For example, a vessel arriving in Bangkok on 21 May
and departing on 23 May is counted as making one transit call (21/5) and two overnight calls (21 and 22/5). A vessel
arriving in Hong Kong on 21 May and departing with a different cruise number on 22 May is considered to have had one
turnaround and one overnight call. Note that, in our treatment, an overnight does not exist independently of one or the
other calls.
Passenger Capacity: The number of lower berths multiplied by the number of cruises for each vessel. [Example:
Mariner’s 3,114 lower berths on the 46 cruises results in a passenger capacity of 143,244]
Passenger Destination Days (PDD): A measure of potential visits from cruise passengers across the time spent in a
destination. [Example: A ship of 1,000 capacity calling at a destination for one day creates a potential of 1,000 PDD]
Product Segments:
Contemporary: Mostly large ships that offer predominantly short – 3,4,5-night – cruises as well as some 7-night and longer
Premium & Upscale: Distinguished by more spacious, refined on-board accommodation, superior dining, a more discrete service and higher prices.
Luxury: The Luxury lines are another step above the Upscale in on-board comforts, product
inclusions and price-point. Their ships typically carry few passengers and have very high
staff-to-guest ratios. They also operate only longer cruises – typically 12 nights.
Expedition: Small ships (100 to 300) offering immersion in remote destinations, usually with a high standard of service and accommodation.
South Asia: Geography that includes India, Myanmar/Burma, Sri Lanka and the Maldives
Southeast Asia: Geography that includes Singapore, Malaysia, Indonesia, Brunei , Philippines, Thailand, Cambodia,
Vietnam, and Timor.
46
Appendix - Glossary
Transit Port Call: A transit call includes all calls which have the arrival and departure scheduled on the same day. The
same passenger load arrives and departs on a transit call.
Turnaround Port Call: A turnaround call occurs when the vessel arrives under one cruise number and departs with a
different cruise number. This would generally involve all passengers on board disembarking and a new passenger load
embarking. Turnarounds mark the end of one cruise and the start of the next. Passengers typically do not have the
opportunity to sight-see or shop, take shore excursions or tour on a turnaround unless they opt to arrive in the port city
early or stay over for an additional night or nights. The ship usually takes on fuel, fresh water, provisions, etc.
Passengers and their baggage have to be disembarked and go through customs and immigration procedures, take
transfers to the airport (or hotels). The new passenger complement has to be embarked.
Voyages: Itineraries that include ports of call outside the regions of Asia. Voyages are typically longer than cruises and
often involve the positioning of a vessel from Europe, America or Australia to an Asian port from where it will offer a
series of cruises. Other voyages include vessels on round world or other long trips, calling at Asian ports as part of the
journey.
* * *
47

48