Aboriginal peoples in Canada in 2006: Inuit, M©tis and First
53
Statistique Canada Statistics Canada Catalogue no. 97-558-XIE Aboriginal Peoples, 2006 Census Aboriginal Peoples in Canada in 2006: Inuit, Métis and First Nations, 2006 Census Census year 2006
Transcript of Aboriginal peoples in Canada in 2006: Inuit, M©tis and First

StatistiqueCanada
StatisticsCanada
Catalogue no. 97-558-XIE
Aboriginal Peoples, 2006 Census
Aboriginal Peoples inCanada in 2006: Inuit, Métisand First Nations, 2006 Census
Census year 2006
How to obtain more information
Specifi c inquiries about this product and related statistics or services should be directed to the National Contact Centre.
For information on the wide range of data available from Statistics Canada, you can contact us by calling one of our toll-free numbers. You can also contact us by e-mail or by visiting our website at www.statcan.ca.
National inquiries line 1-800-263-1136National telecommunications device for the hearing impaired 1-800-363-7629Depository Services Program inquiries 1-800-700-1033Fax line for Depository Services Program 1-800-889-9734E-mail inquiries [email protected] www.statcan.ca
Information to access the product
This product, catalogue no. 97-558-XIE, is available for free in electronic format. To obtain a single issue, visit our website at www.statcan.ca and select Publications.
Standards of service to the public
Statistics Canada is committed to serving its clients in a prompt, reliable and courteous manner. To this end, the Agency has developed standards of service which its employees observe in serving its clients. To obtain a copy of these service standards, please contact Statistics Canada toll free at 1-800-263-1136. The service standards are also published on www.statcan.ca under About us > Providing services to Canadians.

Statistics Canada
Aboriginal Peoples in Canada in 2006: Inuit, Métis and First Nations, 2006 Census
Aboriginal Peoples, 2006 Census
Census year 2006
Note of appreciation
Canada owes the success of its statistical system to a long-standing partnership between Statistics Canada, the citizens of Canada, its businesses, governments and other institutions. Accurate and timely statistical information could not be produced without their continued cooperation and goodwill.
Published by authority of the Minister responsible for Statistics Canada
© Minister of Industry, 2008
All rights reserved. The content of this electronic publication may be reproduced, in whole or in part, and by any means, without further permission from Statistics Canada, subject to the following conditions: that it be done solely for the purposes of private study, research, criticism, review or newspaper summary, and/or for non-commercial purposes; and that Statistics Canada be fully acknowledged as follows: Source (or “Adapted from”, if appropriate): Statistics Canada, year of publication, name of product, catalogue number, volume and issue numbers, reference period and page(s). Otherwise, no part of this publication may be reproduced, stored in a retrieval system or transmitted in any form, by any means—electronic, mechanical or photocopy—or for any purposes without prior written permission of Licensing Services, Client Services Division, Statistics Canada, Ottawa, Ontario, Canada K1A 0T6.
January 2008
Catalogue no. 97-558-XIEISBN 978-0-662-47477-7
Frequency: occasional
Ottawa
La version française de cette publication est disponible sur demande (no 97-558-XIF au catalogue).

Aboriginal Peoples in Canada in 2006: Inuit, Métis and First Nations, 2006 Census
Statistics Canada – Catalogue no. 97-558 4
Aboriginal Peoples in Canada in 2006: Inuit, Métis and First Nations,
2006 Census
Table of contents
Highlights........................................................................................................................................ 6
Aboriginal people surpass the one-million mark .......................................................................... 9 International scope: Canada's proportion second, behind New Zealand............................... 10 Eight in 10 Aboriginal people live in Ontario and in the western provinces............................ 10
An increasingly urban population ............................................................................................... 12 Winnipeg home to most urban Aboriginal people................................................................... 13
Half of the Aboriginal population comprised of children and youth............................................ 14 Aboriginal children most likely to live with a lone parent ........................................................ 15
Reduction in crowding; no change in proportion of homes needing major repairs .................... 16 Crowding and need for dwelling repairs more common in western cities .............................. 16 Aboriginal people somewhat more likely to move .................................................................. 17
Inuit................................................................................................................................................ 19
Inuit population: Young and growing.......................................................................................... 19 Three-quarters of Inuit live in Inuit Nunaat stretching from Labrador to the Northwest Territories .............................................................................................................. 20 Youngest Inuit populations in Nunavut and Nunavik.............................................................. 22 Inuit population in urban centres has grown........................................................................... 23
Despite a reduction in crowding, three out of ten Inuit live in crowded homes .......................... 24 Many Inuit in all regions live in crowded conditions................................................................ 24 Growing percentage of Inuit live in homes in need of major repairs ...................................... 25
Many Inuit live in households with more than one family........................................................... 26 Inuit in Nunavik most likely to live in households with more than one family ......................... 26 One-quarter of Inuit children lived with a lone parent............................................................. 27 Inuit children in the Inuvialuit region and Nunavik more likely to live with a lone parent........ 27
Language: Inuktitut remains strong, but its use has declined.................................................... 28 Some Inuit learning Inuktitut as a second language............................................................... 28 Inuktitut language strongest in Nunavik and Nunavut ............................................................ 28 Inuktitut being learned as a second language in all regions .................................................. 29
Métis .............................................................................................................................................. 30
High rates of growth over the past decade ................................................................................ 30 Nearly nine out of 10 Métis lived in the western provinces and Ontario ................................ 31
Seven out of 10 Métis lived in urban areas ................................................................................ 31 Winnipeg home to largest number of urban Métis.................................................................. 32
Métis population still young but has aged .................................................................................. 33 Métis children twice as likely to live with a lone parent .......................................................... 33
Crowding and need for major repairs more common for Métis living in rural areas .................. 34 Métis more likely than non-Aboriginal people to move within the same census subdivision . 36
Older Métis more likely to speak an Aboriginal language .......................................................... 37

Aboriginal Peoples in Canada in 2006: Inuit, Métis and First Nations, 2006 Census
Statistics Canada – Catalogue no. 97-558 5
Table of contents – continued
First Nations people .................................................................................................................... 38
Large increase in the First Nations population........................................................................... 38 Majority of First Nations people live in Ontario and western provinces.................................. 40
Fewer First Nations people live on reserve than off reserve...................................................... 41 Off-reserve population most likely to live in census metropolitan areas ................................ 42 First Nations people more likely to move than non-Aboriginal population ............................. 43
First Nations population youngest in the Prairie provinces ........................................................ 43 On-reserve population has a larger share of children ............................................................ 44 First Nations children twice as likely to live with a lone parent............................................... 44
Reduction in crowding over past decade ................................................................................... 45 First Nations population four times more likely to live in homes in need of major repairs........................................................................................................................... 46
Share of First Nations people who speak an Aboriginal language holds steady, even among younger generation ............................................................................................... 48
Cree spoken by the largest number of First Nations people .................................................. 49 First Nations languages being learned as second languages................................................ 50
Concepts and definitions ............................................................................................................ 51
Reference map ............................................................................................................................. 53

Aboriginal Peoples in Canada in 2006: Inuit, Métis and First Nations, 2006 Census
Statistics Canada – Catalogue no. 97-558 6
Highlights
• In 2006, the number of people who identified themselves as an Aboriginal person, that is, North American Indian (First Nations people), Métis and Inuit, surpassed the one-million mark, reaching 1,172,790.
• The past decade has seen a large increase in the Aboriginal population. Between 1996 and 2006, it grew by 45%, nearly six times faster than the 8% rate of increase for the non-Aboriginal population.
• In 2006, Aboriginal people, First Nations, Métis and Inuit, accounted for almost 4% of the total population of Canada. Internationally, the share of Aboriginal people in Canada's population is second to New Zealand where the Maori accounted for 15% of the population. Indigenous people made up just 2% of the population of Australia and of the United States.
• Of the three Aboriginal groups in Canada, the Métis experienced the greatest increase in the past decade. Their number grew 91%, reaching 389,785 people in 2006. This was more than three times as fast as the 29% increase in First Nations people, whose number reached 698,025. The Inuit increased 26%, to 50,485.
• Although eight in 10 Aboriginal people live in Ontario and the western provinces, the fastest increase in the past decade occurred east of Manitoba. The Aboriginal population grew 95% in Nova Scotia, 67% in New Brunswick, 65% in Newfoundland and Labrador, 53% in Quebec and 68% in Ontario. In the western provinces, the fastest growth was observed in Manitoba (36%).
• Aboriginal people in Canada are increasingly urban. In 2006, 54% lived in urban areas (including large cities or census metropolitan areas and smaller urban centres), up from 50% in 1996. In 2006, Winnipeg was home to the largest urban Aboriginal population (68,380). Edmonton, with 52,100, had the second largest number of Aboriginal people. Vancouver ranked third, with 40,310. Toronto (26,575), Calgary (26,575), Saskatoon (21,535) and Regina (17,105), were also home to relatively large numbers of urban Aboriginal people.
• The Aboriginal population is younger than the non-Aboriginal population. Almost half (48%) of the Aboriginal population consists of children and youth aged 24 and under, compared with 31% of the non-Aboriginal population.
• Over the past decade, the share of Aboriginal people living in crowded homes has declined. In 2006, 11% of Aboriginal people lived in homes with more than one person per room, down from 17% in 1996. At the same time, nearly one in four lived in homes requiring major repairs in 2006, unchanged from 1996.
• Overall, Aboriginal people were almost four times as likely as non-Aboriginal people to live in a crowded dwelling. They were three times as likely to live in a home in need of major repairs.
Inuit
• In 2006, there were 50,485 Inuit in Canada. The Inuit population increased much more rapidly (26%) between 1996 and 2006 than the non-Aboriginal population (8%).
• The Inuit population is much younger that the non-Aboriginal population. The median age for Inuit in 2006 was 22 years, compared with 40 years for non-Aboriginal people. This difference is largely the result of a higher fertility rate for Inuit women.

Aboriginal Peoples in Canada in 2006: Inuit, Métis and First Nations, 2006 Census
Statistics Canada – Catalogue no. 97-558 7
• The majority of Inuit (78%) lived in Inuit Nunaat. This is the Inuktitut expression for 'Inuit homeland' consisting of four regions across the Arctic. In 2006, 49% of the total Inuit population in Canada lived in Nunavut, 19% in Nunavik in northern Quebec, 6% in the Inuvialuit region of the Northwest Territories, and 4% in Nunatsiavut in northern Labrador.
• Nunavik had the fastest growing Inuit population. Between 1996 and 2006, the number of Inuit living in this region grew by 25% with a 20% increase for Nunavut. In the Nunatsiavut region, the population increased by 3% while the Inuit population in the Inuvialuit region of the Northwest Territories declined by 3% over the decade.
• Despite a reduction in crowding, three out of ten Inuit live in crowded homes. In 2006, 31% of Inuit lived in crowded conditions, down from 36% in 1996. In contrast, 3% of the non-Aboriginal population in Canada lived in crowded conditions in 2006. Nearly half (49%) of Inuit in Nunavik lived in crowded dwellings.
• In 2006, about 14,000 Inuit in Canada, (28%) of the total, reported living in homes requiring major repairs. This was four times higher than non-Aboriginal people (7%). In Inuit Nunaat, the figure was 31% for Inuit, a proportion that increased from 19% in 1996.
• While the Inuktitut language remains strong overall (69% of Inuit could speak Inuktitut), knowledge and use are declining. Inuit are less likely to speak it as their main language at home – 50% in 2006 down from 58% in 1996. In addition, smaller percentages of Inuit are reporting Inuktitut as their mother tongue and a declining percentage can speak it well enough to have a conversation.
Métis
• The Métis were the fastest growing Aboriginal group in Canada, increasing by 91% since 1996 to reach 389,785 in 2006. This was more than 11 times the rate of increase for the non-Aboriginal population (8%).
• In 2006, 87% of all Métis lived in the West and in Ontario. An estimated 7% of the Métis lived in Quebec, 5% in Atlantic Canada and the remainder lived in one of the three Territories.
• About four-fifths (80%) of the increase in the number of Métis over the last decade were accounted for by the four provinces with large Métis populations: Alberta, Ontario, Manitoba and British Columbia.
• In 2006, nearly seven out of 10 Métis (69%) lived in urban areas, up slightly from 67% in 1996. (Urban areas include large cities, or census metropolitan areas, and smaller urban centres.)
• The census enumerated 40,980 Métis living in Winnipeg in 2006, the largest Métis population of all census metropolitan areas. They accounted for 6% of Winnipeg's total population.
• Overall, there was a decrease in the share of Métis living in crowded homes or in homes needing repairs since 1996. However, crowded housing and homes in need of major repairs were most common among rural Métis living in the Prairie provinces.
• Older Métis are more likely to speak an Aboriginal language. An estimated 12% of Métis aged 75 and older were able to converse in an Aboriginal language, compared with 9% of those aged 65 to 74 and 6% of people aged 45 to 64. Less than 3% of Métis aged 44 and under spoke an Aboriginal language.

Aboriginal Peoples in Canada in 2006: Inuit, Métis and First Nations, 2006 Census
Statistics Canada – Catalogue no. 97-558 8
• The most commonly spoken Aboriginal language among Métis is Cree. In 2006, 9,360 Métis could carry on a conversation in Cree, an Algonquian language.
First Nations people
• An estimated 698,025 people identified themselves as North American Indians, also referred to as 'First Nations people' (both status and non-status Indians). The First Nations population increased 29% between 1996 and 2006, 3.5 times the increase of 8% for the non-Aboriginal population.
• A smaller proportion of First Nations people lived on reserve than off reserve. An estimated 40% lived on reserve, while the remaining 60% lived off reserve in 2006. The off-reserve proportion was up slightly from 58% in 1996.
• Censuses in both 1996 and 2006 found that about three out of every four people in the off-reserve First Nations population lived in urban areas.
• The Prairie provinces were home to young First Nations populations. The median age of First Nations people in Saskatchewan was 20 years, compared with 21 in Manitoba and 23 in Alberta. On the other hand, the median age in Ontario was 28 years and in Quebec, 30 years.
• First Nations people were five times more likely than non-Aboriginal people to live in crowded homes, defined as more than one person per room. Crowding was especially common on reserves, where just over one-quarter (26%) lived in crowded conditions, down from one-third (33%) in 1996.
• First Nations people were four times more likely than non-Aboriginal people to live in dwellings requiring major repairs. In 2006, 28% of First Nations people lived in a home in need of major repairs, compared with just 7% of the non-Aboriginal population. The poor condition of dwellings was especially common on reserves, where about 44% of First Nations people lived in a home requiring major repairs.
• The census recorded over 60 different Aboriginal languages spoken by First Nations people in Canada, grouped into distinct language families. These include Algonquian, Athapascan, Siouan, Salish, Tsimshian, Wakashan, Iroquoian, Haida, Kutenai and Tlingit.
• In both 2001 and 2006, about 29% of First Nations people who responded to the census said they could speak an Aboriginal language well enough to carry on a conversation. The figure was higher for First Nations people living on reserve (51%) than off reserve (12%).
• One in four First Nations people (25%) reported that they had an Aboriginal mother tongue in 2006, about the same proportion as in 2001. However, more First Nations people could speak an Aboriginal language than reported an Aboriginal language as a mother tongue. This may be attributed to First Nations people who have learned an Aboriginal language as a second language.
• The Aboriginal language spoken by the largest number of First Nations people is Cree. In 2006, an estimated 87,285 could carry on a conversation in Cree, followed by 30,255 who could speak Ojibway, 12,435 who spoke Oji-Cree and 11,080 who spoke Montagnais-Naskapi.

Aboriginal Peoples in Canada in 2006: Inuit, Métis and First Nations, 2006 Census
Statistics Canada – Catalogue no. 97-558 9
Aboriginal people surpass the one-million mark
New data from the 2006 Census show that the number of people who identified themselves as an Aboriginal person has surpassed the one-million mark. Their share of Canada's total population is on the rise. In 2006, Aboriginal people accounted for 3.8% of the total population of Canada enumerated in the census, up from 3.3% in 2001 and 2.8% in 1996.
A total of 1,172,790 people identified themselves as an Aboriginal person, that is, North American Indian (hereafter referred to as First Nations people1 in this report), Métis or Inuit in the 2006 Census (see 'Concepts and definitions' section). The census counted 976,305 Aboriginal people in 2001 and 799,010 in 1996.
The Aboriginal population has grown faster than the non-Aboriginal population. Between 1996 and 20062 it increased 45%, nearly six times faster than the 8% rate of increase for the non-Aboriginal population.
Of the three Aboriginal groups, the fastest gain in population between 1996 and 2006 occurred among those who identified themselves as Métis. Their number increased 91%, to an estimated 389,785. This was more than three times the 29% increase in the First Nations population, whose number reached 698,025. The number of people who identified themselves as Inuit increased 26%, to 50,485 in 2006.
Consequently, the share of the Aboriginal population who identify as Métis has grown steadily. In 2006, they accounted for one in three (33%) Aboriginal people, up from 30% in 2001 and 26% in 1996. First Nations people accounted for the majority (60%) of Aboriginal people in 2006, while Inuit represented 4%.3
Several factors may account for the growth of the Aboriginal population. These include demographic factors, such as high birth rates. In addition, more individuals are identifying themselves as an Aboriginal person, and there has also been a reduction in the number of incompletely enumerated Indian reserves since 1996.
Comparing Aboriginal census data over time
Some Indian reserves and settlements did not participate in the census as enumeration was not permitted, or it was interrupted before completion. In 2006, there were 22 incompletely enumerated reserves, down from 30 in 2001 and 77 in 1996.
Data in this document showing changes in percentages and proportions between censuses have been adjusted to account for incompletely enumerated reserves. That is, changes have been calculated using data that include only reserves enumerated in both census periods being compared.
1. Respondents self-identified as 'North American Indian'; however, the term 'First Nations people' is used throughout this report.
2. Data showing changes in percentages and proportions between 2006 and past census years have been adjusted to account for incompletely enumerated reserves.
3. The remaining 3% either identified with more than one Aboriginal group, or were Registered Indians or members of an Indian band or First Nation who did not identify as Aboriginal.

Aboriginal Peoples in Canada in 2006: Inuit, Métis and First Nations, 2006 Census
Statistics Canada – Catalogue no. 97-558 10
Table 1 Size and growth of the population by Aboriginal identity, Canada, 1996 and 2006
Aboriginal identity 2006 Percentage changefrom 1996 to 20063
Total population 31,241,030 9
Aboriginal identity population 1,172,790 45
First Nations people1 698,025 29
Métis1 389,785 91
Inuit1 50,485 26
Multiple and other Aboriginal responses2 34,500 34
Non-Aboriginal population 30,068,240 8
Notes: 1. Includes persons who reported a North American Indian, Métis or Inuit identity only. 2. Includes persons who reported more than one Aboriginal identity group (North American Indian, Métis or Inuit) and
those who reported being a Registered Indian and/or Band member without reporting an Aboriginal identity. 3. Data have been adjusted to account for incompletely enumerated reserves in 1996 and 2006. Sources: Statistics Canada, censuses of population, 1996 and 2006.
International scope: Canada's proportion second, behind New Zealand
Similar upward trends in population growth have also been observed in the census counts of indigenous populations in Australia, New Zealand and the United States.4 The Aboriginal share of Canada's population ranked second, behind that of New Zealand.
While Aboriginal people represented 4% of the population of Canada in 2006, in New Zealand, the Maori accounted for 15% of the population. Indigenous people made up just 2% of the population of Australia and of the United States.
Eight in 10 Aboriginal people live in Ontario and in the western provinces
Eight in every 10 Aboriginal people, just over 944,000, lived either in Ontario or in the four western provinces in 2006. The census enumerated 242,495 in Ontario, 196,075 in British Columbia, 188,365 in Alberta, 175,395 in Manitoba and 141,890 in Saskatchewan.
An additional 108,430 lived in Quebec. Fewer than 25,000 Aboriginal people inhabited each of the other provinces and territories.
4. Australian Bureau of Statistics. 2006 Census QuickStats; Statistics New Zealand. QuickStats About New Zealand, 2006 Census; and U.S. Census Bureau. September 20, 2006. Facts for Features.

Aboriginal Peoples in Canada in 2006: Inuit, Métis and First Nations, 2006 Census
Statistics Canada – Catalogue no. 97-558 11
Table 2 Number and percentage of population reporting Aboriginal identity, Canada, provinces and territories, 2006
Provinces and territories Number Percentage
Canada 1,172,790 100
Newfoundland and Labrador 23,450 2
Prince Edward Island 1,730 0.1
Nova Scotia 24,175 2
New Brunswick 17,655 2
Quebec 108,430 9
Ontario 242,495 21
Manitoba 175,395 15
Saskatchewan 141,890 12
Alberta 188,365 16
British Columbia 196,075 17
Yukon Territory 7,580 0.6
Northwest Territories 20,635 2
Nunavut 24,920 2
Source: Statistics Canada, Census of Population, 2006.
Aboriginal people made up the largest share of the population in the territories and in the Prairie provinces. The 24,920 Aboriginal people living in Nunavut represented 85% of the territory's total population, the highest proportion in the country. Aboriginal people represented 50% of the population of the Northwest Territories and 25% in the Yukon Territory. As for the Prairie provinces, 15% of the population was Aboriginal in Manitoba and Saskatchewan, with 6% in Alberta.
Figure 1 Percentage of Aboriginal people in the population, Canada, provinces and territories, 2006
Source: Statistics Canada, Census of Population, 2006.

Aboriginal Peoples in Canada in 2006: Inuit, Métis and First Nations, 2006 Census
Statistics Canada – Catalogue no. 97-558 12
Although most Aboriginal people lived in Ontario and the West, the fastest increase in the last decade occurred east of Manitoba. Between 1996 and 2006, the Aboriginal population increased 95% in Nova Scotia, 67% in New Brunswick, 65% in Newfoundland and Labrador, 53% in Quebec and 68% in Ontario. Among regions with a high percentage of Aboriginal people in the population, the fastest increase was observed in Manitoba (36%). The Aboriginal population in Saskatchewan increased 28%, and in the Yukon Territory, 23%.
Figure 2 Distribution of the urban Aboriginal population by Aboriginal group, Canada, 1996 and 20061
Notes: 1. Data have been adjusted to account for incompletely enumerated reserves in 1996 and 2006. 2. Includes persons who reported a North American Indian, Métis or Inuit identity only. Sources: Statistics Canada, censuses of population, 1996 and 2006.
An increasingly urban population
The Aboriginal population is becoming increasingly urban. In 2006, 54% lived in an urban centre, an increase from 50% in 1996. Urban areas include large cities, or census metropolitan areas, and smaller urban centres.
In comparison, 81% of non-Aboriginal people were urban dwellers in 2006. The difference between the two proportions is due mainly to the large share of First Nations people who live on reserves.
First Nations people accounted for 50% of the urban Aboriginal population in 2006, while 43% were Métis. However, the share of the Métis population in urban centres has grown considerably since 1996, when they accounted for 35% of all urban Aboriginal people. Relatively few Inuit lived in southern urban centres.

Aboriginal Peoples in Canada in 2006: Inuit, Métis and First Nations, 2006 Census
Statistics Canada – Catalogue no. 97-558 13
Urban Aboriginal people are less likely than their non-Aboriginal counterparts to live in large urban centres. In 2006, 59% of the urban Aboriginal population lived in census metropolitan areas, compared with 80% of non-Aboriginal people. The remaining 41% of the urban Aboriginal population lived in urban centres smaller than a census metropolitan area.
Winnipeg home to most urban Aboriginal people
A total of 291,035 Aboriginal people, or 25% of the total Aboriginal population, lived in nine of the nation's 33 census metropolitan areas in 2006. However, Aboriginal people do not make up a very large share of the population in some of these large metropolitan centres.
The census metropolitan area of Winnipeg had the highest number of Aboriginal people, 68,380, representing 10% of its total population. Edmonton, with 52,100, had the second largest number of Aboriginal people, accounting for 5% of its population. Vancouver had 40,310, representing 2% of the population.
Other census metropolitan areas with a large Aboriginal population included Toronto (26,575 or 0.5% of its population) and Calgary (26,575 or 2% of its population). Saskatoon had 21,535 Aboriginal people, accounting for 9% of its population, while Regina had 17,105, also about 9% of its population.
On the other hand, Aboriginal people made up a considerable share of the population in several smaller urban centres in the West. They accounted for 36% of the population in Thompson, Manitoba, 35% in Prince Rupert, British Columbia and 34% in Prince Albert, Saskatchewan.
Table 3 Number and percentage of population who identified as Aboriginal, selected cities, 2006
Selected cities Aboriginal population Percentage of Aboriginal people
in the city's population
Winnipeg 68,380 10
Edmonton 52,100 5
Vancouver 40,310 2
Toronto 26,575 0.5
Calgary 26,575 2
Saskatoon 21,535 9
Ottawa - Gatineau 20,590 2
Montréal 17,865 0.5
Regina 17,105 9
Prince Albert 13,565 34
Source: Statistics Canada, Census of Population, 2006.
Aboriginal Peoples in Canada in 2006: Inuit, Métis and First Nations, 2006 Census
Statistics Canada – Catalogue no. 97-558 14
Half of the Aboriginal population comprised of children and youth
The Aboriginal population is much younger than the non-Aboriginal population. In 2006, the median age of the Aboriginal population was 27 years, compared with 40 years for non-Aboriginal people, a gap of 13 years. (The median age is the point where exactly one-half of the population is older, and the other half is younger.)
The Aboriginal population was youngest in Nunavut and in Manitoba and Saskatchewan, provinces with a high proportion of Aboriginal people in their population. The median age of Aboriginal people in Nunavut was 20 years in 2006, compared with 37 years for the non-Aboriginal population. The median age was 24 years in Manitoba and 22 years in Saskatchewan.
Children and youth aged 24 and under made up almost one-half (48%) of all Aboriginal people, compared with 31% of the non-Aboriginal population. About 9% of the Aboriginal population was aged 4 and under, nearly twice the proportion of 5% of the non-Aboriginal population. Similarly, 10% of the Aboriginal population was aged 5 to 9, compared with only 6% of the non-Aboriginal population.
According to population projections released by Statistics Canada in 2005, Aboriginal people could account for a growing share of the young adult population over the next decade. By 2017, Aboriginal people aged 20 to 29 could make up 30% of those in their 20s in Saskatchewan; 24% in Manitoba; 40% in the Yukon Territory; and 58% in the Northwest Territories. Already, more than 80% of Nunavut's population aged 20 to 29 is Aboriginal, and the proportion is expected to grow.5
Children and youth made up a particularly large share of the Aboriginal population in several urban areas that were home to a large number of Aboriginal people. In three urban areas, more than half of the Aboriginal population was aged 24 and under: Regina (56%), Saskatoon (55%), and Prince Albert (56%).
Nevertheless, like the total population, the Aboriginal population is slowly getting older. This aging is due to declining fertility rates and to gradual improvements in life expectancy. However, fertility rates remain higher for the Aboriginal population and life expectancy still lags behind that of the total population of Canada.6
The number of Aboriginal seniors, while relatively small, doubled between 1996 and 2006, while the number of seniors in the non-Aboriginal population increased 24%.
However, in 2006, seniors represented only 5% of the Aboriginal population, compared with 13% of the non-Aboriginal population.
5. Projections of the Aboriginal Populations, Canada, Provinces and Territories. Statistics Canada, Catalogue no. 91-547-XIE.
6. Fertility rates are much higher among Aboriginal women than other Canadian women. In the 1996 to 2001 period, the fertility rate of Aboriginal women was 2.6 children, that is, they could expect to have that many children, on average, over the course of their lifetime. This compared with a figure of 1.5 children among all women in Canada. In 2001, life expectancy was 77 years for Aboriginal women and 71 years for Aboriginal men, about 5 years less than for non-Aboriginal people. Statistics Canada. 2006. Women in Canada. Statistics Canada, Catalogue no. 89-503-XIE.

Aboriginal Peoples in Canada in 2006: Inuit, Métis and First Nations, 2006 Census
Statistics Canada – Catalogue no. 97-558 15
Aboriginal children most likely to live with a lone parent
In 2006, the majority of Aboriginal children aged 14 and under (58%) lived with both parents, while 29% lived with a lone mother and 6%, with a lone father. In addition, 3% of Aboriginal children lived with a grandparent (with no parent present) and 4% lived with another relative. This situation is very similar to that observed in 20017.
Compared with their non-Aboriginal peers, Aboriginal children were much more likely to live with a lone parent of either sex, a grandparent (with no parent present) or with another relative. Less than 1% of both Aboriginal and non-Aboriginal children lived with non-relatives.
Aboriginal children are also twice as likely as non-Aboriginal children to live in multiple-family households.
Table 4 Living arrangements of Aboriginal and non-Aboriginal children aged 14 years and under, Canada, 2006
Aboriginal population Non-Aboriginal population Living arrangements of children percentage
Total - Children aged 14 years and under 100 100
Total living with at least one parent 93 99
Living with two parents 58 82
Living with a lone mother 29 14
Living with a lone father 6 3
Living with a grandparent (no parent present) 3 0.4
Living with another relative 4 0.5
Living with non-relatives 0.4 0.2
Source: Statistics Canada, Census of Population, 2006.
More detailed information about the living conditions of Aboriginal children, youth and adults will be available in the fall of 2008 when the results of two postcensal Aboriginal surveys are released (see text box).
Aboriginal peoples postcensal surveys
Following the 2006 Census, Statistics Canada conducted two surveys involving the Aboriginal population living off reserve and in the North. These were the 2006 Aboriginal Children's Survey (ACS) and Aboriginal Peoples Survey (APS). Data were collected between October 2006 and March 2007. Results are expected to be available in the fall of 2008.
The ACS is a new national survey of First Nations, Inuit and Métis children aged 5 and under. It collected information on the development and well-being of Aboriginal children. The APS was previously conducted following the 1991 and 2001 censuses, and provides data on the social and economic conditions of Aboriginal peoples in Canada. The 2006 APS provides data for children and youth aged 6 to 14 and for adults aged 15 and over.
7. Family data for 1996 are strictly not comparable with 2006 data due to definitional changes.
Aboriginal Peoples in Canada in 2006: Inuit, Métis and First Nations, 2006 Census
Statistics Canada – Catalogue no. 97-558 16
The surveys were developed by Statistics Canada in collaboration with Aboriginal advisors from across the country, as well as national Aboriginal organizations and federal partners.
For more information, see the Aboriginal Peoples Survey (APS) website at: http://www.statcan.ca/cgi-bin/imdb/p2SV.pl?Function=getSurvey&SDDS=3250&lang=en&db=IMDB&dbg=f&adm=8&dis=2.
Reduction in crowding; no change in proportion of homes needing major repairs
Over the past decade, the share of Aboriginal people living in crowded homes has declined. In 2006, 11% of Aboriginal people lived in homes with more than one person per room, down from 17% in 1996. At the same time, nearly one in four lived in homes requiring major repairs in 2006, unchanged from 1996. (The need for major repairs was in the judgement of respondents.)
The share of non-Aboriginal people living in crowded homes or in dwellings in need of major repairs was about the same in 2006 as it was in 1996. In 2006, 3% of non-Aboriginal people lived in crowded homes (unchanged from 1996). About 7% lived in dwellings that required major repairs, down marginally from 8% in 1996.
Overall, Aboriginal people were almost four times as likely as non-Aboriginal people to live in a crowded dwelling. They were three times as likely to live in a dwelling in need of major repairs.
Housing characteristics varied greatly from one Aboriginal group to another as well as within Aboriginal groups. For instance, conditions can be very different for Inuit people living in the North, for First Nations people living on and off reserve, and for Métis people living in urban areas as opposed to rural areas.
More detailed analysis of these housing conditions is included in subsequent sections of this report that focus on each of the three Aboriginal groups.
Crowding and need for dwelling repairs more common in western cities
The proportion of Aboriginal people living in crowded dwellings or in dwellings in need of major repair was substantially higher in western urban centres.
In particular, Aboriginal people living in Prince Albert, Regina, Saskatoon and Edmonton were four to eleven times more likely to live in crowded conditions than their non-Aboriginal counterparts. In contrast, Aboriginal people living in Montréal, Ottawa - Gatineau, Vancouver and Toronto were in fact less likely than non-Aboriginal people to live in crowded homes.
Across all major census metropolitan areas, Aboriginal people were two to three times more likely than the non-Aboriginal population to live in dwellings needing major repairs.

Aboriginal Peoples in Canada in 2006: Inuit, Métis and First Nations, 2006 Census
Statistics Canada – Catalogue no. 97-558 17
Table 5 Percentage of population living in crowded dwellings and in dwellings in need of major repairs, Canada and selected cities, 2006
Percentage of population living in crowded dwellings1
Percentage of population living in dwellings in need of major repairs2
Selected cities Aboriginal population
Non-Aboriginal population
Aboriginal population
Non-Aboriginal population
Canada 11 3 23 7
Prince Albert 11 1 14 7
Saskatoon 9 1 12 5
Regina 9 1 14 7
Edmonton 8 2 14 5
Winnipeg 5 3 16 8
Vancouver 4 5 15 6
Toronto 3 7 12 6
Montréal 2 3 14 8
Calgary 2 2 11 5
Ottawa - Gatineau 1 2 14 6
Notes: 1. 'Crowding' is defined as more than one person per room. Not counted as rooms are bathrooms, halls, vestibules and
rooms used solely for business purposes. 2. Dwellings in need of major repairs are those that, in the judgement of the respondent, require major repairs to such
things as defective plumbing or electrical wiring, and/or structural repairs to walls, floors or ceilings, etc. Source: Statistics Canada, Census of Population, 2006.
Aboriginal people somewhat more likely to move
The vast majority of Aboriginal people (81%) lived at the same address at the time of the 2006 Census as they had one year earlier, roughly the same proportion as non-Aboriginal people (86%). Aboriginal people who had moved were more likely to have moved within their census subdivision8 (11%) than to have relocated from a different community.
In the year prior to the census, 12% of Aboriginal people moved to a new home within the same census subdivision, compared with 8% of the non-Aboriginal population. Aboriginal people were also slightly more likely than their non-Aboriginal counterparts to have relocated to their current address from a different community (8% versus 5%).
When asked on the 2001 Aboriginal Peoples Survey why they moved to their current city, town or community, respondents most commonly cited the reasons family, work or better housing.9
8. A census subdivision (CSD) is an area that is a municipality or an area that is deemed to be equivalent to a municipality for statistical reporting purposes (e.g., an Indian reserve or an unorganized territory). Municipal status is defined by laws in effect in each province and territory in Canada. A CSD is also referred to as a community in this report.
9. Statistics Canada. 2003. Aboriginal Peoples Survey 2001 – Initial Findings: Well-being of the Non-reserve Aboriginal Population. Statistics Canada, Catalogue no. 89-589-XIE.

Aboriginal Peoples in Canada in 2006: Inuit, Métis and First Nations, 2006 Census
Statistics Canada – Catalogue no. 97-558 18
Undercoverage of the Aboriginal population
The objective of the census is to provide detailed information, at a single point in time, on the demographic, social and economic conditions of the population of Canada. During collection of information from the entire population on Census Day, a small percentage is inevitably not counted. This occurs when a household does not receive a census questionnaire or when people are missed in partially enumerated households. Also, some individuals may be missed because they have no usual residence, or because they did not spend the night of Census Day in any dwelling. This is termed 'undercoverage.'
Undercoverage in the 2006 Census was considerably higher among Aboriginal people than among other segments of the population due to the fact that enumeration was not permitted, or was interrupted before it could be completed, on 22 Indian reserves and settlements. These geographic areas are called 'incompletely enumerated Indian reserves and settlements.' Data are not available for incompletely enumerated Indian reserves and settlements, and these Indian reserves and settlements are not included in tabulations. While the impact of the missing data tends to be small for national-level and most provincial/territorial-level statistics, it can be significant for some smaller areas.
Most of the people living on incompletely enumerated Indian reserves and settlements are Registered Indians. Consequently, the impact of incomplete enumeration will be greatest on data for First Nations people and for persons registered under the Indian Act.

Aboriginal Peoples in Canada in 2006: Inuit, Métis and First Nations, 2006 Census
Statistics Canada – Catalogue no. 97-558 19
Inuit
Inuit population: Young and growing
Of the 1,172,790 people who identified themselves as an Aboriginal person in the 2006 Census, about 4%, or 50,485, reported that they were Inuit.10
This was a 26% increase from 40,220 in 1996. In contrast, between 1996 and 2006, the non-Aboriginal population grew at a much slower pace, increasing about 8%.
Census data show that the Inuit population in Canada is much younger than the non-Aboriginal population and other Aboriginal groups.
In 2006, the median age of the Inuit population was 22 years, compared with 40 years for non-Aboriginal people. Inuit were also younger than First Nations people, whose median age was 25 years, and Métis, whose median age was 30. (The median age is the point where exactly one-half of the population is older, and the other half is younger).
Large percentages of Inuit are in the youngest age groups. In 2006, 12% of the Inuit population was aged 4 and under, more than twice the proportion of 5% among non-Aboriginal people. Similarly, 11% of Inuit were aged 5 to 9, compared with only 6% of non-Aboriginal people. While over one-half (56%) of all Inuit were aged 24 and under, about one in three non-Aboriginal people (31%) were in this age group.
The potential implications of a young, growing Inuit population are numerous. These include a possible increased demand for housing stock and for schooling at all levels, including preschool. There may also be a greater demand for skills training as young Inuit adults make the transition from school to work in the wage and traditional Inuit economies.
A growing percentage of the Inuit population is made up of seniors aged 65 and over. However, it remains small compared with the non-Aboriginal population; only 4% of the Inuit population consisted of seniors, compared with 13% of the non-Aboriginal population. This is partly due to the higher fertility rate for Inuit women, resulting in a larger cohort of younger people.
However, lower life expectancy also has an impact. In 2001, the estimated life expectancy for Inuit was 63 years for men and 72 years for women.11 For the total Canadian population, life expectancy for men was 77 years and 82 years for women.12
10. Although single and multiple responses to the Aboriginal identity question are possible, only the population reporting a single response of 'Inuit' is included. Inuit of the western Arctic are known as Inuvialuit. In this report, the term 'Inuit' includes Inuvialuit.
11. Statistics Canada. 2005. Projections of the Aboriginal Populations, Canada, Provinces and Territories. Statistics Canada, Catalogue no. 91-547-XIE.
12. Statistics Canada. Health Indicators. 'Life expectancy - abridged life table, at birth and confidence interval, by sex, three-year average, Canada, provinces, territories, health regions and peer groups, 2001.' http://www.statcan.ca/english/freepub/82-221-XIE/2005001/tables/html/1431_01.htm.
Aboriginal Peoples in Canada in 2006: Inuit, Métis and First Nations, 2006 Census
Statistics Canada – Catalogue no. 97-558 20
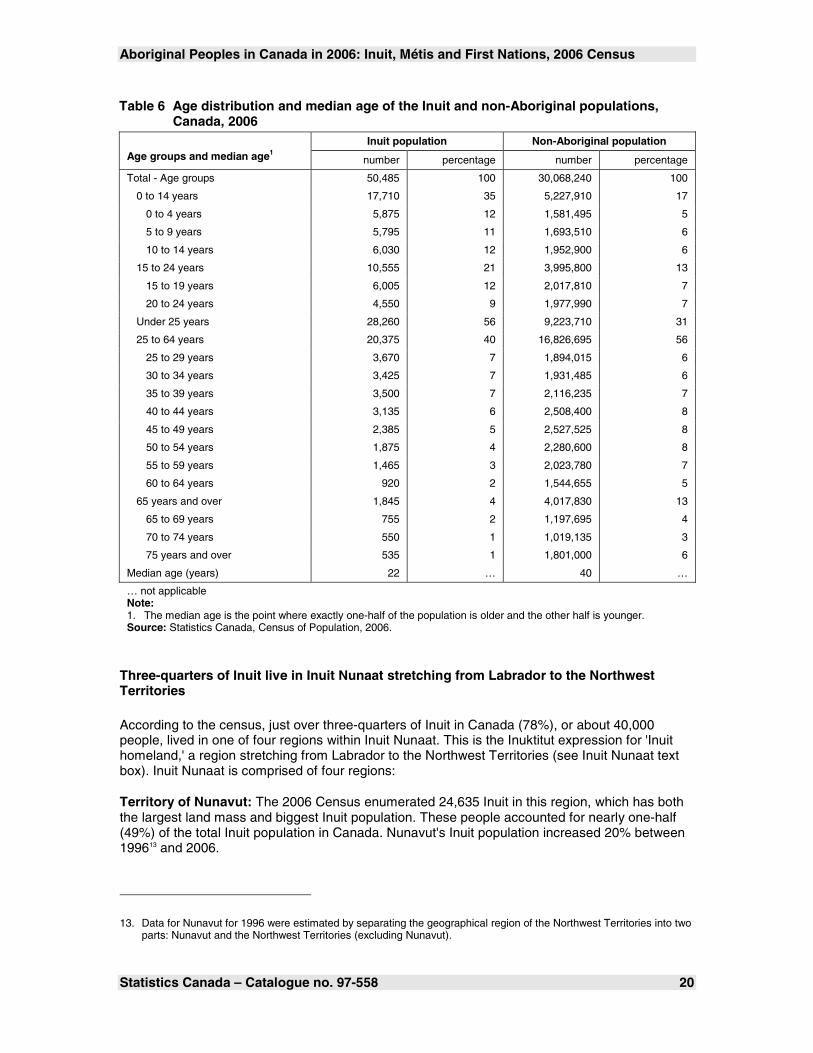
Table 6 Age distribution and median age of the Inuit and non-Aboriginal populations, Canada, 2006
Inuit population Non-Aboriginal population Age groups and median age1 number percentage number percentage
Total - Age groups 50,485 100 30,068,240 100
0 to 14 years 17,710 35 5,227,910 17
0 to 4 years 5,875 12 1,581,495 5
5 to 9 years 5,795 11 1,693,510 6
10 to 14 years 6,030 12 1,952,900 6
15 to 24 years 10,555 21 3,995,800 13
15 to 19 years 6,005 12 2,017,810 7
20 to 24 years 4,550 9 1,977,990 7
Under 25 years 28,260 56 9,223,710 31
25 to 64 years 20,375 40 16,826,695 56
25 to 29 years 3,670 7 1,894,015 6
30 to 34 years 3,425 7 1,931,485 6
35 to 39 years 3,500 7 2,116,235 7
40 to 44 years 3,135 6 2,508,400 8
45 to 49 years 2,385 5 2,527,525 8
50 to 54 years 1,875 4 2,280,600 8
55 to 59 years 1,465 3 2,023,780 7
60 to 64 years 920 2 1,544,655 5
65 years and over 1,845 4 4,017,830 13
65 to 69 years 755 2 1,197,695 4
70 to 74 years 550 1 1,019,135 3
75 years and over 535 1 1,801,000 6
Median age (years) 22 … 40 …
… not applicable Note: 1. The median age is the point where exactly one-half of the population is older and the other half is younger. Source: Statistics Canada, Census of Population, 2006.
Three-quarters of Inuit live in Inuit Nunaat stretching from Labrador to the Northwest Territories
According to the census, just over three-quarters of Inuit in Canada (78%), or about 40,000 people, lived in one of four regions within Inuit Nunaat. This is the Inuktitut expression for 'Inuit homeland,' a region stretching from Labrador to the Northwest Territories (see Inuit Nunaat text box). Inuit Nunaat is comprised of four regions:
Territory of Nunavut: The 2006 Census enumerated 24,635 Inuit in this region, which has both the largest land mass and biggest Inuit population. These people accounted for nearly one-half (49%) of the total Inuit population in Canada. Nunavut's Inuit population increased 20% between 199613 and 2006.
13. Data for Nunavut for 1996 were estimated by separating the geographical region of the Northwest Territories into two parts: Nunavut and the Northwest Territories (excluding Nunavut).

Aboriginal Peoples in Canada in 2006: Inuit, Métis and First Nations, 2006 Census
Statistics Canada – Catalogue no. 97-558 21
Nunavik: This region in northern Quebec was home to 9,565 Inuit, or 19% of the total Inuit population. Nunavik had the fastest growing Inuit population, a 25% gain since 1996.
Inuvialuit region: This region in the Northwest Territories had a population of 3,115 Inuit, accounting for 6% of all Inuit nationally. The Inuvialuit region was the only one to register a decline in population (-3%) since 1996.
Nunatsiavut: This region in northern Labrador had a population of 2,160 Inuit, or 4% of the total Inuit population. It increased 3% since 1996.
Inuit made up the majority of the population in all four regions. They accounted for 90% of the total population in Nunavik, 89% in Nunatsiavut, 84% in Nunavut and 55% in the Inuvialuit region.
Figure 3 Distribution of the Inuit population, regions, 2006
Source: Statistics Canada, Census of Population, 2006.
Inuit Nunaat
'Inuit Nunaat' is the Inuktitut expression for 'Inuit homeland,' an expanse comprising more than one-third of Canada's land mass, extending from northern Labrador to the Northwest Territories. Inuit have inhabited this vast region, in what is now known as Canada, for 5,000 years. In recent years, four Inuit land claims have been signed across Inuit Nunaat.
While Inuit in each of these regions share a common culture and many traditions, each region is, at the same time, distinct. For example, traditions can sometimes vary and there is much linguistic and geographic diversity from one region (and sometimes from one community within the same region) to the next. These four regions are:
Nunatsiavut: This is the most easterly region, encompassing five communities along the northern coast of Labrador. The word 'Nunatsiavut' means 'our beautiful land' in Inuktitut. This region was created through the 2005 Labrador Inuit Land Claim Agreement and includes about 72,500 square kilometres of land and the adjacent ocean zone.

Aboriginal Peoples in Canada in 2006: Inuit, Métis and First Nations, 2006 Census
Statistics Canada – Catalogue no. 97-558 22
Nunavik: This region in northern Quebec was established through the James Bay and Northern Quebec Agreement. This was the first modern land claims agreement in Canada, signed in 1975. Nunavik covers 660,000 square kilometres of land. More recently, the Nunavik Inuit Land Claims Agreement has given Nunavimmiut (Inuit of Nunavik) ownership of many of the islands off the coast of Nunavik.
Nunavut: The 1993 Nunavut Land Claims Agreement led to the creation of the territory of Nunavut in 1999. It was formed out of the eastern part of the Northwest Territories. This agreement is the largest land claim settlement negotiated between a state and Aboriginal people in the world. The territory spans 2 million square kilometres. There are three main regions within Nunavut: Qikiqtaaluk, Kivalliq and Kitikmeot.
Inuvialuit region: In 1984, the Inuvialuit Final Agreement (IFA) was signed, giving ownership to 90,650 square kilometres of land in the Northwest Territories to the Inuvialuit (Inuit of the western Arctic). The IFA lists six Inuvialuit communities, five within and one outside the Settlement Region. For the purposes of this report, all six Inuvialuit communities have been included.
There are 52 communities14 with large Inuit populations across Inuit Nunaat. Because of a lack of road access, these remote communities can, for the most part, be accessed only by air year round and by sea during the summer months. Most communities are small; well over one-third (38%) have a total population of fewer than 500 people. About 29% have between 500 and 999 people, while 33% have 1,000 or more.
Inuit Nunaat: comprised of four Inuit regions
Reference map attached.
Youngest Inuit populations in Nunavut and Nunavik
Nunavut and Nunavik were home to the youngest Inuit populations. The median age for Inuit in these two regions was 20 years, followed by 24 years in the Inuvialuit region and 26 years in Nunatsiavut.
In both Nunavut and Nunavik, 13% of all Inuit were aged 4 and under, compared to 8% of those in Nunatsiavut and 10% in the Inuvialuit region. Seniors accounted for 3% of all Inuit in Nunavut and Nunavik, while they represented 5% in the other two regions.
14. Inuit Tapiriit Kanatami and Makivik Corporation recognize 53 Inuit communities. The community of Killiniq (or Taqpangajuk) in Nunavik was home to Inuit that were relocated in the mid to late 1970s. While Killiniq is currently uninhabited, Inuit of Killiniq were recognized as signatory to the James Bay and Northern Quebec Agreement and lands were allocated for this community.

Aboriginal Peoples in Canada in 2006: Inuit, Métis and First Nations, 2006 Census
Statistics Canada – Catalogue no. 97-558 23
Table 7 Age distribution and median age of the Inuit population, regions, 2006
Nunatsiavut Nunavik Nunavut Inuvialuit
region
Urban outside
Inuit Nunaat
Rural outside
Inuit Nunaat Age groups and
median age1 percentage
Total - Age groups 100 100 100 100 100 100
0 to 14 years 27 39 38 30 28 26
0 to 4 years 8 13 13 10 9 6
5 to 9 years 9 13 13 9 9 9
10 to 14 years 10 13 12 12 11 11
15 to 24 years 22 21 21 22 21 19
25 to 64 years 46 37 38 43 45 46
65 years and over 5 3 3 5 6 9
Median age (years) 26 20 20 24 25 30
Note: 1. The median age is the point where exactly one-half of the population is older and the other half is younger. Source: Statistics Canada, Census of Population, 2006.
Inuit population in urban centres has grown
While most Inuit live in Inuit Nunaat, a growing percentage lives in other parts of Canada, and in particular, southern urban centres. In 2006, 22% of Inuit lived outside Inuit Nunaat, up from 17% in 1996.
The 2006 Census enumerated 8,395 Inuit who lived in urban centres outside Inuit Nunaat, up about 60% from 5,235 in 1996. In 2006, they represented 17% of the total Inuit population, an increase from 13% a decade earlier. An additional 5% of all Inuit lived in rural areas outside Inuit Nunaat.
In 2006, the urban centres outside Inuit Nunaat with the largest Inuit populations were Ottawa - Gatineau, 725; Yellowknife, 640; Edmonton, 590; Montréal, 570; and Winnipeg, 355.
Table 8 Size and growth of the Inuit population, Canada and regions, 1996 and 2006
Regions 2006 Percentage change
from 1996 to 2006
Canada 50,485 26
Total - Inuit Nunaat 39,475 18
Nunatsiavut 2,160 3
Nunavik 9,565 25
Nunavut 24,635 20
Inuvialuit region 3,115 -3
Total - Outside Inuit Nunaat 11,005 62
Rural 2,610 67
Total urban 8,395 60
Census metropolitan area1 4,220 97
Urban non-census metropolitan area 4,175 35
Note: 1. A CMA, or census metropolitan area, has a total population of at least 100,000 of which 50,000 or more live in the
urban core. Sources: Statistics Canada, censuses of population, 1996 and 2006.

Aboriginal Peoples in Canada in 2006: Inuit, Métis and First Nations, 2006 Census
Statistics Canada – Catalogue no. 97-558 24
Despite a reduction in crowding, three out of ten Inuit live in crowded homes
Inuit live in some of the most crowded living conditions in Canada. In 2006, about 15,600, or 31% of all Inuit lived in crowded homes. This was somewhat lower than in 1996 when the proportion was 36%. In contrast, 3% of the non-Aboriginal population in Canada lived in crowded conditions in 2006. (Crowding is defined as more than one person per room.)
However, a large percentage of Inuit lived in homes that were more crowded than this. In 2006, 12% of Inuit lived in homes with an average of 1.5 persons or more per room, compared with 1% of the non-Aboriginal population.
Crowding was more common in Inuit Nunaat, where just over 15,000 Inuit, or 38% of the total, lived in crowded conditions in 2006. Again, this was a decline from 43% in 1996. About 5% of non-Aboriginal people lived in crowded conditions in Inuit Nunaat in 2006, virtually unchanged from a decade earlier.
In 2006, 7,000 Inuit children in Canada aged 14 and under, 40% of the total, lived in crowded homes, more than six times the proportion of 6% among non-Aboriginal children.
Health experts maintain that inadequate housing can be associated with a host of health problems. For example, crowded living conditions can lead to the transmission of infectious diseases such as tuberculosis15 and hepatitis A, and can also increase risk for injuries, mental health problems, family tensions and violence.16
Hospitalization rates for Inuit children with severe lower respiratory tract infections are the highest in the world. Research has shown that crowding, along with poor ventilation in Inuit homes, contributes to these rates.17
Many Inuit in all regions live in crowded conditions
In all four regions of Inuit Nunaat, crowding rates for Inuit were many times higher than the rate for the non-Aboriginal population in this region, which was about 5%. In Nunavik, more than 4,700 Inuit, 49% of the total, lived in crowded dwellings, as did 39% of those in Nunavut, 19% in the Inuvialuit region and 13% in Nunatsiavut.
According to census data, crowding has declined during the past decade. The sole exception was Nunavik, where the proportion of Inuit living in crowded dwellings increased slightly, from 47% in 1996 to 49% in 2006.
15. In 2003, the tuberculosis rate for Inuit was more than 10 times higher than that for the total Canadian population. Public Health Agency of Canada. 2003. Tuberculosis in Canada. Public Health Agency of Canada Catalogue no. HP37-5/2003.
16. Statistics Canada. 2003. Aboriginal Peoples Survey 2001 – Initial Findings: Well-being of the Non-reserve Aboriginal Population. Statistics Canada, Catalogue no. 89-589-XIE; and Health Canada. 1999. A Second Diagnostic on the Health of First Nations and Inuit People in Canada. Health Canada.
17. Kovesi, T., N. Gilbert, C. Stocco, D. Fugler, R. Dales, M. Guay and J.D. Miller. July 17, 2007. Canadian Medical Association Journal. 'Indoor air quality and the risk of lower respiratory tract infections in young Canadian Inuit children.' 177 (2).
Aboriginal Peoples in Canada in 2006: Inuit, Métis and First Nations, 2006 Census
Statistics Canada – Catalogue no. 97-558 25
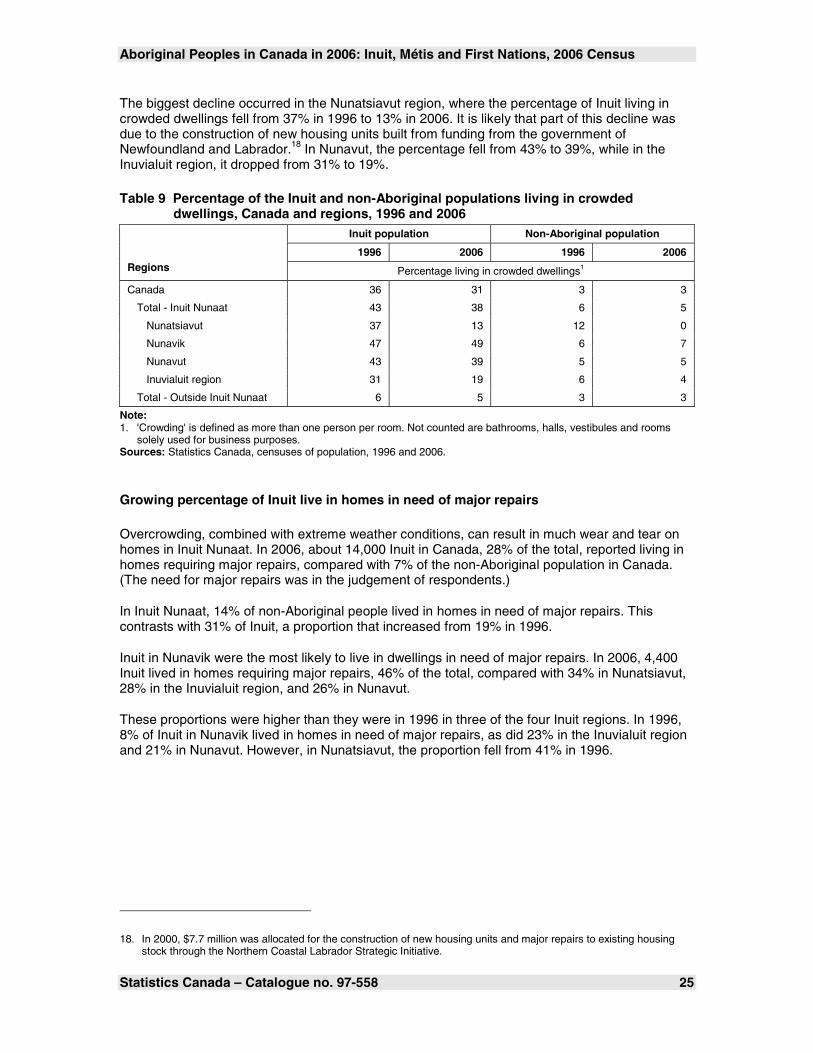
The biggest decline occurred in the Nunatsiavut region, where the percentage of Inuit living in crowded dwellings fell from 37% in 1996 to 13% in 2006. It is likely that part of this decline was due to the construction of new housing units built from funding from the government of Newfoundland and Labrador.18 In Nunavut, the percentage fell from 43% to 39%, while in the Inuvialuit region, it dropped from 31% to 19%.
Table 9 Percentage of the Inuit and non-Aboriginal populations living in crowded
dwellings, Canada and regions, 1996 and 2006 Inuit population Non-Aboriginal population
1996 2006 1996 2006 Regions Percentage living in crowded dwellings1
Canada 36 31 3 3
Total - Inuit Nunaat 43 38 6 5
Nunatsiavut 37 13 12 0
Nunavik 47 49 6 7
Nunavut 43 39 5 5
Inuvialuit region 31 19 6 4
Total - Outside Inuit Nunaat 6 5 3 3
Note: 1. 'Crowding' is defined as more than one person per room. Not counted are bathrooms, halls, vestibules and rooms
solely used for business purposes. Sources: Statistics Canada, censuses of population, 1996 and 2006.
Growing percentage of Inuit live in homes in need of major repairs
Overcrowding, combined with extreme weather conditions, can result in much wear and tear on homes in Inuit Nunaat. In 2006, about 14,000 Inuit in Canada, 28% of the total, reported living in homes requiring major repairs, compared with 7% of the non-Aboriginal population in Canada. (The need for major repairs was in the judgement of respondents.)
In Inuit Nunaat, 14% of non-Aboriginal people lived in homes in need of major repairs. This contrasts with 31% of Inuit, a proportion that increased from 19% in 1996.
Inuit in Nunavik were the most likely to live in dwellings in need of major repairs. In 2006, 4,400 Inuit lived in homes requiring major repairs, 46% of the total, compared with 34% in Nunatsiavut, 28% in the Inuvialuit region, and 26% in Nunavut.
These proportions were higher than they were in 1996 in three of the four Inuit regions. In 1996, 8% of Inuit in Nunavik lived in homes in need of major repairs, as did 23% in the Inuvialuit region and 21% in Nunavut. However, in Nunatsiavut, the proportion fell from 41% in 1996.
18. In 2000, $7.7 million was allocated for the construction of new housing units and major repairs to existing housing stock through the Northern Coastal Labrador Strategic Initiative.

Aboriginal Peoples in Canada in 2006: Inuit, Métis and First Nations, 2006 Census
Statistics Canada – Catalogue no. 97-558 26
Table 10 Percentage of Inuit and non-Aboriginal populations living in dwellings in need of major repairs, Canada and regions, 1996 and 2006
Inuit population Non-Aboriginal population
1996 2006 1996 2006 Regions Percentage living in dwellings in need of major repairs1
Canada 19 28 8 7
Total - Inuit Nunaat 19 31 16 14
Nunatsiavut 41 34 23 16
Nunavik 8 46 12 16
Nunavut 21 26 17 13
Inuvialuit region 23 28 15 16
Total - Outside Inuit Nunaat 17 15 8 7
Note: 1. Dwellings in need of major repairs are those that, in the judgement of the respondent, require major repairs to such
things as defective plumbing or electrical wiring, and/or structural repairs to walls, floors or ceilings, etc. Sources: Statistics Canada, censuses of population, 1996 and 2006.
Many Inuit live in households with more than one family
Inuit were nearly five times more likely than non-Aboriginal people to live in households containing more than one family. In 2006, 18% of Inuit lived in a household that was home to more than one family, compared with 4% of the non-Aboriginal population.
Inuit have traditionally lived in family groupings. But at least one report has stated that 'because there is a serious shortage of housing in most communities, it is not unusual to find members of several families sharing the same often very cramped accommodation.' 19
A very small percentage of Inuit adults live alone. In 2006, only 6% of Inuit adults lived by themselves, compared with 13% of non-Aboriginal adults. This was true for Inuit adults of all ages. Only 16% of Inuit seniors lived alone, compared to 28% of non-Aboriginal seniors.
Inuit in Nunavik most likely to live in households with more than one family
Inuit in Nunavik were most likely to live in households with more than one family. Just over one-quarter (26%) of Inuit in Nunavik lived in multiple-family households in 2006, down slightly from 29% in 2001.20
This region was followed by Nunavut, where 22% of Inuit lived in households with more than one family, up from 18% in 2001. About 13% of Inuit in Nunatsiavut and 11% of those in the Inuvialuit region lived in multiple-family households, up from about 10% in each case in 2001.
In all four regions, Inuit adults were much less likely than non-Aboriginal adults to live by themselves. In Nunavik, in 2006, 4% of Inuit adults lived alone, compared with 33% of non-Aboriginal adults. In Nunatsiavut, 4% of Inuit adults lived on their own as did 10% of non-Aboriginal adults in the region. In Nunavut, 5% of Inuit adults lived alone, compared with 19% of non-Aboriginal adults. In the Inuvialuit region, 10% of Inuit adults and 17% of non-Aboriginal adults lived alone.
19. Pauktuutit Inuit Women of Canada. 2006. The Inuit Way: A Guide to Inuit Culture. p. 26. http://www.pauktuutit.ca/pdf/publications/pauktuutit/InuitWay_e.pdf.
20. Family data for 1996 are not strictly comparable with 2006 data due to definitional changes.

Aboriginal Peoples in Canada in 2006: Inuit, Métis and First Nations, 2006 Census
Statistics Canada – Catalogue no. 97-558 27
One-quarter of Inuit children lived with a lone parent
In 2006, nearly 70% of Inuit children aged 14 and under lived in a family with two parents. In contrast, 82% of non-Aboriginal children lived in this type of family.
On the other hand, some 4,700 Inuit children aged 14 and under, or about one-quarter of the total, lived in lone-parent families; about 20% lived with a female lone parent and 6% with a male lone parent. In comparison, 14% of non-Aboriginal children lived with a female lone parent and 3% lived with a male lone parent.
Inuit children were also more likely to live with a relative who was not a parent. In 2006, 4% of Inuit children lived with a grandparent (with no parent present) or with other relatives, compared with less than 1% of non-Aboriginal children.
Part of this difference can likely be explained by the practice of traditional or custom adoption among Inuit. Children are sometimes placed by a birth parent or parents with a relative to raise as their own, a tradition that has been practised for thousands of years.
Table 11 Living arrangements of Inuit and non-Aboriginal children aged 14 years and under, Canada, 2006
Inuit population Non-Aboriginal population Living arrangements of children percentage
Total - Children aged 14 years and under 100 100
Total living with at least one parent 96 99
Living with two parents 69 82
Living with a lone mother 20 14
Living with a lone father 6 3
Living with a grandparent (no parent present) 2 0.4
Living with another relative 2 0.5
Living with non-relatives 0.1 0.2
Source: Statistics Canada, Census of Population, 2006.
Inuit children in the Inuvialuit region and Nunavik more likely to live with a lone parent
Inuit children aged 14 and under in two regions, the Inuvialuit region and Nunavik, were most likely to live with a lone parent in 2006.
In the Inuvialuit region, 26% of children in this age group lived with a female lone parent, followed by 24% of children in Nunavik. In Nunavut, 18% lived with a female lone parent, as did 15% of children in Nunatsiavut.
About 7% of children in Nunavik lived with a male lone parent, as did about 5% of children in the other three regions.
One in every four Inuit children (24%) living in a census metropolitan area lived with a female lone parent, compared with 15% of non-Aboriginal children. Inuit children in Canada's census metropolitan areas were four times more likely to live with a male lone parent than were non-Aboriginal children—12% compared with 3%.

Aboriginal Peoples in Canada in 2006: Inuit, Métis and First Nations, 2006 Census
Statistics Canada – Catalogue no. 97-558 28
Language: Inuktitut remains strong, but its use has declined
There are five primary distinct Inuit language dialects spoken throughout Canada. These dialects are: Inuvialuktun, spoken in the Inuvialuit region in the Northwest Territories; Inuinnaqtun (primarily in some communities in western Nunavut); Inuttitut (Eastern Nunavut); Inuttitut (Nunavik); and Inuttut (Nunatsiavut). While some of these dialects have many speakers, others have very few. In this report, these dialects are collectively known as Inuktitut.
Inuktitut is one of only three Aboriginal languages in Canada spoken by a large enough population base that long-term survival is likely.21 While the language remains strong overall, knowledge and use are declining. In some communities and regions, there are few speakers.
In 2006, just over 32,200 Inuit, or 64% of the total, reported Inuktitut as their mother tongue, down from 68% in 1996. (Mother tongue refers to the first language learned at home in childhood and still understood by the individual at the time of the census.)
Also on the decline is the proportion of Inuit who speak Inuktitut at home, the best place to pass on the language to younger generations. In 2006, about 25,500 Inuit, 50% of the total, reported Inuktitut as their home language, down from 58% in 1996. (Home language refers to the language spoken most often at home by the individual at the time of the census.)
A higher percentage of Inuit (69%) reported that they spoke Inuktitut well enough to carry on a conversation, although this, too, was a decline from 72% in 1996.
Inuktitut was spoken equally by Inuit in all age groups. About seven in 10 young, middle-aged and older Inuit could converse in Inuktitut.
Some Inuit learning Inuktitut as a second language
The census found evidence of Inuktitut revitalization, as some Inuit appear to be learning it as a second language. For example, 11,100 Inuit youth aged 14 and under, 63% of the total, reported an Inuktitut mother tongue. However, 69%, or 12,200, said they could speak it well enough to hold a conversation.
Inuit in urban areas were much less likely than those in the North to speak Inuktitut. In 2006, only 15% of Inuit in urban centres could converse in Inuktitut, compared with 84% in Inuit Nunaat.
Most of these were older Inuit. Among Inuit aged 14 and under in urban centres, only 12% could carry on a conversation in Inuktitut, compared with 23% of Inuit seniors aged 65 and over.
Inuktitut language strongest in Nunavik and Nunavut
The national picture hides many regional differences in the strength and use of Inuktitut. While the language is strong in Nunavut, and especially Nunavik, this was not the case in the Inuvialuit region and in Nunatsiavut.
The Inuktitut language was strongest in the region of Nunavik, as virtually all Inuit (99%) in this region could speak the language well enough to have a conversation, the same percentage as in 1996.
21. Norris, M.J. 2007. 'Aboriginal languages in Canada: Emerging trends and perspectives on second language acquisition' Canadian Social Trends, no. 83, Statistics Canada, Catalogue no. 11-008.

Aboriginal Peoples in Canada in 2006: Inuit, Métis and First Nations, 2006 Census
Statistics Canada – Catalogue no. 97-558 29
The vast majority (91%) of Inuit in Nunavut could hold a conversation in Inuktitut, but this was down from 94% in 1996. In the far western and far eastern Inuit regions, the situation was very different.
In both 1996 and 2006, in Nunatsiavut, just over one-quarter (27%) of Inuit could hold a conversation in Inuktitut. In the Inuvialuit region, 20% could do so in 2006, down from 23% in 1996.
Inuktitut being learned as a second language in all regions
There is evidence that Inuktitut is being learned as a second language. In Nunavut, 83% reported an Inuktitut mother tongue, while 91% reported they could converse in the language. In Nunatsiavut, 22% of Inuit had Inuktitut as their mother tongue, compared with 27% who said they knew it well enough to have a conversation. In the Inuvialuit region, 14% reported Inuktitut as their mother tongue, while 20% said they were able to hold a conversation in it.
Data from the 2001 Aboriginal Peoples Survey showed that the large majority of Inuit adults in each region stated that it was very or somewhat important for them to keep, learn or relearn Inuktitut. Nine in every 10 Inuit parents stated it was very or somewhat important for their children to speak and understand Inuktitut.22
Table 12 Percentage of Inuit population who reported Inuktitut as mother tongue and as home language, and knowledge of Inuktitut, Canada and regions, 1996 and 2006
Inuktitut as mother tongue1
Inuktitut as home language2
Knowledge3 of Inuktitut
1996 2006 1996 2006 1996 2006 Regions percentage
Canada 68 64 58 50 72 69
Total - Inuit Nunaat 79 78 69 63 84 84
Nunatsiavut 20 22 9 7 27 27
Nunavik 98 97 96 94 99 99
Nunavut 88 83 76 64 94 91
Inuvialuit region 20 14 4 3 23 20
Total - Outside Inuit Nunaat 13 14 4 4 16 15
Rural 9 13 1 2 11 15
Total urban 15 14 5 4 17 15
Census metropolitan area4 17 17 8 7 20 19
Urban non-census metropolitan area 13 11 3 2 16 11 Notes: 1. 'Mother tongue' refers to the first language learned at home in childhood and still understood. 2. 'Home language' refers to the language spoken most often at home. 3. 'Knowledge' refers to languages in which the respondent can conduct a conversation. 4. A CMA, or census metropolitan area, has a total population of at least 100,000 of which 50,000 or more live in the
urban core. Sources: Statistics Canada, censuses of population, 1996 and 2006.
22. Statistics Canada. 2003. Aboriginal Peoples Survey 2001 – Initial Findings: Well-being of the Non-reserve Aboriginal Population. Statistics Canada, Catalogue no. 89-589-XIE; and Statistics Canada. 2004. A Portrait of Aboriginal Children Living in Non-reserve Areas: Results from the 2001 Aboriginal Peoples Survey. Statistics Canada, Catalogue no. 89-597-XIE.

Aboriginal Peoples in Canada in 2006: Inuit, Métis and First Nations, 2006 Census
Statistics Canada – Catalogue no. 97-558 30
Métis
High rates of growth over the past decade
New data from the 2006 Census show that the Métis23 population is on the rise, outpacing the growth of the other Aboriginal groups, as well as that of the non-Aboriginal population, over the past decade.
Of the 1,172,790 people who identified themselves as an Aboriginal person in the 2006 Census, 389,785 reported that they were Métis. This population has almost doubled (increasing by 91%) since 1996.
This rate of growth was more than 11 times that of the 8% in the non-Aboriginal population during the same period. In comparison, the First Nations population increased by 29% and the Inuit population, by 26%, since 1996.
Although the Métis represented just 1% of the total population of Canada, they accounted for larger shares of the population in the West. In 2006, 9% of all people in the Northwest Territories reported they were Métis, followed by 6% in Manitoba, 5% in Saskatchewan and 3% in both Alberta and the Yukon Territory.
The Métis accounted for 34% of the overall Aboriginal population in 2006, up from 26% in 1996. The growth of the Métis population is due to both demographic factors, such as high fertility rates relative to the non-Aboriginal population, and non-demographic factors, such as an increasing tendency for people to identify themselves as Métis.24
Between 1996 and 2006, there were important political and legal milestones that may have encouraged individuals to identify themselves as Métis. The Métis received significant recognition in the final report of the Royal Commission on Aboriginal Peoples (1996)25 and in recent years, the Métis have won important court cases having an impact on their hunting rights.26
23. Although single and multiple responses to the Aboriginal identity question are possible, only the population reporting a single response of 'Métis' is included.
24. Statistics Canada. 2005. Aboriginal Conditions in Census Metropolitan Areas, 1981-2001. Statistics Canada, Catalogue no. 89-613-MIE.
25. The Royal Commission on Aboriginal Peoples (RCAP). 1996. Report of the Royal Commission on Aboriginal Peoples, 5 vols. Ottawa, Government of Canada.
26. R. vs. Powley (2003), S.C.J. No. 43 (Supreme Court of Canada).

Aboriginal Peoples in Canada in 2006: Inuit, Métis and First Nations, 2006 Census
Statistics Canada – Catalogue no. 97-558 31
Table 13 Size and growth of the Métis population, Canada, provinces and territories, 1996 and 2006
Métis population
Provinces and territories Number (2006) Percentage
distribution (2006) Percentage change
from 1996 to 2006
Canada 389,785 100 91
Atlantic region 18,805 5 192
Newfoundland and Labrador 6,470 2 42
Prince Edward Island 385 0.1 250
Nova Scotia 7,680 2 831
New Brunswick 4,270 1 347
Quebec 27,980 7 80
Ontario 73,605 19 242
Manitoba 71,805 18 58
Saskatchewan 48,115 12 34
Alberta 85,500 22 73
British Columbia 59,445 15 132
Territories 4,515 1 5
Yukon Territory 805 0.2 46
Northwest Territories 3,580 0.9 -2
Nunavut 130 0 63
Sources: Statistics Canada, censuses of population, 1996 and 2006.
Nearly nine out of 10 Métis lived in the western provinces and Ontario
Nine out of 10 people, about 87%, who identified themselves as Métis lived in either the western provinces or Ontario. The census enumerated 85,500, or 22%, in Alberta; 73,605, or 19%, in Ontario; 71,805, or 18%, in Manitoba; 59,445, or 15%, in British Columbia; and 48,115, or 12%, in Saskatchewan.
It also counted 27,980 Métis in Quebec, representing 7% of the total Métis population. In the remaining provinces and territories, the number of Métis was small. An estimated 18,805, or 5% of the Métis, lived in the Atlantic provinces. This 5% consists of 7,680 Métis in Nova Scotia, 6,470 in Newfoundland and Labrador; 4,270 in New Brunswick, and 385 Métis in Prince Edward Island.
Only 1% of the Métis lived in the territories (4,515). This includes the Northwest Territories (3,580), the Yukon Territory (805) and Nunavut (130).
About four-fifths (80%) of the increase in the number of Métis over the last decade were accounted for by the four provinces with large Métis populations: Alberta, Ontario, Manitoba and British Columbia.
Seven out of 10 Métis lived in urban areas
Métis are urban people. In 2006, nearly seven out of 10 Métis (69%) lived in urban areas, up slightly from 67% in 1996. (Urban areas include large cities, or census metropolitan areas, and smaller urban centres.)

Aboriginal Peoples in Canada in 2006: Inuit, Métis and First Nations, 2006 Census
Statistics Canada – Catalogue no. 97-558 32
In 2006, urban Métis were twice as likely as urban non-Aboriginal people to live in smaller urban centres. An estimated 41% of urban Métis lived in cities with a population of less than 100,000, compared with 20% of their non-Aboriginal counterparts.
The remaining 59% of urban Métis lived in census metropolitan areas. These percentages have changed very little since 1996.
Winnipeg home to largest number of urban Métis
The census enumerated 40,980 Métis living in Winnipeg in 2006, the largest Métis population of all census metropolitan areas. They accounted for 6% of Winnipeg's population.
Other census metropolitan areas with large Métis populations were Edmonton (27,740), Vancouver (15,075), Calgary (14,770) and Saskatoon (9,610). The Métis accounted for 4% of Saskatoon's population, 3% of Edmonton's and 1% of those of both Calgary and Vancouver.
The Métis make up a considerable share of the population in several smaller urban centres in Ontario and the West. In 2006, 17% of the population living in Prince Albert, Saskatchewan, were Métis, as were 7% of the population of North Battleford and Lloydminster, both in Saskatchewan. They accounted for about 10% of the population of Portage la Prairie and Thompson, both in Manitoba.
An estimated 9% of people living in Midland, Ontario, and 8%, in Kenora, Ontario, were Métis, as were 8% in Dawson Creek and 5% in Prince George, both in British Columbia.
The Métis also made up about 5% of the population in each of the Alberta communities of Grande Prairie and Wood Buffalo, the Alberta part of Lloydminster (3%) and Cold Lake (6%). In the Northwest Territories, 7% of the population of Yellowknife was Métis.
Figure 4 Percentage of Métis in the population of selected cities, 2006
Source: Statistics Canada, Census of Population, 2006.

Aboriginal Peoples in Canada in 2006: Inuit, Métis and First Nations, 2006 Census
Statistics Canada – Catalogue no. 97-558 33
Métis population still young but has aged
In all parts of the country, the Métis population was younger than the non-Aboriginal population. In 2006, the median age of the Métis was 30 years, 10 years younger than non-Aboriginal people. (Median age is the point where exactly one-half of the population is older, and the other half is younger.)
The Métis of Saskatchewan were youngest, where their median age was 26 years. The median age was also relatively low in Alberta (27), Manitoba (28) and the Northwest Territories (29). In the Atlantic provinces, the median age of the Métis varied widely from 23 years in Prince Edward Island (the youngest) to 40 years in New Brunswick (the oldest). Outside the Atlantic provinces, the Métis in Quebec had the highest median age, 37 years, followed by Ontario (33).
In 2006, 25% of the Métis population was aged 14 and under, well above the proportion of 17% in the non-Aboriginal population. The proportion was highest in Saskatchewan, where children made up 29% of the Métis population. This is two percentage points higher than the 27% observed in both Manitoba and Alberta.
Although the Métis population is young, it has aged over the past decade. For example, in 2006, 7% of the population was aged 4 and under, down from 11% in 1996.
Seniors still represent a very small proportion of the Métis population. In 2006, 5% of Métis people were aged 65 and over, compared with 13% of the non-Aboriginal population. Seniors made up the largest share of the Métis population in Quebec, about 8%.
In 2006, 51% of all Métis seniors were women, a slightly lower proportion than the 55% senior women represented in the non-Aboriginal population.
Métis children twice as likely to live with a lone parent
In 2006, most Métis children aged 14 and under (65%) lived with two parents, while 31% lived with a lone parent. A very small proportion, 2%, lived with a grandparent (without a parent present in the home), and 2% lived with another relative. Less than 1% lived with a non-relative.
The likelihood of living with a lone parent was higher for Métis than for non-Aboriginal children but lower than for First Nations children. In 2006, 27% lived with a single-parent mother, similar to the 28% observed in 2001 and double the figure for non-Aboriginal children (14% in both 2001 and 2006).
Only 4% of Métis children lived with a single-parent father, similar to the proportion of 3% among the non-Aboriginal population.

Aboriginal Peoples in Canada in 2006: Inuit, Métis and First Nations, 2006 Census
Statistics Canada – Catalogue no. 97-558 34
Table 14 Living arrangements of Métis and non-Aboriginal children aged 14 years and under, Canada, 2006
Métis population Non-Aboriginal population Living arrangements of children percentage
Total - Children aged 14 years and under 100 100
Total living with at least one parent 96 99
Living with two parents 65 82
Living with a lone mother 27 14
Living with a lone father 4 3
Living with a grandparent (no parent present) 2 0.4
Living with another relative 2 0.5
Living with non-relatives 0.2 0.2
Source: Statistics Canada, Census of Population, 2006.
Métis children aged 14 years and under were most likely to live with a lone parent in Saskatchewan, 36% of whom did so, and in Manitoba, where 35% did so. However, the proportions were lower among Métis in the Atlantic provinces (26%), in Ontario (27%) and in the territories (27%).
In several cities where the Métis made up a large share of the population, approximately four out of 10 children lived in lone-parent families. These included Winnipeg (40%) and Portage la Prairie (47%), Manitoba; Regina (41%), Saskatchewan; Edmonton (39%) and Cold Lake (43%), Alberta; and Dawson Creek (43%), British Columbia. In these urban centres, Métis children were twice as likely to live with a lone parent as their non-Aboriginal counterparts.
Crowding and need for major repairs more common for Métis living in rural areas
Overall, in 2006, 3% of Métis lived in crowded dwellings, down from 7% in 1996. In comparison, the figure was 3% among non-Aboriginal people. (Crowding is defined as more than one person per room). A larger share of Métis lived in homes in need of major repairs. In 2006, 14% of Métis lived in homes needing major repairs, down slightly from 17% in 1996. Nonetheless, the Métis were still about twice as likely as non-Aboriginal people to live in a crowded home or to live in a home in need of major repairs. (The need for major repairs was in the judgement of respondents.)
Health experts maintain that inadequate housing can be associated with a host of health problems. For example, crowded living conditions can lead to the transmission of infectious diseases such as tuberculosis and hepatitis A, and can also increase risk for injuries, mental health problems, family tensions and violence.27
Despite improvements over the past decade, crowding was noticeably higher among Métis people in rural Saskatchewan and Alberta. In 2006, 11% of the Métis in rural Saskatchewan lived in crowded houses, down from 21% in 1996. An estimated 8% of Métis in rural Alberta lived in crowded dwellings, also about half the figure 10 years earlier (15%).
27. Statistics Canada. 2003. Aboriginal Peoples Survey 2001 – Initial Findings: Well-being of the Non-reserve Aboriginal Population. Statistics Canada, Catalogue no. 89-589-XIE; and Health Canada. 1999. A Second Diagnostic on the Health of First Nations and Inuit People in Canada. Health Canada.

Aboriginal Peoples in Canada in 2006: Inuit, Métis and First Nations, 2006 Census
Statistics Canada – Catalogue no. 97-558 35
The past decade also saw a large reduction in crowding for Métis living in Manitoba and the territories. In Manitoba, the percentage of rural Métis people living in crowded homes fell to 4% in 2006, from 11% in 1996. In the territories, 5% of rural Métis lived in a dwelling with more than one person per room, down from 13% in 1996. Similarly, the proportion for urban Métis in the territories fell to 2%, from 10%.
In 2006, Métis who lived in rural areas of the Prairie provinces were most likely to be living in housing requiring major repairs. An estimated 27% of rural Métis in Saskatchewan, and 19% in both Manitoba and Alberta, lived in dwellings in need of major repairs.
In rural areas of Manitoba and Alberta, the proportion of Métis living in homes in need of major repairs has declined. The figure fell from 27% to 19% in Alberta between 1996 and 2006, while it decreased from 26% to 19% in Manitoba for the same period.
In contrast, even after a decade, the situation in Saskatchewan was unchanged. More than one in four (27%) Métis in rural Saskatchewan and one in 10 (13%) in urban centres lived in housing in need of major repairs in both 1996 and 2006. The rural Métis were more than twice as likely to live in homes needing major repairs, compared with the non-Aboriginal rural population in 2006 (12%).
Table 15 Percentage of Métis and non-Aboriginal populations living in crowded dwellings, urban and rural regions of Canada, provinces and territories, 1996 and 2006
Métis population Non-Aboriginal population 1996 2006 1996 2006
Regions Percentage living in crowded dwellings1 Canada 7 3 3 3 Urban 5 3 3 3 Rural 11 5 2 1 Atlantic region 4 2 1 1 Urban 3 2 1 1 Rural 4 2 2 1 Quebec 2 2 2 2 Urban 1 2 2 2 Rural 2 3 1 1 Ontario 2 1 4 4 Urban 2 1 5 4 Rural 1 2 2 1 Manitoba 8 4 3 2 Urban 6 4 3 2 Rural 11 4 2 2 Saskatchewan 11 6 2 1 Urban 5 3 1 1 Rural 21 11 2 1 Alberta 9 5 3 2 Urban 6 3 3 2 Rural 15 8 3 3 British Columbia 4 2 4 4 Urban 5 2 4 4 Rural 3 3 3 2 Territories 11 3 5 3 Urban 10 2 4 3 Rural 13 5 6 4
Note: 1. 'Crowding' is defined as more than one person per room. Not counted as rooms are bathrooms, halls, vestibules and
rooms used solely for business purposes. Sources: Statistics Canada, censuses of population, 1996 and 2006.

Aboriginal Peoples in Canada in 2006: Inuit, Métis and First Nations, 2006 Census
Statistics Canada – Catalogue no. 97-558 36
Table 16 Percentage of Métis and non-Aboriginal populations living in dwellings in need of major repairs, urban and rural regions of Canada, provinces and territories, 1996 and 2006
Métis population Non-Aboriginal population 1996 2006 1996 2006
Regions Percentage living in dwellings in need of major repairs1
Canada 17 14 8 7 Urban 13 12 7 6 Rural 24 18 11 9 Atlantic region 14 15 11 9 Urban 10 15 9 8 Rural 17 16 13 10 Quebec 17 15 8 8 Urban 14 14 7 7 Rural 22 18 12 9 Ontario 18 11 8 6 Urban 17 10 7 6 Rural 19 12 10 8 Manitoba 18 17 10 8 Urban 13 15 9 8 Rural 26 19 12 10 Saskatchewan 19 18 8 9 Urban 13 13 7 7 Rural 27 27 11 12 Alberta 16 13 7 6 Urban 12 10 6 5 Rural 27 19 11 9 British Columbia 14 12 7 7 Urban 13 12 7 6 Rural 17 13 10 9 Territories 17 21 12 12 Urban 14 15 11 9 Rural 19 30 16 17
Note: 1. Dwellings in need of major repairs are those that, in the judgement of the respondent, require major repairs to such
things as defective plumbing or electrical wiring, and/or structural repairs to walls, floors or ceilings, etc. Sources: Statistics Canada, censuses of population, 1996 and 2006.
Métis more likely than non-Aboriginal people to move within the same census subdivision
Nearly eight out of 10 Métis (79%) lived at the same address in 2006 as they did one year before the census. This compares with 86% of the non-Aboriginal population. The difference is largely accounted for by the relatively large number of Métis who changed addresses within the same community. Métis were more likely than non-Aboriginal people to have moved to a new home within the same census subdivision;28 13% of Métis did so compared with 8% of non-Aboriginal people.
28. A census subdivision (CSD) is an area that is a municipality or an area that is deemed to be equivalent to a municipality for statistical reporting purposes (e.g., an Indian reserve or an unorganized territory). Municipal status is defined by laws in effect in each province and territory in Canada. A CSD is also referred to as a community in this report.

Aboriginal Peoples in Canada in 2006: Inuit, Métis and First Nations, 2006 Census
Statistics Canada – Catalogue no. 97-558 37
Older Métis more likely to speak an Aboriginal language
An estimated 4% of Métis spoke an Aboriginal language in 2006, compared with 5% in 2001. The ability to converse in an Aboriginal language was more common among rural Métis than urban Métis (6% versus 2%). Though few Métis speak an Aboriginal language, according to the 2001 Aboriginal Peoples Survey, about half reported that keeping, learning or relearning their Aboriginal language was very or somewhat important to them.29
Older Métis were more likely to speak an Aboriginal language. An estimated 12% of Métis aged 75 years and over were able to converse in an Aboriginal language, compared with 9% of those aged 65 to 74, and 6% of people aged 45 to 64. Less than 3% of Métis aged 44 and under spoke an Aboriginal language.
The most commonly spoken Aboriginal language among Métis is Cree. In 2006, 9,360 Métis could carry on a conversation in Cree, an Algonquian language. This compares with 1,620 who spoke Dene, an Athapaskan language, 1,345 who spoke Ojibway, another Algonquian language and fewer than 1,000 who spoke other Algonquian languages, including Michif. Michif is the traditional language of the Métis which evolved from the intermingling of Cree and French languages.
Figure 5 Percentage of the Métis population with knowledge1 of an Aboriginal language, by age groups, Canada, 2006
Note: 1. 'Knowledge' refers to languages in which the respondent can conduct a conversation. Source: Statistics Canada, Census of Population, 2006.
29. Statistics Canada. 2003. Aboriginal Peoples Survey 2001 – Initial Findings: Well-being of the Non-reserve Aboriginal Population. Statistics Canada, Catalogue no. 89-589-XIE.

Aboriginal Peoples in Canada in 2006: Inuit, Métis and First Nations, 2006 Census
Statistics Canada – Catalogue no. 97-558 38
First Nations people
Large increase in the First Nations population
New data from the 2006 Census show that the North American Indian population has grown at a fast rate during the past decade.
An estimated 698,025 people identified themselves as North American Indian.30 They are referred to as 'First Nations people' for the purposes of this report. They comprised 60% of the 1,172,790 persons who identified themselves as an Aboriginal person in the census, and 2.2% of the total population of Canada.
The First Nations population increased 29% between 1996 and 2006,31 3.5 times the growth rate of 8% for the non-Aboriginal population.
There are 615 First Nations and 10 distinct First Nations language families in Canada. Some First Nations people have registered Indian status under the Indian Act and others do not (see text box on the Indian Act and Bill C-31).
The majority of First Nations people are Status Indians, meaning they are registered under the Indian Act. The census enumerated 564,870 people who reported they were Registered Indians, 81% of the total First Nations population. An estimated 133,155 First Nations people were not registered under the Indian Act.
Between 1996 and 2006, the Non-Registered population of First Nations people increased 53%, more than twice the growth rate (24%) of the registered population. This growth may be in part related to provisions of the Indian Act governing the transmission of registered status to children.
30. Respondents self-identified as 'North American Indian;' however, the term 'First Nations people' is used throughout this report. Although both single and multiple responses to the Aboriginal identity question are possible, only the population reporting a single response of 'North American Indian' is included.
31. Data showing changes in percentages and proportions between 2006 and past census years have been adjusted to account for incompletely enumerated reserves.

Aboriginal Peoples in Canada in 2006: Inuit, Métis and First Nations, 2006 Census
Statistics Canada – Catalogue no. 97-558 39
Table 17 Size and growth of the First Nations population, Canada, provinces and territories, 1996 to 2006
Provinces and territories Number (2006) Percentage
distribution (2006) Percentage change from
1996 to 20061
Canada 698,025 100 29
Newfoundland and Labrador 7,765 1 78
Prince Edward Island 1,230 0.2 35
Nova Scotia 15,240 2 40
New Brunswick 12,385 2 35
Quebec 65,090 9 47
Ontario 158,395 23 35
Manitoba 100,645 14 24
Saskatchewan 91,400 13 25
Alberta 97,275 14 32
British Columbia 129,580 19 18
Yukon Territory 6,275 1 18
Northwest Territories 12,640 2 15
Nunavut 100 0.0 11
Note: 1. Data have been adjusted to account for incompletely enumerated reserves in 1996 and 2006. Sources: Statistics Canada, censuses of population, 1996 and 2006.
The Indian Act and Bill C-31
The Indian Act sets out certain federal government obligations and regulates the management of Indian reserve lands, Indian moneys and other resources.
Status Indians are people who are entitled to have their names included on the Indian Register, an official list maintained by the federal government. Certain criteria determine who can be registered as a Status Indian. Only Status Indians are recognized as Indians under the Indian Act, which defines an Indian as 'a person who, pursuant to this Act, is registered as an Indian or is entitled to be registered as an Indian.' Status Indians are entitled to certain rights and benefits under the law.32
Prior to 1985, under certain provisions of the Indian Act, Registered Indian women who married men who were not Registered Indians automatically lost their status and as a result, their band membership. This meant that these women could no longer pass their status on to their children. The opposite was true for Registered Indian men, as the Indian Act conferred status to their non-registered spouse.
The 1985 Act to Amend the Indian Act, also known as Bill C-31, eliminated certain discriminatory provisions of the Indian Act, including the section that resulted in Registered Indian women losing their Indian status when they married non-status men. Bill C-31 enabled people affected by the discriminatory provisions of the old Indian Act to apply to have their Indian status restored.
32. Source: 'An Evolving Terminology Relating to Aboriginal Peoples in Canada' produced by the Communications Branch of Indian and Northern Affairs Canada, October 2002.

Aboriginal Peoples in Canada in 2006: Inuit, Métis and First Nations, 2006 Census
Statistics Canada – Catalogue no. 97-558 40
Bill C-31 introduced new inheritance rules regarding the passing of registered Indian status from parents to children. Both parents now must have registered Indian status to pass Indian status on to their children. An exception occurs when at least one parent has been registered under section 6(1) of the legislation. In this case, if one parent is registered under 6(1) and the other parent is not registered, children remain eligible for registration under section 6(2). However, a parent registered under 6(2) can not pass registered Indian status to a child unless the other parent is also a status Indian.
For more information, see the Indian and Northern Affairs Canada website at: http://www.ainc-inac.gc.ca/pr/pub/wf/index_e.html.
Majority of First Nations people live in Ontario and western provinces
Ontario and the western provinces combined accounted for an estimated 577,300 First Nations people, or four-fifths (83%) of this group's total population.33
About 158,395 First Nations people (23%) lived in Ontario; 129,580 (19%) lived in British Columbia; 100,645 (14%), in Manitoba; 97,275 (14%), in Alberta; and 91,400 (13%), in Saskatchewan.
Despite the large populations in Ontario, Alberta and British Columbia, First Nations people accounted for only 3% or less of the respective provincial populations. In contrast, First Nations people represented three out of every 10 persons living in the Northwest Territories, two in 10 in the Yukon Territory and about one in 10 in both Saskatchewan and Manitoba.
Figure 6 Percentage of First Nations people in the population, Canada, provinces and territories, 2006
Source: Statistics Canada, Census of Population, 2006.
33. It should be noted that 17 of the 22 incompletely enumerated Indian reserves in 2006 were located in Ontario and Quebec. Of the remainder, three were in Alberta, one was in Saskatchewan and one in British Columbia.

Aboriginal Peoples in Canada in 2006: Inuit, Métis and First Nations, 2006 Census
Statistics Canada – Catalogue no. 97-558 41
Number of First Nations recognized by Indian and Northern Affairs Canada (INAC)
In 2006, Indian and Northern Affairs Canada (INAC) recognized 615 First Nations communities in Canada. British Columbia was home to 198 First Nations, about one-third of all First Nations, while there were 126 in Ontario. Together, these two provinces represented just over half (53%) of all the First Nations communities in Canada.
Another 39% were found in five jurisdictions: Saskatchewan, where there were 70, Manitoba (63), Alberta (44), Quebec (39) and the Northwest Territories (26). There were fewer than 20 First Nations in each of the remaining provinces and in the Yukon Territory. There were none in Nunavut.
Fewer First Nations people live on reserve than off reserve
A smaller proportion of First Nations people lived on reserve than off reserve. In 2006, an estimated 40% lived on reserve, while the remaining 60% lived off reserve. The off-reserve proportion was up slightly from 58% in 1996. The vast majority of the First Nations people living on reserve in 2006, 98%, were Status Indians.
Figure 7 Percentage of First Nations people living on and off reserve, Canada, 1996 and 20061
Note: 1. Data have been adjusted to account for incompletely enumerated reserves in 1996 and 2006. Sources: Statistics Canada, censuses of population, 1996 and 2006.
Although men and women were equally likely to be registered under the Indian Act, First Nations women with registered status were somewhat more likely to live off reserve. In 2006, 50% of Status First Nations women lived off reserve, compared with 45% of their male counterparts.
Among off-reserve First Nations people, 68% were Status Indians, while the remaining 32% were non-Status Indians.

Aboriginal Peoples in Canada in 2006: Inuit, Métis and First Nations, 2006 Census
Statistics Canada – Catalogue no. 97-558 42
In Ontario, the province with the largest number of First Nations people, 70% lived off reserve, followed by British Columbia (62%) and Alberta (59%). The figures were closer to half in Saskatchewan (48%) and Manitoba (45%).
About half of the First Nations population also lived off reserve in Quebec (49%), New Brunswick (44%) and Nova Scotia (48%), while the figure was about eight in ten in Newfoundland and Labrador (82%) and close to seven in 10 in Prince Edward Island (68%).
Off-reserve population most likely to live in census metropolitan areas
Censuses in both 1996 and 2006 found that about three out of every four people (76%) in the off-reserve First Nations population lived in urban areas. In contrast, 81% of non-Aboriginal people were urban dwellers in 2006, up slightly from 78% a decade earlier. (Urban areas include large cities, or census metropolitan areas, and smaller urban centres.)
In 2006, nearly half (47%) of off-reserve First Nations people lived in census metropolitan areas, while 31% lived in small urban centres and 21%, in rural areas.
An estimated 149,350 people, or 21% of the First Nations population, lived in 10 of the nation's 33 census metropolitan areas in 2006. Winnipeg counted 25,900, the largest number, followed by Vancouver (23,515), Edmonton (22,440) and Toronto (17,275). Other census metropolitan areas with a large First Nations population were Saskatoon (11,510), Calgary (10,875), Ottawa - Gatineau (10,790), Montréal (10,130), Regina (9,495) and Thunder Bay (7,420).
However, First Nations people did not make up large shares of the population in these urban centres. For example, they accounted for 4% of Winnipeg's population, 2% of Edmonton's, and 1% of the population in Vancouver, Calgary and Ottawa - Gatineau.
Figure 8 Top 10 census metropolitan areas1 with the largest number of First Nations people, 2006
Note: 1. A census metropolitan area (CMA) has a total population of at least 100,000 of which 50,000 or more live in the urban
core. Source: Statistics Canada, Census of Population, 2006.

Aboriginal Peoples in Canada in 2006: Inuit, Métis and First Nations, 2006 Census
Statistics Canada – Catalogue no. 97-558 43
On the other hand, First Nations people made up a considerable share of the population in several smaller urban areas in the West. They represented 32% of the population in Prince Rupert, British Columbia; 24% in Thompson, Manitoba; 17% in Prince Albert, Saskatchewan; and 16% in Terrace, British Columbia. They also accounted for 21% of the population in La Tuque, Quebec.
Table 18 Urban centres where First Nations people accounted for at least 10% of the population, 2006
Urban centres Number of
First Nations people Percentage of First Nations
people in the city's population
Prince Rupert, British Columbia 4,195 32
Thompson, Manitoba 3,300 24
La Tuque, Quebec 3,200 21
Prince Albert, Saskatchewan 6,715 17
Terrace, British Columbia 2,900 16
Whitehorse, Yukon Territory 3,085 14
North Battleford, Saskatchewan 2,250 13
Portage la Prairie, Manitoba 2,375 12
Williams Lake, British Columbia 2,155 12
Yellowknife, Northwest Territories 1,990 11
Sept-Îles, Quebec 2,905 11
Source: Statistics Canada, Census of Population, 2006.
First Nations people more likely to move than non-Aboriginal population
Eight out of 10 First Nations people (81%) lived at the same address in 2006 as they did one year before the census. This compares with 86% of the non-Aboriginal population. The First Nations population is slightly more likely than non-Aboriginal people to have either moved within the same census subdivision34 (11% versus 8%) or to have relocated to their current address from another community (8% versus 5%).
Although some First Nations people may move back and forth to the reserve, census data on net migration are not included in this report.
First Nations population youngest in the Prairie provinces
First Nations people are younger than the non-Aboriginal population. The median age of the First Nations population was 25 years, 15 years below the median age of 40 years for non-Aboriginal people. (The median age is the point where exactly half the population is older, and half is younger.) This may be related to higher fertility rates and lower life expectancy among First Nations people.35
34. A census subdivision (CSD) is an area that is a municipality or an area that is deemed to be equivalent to a municipality for statistical reporting purposes (e.g., an Indian reserve or an unorganized territory). Municipal status is defined by laws in effect in each province and territory in Canada. A CSD is also referred to as a community in this report.
35. Statistics Canada. 2005. Projections of the Aboriginal Populations, Canada, Provinces and Territories. Statistics Canada, Catalogue no. 91-547-XIE.

Aboriginal Peoples in Canada in 2006: Inuit, Métis and First Nations, 2006 Census
Statistics Canada – Catalogue no. 97-558 44
The Prairie provinces were home to young First Nations populations. The median age of First Nations people in Saskatchewan was 20 years, compared with 21 in Manitoba and 23 in Alberta. The median age in Ontario was 28 years, and in Quebec, 30 years.
In the Atlantic provinces, the youngest First Nations population lived in Prince Edward Island, where the median age was 23 years. In Nova Scotia, the median age was 25 years, and, in New Brunswick, 27 years. The oldest First Nations population was in Newfoundland and Labrador, where the median age was 33 years.
On-reserve population has a larger share of children
Census data showed that children represented a slightly higher share of the on-reserve population. About one-third (34%) of on-reserve First Nations people were aged 14 and under, compared with 31% of their counterparts living off reserve.
The difference was particularly pronounced in Quebec, where 34% of the on-reserve First Nations population was aged 14 and under, compared with 19% off reserve. However, the opposite was true in Saskatchewan, British Columbia and the Yukon Territory, where children accounted for a smaller share of the on-reserve population. The proportions on and off reserve were the same in Manitoba (37%) and the Northwest Territories (30%).
Table 19 Age distribution of First Nations populations living on and off reserve, Canada, 2006
Total On reserve Off reserve Age groups number percentage number percentage number percentage
Total - Age groups 698,025 100 300,755 100 397,265 100
0 to 14 years 224,790 32 102,425 34 122,360 31
15 to 24 years 124,835 18 55,835 19 69,000 17
25 to 54 years 272,250 39 109,680 36 162,570 41
55 to 64 years 44,175 6 18,055 6 26,120 7
65 years and over 31,975 5 14,760 5 17,210 4
Source: Statistics Canada, Census of Population, 2006.
First Nations children twice as likely to live with a lone parent
The vast majority of First Nations children lived with a member of their family; less than 1% lived with someone who was not related to them. Just over one-half (54%) of First Nations children lived with two parents, compared with 82% of their non-Aboriginal counterparts. Most of this difference was due to the greater likelihood of First Nations children living with a lone parent.
While most First Nations children lived with relatives, they were twice as likely to live in a lone-parent family. Just under one-third (31%) of First Nations children aged 14 and under lived with a lone mother, more than twice the proportion of 14% among non-Aboriginal children. Similarly, 6% of First Nations children lived with a lone father, compared with only 3% of their non-Aboriginal counterparts.
Just over one-quarter of on-reserve children (26%) lived with a lone mother. They were less likely to do so than their off-reserve counterparts, 35% of whom lived with a lone mother.

Aboriginal Peoples in Canada in 2006: Inuit, Métis and First Nations, 2006 Census
Statistics Canada – Catalogue no. 97-558 45
A considerable share also lived with relatives other than a parent. An estimated 3% of First Nations children lived with a grandparent (with no parent present) and 5% lived with another relative. These were not common living arrangements among non-Aboriginal children.
Table 20 Living arrangements of First Nations and non-Aboriginal children 14 years of age and under, Canada, 2006
First Nations population Non-Aboriginal
population
Total On reserve Off reserve Total Living arrangements of children percentage
Total 100 100 100 100
Total living with at least one parent 92 92 91 99
Living with two parents 54 59 50 82
Living with a lone mother 31 26 35 14
Living with a lone father 6 7 6 3
Living with a grandparent (no parent present) 3 4 3 0.4
Living with another relative 5 3 6 0.5
Living with non-relatives 0.4 0.4 0.4 0.2
Source: Statistics Canada, Census of Population, 2006.
Reduction in crowding over past decade
First Nations people were five times more likely than non-Aboriginal people to live in crowded homes. The census found that 15% of First Nations people in Canada lived in such a dwelling, compared with just 3% of the non-Aboriginal population. (Crowding is defined as more than one person per room.)
Health experts maintain that inadequate housing can be associated with a host of health problems. For example, crowded living conditions can lead to the transmission of infectious diseases such as tuberculosis and hepatitis A, and can also increase risk for injuries, mental health problems, family tensions and violence.36
Crowding was especially common on reserves. Just over one-quarter (26%) of on-reserve First Nations people lived in crowded conditions. In fact, a large percentage of the on-reserve population lived in homes that were very crowded. One in 10 (11%) lived in a dwelling with 1.5 people or more per room.
However, the census found some improvement in on-reserve conditions during the past decade. In 1996, one-third (33%) of the on-reserve population were living in crowded conditions. Although improvement was observed in all provinces and territories, it was more pronounced in Ontario and Quebec than in the Prairie provinces.
36. Statistics Canada. 2003. Aboriginal Peoples Survey 2001 – Initial Findings: Well-being of the Non-reserve Aboriginal Population. Statistics Canada, Catalogue no. 89-589-XIE; and Health Canada. 1999. A Second Diagnostic on the Health of First Nations and Inuit People in Canada. Health Canada.

Aboriginal Peoples in Canada in 2006: Inuit, Métis and First Nations, 2006 Census
Statistics Canada – Catalogue no. 97-558 46
Table 21 Percentage of First Nations and non-Aboriginal populations living in crowded dwellings, Canada, 1996 and 20061
Percentage living in crowded dwellings2 Population 1996 2006
Total - First Nations population 20 15
On reserve 33 26
Off reserve 10 7
Urban 8 6
Rural 17 10
Total - Non-Aboriginal population 3 3
Urban 3 3
Rural 2 1
Notes: 1. Data have been adjusted to account for incompletely enumerated reserves in 1996 and 2006. 2. 'Crowding' is defined as more than one person per room. Not counted as rooms are bathrooms, halls, vestibules and
rooms used solely for business purposes. Sources: Statistics Canada, censuses of population, 1996 and 2006.
Crowded living conditions on reserves were considerably more common in the three Prairie provinces. In Manitoba, about 37% of on-reserve First Nations people lived in a home with more than one person per room, as did 36% in Saskatchewan and 31% in Alberta. In the Northwest Territories and Quebec, the proportion was 23%; in Ontario, it was nearly one-fifth (19%).
A reduction in crowding was also observed among First Nations people living off-reserve. In 2006, 7% lived in a home with more than one person per room, down from 10% in 1996. The improvement was more pronounced in rural areas, where the figure fell to 10% in 2006, from 17% in 1996.
Among off-reserve First Nations people, 15% of those in Saskatchewan lived in a crowded home, followed by 10% in Manitoba, 9% in the Northwest Territories and 8% in Alberta. In many parts of the country, off-reserve First Nations people were far more likely to live in crowded conditions than non-Aboriginal people. For example, only 1% of non-Aboriginal people in Saskatchewan lived in crowded conditions, as did 2% in both Manitoba and Alberta.
Off-reserve First Nations and non-Aboriginal people were equally likely to live in crowded conditions in Ontario, British Columbia, Quebec, Nova Scotia and Prince Edward Island.
First Nations population four times more likely to live in homes in need of major repairs
First Nations people were four times more likely than non-Aboriginal people to live in dwellings requiring major repairs. In 2006, 28% of First Nations people lived in a home in need of major repairs, compared with just 7% of the non-Aboriginal population. (The need for major repairs was in the judgement of respondents.)
The poor condition of dwellings was especially common on reserves, where about 44% of First Nations people lived in a home requiring major repairs.
In contrast, about 17% of off-reserve First Nations people lived in dwellings requiring major repairs, which is still more than twice the proportion of 7% among non-Aboriginal people.

Aboriginal Peoples in Canada in 2006: Inuit, Métis and First Nations, 2006 Census
Statistics Canada – Catalogue no. 97-558 47
Table 22 Percentage of First Nations and non-Aboriginal populations living in dwellings in need of major repairs, Canada, 1996 and 20061
Percentage living in dwellings in need of major repairs2
Population 1996 2006
Total - First Nations population 26 28
On reserve 36 44
Off reserve 18 17
Urban 16 15
Rural 24 21
Total - Non-Aboriginal population 8 7
Urban 7 6
Rural 11 9
Notes: 1. Data have been adjusted to account for incompletely enumerated reserves in 1996 and 2006. 2. Dwellings in need of major repairs are those that, in the judgement of the respondent, require major repairs to such
things as defective plumbing or electrical wiring, and/or structural repairs to walls, floors or ceilings, etc. Sources: Statistics Canada, censuses of population, 1996 and 2006.
Furthermore, the condition of dwellings inhabited by off-reserve First Nations people varied by place of residence. In rural areas, one-fifth (21%) of off-reserve First Nations people lived in dwellings requiring major repairs, compared with 17% of their counterparts living in small cities, and 14% living in large cities.
Overall, the proportion of the on-reserve First Nations population living in dwellings in need of major repairs has increased during the past decade. In 1996, 36% of on-reserve First Nations people lived in dwellings in need of major repairs; by 2006, this had increased to 44%. On the other hand, the proportion was about the same for off-reserve First Nations people, at about 17%.
Regionally, the proportion of on-reserve First Nations people living in dwellings in need of major repairs was considerably higher in the three Prairie provinces. Just over one half (54%) of the on-reserve population in Saskatchewan lived in a dwelling in need of major repairs, as did 53% in Manitoba, and 52% in Alberta. The percentages were much lower in Ontario (41%) and British Columbia (39%).
Among off-reserve First Nations people, 22% of those in the Yukon Territory lived in a dwelling in need of major repairs, followed by 20% each in Saskatchewan and Manitoba, and 19% in the Northwest Territories.
In all four western provinces, off-reserve First Nations people were 2.5 times more likely to live in dwellings in need of major repairs than non-Aboriginal people.

Aboriginal Peoples in Canada in 2006: Inuit, Métis and First Nations, 2006 Census
Statistics Canada – Catalogue no. 97-558 48
Share of First Nations people who speak an Aboriginal language holds steady, even among younger generation
Language is often recognized as the essence of a culture. The Royal Commission on Aboriginal Peoples has stated that the revitalization of traditional languages is a key component in the creation of healthy individuals and communities.37 Language is 'not only a means of communication, but a link which connects people with their past and grounds their social, emotional and spiritual vitality.' 38 According to the 2001 Aboriginal Peoples Survey, two out of three First Nations people felt that keeping, learning or relearning their Aboriginal language was very or somewhat important.39
In both 2001 and 2006, about 29% of First Nations people who responded to the census said they could speak an Aboriginal language well enough to carry on a conversation.40 The figure was higher for First Nations people living on reserve (51%) than for those living off reserve (12%).
Only 1% of First Nations people spoke only an Aboriginal language, although this percentage rose to 5% among seniors aged 65 to 74, and 10% among those aged 75 and over. Of the on-reserve population, 18% of First Nations people aged 75 and over spoke only an Aboriginal language.
Fully one-half of First Nations seniors could converse in an Aboriginal language. About 50% of seniors aged 65 to 74 and 52% of those aged 75 and over could speak an Aboriginal language. In the on-reserve population, roughly four-fifths (83%) of First Nations seniors aged 75 and over spoke an Aboriginal language, compared with about one-quarter (24%) of their contemporaries living off reserve.
The ability to speak an ancestral language is one way of passing knowledge from one generation to another. The process of learning one's Aboriginal language may also contribute to increased self-esteem and well-being.41 In 2006, 21% of First Nations children aged 14 and under and 24% of youth aged 15 to 24 could carry on a conversation in their ancestral language, about the same shares as in 2001.
The ability to speak an Aboriginal language was again much more common among the on-reserve population. For example, 39% of children aged 14 and under living on reserve spoke an Aboriginal language, up slightly from 36% in 2001. In contrast, the proportion was 6% for First Nations children living off reserve, down slightly from 8% in 2001.
37. The Royal Commission on Aboriginal Peoples (RCAP). 1996. Report of the Royal Commission on Aboriginal Peoples, 5 vols. Ottawa, Government of Canada. p. 163.
38. Norris, M. J. 1998. 'Canada's Aboriginal Languages.' Canadian Social Trends, no. 51, Statistics Canada, Catalogue no. 11-008, p. 8.
39. Statistics Canada. 2003. Aboriginal Peoples Survey 2001 – Initial Findings: Well-being of the Non-reserve Aboriginal Population. Statistics Canada, Catalogue no. 89-589-XIE.
40. There were changes in reporting patterns and coding between 1996 and 2001 for some Aboriginal languages (Cree, Ojibway, Oji-Cree, North Slave (Hare), South Slave) and for some Indian reserves. As a result of these changes, the analysis of Aboriginal languages in this document concentrates on changes from 2001 to 2006, adjusting for incompletely enumerated reserves.
41. Canadian Heritage, 2005. 'Towards a New Beginning: A Foundation Report for a Strategy to Revitalize First Nation, Inuit and Métis Languages and Cultures.' Report to the Minister of Canadian Heritage by the Task Force on Aboriginal Languages and Cultures, June 2005. Ottawa. Catalogue No. CH4-96/2005.

Aboriginal Peoples in Canada in 2006: Inuit, Métis and First Nations, 2006 Census
Statistics Canada – Catalogue no. 97-558 49
Table 23 Percentage of First Nations people who have knowledge1 of an Aboriginal language, by age groups, Canada, 2001 and 20062
First Nations people
2001 2006
Total On reserve Off reserve Total On reserve Off reserve Age groups percentage percentage
Total all ages 30 50 14 29 51 12
0 to 14 years 21 36 8 21 39 6
15 to 24 years 25 44 10 24 43 9
25 to 44 years 33 58 17 30 56 13
45 to 64 years 45 71 26 39 67 21
65 to 74 years 56 79 33 50 79 26
75 years and over 59 83 31 52 83 24
Notes: 1. 'Knowledge' refers to languages in which the respondent can conduct a conversation. 2. Data have been adjusted to account for incompletely enumerated reserves in 2001 and 2006. Sources: Statistics Canada, censuses of population, 2001 and 2006.
Cree spoken by the largest number of First Nations people
The census recorded over 60 different Aboriginal languages spoken by First Nations people in Canada, grouped into distinct language families. These include Algonquian, Athapaskan, Siouan,42 Salish, Tsimshian, Wakashan, Iroquoian,43 Haida, Kutenai and Tlingit. The long term viability of some Algonquian languages, such as Cree and Ojibway, is considered to be more likely than other First Nation languages like Nisga'a and Haida due to a relatively large population base of speakers.44
The Aboriginal language spoken by the largest number of First Nations people is Cree. An estimated 87,285 could carry on a conversation in Cree, followed by 30,255 who could speak Ojibway, 12,435 who spoke Oji-Cree and 11,080 who spoke Montagnais-Naskapi.
In addition, an estimated 9,250 could carry on a conversation in Dene, 8,540 in Mi'kmaq, 6,285 in Siouan languages and 5,320 in Atikamekw. Around 4,760 were able to carry on a conversation in Blackfoot. Most of these languages are from the Algonquian family, except for the Siouan languages (Dakota and Sioux) and the Dene language from the Athapaskan family.
The number of First Nations people who speak their ancestral language has increased for most of the languages with large numbers of speakers. Between 2001 and 2006, the number of First Nations people who spoke Oji-Cree rose by 20%. The number of First Nations speakers increased 12% for Atikamekw, 10% for Blackfoot and Montagnais-Naskapi, and 8% for Dene. The number speaking Cree increased 7%.
The number of First Nations people who could carry on a conversation in Mi'kmaq was about the same in 2006 as in 2001.
42. When comparing the 2006 Census results to those of the 2001 Census, it appears that there is some overestimation of persons reporting Siouan languages (Dakota/Sioux) in British Columbia and, as a result, also at the Canada level. Although it affects a relatively small population, it is best to apply caution when analysing census data for Siouan languages (Dakota/Sioux) in these geographies.
43. Due to incomplete enumeration of reserves, caution should be exercised when using data for the Iroquoian languages.
44. Norris, M.J. 2007. 'Aboriginal languages in Canada: Emerging trends and perspectives on second language acquisition' Canadian Social Trends, no. 83, Statistics Canada, Catalogue no. 11-008.

Aboriginal Peoples in Canada in 2006: Inuit, Métis and First Nations, 2006 Census
Statistics Canada – Catalogue no. 97-558 50
However, there was a 2% decline in the number of First Nations people who could converse in Ojibway. Because Ojibway is spoken by such a large number of people, this translated into over 600 fewer First Nations Aboriginal language speakers between 2001 and 2006. Other languages with a decline of at least 30% included Haida (-31%), Tlingit (-30%) and Malecite (-30%).
Table 24 Aboriginal languages indicators for First Nations people, Canada, 2001 and 2006 Aboriginal mother tongue1 Knowledge2 of an Aboriginal language
Aboriginal languages 2006 Percentage change from 2001 to 20063 2006
Percentage change from 2001 to 20063
Cree 76,460 10 87,285 7
Ojibway 24,410 -2 30,255 -2
Oji-Cree 11,605 18 12,435 20
Montagnais-Naskapi 10,470 8 11,080 10
Dene 8,495 9 9,250 8
Mi'kmaq 7,685 4 8,540 0
Siouan languages (Dakota/Sioux)4 5,675 34 6,285 32
Atikamekw 5,140 11 5,320 12
Blackfoot 3,270 11 4,760 10
Salish languages, n.i.e. 1,990 6 2,800 -1
Algonquin 2,020 10 2,560 12
Dogrib 2,055 10 2,540 17
Carrier 1,800 29 2,320 18
South Slave 1,575 15 2,160 7
n.i.e.: not included elsewhere Notes: 1. 'Mother tongue' refers to the first language learned at home in childhood and still understood. 2. 'Knowledge' refers to languages in which the respondent can conduct a conversation. 3. Data have been adjusted to account for incompletely enumerated reserves in 2001 and 2006. 4. Caution should be exercised when analysing data for Siouan languages (Dakota/Sioux) due to some overestimation
in British Columbia in 2006. Sources: Statistics Canada, censuses of population, 2001 and 2006.
First Nations languages being learned as second languages
One in four First Nations people (25%) reported that they had an Aboriginal mother tongue in 2006, about the same proportion as in 2001. However, more First Nations people could speak an Aboriginal language than reported an Aboriginal language as a mother tongue. This may be attributed to First Nations people who have learned an Aboriginal language as a second language.
For example, 76,460 First Nations people reported having Cree as a mother tongue in 2006, while 87,285 reported that they could converse in Cree. This means that about 12% of all First Nations people who spoke Cree in 2006 learned it as a second language.
The share of second language speakers was as high as 30% or 40% for some of the languages with very few First Nations speakers, such as Shuswap, which had 1,585 speakers, Tsimshian (590), and Tlingit (150). It was also quite high for Blackfoot (4,760 speakers) and Athapaskan languages not included elsewhere (1,530 speakers).
Aboriginal Peoples in Canada in 2006: Inuit, Métis and First Nations, 2006 Census
Statistics Canada – Catalogue no. 97-558 51
Concepts and definitions
Aboriginal identity population
This report focuses on the Aboriginal identity population.
Aboriginal identity refers to those persons who reported identifying with at least one Aboriginal group, that is, North American Indian, Métis or Inuit, and/or those who reported being a Treaty Indian or a Registered Indian, as defined by the Indian Act of Canada, and/or those who reported they were members of an Indian band or First Nation.
The Aboriginal identity population was counted the same way in 2006, 2001 and 1996, providing comparable data for three census years. However, comparison of Aboriginal data across census years must adjust for incompletely enumerated reserves and settlements. Some Indian reserves and settlements did not participate in the census as enumeration was not permitted, or it was interrupted before completion. In 2006, there were 22 incompletely enumerated Indian reserves, compared to 30 in 2001 and 77 in 1996.
Aboriginal ancestry refers to the ethnic or cultural origin of a person's ancestors, an ancestor being usually more distant than a grandparent. In the census, if a person reports at least one Aboriginal ancestry response, the person is counted in the Aboriginal ancestry population.
In 2006, 1.7 million people reported having at least some Aboriginal ancestry, up from 1.3 million in 2001 and 1.1 million in 1996. Further data on the Aboriginal ancestry population are scheduled for release on April 2, 2008.
Area of residence
On reserve includes the following types of census subdivisions (CSDs) or communities affiliated with First Nations or Indian bands: Indian reserve (IRI), Indian settlement (S-É), Indian Government District (IGD), Terres réservées aux Cris (TC), Terres réservées aux Naskapis (TK), Nisga'a village (NVL), Nisga'a land (NL) and Teslin land (TL), as well as additional CSDs of various other types that are generally northern communities in Saskatchewan, the Northwest Territories and the Yukon Territory, which have large concentrations of Registered Indians. All other CSDs are considered to be 'off reserve.'
Urban census metropolitan area (CMA) is an area consisting of one or more neighbouring municipalities situated around a major urban core. A census metropolitan area must have a total population of at least 100,000 of which 50,000 or more live in the urban core.
Urban non-census metropolitan areas (non-CMAs) are smaller urban areas with a population of less than 100,000.
Urban areas have a population of at least 1,000 and no fewer than 400 persons per square kilometre. They include both census metropolitan areas and urban non-census metropolitan areas.
Rural areas include all territory lying outside of urban areas, excluding Indian reserves as defined above. They include remote and wilderness areas, agricultural lands, as well as small towns, villages and other populated places with a population of less than 1,000 and a density of less than 400 persons per square kilometre.

Aboriginal Peoples in Canada in 2006: Inuit, Métis and First Nations, 2006 Census
Statistics Canada – Catalogue no. 97-558 52
Mobility
Place of residence 1 year ago indicates whether the person lived in the same residence on Census Day (May 16, 2006) as he or she did one year before (May 16, 2005). People who were living at a different address may have moved within the same census subdivision or from a different census subdivision (including from outside Canada).
Housing and households
Condition of dwelling refers to whether, in the judgement of the respondent, the dwelling requires any repairs (excluding desirable remodelling or additions). Regular maintenance refers to painting, furnace cleaning, etc. Minor repairs refer to the repair of missing or loose floor tiles, bricks or shingles, defective steps, railing or siding, etc. Major repairs refer to the repair of defective plumbing or electrical wiring, structural repairs to walls, floors or ceilings, etc.
Crowding in this report is defined as more than one person per room (not counted as rooms are bathrooms, halls, vestibules and rooms used solely for business purposes).
Household type - A one-family household consists of a single family (e.g., a couple with or without children). A multiple-family household is made up of two or more families occupying the same dwelling.
Language
Mother tongue refers to the first language learned at home in childhood and still understood by the individual at the time of the census.
Knowledge of languages refers to languages in which the respondent can conduct a conversation.
Home language refers to the language spoken most often at home by the individual at the time of the census.
Notes to reader:
Note on rounding: Due to the nature of random rounding, counts may vary slightly between different census products, such as the analytical document, highlight tables, and topic-based tabulations.
To obtain a copy of other maps released, refer to the following link: http://www12.statcan.ca/english/census06/analysis/aboriginal/tables.cfm#maps.
Acknowledgements:
This report was prepared by Statistics Canada's Social and Aboriginal Statistics Division, as well as staff members of Census Operations Division and Dissemination Division.

Source: 2006 Census of Canada. Produced by the Geography Division, Statistics Canada, 2007.
NorthwestTerritories
YukonTerritory
BritishColumbia
Alberta
SaskatchewanManitoba Ontario
Quebec
Newfoundlandand Labrador
InuvialuitRegion
Nunatsiavut
Nunavik
Nunavut
GjoaHaven
TaloyoakCambridge Bay
UmingmaktokBathurst Inlet
Kugluktuk
Kugaaruk
Repulse Bay
Baker Lake
Chesterfield InletRankin Inlet
Whale CoveArviat
CoralHarbour
Grise Fiord
ResolutePond InletArcticBay
Clyde River
IgloolikHallBeach
QikiqtarjuaqPangnirtung
CapeDorsetKimmirut
Iqaluit
Sanikiluaq
Holman
SachsHarbour
Tuktoyaktuk
Aklavik InuvikPaulatuk
IvujivikSalluit
Kangiqsujuaq
AkulivikPuvirnituq
QuaqtaqKangirsuk
AupalukTasiujaq
Kuujjuaq
Kangiqsualujjuaq
Inukjuak
Umiujaq
Kuujjuarapik
NainHopedale
MakkovikPostville Rigolet
Inuit Regions
Map reflects Statistics Canada'sgeographic reference date (January 1, 2006)